Abstract
A bisphenol A production plant possesses considerable potential risks in the top of the methanol separation column, as pressurized acetone, methanol, and water are processed at an elevated temperature, especially in the event of an abnormal pressure increase due to a sudden power outage. This study assesses the potential risks in the methanol separation column through hazard and operability assessments and evaluates the damages in the case of fire and explosion accident scenarios. The study chooses three leakage scenarios: a 5-mm puncture on the methanol separation column, a 50-mm diameter fracture of a discharge pipe and a catastrophic rupture, and, simulated using Phast (Ver. 6.531), the concentration distribution of scattered methanol, thermal radiation distribution of fires, and overpressure distribution of vapor cloud explosions. Implementation of a safety-instrumented system equipped with two-out-of-three voting as a safety measure can detect overpressure at the top of the column and shut down the main control valve and the emergency shutoff valve simultaneously. By applying a safety integrity level of three, the maximal release volume of the safety relief valve can be reduced and, therefore, the design capacity of the flare stack can also be reduced. Such integration will lead to improved safety at a reduced cost.
1. Introduction
The chemical industry in Korea has adopted advanced technologies and systems for safety management. However, more than ten major industrial accidents have occurred annually due to various reasons, such as ageing of equipment, complexity of the chemical processes, and human error [1]. To prevent such accidents and to reduce the damages, elaborate process assessments to find potential risks and employ safety measures should be carried out because the potential hazards, nature of the accident, and scope of damage depend on the properties of process materials, process conditions, and the safety management even among similar chemical processes [2].
Recently, domestic chemical plants have attempted to minimize the damage of accidents by quantitative risk assessment. The Korea Occupational Safety and Health Agency (KOSHA) has already established and distributed the technical guidelines to minimize the damage at chemical plants [3]. However, most field sites have not carried out the effective safety measures because of inadequate understanding of quantitative risk assessment with the leakage scenario. In this regard, this study performs the hazard and operability assessment (HAZOP) of the methanol separation process, a highly hazardous process in the bisphenol A (BPA) plant, to evaluate the risk factors [4]. It is then followed by a quantitative analysis and accident damage prediction fault tree analysis (FTA) is used for processes with potential risks. Based on these analyses, the safety improvement execution steps shown in Figure 1 are presented to determine the necessity of the safety systems.
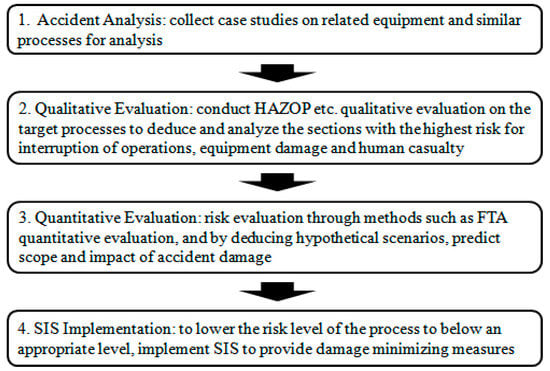
Figure 1.
Steps of safety improvements on chemical processes.
Increased reliability of the measurement control systems can lead to a reduction and prevention of major industrial accidents caused by the malfunction of the control systems and improve the safety of the chemical processes in plants [5]. An ideal control measurement system that reflects the process flow listed in Figure 1 can stabilize the process before the pressure relief system activates and prevents or reduces the amount of emission through relief systems, such as the flare stack and scrubber, diminishing the damage to the environment [6]. This research collects and analyzes cases in Korea and outside [7,8], caused by malfunctions in the measurement control systems for analysis and examination of their safety measures. By applying these safety measures to the methanol separation process, we also expect improved productivity from decreased flare stack emission volume and minimized scope of the accident damage. Ultimately, this study finds that these safety improvements will lead to increased yield and reduced costs associated with the methanol separation process.
2. Theoretical Background
2.1. Target Process
This research examines the methanol separation process as part of BPA manufacture. The manufacturing outline can be explained as follows. 4.4’-bisphenol A is one of the major ingredients for productions of epoxy resins and polycarbonates. It is prepared by condensing one part acetone and two parts phenol in liquid phase with a strong acid catalyst, such as hydrochloric acid, and the reaction mechanism is shown in Figure 2. The heat of the reaction required to manufacture BPA is 79 kJ/mol. In general, a strong acid catalyst, such as hydrochloric acid, is used when manufacturing BPA on an industrial scale. Due to the caustic nature of such a catalyst, BPA plants must have corrosion resistance against strong acids. The acidic wastewater is chemically treated by calcium carbohydrates to lower the acidity. The wastewater is then further treated biologically to remove the organic contents from what remains after phenol reacts with acetone.
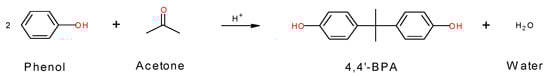
Figure 2.
The mechanism of the BPA reaction.
Figure 3 shows the flowchart of a typical BPA plant. The condensation reaction occurs continuously under the appropriate temperature and pressure. Taking into consideration the temperature and pressure, the most dangerous stream of chemicals is found in the methanol separation column overhead shown in Figure 4, where the temperature ranges from 95 °C to 100 °C and the pressure from 410 kPa (abs) to 820 kPa (abs). The main reactants are acetone, methanol, and water. The methanol separation column (D-1101) is a distillation column used to separate methanol from the supplied raw acetone. Since methanol causes degradation of the catalyst and accumulates within the process, it must be removed before the raw acetone is sent to the reactor.
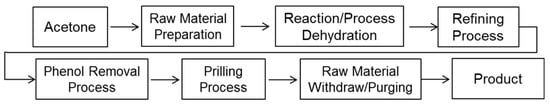
Figure 3.
Block flow diagram for the BPA process.
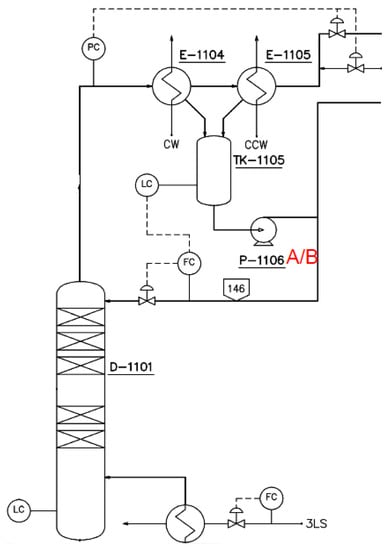
Figure 4.
The process flow diagram for the methanol separation column section.
As the impure acetone is fed to D-1101, the water vapor from the reboiler in the D-1101 column is supplied to the fed acetone to evaporate the acetone and methanol liquid mixture. The refined acetone is collected at the bottom of the column and pumped to the preheater and then to the BPA reactor. The acetone/methanol gas mixture from D-1101 evaporates and condenses to 45 °C in E-1104 and E-1105, and is stored in the reflux vessel (TK-1105) for further processing.
The liquid level of the methanol separation column and the storage tank are maintained at a constant level using a liquid level controller. The temperature of the lower part is indicated with a temperature indicator and controlled by a steam flow rate control valve. The top pressure of the column is controlled within an appropriate pressure level threshold by a pressure controller. When the pressure drops, nitrogen is automatically supplied, whereas when the operating pressure rises, vent gas is released through the gas condenser at the top of the methanol separation column. Stainless steel 316L is used to furnish the methanol separation column and peripheral equipment. Sulfur leaks from the reactor can flow back into the methanol separation column and causes corrosion. Therefore, using stainless steel 304 would work as well, but to prevent possible acetone leaks due to excess pressure operations stainless steel 316 L is used in the design. The specifications of equipment in the acetone feed section is given in Table 1. All listed tanks (item numbers starting with TK) are not shown in Figure 4 due to the large scale of the presented plant.

Table 1.
Specifications of equipment in the feed preparation section.
2.2. Risk Characteristics of the Process and Materials
The supplied raw acetone is sent to the acetone vessel and mixed with the recycled acetone. The acetone mixture is sent to D-1101 shown in Figure 4 for methanol removal and acetone refinement. Methanol must be removed before being added to the reactor. Methanol decreases the reactivity of the catalyst and accumulates within the process to decrease the production yield. Methanol also causes corrosion in the operational equipment. The reboiler connected to the bottom of D-1101 provides steam, which evaporates and distills the acetone and methanol mixture in the top part of the column. The refined acetone is released at the bottom of the column, mixed in the pipeline with excess phenol from the recycling phenol vessel, and supplied to the reactor containing a catalyst. Phenol and acetone react in the reactor to create BPA, water, and a small amount of impurities as byproducts, and the main reaction in the reactor is shown in Figure 2, where H+ serves as the cation exchange resin catalyst. The materials released from the reaction are excess phenol, unreacted acetone, and water, which are then sent to the dehydrator to remove impurities. The main chemical equipment is shown in Table 2. Reviewing the operation conditions for all processes in BPA production, the most dangerous process with the highest risk is the methanol separation process because of its highest processing temperature, pressure, and volume.
Table 2.
Specifications of equipment in reaction and dehydration section.
The phenol injection ratio by mass, compared to that of acetone, is more than about 20-fold, and the phenol is the mother liquor supplied by the recycled phenol container to the reactor and the acetone is a refined material that is supplied to the reactor from the bottom part of the methanol separation column. Excess phenol lowers the concentration of acetone in the reactor and raises the temperature, resulting in lower production of impurities from the side reactions. The condensation reaction is exothermic, and while the reaction occurs under adiabatic conditions, the mother liquor supplied to the reactor contains about 10 wt % of BPA. The BPA concentration increases from low to high in the reactor, and to prevent adduct formation in the catalyst layer, the catalyst layer temperature must be maintained higher than the adduct formation temperature. If the temperature supplied to the reactor is too low, the temperature of the catalyst layer drops and, thus, the temperature at which there is a risk for adduct formation to occur is reached. Therefore, the temperature supplied to the reactor is required to exceed 57 °C. Here, water is produced as a byproduct of BPA production and impedes the activity of the catalyst, decreasing the speed of the reaction. The design specification of acetone conversion rate (80%) cannot be met if a large quantity of water is present in the reactor supply solution, which also contributes to a risk of failing to achieve the target production yield.
Alcohol and aldehyde are included in the raw acetone that is supplied by the outside battery limit, and these materials act as poisoning agents against the metal catalyzed coking (MCC) catalyst. By dehydrogenating the activation mechanism of the thiol co-catalyst, these agents render the catalyst inactive, and this catalyst decomposition is permanent. Methanol, in particular, is highly detrimental to the catalysts. Additionally, due to its relative abundance, methanol has to be effectively processed in the methanol separation column. A mixture of raw and recovered acetone are supplied to the drum, and the methanol is concentrated and removed to the top part of the column. The processed acetone has a methanol concentration lower than 50 ppm. A small amount of isopropyl phenol is produced in the purge reactor as an impurity of the purge reaction. Isopropyl phenol also possesses the same permanent detrimental effect to the MCC catalyst, potentially shortening the life of the catalyst. If the temperature of the purge reaction rises too high, the isopropyl phenol content in the mother liquor increases. Therefore, the temperature of the reactor is set to below 200 °C to suppress isopropyl phenol formation. Additionally, the generated isopropyl phenol is released out of the system by the lower part of the phenol column.
The isopropyl phenol concentration of the mother liquor supplied to the reactor is managed to below 0.4 wt %. Examining the risk factors for the BPA manufacturing process shown above, we can assume an operating temperature of about 100 °C and pressure of 820 kPa (abs) at the top part of the methanol separation column. Among many hazardous materials present in the lower part, we define acetone, methanol, and isopropyl phenol to be the highest risk chemicals.
2.3. Confirming the Methanol Separation Column Process as the Worst-Case Scenario Using HAZOP Analysis
The methanol removal column possesses the highest safety risk in the BPA production process, not only due to the high processing temperature and pressure but also due to chemical hazard from acetone, methanol, and isopropyl phenol. Therefore, a qualitative risk assessment needs to be carried out on D-1101. The results can help to deduce the improved measures in the high-risk sections.
For the risk assessment of the D-1101 column, the process safety information of the column operation, design and fabrication specifications were reviewed. Before the quantitative risk analysis, the hazard and operability (HAZOP) analysis, which is the most widely used qualitative risk assessment, was carried out to identify the potential risks in the target process [9]. Table 3 and Table 4 show the process variables and the results of the HAZOP, respectively. Table 4 focuses on showing part of the results from the methanol separation column process. ‘F’ and ‘L’ indicate the frequency and severity, respectively, with 1 being the most frequent/severe and 4 being the least frequent/severe. The risk rank is chosen by taking the combination of these two factors into account. The abbreviated part names are found in Abbreviations.
Table 3.
Process parameters, design variables, and guide words for the methanol removal column.
Table 4.
HAZOP execution report for the methanol removal column.
2.4. Safety Measures and Protocols for the Methanol Separation Process
If the pressure exceeds the automatic shut-off level, the pressure alarm system will alert the safety instrumented system (SIS), which then sends an emergency shutdown (ESD) signal, also known as a ‘trip’ signal, to the programmable logic controller (PLC, two-out-of-three voting) that shuts down the gas supply to the column by closing both the main control valve and emergency shut-off valve simultaneously [10].
The results of risk evaluation on the methanol separation process showed that the most dangerous potential risks in the methanol separation column can rise from an interruption of power, valve closure due to a malfunction or manual valve control by the operator, and plugging of pipelines [10]. The most extreme case is a power outage. Since this problem leads to the failure of coolant fed to the vent gas condenser connected to the top part of the methanol separation column, this creates a problem that cannot adequately be taken care of by the capacity of the current flare stack design. As a reactionary measure, if coolant supply is cut off, in which case an increase of pressure in the equipment is predicted, pressure gauges with two-out-of-three voting at the top of the equipment and the function to simultaneously shut the control valve and the emergency shutdown (ESD) valve in the main feed line must be provided.
In the event of a pressure build-up above the configured threshold pressure value, the pressure gauge sends an ESD trip signal to SIS. This trip signal is transmittable to the programmable logic controller (PLC: two-out-of-three voting) making it possible to simultaneously close the control valve and the ESD valve installed in the main feed line. An interruption of power from KEPCO is the most critical issue to consider, as it directly shuts down the cooling system. While measures taken by KEPCO prioritizes restoration of commercial electrical supplies, relying entirely on KEPCO to relieve the problem is highly risky. Further, the safety systems must also be equipped to mitigate damages from natural disasters such as typhoons, flooding, earthquakes, etc. In response to these risks, emergency power generation systems can be implemented on site, but this power is mostly routed to equipment that is critical in an emergency. This includes evacuation-related equipment, such as emergency lighting and basic firefighting systems.
While a diverse array of situations can exist, the qualitative risk assessment of this research focused on the event that coolant supplied to the methanol separation column was interrupted in the case of a power outage. A few safety measures can be implemented to combat these occurrences. Two-out-of-three voting pressure gauges that can detect an increase in pressure can be installed to monitor the pressure of the separation column. Additionally, installing two-out-of-three voting under voltage relays can help detect power interruptions so that SIS can quickly respond to such events by simultaneously closing the control valve and ESD valve for the main feed line. As soon as the power goes out, SIS will receive signals from two locations: the under-voltage relay, indicating a loss of power, and the pressure monitoring system, showing an increase in pressure. Upon receiving these two signals, SIS will send an ESD trip signal to the PLC and shuts the control valve and the ESD valve for the main feed line.
2.5. Predictions of Damage Due to a Methanol Separation Column Accident
To predict the damage from the fire and explosion by the leakage and dispersion of the methanol vapor from the methanol removal column (D-1101), a commercial program, Phast (Ver. 6.531) from DNV GL (Høvik, Norway) was used. It was assumed that the accident occurred at the actual operating conditions of 3 bar gauge and 104 °C. At the atmospheric condition, the wind speed was set to 1.5 m/s, while the atmospheric stability is set to ‘F’ using Pasquill Stability Classes, with ‘A’ being extremely unstable conditions and ‘G’ being extremely stable conditions [11]. As for the worst leakage scenario and the leaking hole, a fracture of the safety valve’s discharge pipe with a 50 mm diameter and a pinhole with a 5-mm diameter were assumed in accordance with the KOSHA Code P-37 and P-42 [10,12].
2.5.1. Methanol Vapor Concentration Distribution
The leakage from the D-1101 column can cause a jet fire or flash fire in an open space and result in a vapor cloud explosion (VCE) or a boiling liquid expanding vapor explosion (BLEVE) in a closed space. Particularly when methanol leaks in an open space, it may not be easily dispersed but remain at the source of the leak to quickly reach the lower explosion limit (LEL) concentration, since it is slightly heavier than air.
Figure 5 shows the distribution of the mixture concentration with the consideration of wind direction in the cases of the 5-mm pinhole created on the removal column, the fracture of the discharge pipe with a 50-mm diameter, and the catastrophic rupture. From this figure, it is confirmed that the concentration rapidly decreases up to distances of 0.15 m and 2 m from the leakage source in the cases of the pinhole and the fracture of discharge pipe, respectively. However, in the case of catastrophic rupture, the concentration was distributed up to 48 m from the leakage source. The figure also indicates that as the size of the leaking hole decreases, the leakage velocity decreases, and the mixture gas is dispersed into the air as soon as it leaks. Thus, the concentration is distributed in a short distance. On the other hand, as the size of the leaking hole becomes larger, the concentration distributes to a longer distance because of the higher kinetic energy and the leaking velocity of the mixture.
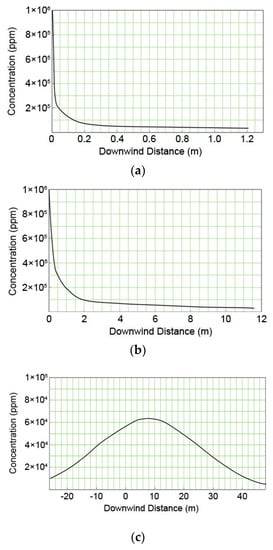
Figure 5.
Concentration distributions of methanol vapor for downwind distance from various release sources; (a) pin hole; (b) discharge pipe of the safety valve; and (c) catastrophic rupture.
2.5.2. Impact Assessment of Fire and Explosion
As for the most dangerous accident caused by the leakage of the methanol mixture gas in the target process, fire and unconfined vapor cloud explosion (UVCE) can be considered. The damage evaluations from the fire and the explosion are based on the radiation intensity and the pressure intensity (overpressure) applied to humans and facilities [6].
Figure 6 shows the thermal radiation distributions in the jet fire caused by a 5-mm pinhole on the methanol removal column and the fracture of a 50-mm discharge pipe, as well as the distribution in the flash fire by the catastrophic rupture. The maximum thermal radiation levels for the pinhole and the fracture of discharge pipe are 0.4 kW/m2 at the distance of 1 m, and 31 kW/m2 at the distance of 6 m, respectively. Therefore, the range at which the radiation could cause a second-degree burn on the human body (4 kW/m2 of thermal radiation exposure for 20 s) is 20 m in the jet fire by the fracture of the discharge pipe and 267 m in the flash fire by catastrophic rupture.
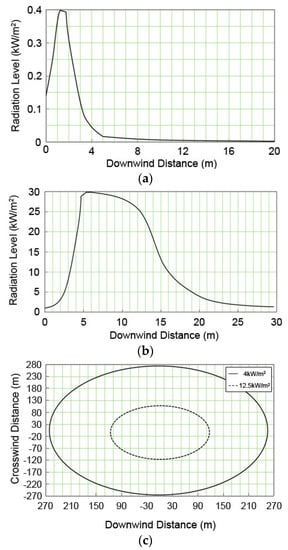
Figure 6.
Thermal radiation distributions for the fire accidents from various release sources; (a) pin hole (jet fire); (b) discharge pipe of the safety valve (jet fire); and (c) catastrophic rupture (flash fire).
Figure 7 presents the overpressure distributions with the consideration of wind direction when UVCE accidents are caused by the 50-mm fracture of the discharge pipe and by the catastrophic rupture of the D-1101 column. In the case of the 5-mm pinhole, the chance of fire is very low because the leaking velocity is low and the vapor is well dispersed so that only a small amount of flammable gas stays near the leakage source. In the case of discharge pipe fracture, however, a 0.02 bar explosion pressure is detected within the 13-m radius. The explosion pressure in the catastrophic rupture has an impact of up to a 590 m radius in the catastrophic rupture. Therefore, the range of damage causing 10% breakage of window glass by UVCE at a 0.02 bar explosion overpressure is around 22 m in the fracture of the discharge valve and ~542 m in the case of a catastrophic rupture.
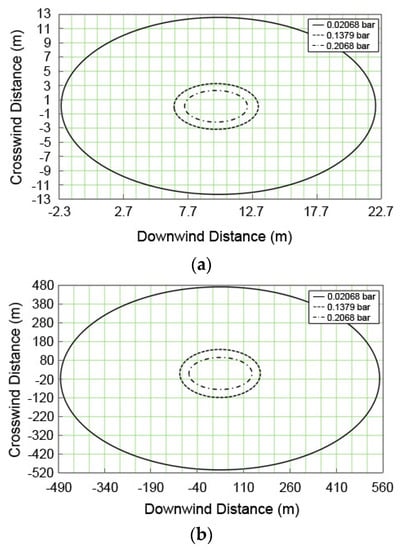
Figure 7.
Overpressure distributions for the UVCE accidents from various release sources; (a) discharge pipe of the safety valve; and (b) catastrophic rupture.
Table 5 summarizes the result of damage prediction for the fire and explosion in the methanol removal process of a BPA plant. These results can be practically used as a reference for establishing safety measures, such as the emergency management plan.
Table 5.
Damage ranges for the fire and explosion accidents at various release sources in the methanol separation column.
3. SIL Analysis of the Process and Its Application
To evaluate the safety integrity level (SIL) of the methanol separation process, related process safety specifications, causes of accidents, and the current safety measures should be reviewed. This allows the understanding of the components and their functions within the safety instrumented system (SIS). Next, the reliability data on the probability of failure on demand (PFD) for the pressure relief valve must be determined to quantify the reliability of the SIS [13,14]. In determining the average PFD, the calculation method described in IEC-61508-6 Annex B.2 and the failure data, provided by variable sources including Center for Chemical Process Safety, Institute of Electrical and Electronics Engineers, SINTEF, and companies that provide parts, were used [15,16,17,18,19]. The target SIL for the SIS was set to level three, which is equivalent to the PFD between 10−3 and 10−4.
In order to present objective success criteria for application of a target reliability on SIS, an integrity model was implemented. Based on this model, a fault tree analysis (FTA) was conducted in accordance with the KOSHA Code P-4 to quantitatively inspect the failure rate of SIS [20,21]. The quantification of FTA was performed using KAERI Integrated Reliability Analysis Code Package (KIRAP) developed by Korea Atomic Energy Research Institute (KAERI) [22]. By providing the generic failure data for each component in the cut set, the program calculated the average PFD for the failure case of systems of interest. Some of the calculations using KIRAP are shown in Appendix A and Appendix B. Finally, SIS was examined to determine whether such system would meet the target SIL. To derive conservative results, the possibility of error recovery by an operator was not included, and only the integrity of SIS itself was considered. To derive a quantitative probability for the qualitatively evaluated worst-case scenario, this research performed a deductive analysis on the causes of specific accidents while including equipment defects and worker’s fault in the analysis. The piping and instrument diagram containing SIS with SIL 3 is shown in Figure 8.
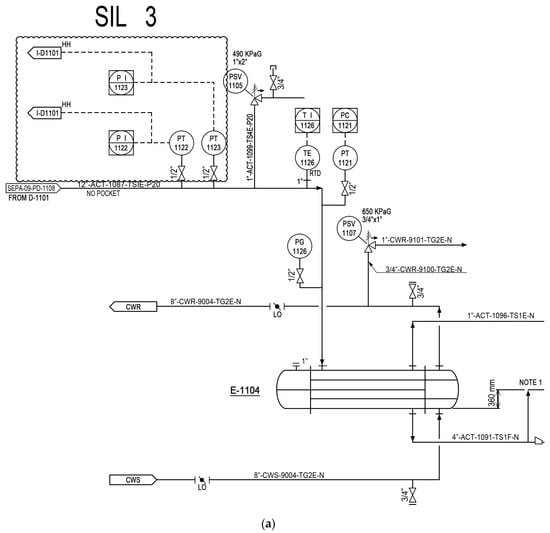
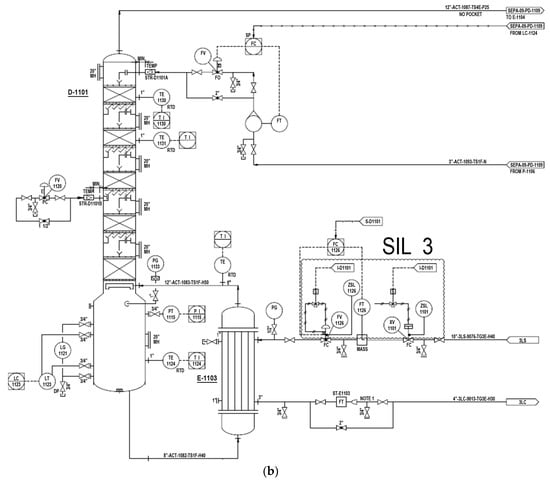
Figure 8.
Piping and instrument diagram for a methanol separation column; (a) the process monitoring and instrumentation system for overhead condenser operation and control; and (b) the process monitoring and instrumentation system for D-1101 BTM reboiler operation and control.
3.1. Results of FTA
The methanol separation column within the BPA manufacturing process is considered a high-risk process because of its high operation temperature and pressure. Therefore, the column requires a stable supply of coolant and electrical power. In the worst-case scenario, the power supply for the factory can be totally interrupted from KEPCO and such a situation must be considered. The power failure will lead to a total loss of coolant supply because 100% of the coolant supply pump is powered by an electrical motor. On the other hand, the boiler feedwater (BFW) pump is driven by a steam turbine. If the fuel for the steam generator does not run out, the hot steam will be fed continuously into the column even during the power outage. If the coolant and the power supply are cut off, the pressure and temperature of the column will simultaneously rise, causing the pressure relief system, the safety valve, to malfunction. Eventually, the column may not be able to withstand the excess pressure and rupture. Even if the safety valves function normally to release excess pressure, the relief load at the safety valve will reach its maximum, and an increase in the flare stack capacity will be necessary. This can be done by expanding the current flare stack or installing additional flare stacks. Installing new flare stacks not only cost millions of dollars, but also involves careful planning to secure a safe distance from other facilities and neighboring residents. For these reasons, before increasing the flare stack capacity, there is a need for a quantitative analysis on whether the reliability of SIS meets the required reliability level of the pressure relief valve, which is SIL 3 [19]. This level is chosen based on generic reliability data which find that the average PFD of the pressure relief valve is 3.2 × 10⁻³. SIL 3 satisfies the given PFD for the safety valve. In this study, we chose the target SIL of three for the SIS of interest. The relief capacity of the pressure relief valve PSV-000 is as shown in Table 6. The maximum relief capacity of this valve without SIS is determined to be 10,562 kg/h. If SIS is installed, the reliability must satisfy SIL 3 to completely block the steam supplied to the reboiler, the relief capacity of the safety valve can be minimized.
Table 6.
PSV load for the methanol separation column.
3.2. SIS Analysis Results
To determine the suitability of SIS for the methanol separation column, qualitative and quantitative risk assessments were conducted. Analyzing the results of the HAZOP analysis, it was confirmed that the risk potential for an explosion caused by excess pressure in the methanol separation column from the power outage induced cooling system failure was the highest. Additionally, to determine the suitability of SIS, quantitative risk assessment was conducted through FTA. The results confirmed that when the pressure relief valve operation was required due to a cooling system failure, PDF was 1.57 × 10⁻⁴, as shown in Appendix A, and this satisfied the target SIL of three. Further, as shown in Appendix B, the PDF of the power failure case was 2.4 × 10⁻⁹, which also satisfied SIL 3. For the presented failure cases, the results of analyzing SIL showed that all systems satisfied SIL 3 conditions required by the pressure relief valve. These results are shown in Table 7.
Table 7.
Quantitative result for PFD at the current level.
4. Conclusions
This research uses the SIS method to determine whether a measurement control system is adequately implemented so that the system could be stabilized before the relief system reacts to an internal overpressure in the methanol separation column in the BPA manufacturing process. The results of qualitative risk assessment confirm that the highest risks associated with the manufacturing equipment are the power outage and subsequent cooling system failure. In the case of a fire due to a malfunction of the measurement control system and pressure relief system failure, the distance at which the radiations from the fire cause a second-degree burn to the skin if exposed for more than 20 s varies from 20 m (50-mm diameter fracture) to 267 m (rupture).
The damage prediction of an explosion shows that the explosion created 0.02 bar of overpressure, which, on average, gives 10% breakage of glass windows within 22 m of radius for a 50-mm leak size and 542 m for a rupture, respectively. When the coolant supply is cutoff, PFD of the pressure relief valve, which is the SIS comparison factor, is 1.57 × 10⁻⁴, and this satisfies the target SIL 3. When the power supply is cutoff, PFD is 2.4 × 10⁻⁹, which also adequately satisfies the target SIL 3.
If the SIS system of SIL 3 is implemented to the design of a BPA plant, one of the pressure build-up scenarios which involves the flare stack to process an excess pressure can be safely ignored, and the safety level of the plant is secured without needing additional flare systems installed. Removing one of the excess pressure scenarios, which determines the maximum capacity, makes it possible to reduce the flare system load. However, to secure mechanical stability, it is confirmed that the safety valve, which uses a mechanical safety mechanism, could not be removed. Based on these results, by applying a target SIL of three to the measurement control system, the maximum release capacity of the pressure relief valve can be significantly reduced and, therefore, it is possible to minimize the design capacity for the flare stack. In conclusion, application of SIL 3 in designing factory control measurement systems in the petrochemical industry in Korea is expected to have a significant impact on preventing large-scale accidents.
Acknowledgments
This research was supported by BARTEC SEC Co., Ltd. with Grant No. BQS2015-A97001. This grant does not cover the publication cost for open access. However, the funding source does not hold any competing interest.
Author Contributions
In-Bok Lee and Insung Woo conceived and designed the study; In-Bok Lee performed the simulations; In-Bok Lee and Insung Woo analyzed the data; In-Bok Lee wrote the paper.
Conflicts of Interest
The authors declare no conflict of interest. The funding sponsors had no role in the design of the study; in the collection, analyses, or interpretation of data; in the writing of the manuscript, and in the decision to publish the results.
Abbreviations
| CABLE | coaxial cable |
| CCF | common cause fail |
| D | distillation column |
| E | heat exchange |
| FC | flow control valve |
| FSOV | foundation fieldbus shutoff valve |
| FT | flow transmitter |
| FV | flow valve |
| LC | level control |
| LG | level gauge |
| LS | logic solver |
| LT | level transmitter |
| PAHH | pressure alarm high high |
| PI | pressure indicator |
| PSV | pressure safety valve |
| PT | pressure transmitter |
| PT | pressure transmitter |
| PV | pressure valve |
| RELAYFV | relay flow valve |
| RELAYXV | relay knife gate valve |
| TE | temperature element |
| TI | temperature indicator |
| TK | tank |
| TRIP | shutdown |
| V/V | vent valve |
| VCB | voltage control box |
| XSOV | knife gate solenoid valve |
| XV | knife gate valve |
Appendix A
Table A1.
FTA Calculation for the Cooling System Failure Case.Reporting for D-1101Value * = 1.570 × 10⁻⁴Final Cut Sets
| No. | Value * | F-V Importance | Accuracy | Cut Sets |
|---|---|---|---|---|
| 1 | 7.43 × 10⁻⁵ | 0.4733 | 0.4733 | LS-FAIL |
| 2 | 3.88 × 10⁻⁵ | 0.2472 | 0.7205 | RELAYFV-1126, XSOV-1101FAIL |
| 3 | 1.33 × 10⁻⁵ | 0.0845 | 0.8051 | FSOV-1126FAIL, XSOV-1101FAIL |
| 4 | 1.33 × 10⁻⁵ | 0.0845 | 0.8896 | RELAYFV-1126, XV-1101FAIL |
| 5 | 4.54 × 10⁻⁶ | 0.0289 | 0.9185 | FSOV-1126FAIL, XV-1101FAIL |
| 6 | 4.22 × 10⁻⁶ | 0.0269 | 0.9454 | RELAYFV-1126, RELAYXV-1101 |
| 7 | 4.22 × 10⁻⁶ | 0.0269 | 0.9722 | FV-1126-CCF, XSOV-1101FAIL |
| 8 | 1.44 × 10⁻⁶ | 0.0092 | 0.9814 | FSOV-1126FAIL, RELAYXV-1101 |
| 9 | 1.44 × 10⁻⁶ | 0.0092 | 0.9906 | FV-1126-CCF, XV-1101FAIL |
| 10 | 4.58 × 10⁻⁷ | 0.0029 | 0.9935 | FV-1126-CCF, RELAYXV-1101 |
| 11 | 2.65 × 10⁻⁷ | 0.0017 | 0.9952 | RELAYFV-1126, XV-1101-CCF |
| 12 | 2.65 × 10⁻⁷ | 0.0017 | 0.9969 | RELAY1126-CCF, XSOV-1101FAIL |
| 13 | 9.07 × 10⁻⁸ | 0.0006 | 0.9975 | RELAY1126-CCF, XV-1101FAIL |
| 14 | 9.07 × 10⁻⁸ | 0.0006 | 0.9981 | FSOV-1126FAIL, XV-1101-CCF |
| 15 | 8.41 × 10⁻⁸ | 0.0005 | 0.9986 | FV-1126FAIL, XSOV-1101FAIL |
| 16 | 8.41 × 10⁻⁸ | 0.0005 | 0.9991 | RELAYFV-1126, RELAY1101-CCF |
| 17 | 2.88 × 10⁻⁸ | 0.0002 | 0.9993 | FV-1126-CCF, XV-1101-CCF |
| 18 | 2.88 × 10⁻⁸ | 0.0002 | 0.9995 | RELAY1126-CCF, RELAYXV-1101 |
| 19 | 2.88 × 10⁻⁸ | 0.0002 | 0.9997 | FV-1126FAIL, XV-1101FAIL |
| 20 | 2.88 × 10⁻⁸ | 0.0002 | 0.9999 | FSOV-1126FAIL, RELAY1101-CCF |
| 21 | 9.14 × 10⁻⁹ | 0.0001 | 0.9999 | FV-1126-CCF, RELAY1101-CCF |
| 22 | 9.14 × 10⁻⁹ | 0.0001 | 1.0000 | FV-1126FAIL, RELAYXV-1101 |
| 23 | 1.82 × 10⁻⁹ | 0.0000 | 1.0000 | RELAY1126-CCF, XV-1101-CCF |
| 24 | 5.75 × 10⁻¹⁰ | 0.0000 | 1.0000 | RELAY1126-CCF, RELAY1101-CCF |
| 25 | 5.75 × 10⁻¹⁰ | 0.0000 | 1.0000 | FV-1126FAIL, XV-1101-CCF |
| 26 | 1.82 × 10⁻¹⁰ | 0.0000 | 1.0000 | FV-1126FAIL, RELAY1101-CCF |
| 27 | 9.66 × 10⁻¹² | 0.0000 | 1.0000 | PAHH-1122, PAHH-1123, PAHH-1124 |
| 28 | 1.34 × 10⁻¹² | 0.0000 | 1.0000 | PAHH-1122, PT-B-CCF, PAHH-1124 |
| 29 | 1.34 × 10⁻¹² | 0.0000 | 1.0000 | PAHH-1122, PAHH-1123, PT-C-CCF |
| 30 | 1.34 × 10⁻¹² | 0.0000 | 1.0000 | PT-A-CCF, PAHH-1123, PAHH-1124 |
| 31 | 2.39 × 10⁻¹³ | 0.0000 | 1.0000 | PAHH-1122, PAHH-1123, CABLE-C |
| 32 | 2.39 × 10⁻¹³ | 0.0000 | 1.0000 | CABLE-A, PAHH-1123, PAHH-1124 |
| 33 | 2.39 × 10⁻¹³ | 0.0000 | 1.0000 | PAHH-1122, CABLE-B PAHH-1124 |
| 34 | 1.87 × 10⁻¹³ | 0.0000 | 1.0000 | PAHH-1122, PT-B-CCF, PT-C-CCF |
| 35 | 1.87 × 10⁻¹³ | 0.0000 | 1.0000 | PT-A-CCF, PT-B-CCF, PAHH-1124 |
| 36 | 1.87 × 10⁻¹³ | 0.0000 | 1.0000 | PT-A-CCF, PAHH-1123, PT-C-CCF |
| 37 | 3.32 × 10⁻¹⁴ | 0.0000 | 1.0000 | CABLE-A, PAHH-1123, PT-C-CCF |
| 38 | 3.32 × 10⁻¹⁴ | 0.0000 | 1.0000 | CABLE-A, PT-B-CCF, PAHH-1124 |
| 39 | 3.32 × 10⁻¹⁴ | 0.0000 | 1.0000 | PT-A-CCF, ABLE-B, PAHH-1124 |
| 40 | 3.32 × 10⁻¹⁴ | 0.0000 | 1.0000 | PT-A-CCF, PAHH-1123, CABLE-C |
| 41 | 3.32 × 10⁻¹⁴ | 0.0000 | 1.0000 | PAHH-1122, PT-B-CCF, CABLE-C |
| 42 | 3.32 × 10⁻¹⁴ | 0.0000 | 1.0000 | PAHH-1122, CABLE-B, PT-C-CCF |
| 43 | 2.59 × 10⁻¹⁴ | 0.0000 | 1.0000 | PT-A-CCF, PT-B-CCF, PT-C-CCF |
| 44 | 5.89 × 10⁻¹⁵ | 0.0000 | 1.0000 | PAHH-1122, CABLE-B, CABLE-C |
| 45 | 5.89 × 10⁻¹⁵ | 0.0000 | 1.0000 | CABLE-A, CABLE-B, PAHH-1124 |
| 46 | 5.89 × 10⁻¹⁵ | 0.0000 | 1.0000 | CABLE-A, PAHH-1123, CABLE-C |
| 47 | 4.76 × 10⁻¹⁵ | 0.0000 | 1.0000 | PAHH-1122, CABLE-B-CCF, PAHH-1124 |
| 48 | 4.76 × 10⁻¹⁵ | 0.0000 | 1.0000 | CABLE-A-CCF, PAHH-1123, PAHH-1124 |
| 49 | 4.76 × 10⁻¹⁵ | 0.0000 | 1.0000 | PAHH-1122 PAHH-1123, CABLE-C-CCF |
| 50 | 4.61 × 10⁻¹⁵ | 0.0000 | 1.0000 | PT-A-CCF, CABLE-B, PT-C-CCF |
| 51 | 4.61 × 10⁻¹⁵ | 0.0000 | 1.0000 | CABLE-A, PT-B-CCF, PT-C-CCF |
| 52 | 4.61 × 10⁻¹⁵ | 0.0000 | 1.0000 | PT-A-CCF, PT-B-CCF, CABLE-C |
| 53 | 8.19 × 10⁻¹⁶ | 0.0000 | 1.0000 | CABLE-A, CABLE-B, PT-C-CCF |
| 54 | 8.19 × 10⁻¹⁶ | 0.0000 | 1.0000 | PT-A-CCF, CABLE-B, CABLE-C |
| 55 | 8.19 × 10⁻¹⁶ | 0.0000 | 1.0000 | CABLE-A, PT-B-CCF, CABLE-C |
| 56 | 6.62 × 10⁻¹⁶ | 0.0000 | 1.0000 | CABLE-A-CCF, PT-B-CCF, PAHH-1124 |
| 57 | 6.62 × 10⁻¹⁶ | 0.0000 | 1.0000 | CABLE-A-CCF, PAHH-1123, PT-C-CCF |
| 58 | 6.62 × 10⁻¹⁶ | 0.0000 | 1.0000 | PAHH-1122, CABLE-B-CCF, PT-C-CCF |
| 59 | 6.62 × 10⁻¹⁶ | 0.0000 | 1.0000 | PT-A-CCF, PAHH-1123, CABLE-C-CCF |
| 60 | 6.62 × 10⁻¹⁶ | 0.0000 | 1.0000 | PAHH-1122, PT-B-CCF, CABLE-C-CCF |
| 61 | 6.62 × 10⁻¹⁶ | 0.0000 | 1.0000 | PT-A-CCF, CABLE-B-CCF, PAHH-1124 |
| 62 | 1.46 × 10⁻¹⁶ | 0.0000 | 1.0000 | CABLE-A, CABLE-B, CABLE-C |
| 63 | 1.18 × 10⁻¹⁶ | 0.0000 | 1.0000 | CABLE-A, PAHH-1123, CABLE-C-CCF |
| 64 | 1.18 × 10⁻¹⁶ | 0.0000 | 1.0000 | CABLE-A-CCF, CABLE-B, PAHH-1124 |
| 65 | 1.18 × 10⁻¹⁶ | 0.0000 | 1.0000 | PAHH-1122, CABLE-B, CABLE-C-CCF |
| 66 | 1.18 × 10⁻¹⁶ | 0.0000 | 1.0000 | CABLE-A, CABLE-B-CCF, PAHH-1124 |
| 67 | 1.18 × 10⁻¹⁶ | 0.0000 | 1.0000 | PAHH-1122, CABLE-B-CCF, CABLE-C |
| 68 | 1.18 × 10⁻¹⁶ | 0.0000 | 1.0000 | CABLE-A-CCF, PAHH-1123, CABLE-C |
| 69 | 9.20 × 10⁻¹⁷ | 0.0000 | 1.0000 | PT-A-CCF, PT-B-CCF, CABLE-C-CCF |
| 70 | 9.20 × 10⁻¹⁷ | 0.0000 | 1.0000 | PT-A-CCF, CABLE-B-CCF, PT-C-CCF |
| 71 | 9.20 × 10⁻¹⁷ | 0.0000 | 1.0000 | CABLE-A-CCF, PT-B-CCF, PT-C-CCF |
| 72 | 1.64 × 10⁻¹⁷ | 0.0000 | 1.0000 | PT-A-CCF, CABLE-B-CCF, CABLE-C |
| 73 | 1.64 × 10⁻¹⁷ | 0.0000 | 1.0000 | CABLE-A-CCF, PT-B-CCF, CABLE-C |
| 74 | 1.64 × 10⁻¹⁷ | 0.0000 | 1.0000 | PT-A-CCF, CABLE-B, CABLE-C-CCF |
| 75 | 1.64 × 10⁻¹⁷ | 0.0000 | 1.0000 | CABLE-A, PT-B-CCF, CABLE-C-CCF |
| 76 | 1.64 × 10⁻¹⁷ | 0.0000 | 1.0000 | CABLE-A-CCF, CABLE-B, PT-C-CCF |
| 77 | 1.64 × 10⁻¹⁷ | 0.0000 | 1.0000 | CABLE-A, CABLE-B-CCF, PT-C-CCF |
| 78 | 2.91 × 10⁻¹⁸ | 0.0000 | 1.0000 | CABLE-A, CABLE-B, CABLE-C-CCF |
| 79 | 2.91 × 10⁻¹⁸ | 0.0000 | 1.0000 | CABLE-A, CABLE-B-CCF, CABLE-C |
| 80 | 2.91 × 10⁻¹⁸ | 0.0000 | 1.0000 | CABLE-A-CCF, CABLE-B, CABLE-C |
| 81 | 2.35 × 10⁻¹⁸ | 0.0000 | 1.0000 | CABLE-A-CCF, CABLE-B-CCF, PAHH-1124 |
| 82 | 2.35 × 10⁻¹⁸ | 0.0000 | 1.0000 | PAHH-1122, CABLE-B-CCF, PABLE-C-CCF |
| 83 | 2.35 × 10⁻¹⁸ | 0.0000 | 1.0000 | CABLE-A-CCF, PAHH-1123, CABLE-C-CCF |
| 84 | 3.26 × 10⁻¹⁹ | 0.0000 | 1.0000 | CABLE-A-CCF, PT-B-CCF, CABLE-C-CCF |
| 85 | 3.26 × 10⁻¹⁹ | 0.0000 | 1.0000 | CABLE-A-CCF, CABLE-B-CCF, PT-C-CCF |
| 86 | 3.26 × 10⁻¹⁹ | 0.0000 | 1.0000 | PT-A-CCF, CABLE-B-CCF, CABLE-C-CCF |
| 87 | 5.80 × 10⁻²⁰ | 0.0000 | 1.0000 | CABLE-A-CCF, CABLE-B, CABLE-C-CCF |
| 88 | 5.80 × 10⁻²⁰ | 0.0000 | 1.0000 | CABLE-A-CCF, CABLE-B-CCF, CABLE-C |
| 89 | 5.80 × 10⁻²⁰ | 0.0000 | 1.0000 | CABLE-A-CCF, CABLE-B-CCF, CABLE-C-CCF |
| 90 | 1.16 × 10⁻²¹ | 0.0000 | 1.0000 | CABLE-A-CCF, CABLE-B-CCF, CABLE-C-CCF |
Execution time 1 s (gen:0, exp:0, abs:0), Return Code = 1
End of CUT Run
Appendix B
Table B1.
FTA Report for the Power Failure Case.Reporting for ALL_POWER_FAILUREValue * = 2.397 × 10⁻⁹Final Cut Sets
| No. | Value * | F-V Importance | Accuracy | Cut Sets |
|---|---|---|---|---|
| 1 | 2.38 × 10⁻⁹ | 0.9935 | 0.9935 | TRIP_FAIL, KEPCO_FAIL, 7_2_VCB_01_TRIP, 7_2_VCB_02_TRIP |
| 2 | 8.58 × 10⁻¹² | 0.0036 | 0.9970 | TRIP_FAIL, 154KV_FAIL, 7_2_VCB_01_TRIP, 7_2_VCB_02_TRIP |
| 3 | 7.09 × 10⁻¹² | 0.0030 | 1.0000 | TRIP_FAIL, 7_2KV_FAIL, 7_2_VCB_01_TRIP, 7_2_VCB_02_TRIP |
Execution time 0 s (gen:0, exp:0, abs:0), Return Code = 1
End of CUT Run
* Failure data
References
- Korea Occupational Safety & Health Agency (KOSHA). The Statistical Analysis of Hazard Rates in Korea Chemical Industry: Annual Report; KOSHA: Ulsan, Korea, 2012. [Google Scholar]
- Center for Chemical Process Industry (CCPS). Guidelines for Technical Management of Chemical Process Safety, 1st ed.; American Institute of Chemical Engineers, CCPS: New York, NY, USA, 1989. [Google Scholar]
- Korea Occupational Safety & Health Agency (KOSHA). Technical Guideline to Minimize the Damage at Chemical Plants; KOSHA: Ulsan, Korea, 1993. [Google Scholar]
- Swann, C.D.; Preston, M.L. Twenty-five years of HAZOPs. J. Loss Prev. Process Ind. 1995, 8, 349–353. [Google Scholar] [CrossRef]
- Wang, Y.; Rausand, M. Reliability analysis of safety-instrumented systems operated in high-demand mode. J. Loss Prev. Process Ind. 2014, 32, 254–264. [Google Scholar] [CrossRef]
- Center for Chemical Process Industry (CCPS). Guidelines for Chemical Process Quantitative Risk Analysis, 2nd ed.; American Institute of Chemical Engineers, CCPS: New York, NY, USA, 1999. [Google Scholar]
- Ministry of Employment and Labor. Risk Assessment of Hazardous Materials Including Hydrofluoric Acid and Research on Reinforcement of PSM Regulations; Ministry of Employment and Labor: Geneva, Switzerland, 2013. [Google Scholar]
- Mannan, M.S. A technical analysis of the Buncefield explosion and fire. In Proceedings of the Hazards XXI, Institution of Chemical Engineers, Manchester, UK, 10–12 November 2009; pp. 662–673.
- Korea Occupational Safety & Health Agency (KOSHA). KOSHA Code P-2, 2008: Technical Guideline of Risk of Continuous Process and HAZOP Technique; KOSHA: Ulsan, Korea, 2008. [Google Scholar]
- Korea Occupational Safety & Health Agency (KOSHA). KOSHA Code P-37, 2004: Guideline on Selecting the Worst Leakage Scenario; KOSHA: Ulsan, Korea, 2004. [Google Scholar]
- Pasquill, F. The estimation of the dispersion of windborne material. Metrol. Mag. 1961, 90, 33–49. [Google Scholar]
- Korea Occupational Safety & Health Agency (KOSHA). KOSHA Code P-42, 2006: Technical Guideline on Measures to Minimize Damage at Chemical Plants; KOSHA: Ulsan, Korea, 2006. [Google Scholar]
- Liu, Y.; Rausand, M. Reliability assessment of safety instrumented systems subject to different demand modes. J. Loss Prev. Process Ind. 2011, 24, 49–56. [Google Scholar] [CrossRef]
- Center for Chemical Process Industry (CCPS). Guidelines for Safe Automation of Chemical Processes, 1st ed.; American Institute of Chemical Engineers, CCPS: New York, NY, USA, 1993. [Google Scholar]
- International Electrotechnical Commission (IEC). IEC 61508-6: Functional Safety of Electrical/Electronic/Programmable Electronic Safety Related Systems—Part 6: Guidelines on the Application of IEC 61508-2 and IEC 61508-3; IEC: Geneva, Switzerland, 2000. [Google Scholar]
- Center for Chemical Process Industry (CCPS). Guidelines for Process Equipment Reliability Data, 1st ed.; American Institute of Chemical Engineers, CCPS: New York, NY, USA, 1989. [Google Scholar]
- IEEE. 500–1984 IEEE Guide to the Collection and Presentation of Electrical, Electronic, Sensing Component, and Mechanical Equipment Reliability Data for Nuclear-Power Generating Stations; IEEE: San Francisco, CA, USA, 1993. [Google Scholar]
- OREDA. Offshore Reliability Data, 3rd ed.; OREDA: Høvik, Norway, 1997. [Google Scholar]
- Denson, W.K.; Chandler, G.; Crowell, W.; Clark, A.; Jaworski, P. Nonelectronic Parts Reliability Data, 1995; Reliability Analysis Center Griffiss Air Force Base: Rome, NY, USA, 1995. [Google Scholar]
- Wells, G.L. Hazard Identification and Risk Assessment; Institution of Chemical Engineers: London, UK, 1996; pp. 1–90. [Google Scholar]
- Korea Occupational Safety & Health Agency (KOSHA). KOSHA Code P-4, 2006: Technical Guideline on Fault Tree Analysis; KOSHA: Ulsan, Korea, 2006. [Google Scholar]
- Korea Atomic Energy Research Institute (KAERI). KAERI Integrated Reliability Analysis Code Package (KIRAP) Ver. 2.8C; KAERI: Daejeon, Korea, 2000. [Google Scholar]
© 2016 by the authors; licensee MDPI, Basel, Switzerland. This article is an open access article distributed under the terms and conditions of the Creative Commons Attribution (CC-BY) license (http://creativecommons.org/licenses/by/4.0/).