
Development and Application of a Planning Support System for Regional Spatial Functional Zoning Based on GIS

Abstract
:1. Introduction
2. Principles and Methods
2.1. PSS Principles
- (1)
- PSS is a subset of DSS, referring to a decision support system which integrates GIS technology, the planning decision model and various technologies directly related to planning. As a decision-making interactive computer system, it is used to support one or a set of planners in semi-structured or unstructured planning decisions at high efficiency. The comparison of PSS and DSS is shown in Table 1.
- (2)
- The PSS is an auxiliary decision-making tool, offering support to decision making in various planning stages, rather than making decisions by itself. PSS aims to expand the capacity of decision-making of planners, rather than replace them, planners always retain autonomy in decision-making. At the same time, PSS does not directly offer the best solution, but through scenario planning analysis presets several possible strategies and planning rules, and then simulates each option, under planning strategies and rules by PSS, and uses visualization methods such as images and diagrams of the different results communicated to planners. Finally, it depends entirely on the power of planners to choose a scheme and planners will need to choose the most suitable planning scheme from decision results. The PSS internal decision-making process is completely transparent, in which planners can clearly grasp planning strategies and rules; by changing these strategies and rules, PSS will be able to produce different planning results. Hence there will not be PSS without planning strategies and decision making rules. The condition and foundation of PSS development and application is the support from planning strategies and decision-making rules. The essence of the PSS is to provide a technology platform for multi-scheme comparison based on different planning strategies and decision-making rules.
- (3)
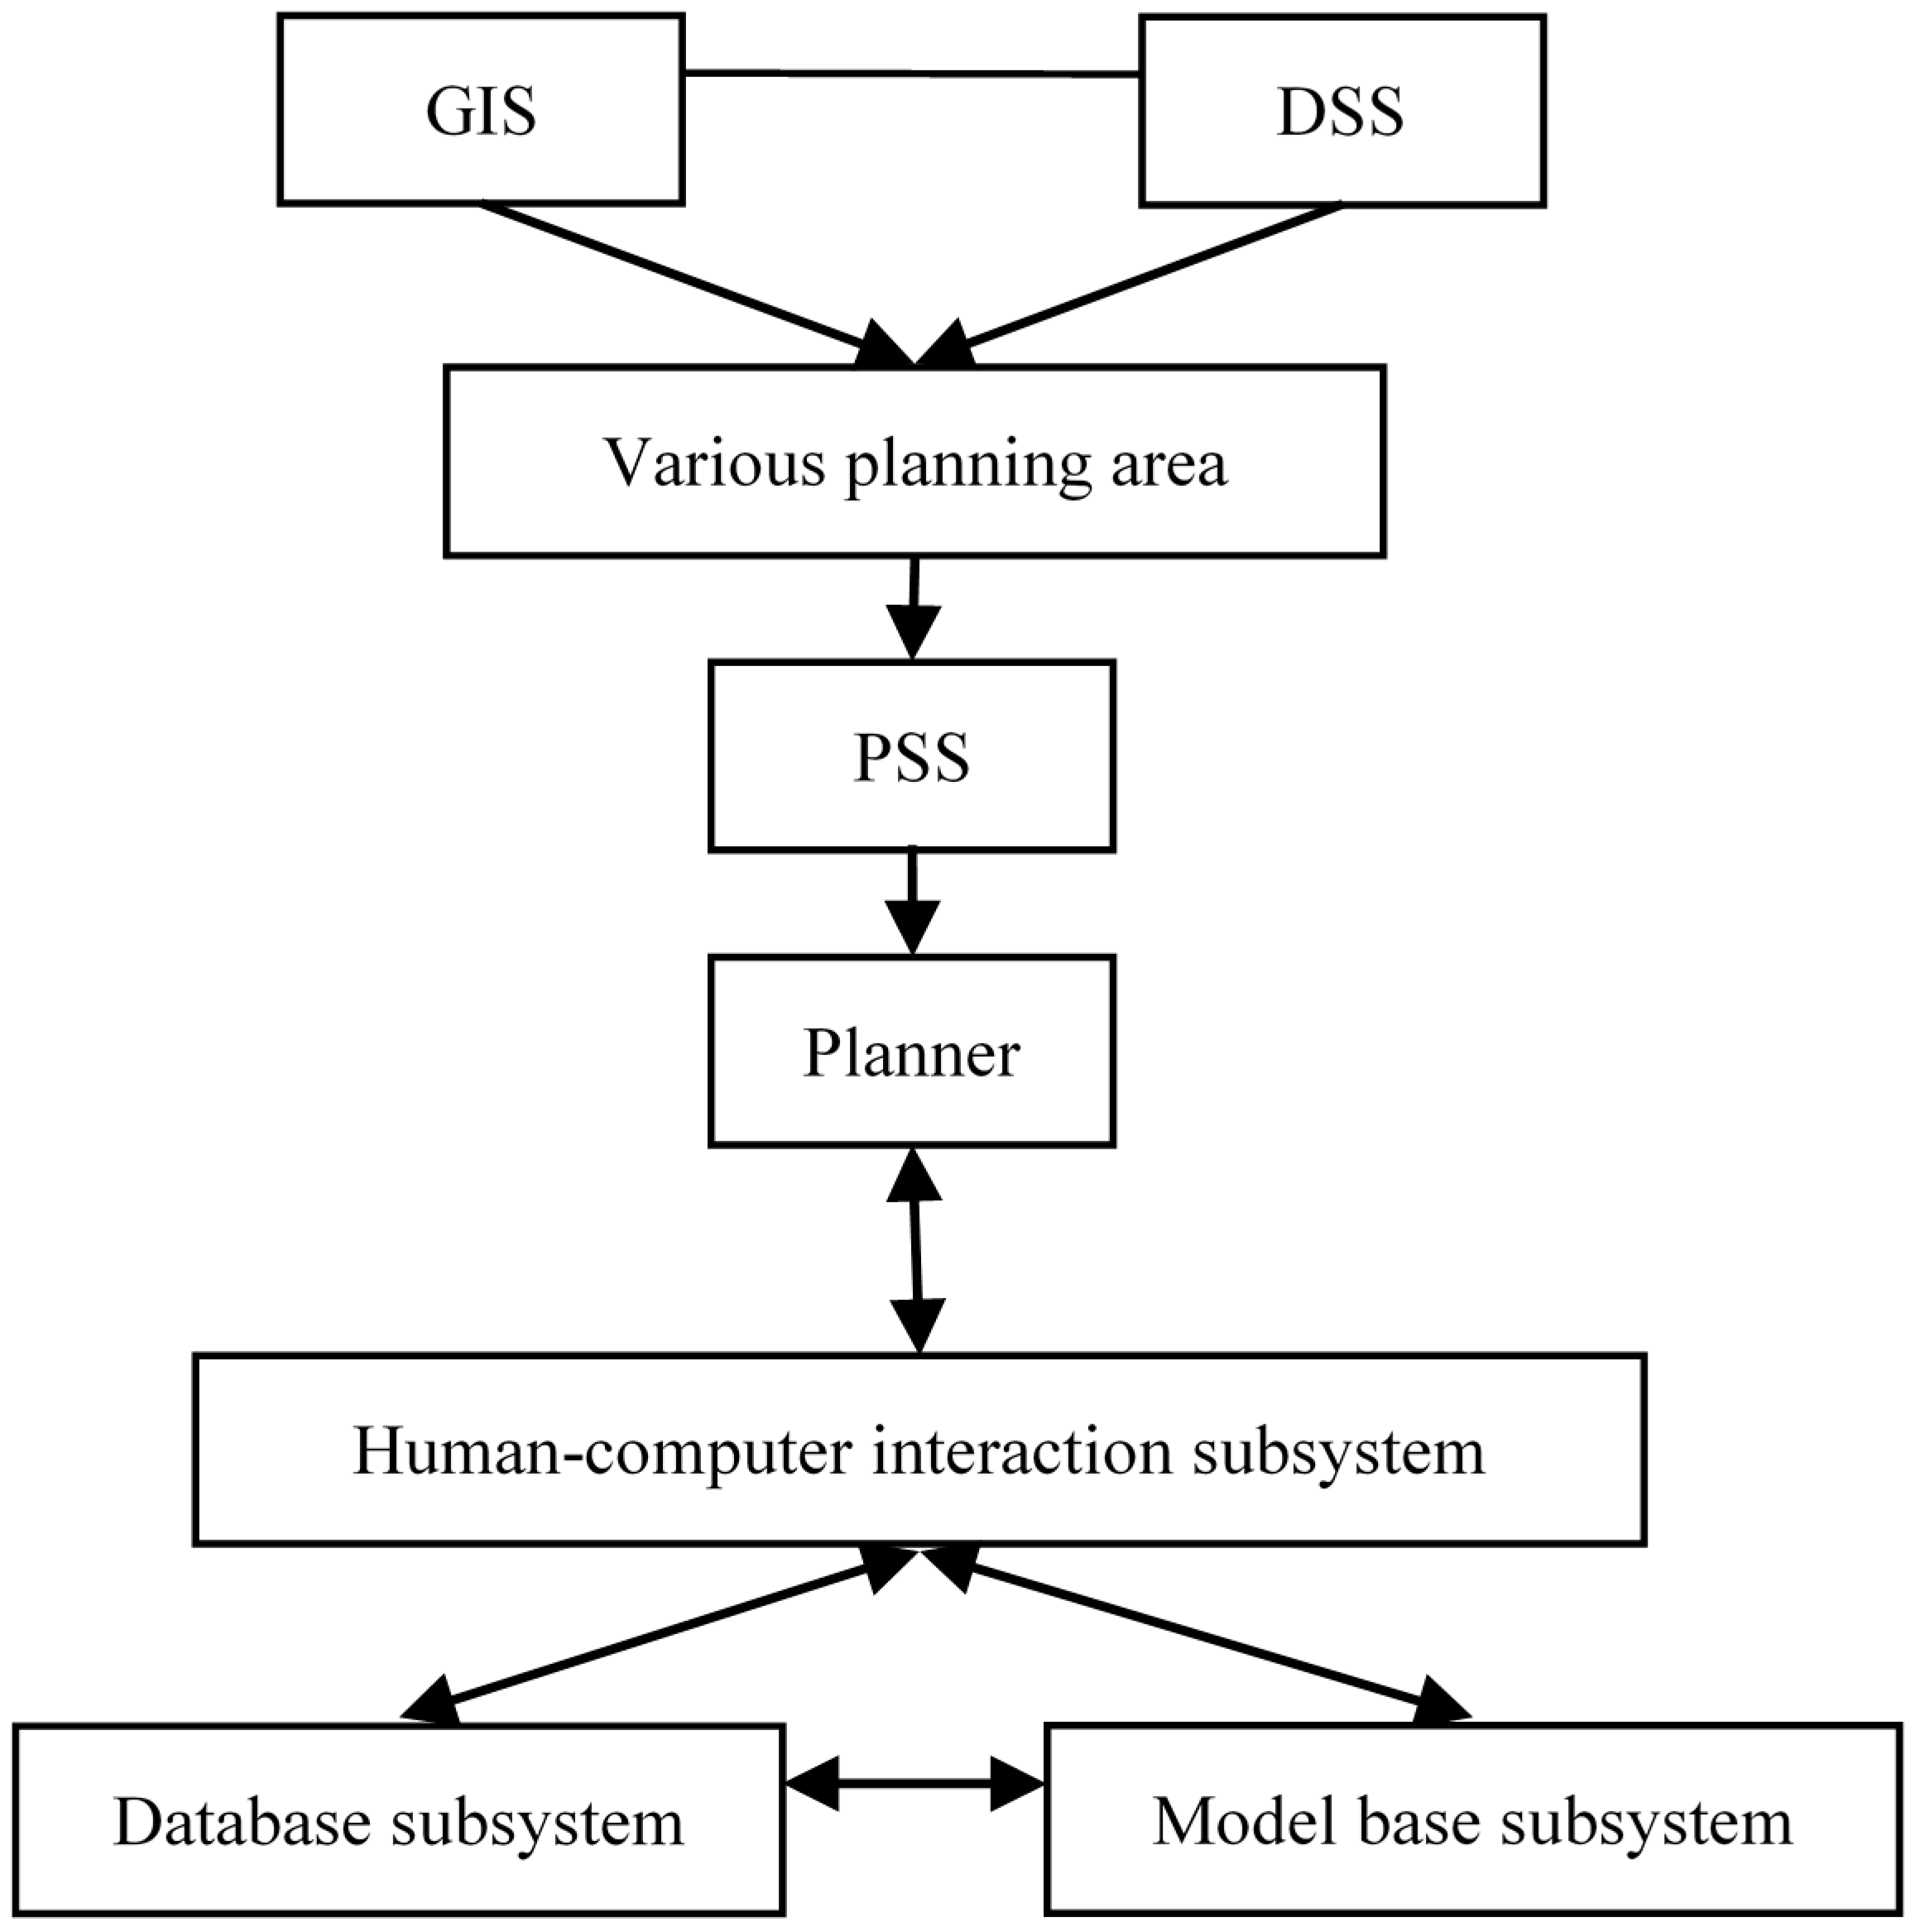
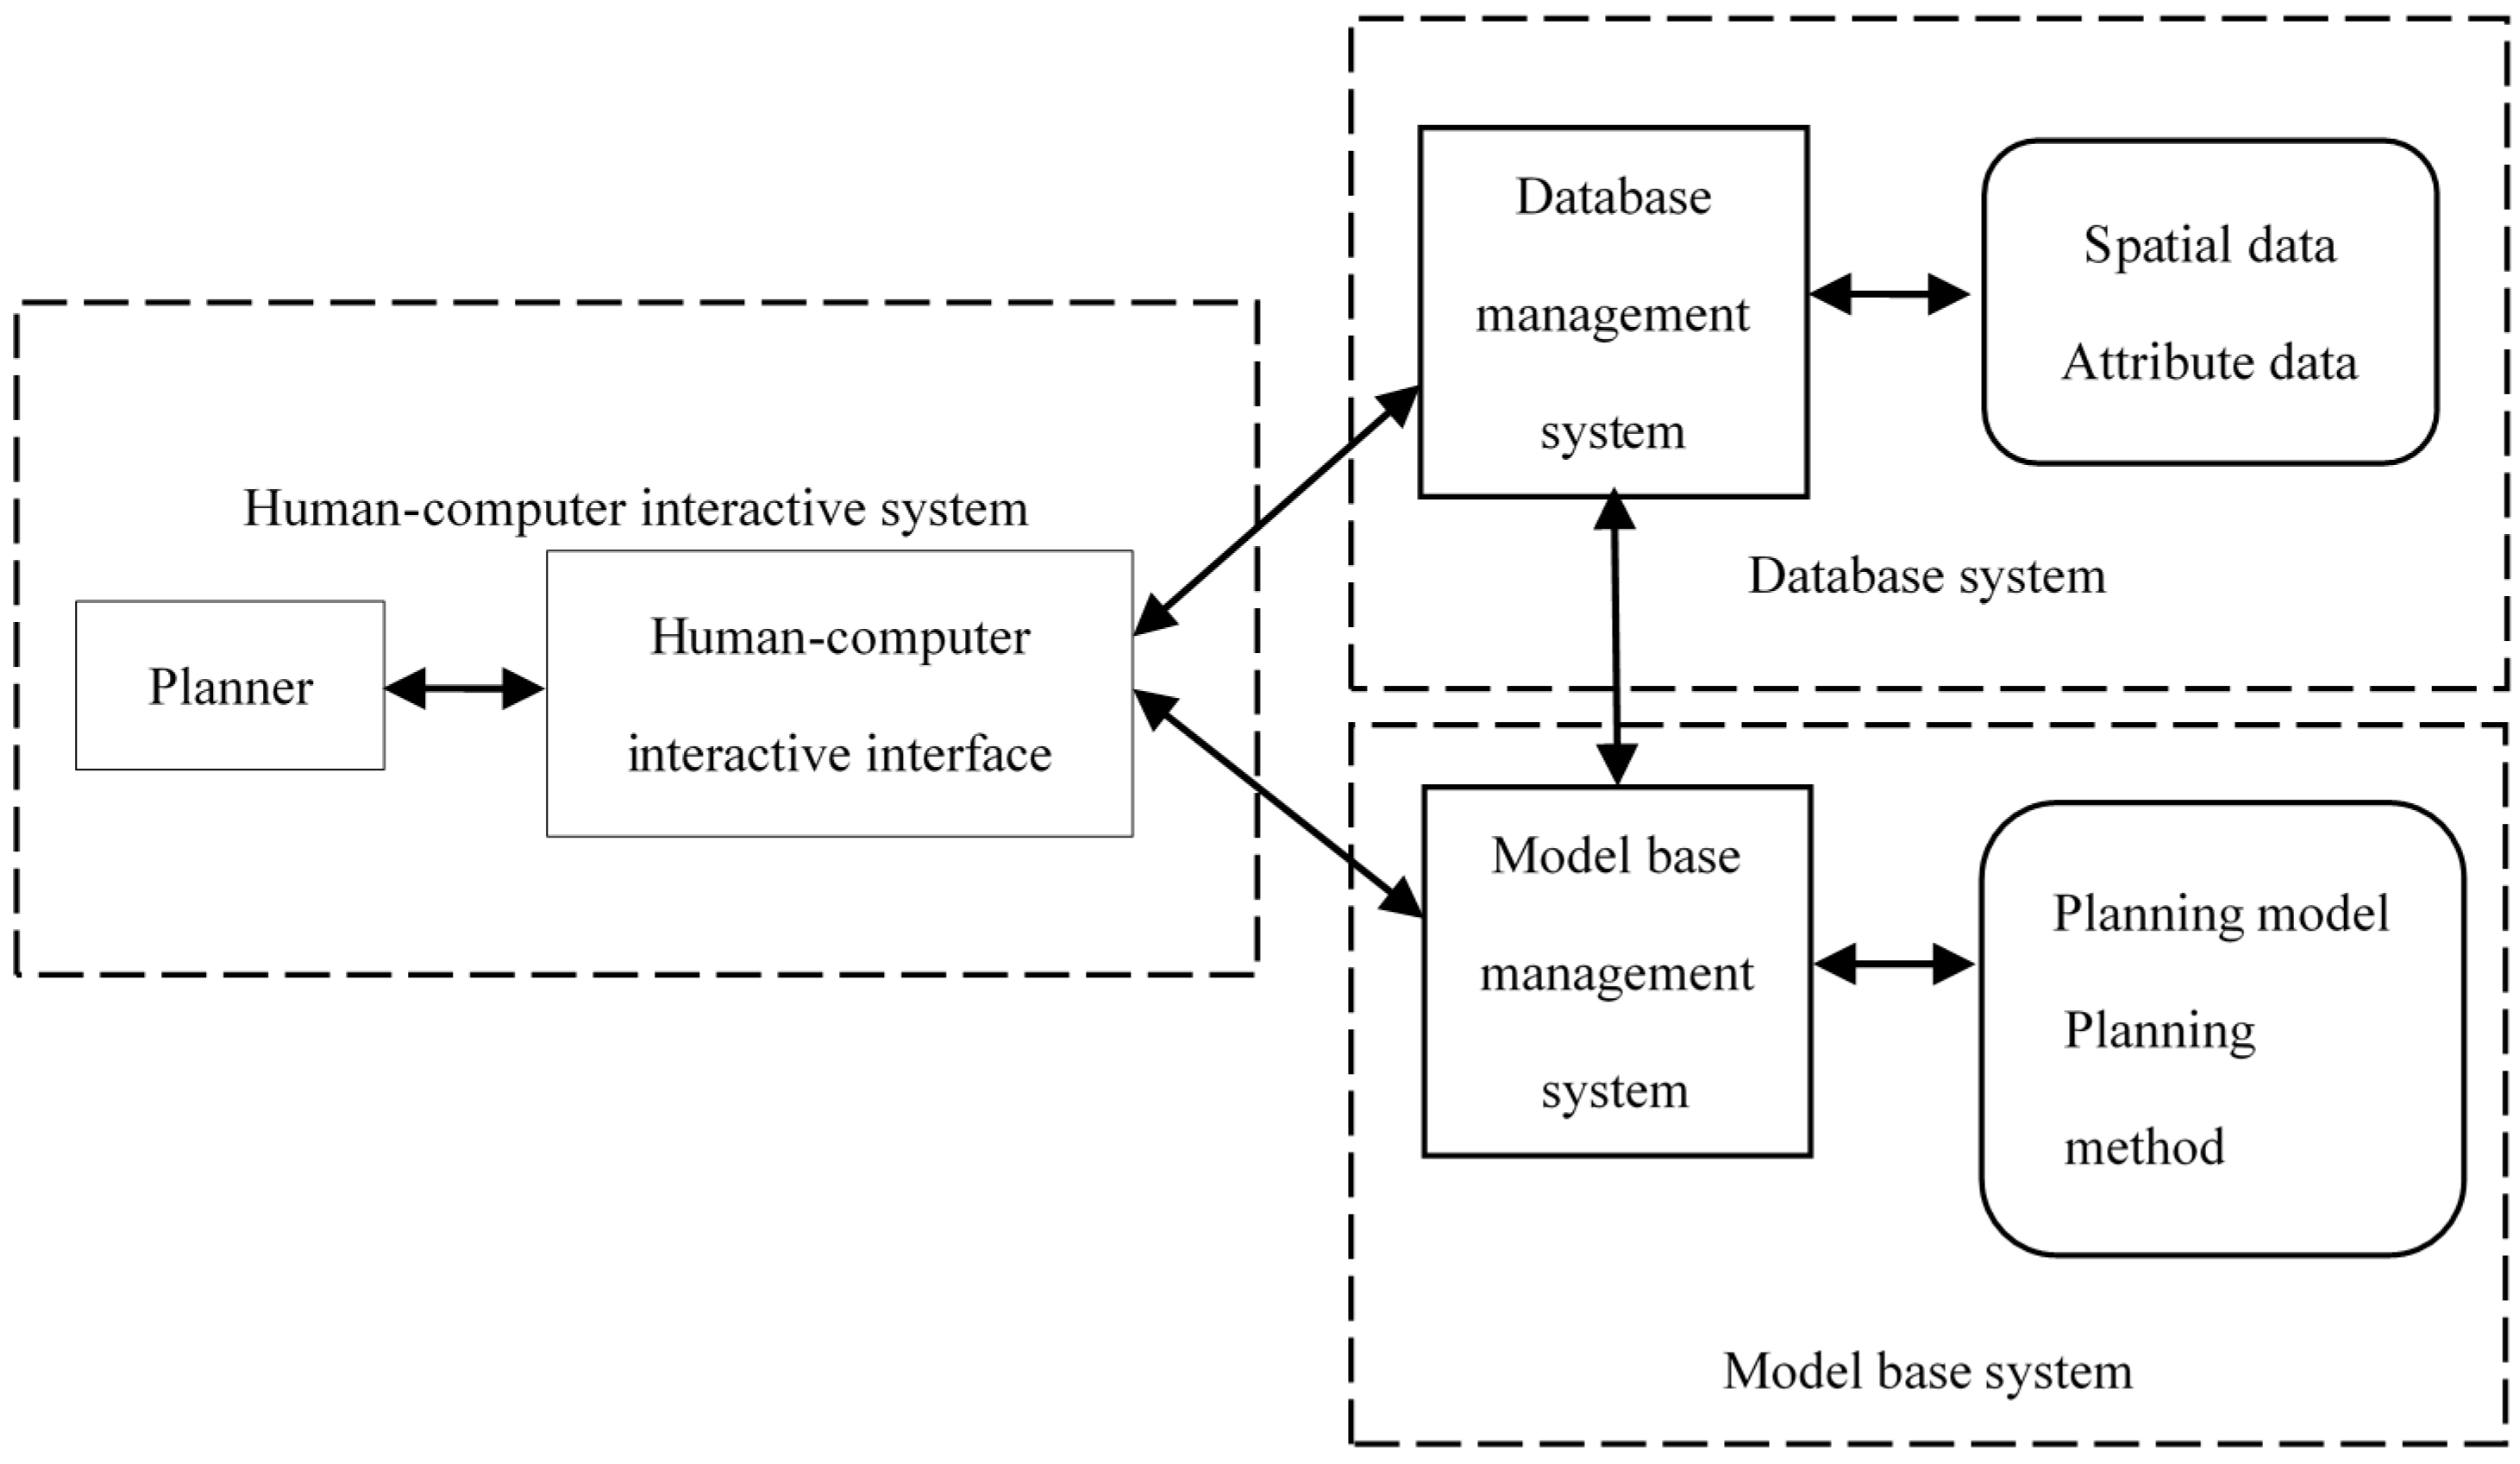
- The basic structure of PSS includes the database subsystem, model base subsystem, and human-computer interaction subsystem. The database subsystem mainly copes with comprehensive building concerning different data types. The model base subsystem mainly copes with model building, model algorithm and the integrated specialized model with GIS. The human-computer interactive subsystem mainly deals with the interactive communication between user and system, input and output, as well as the planning decision-making processes and results visualization. The model is the core of PSS. Without the model, PSS could neither provide planning decision support function, nor be an authentic PSS. At best, it could be a planning information system. According to the existing PSS, CUF integrates the population prediction model and spatial allocation model, “WHAT IF?” integrates the land suitability evaluation model, the land demand forecasting model and land use allocation model, and SLEUTH results from the cellular automata model. Thus, PSS is “model-driven”. There would be no PSS without a planning decision model.
2.2. RMFA Principles
2.2.1. RMFA Planning Model
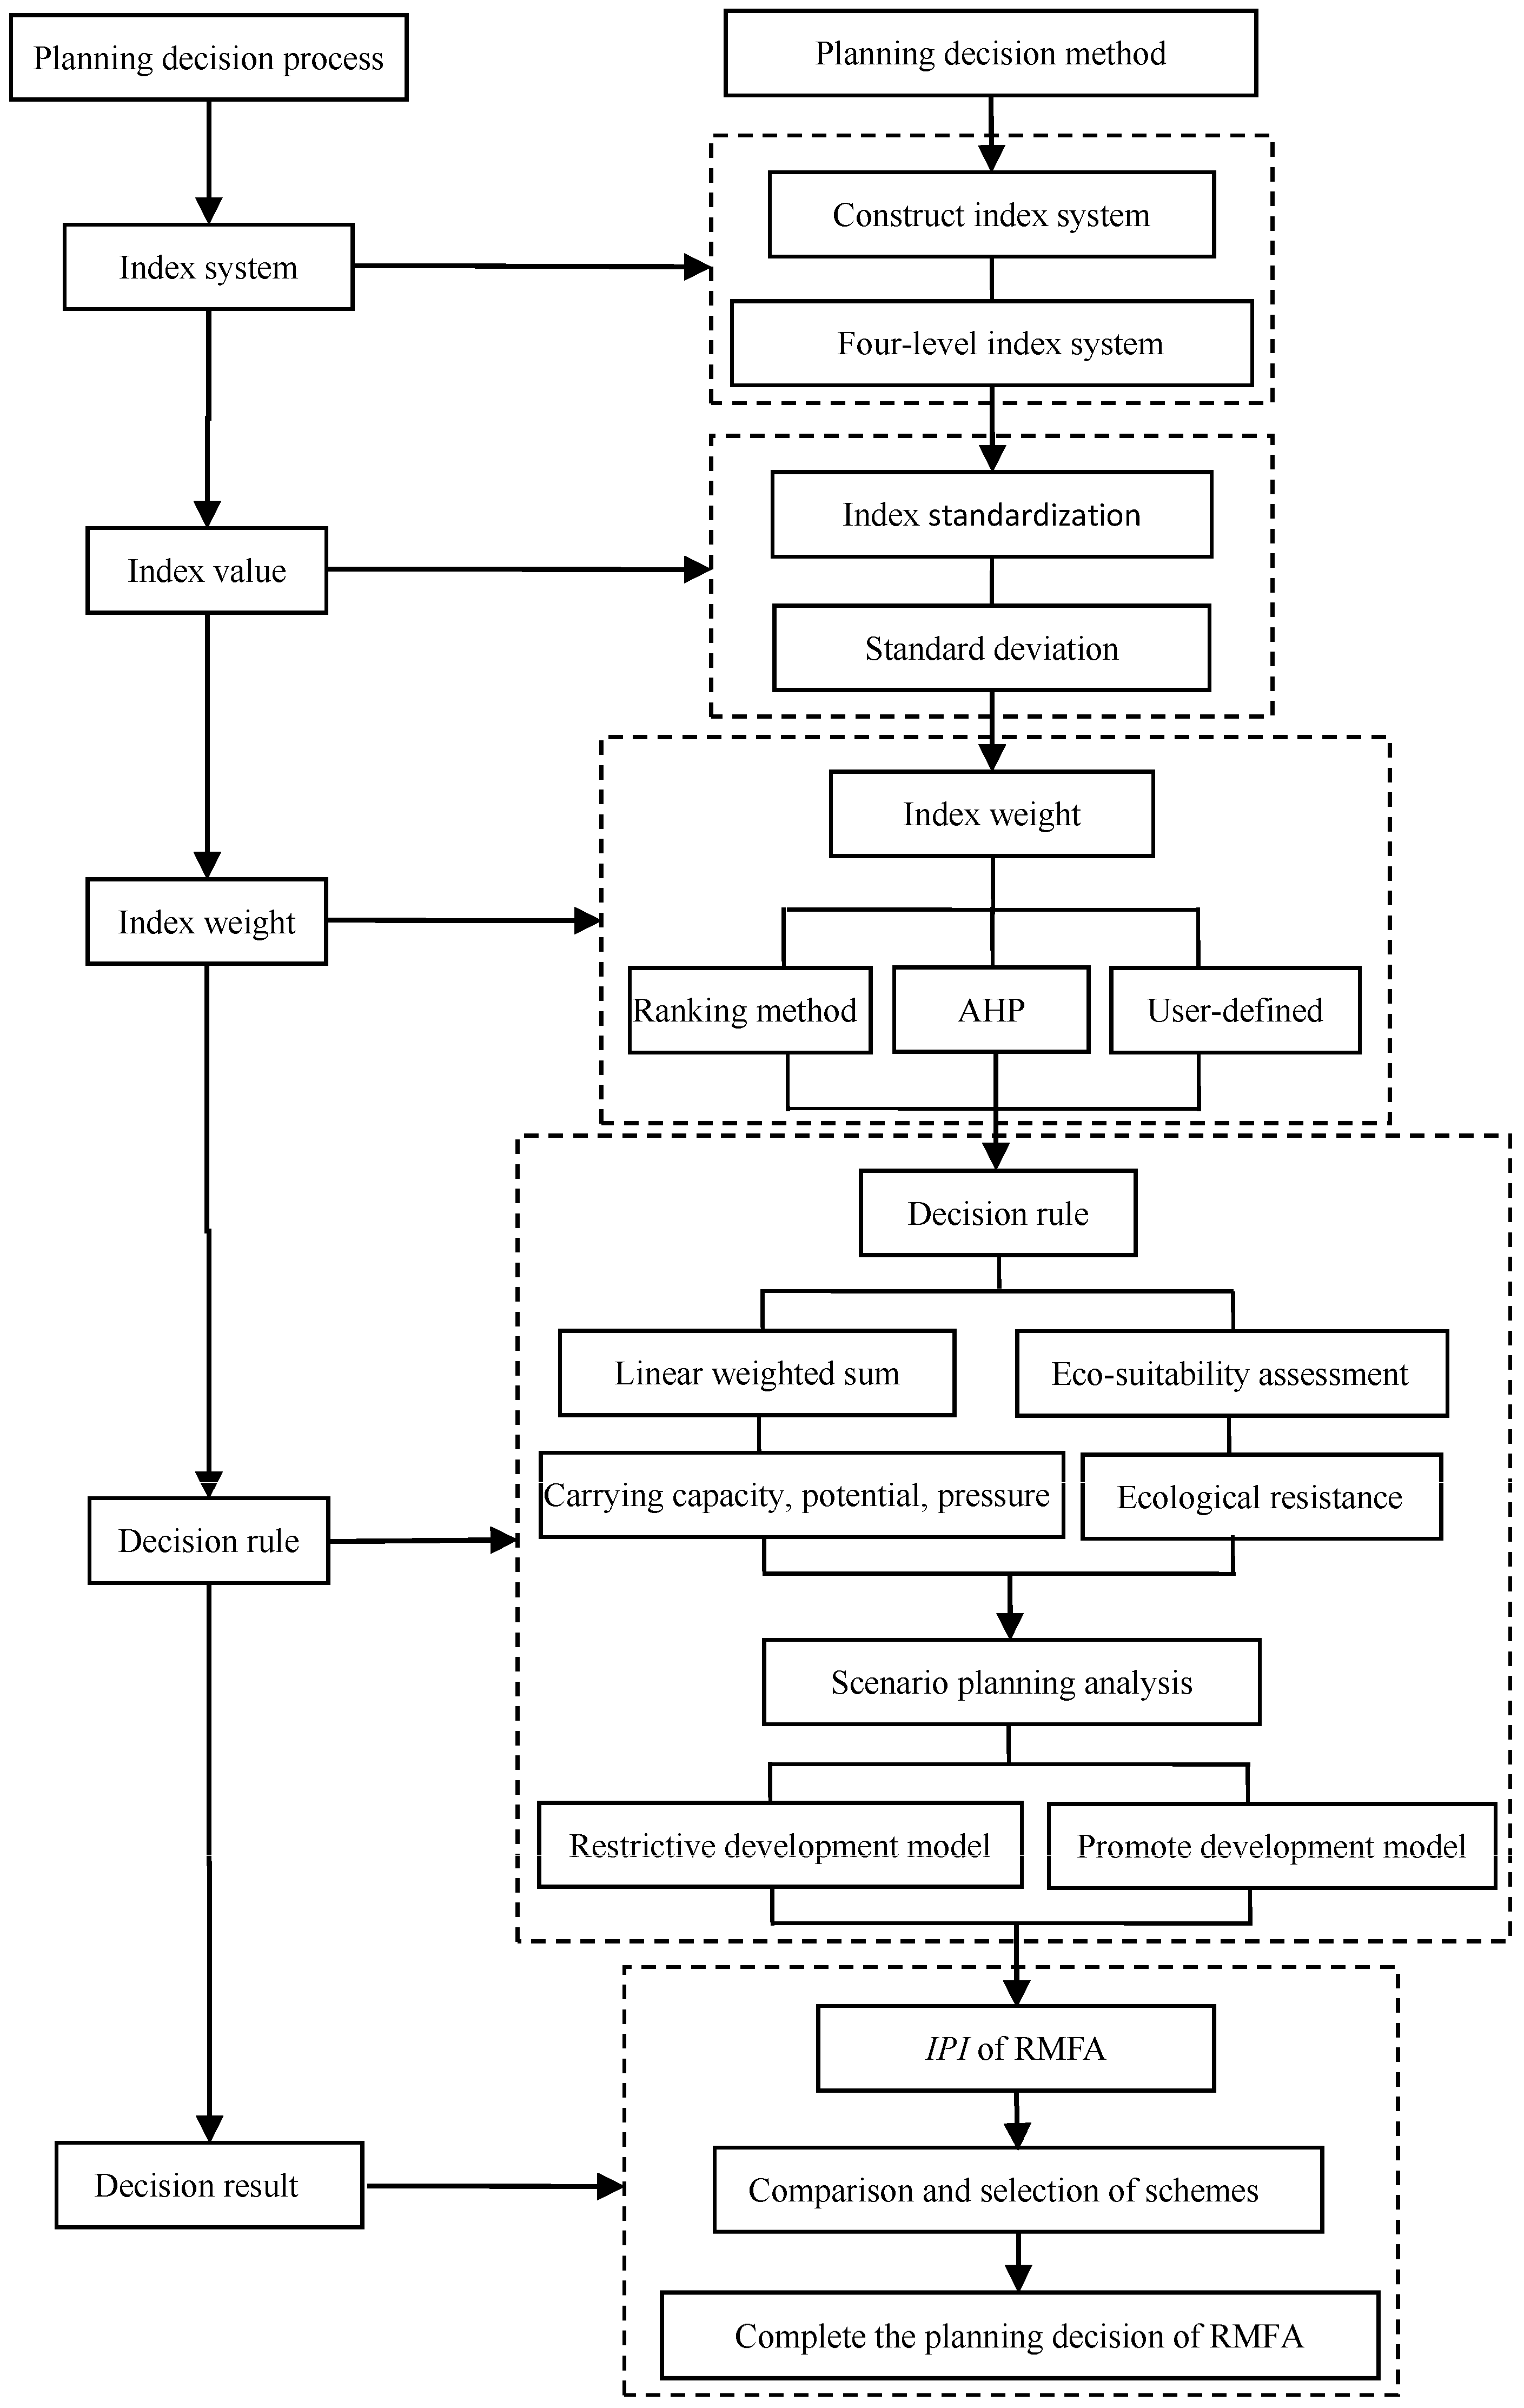
2.2.2. RMFA Planning Methods
3. Development of RMFA-PSS
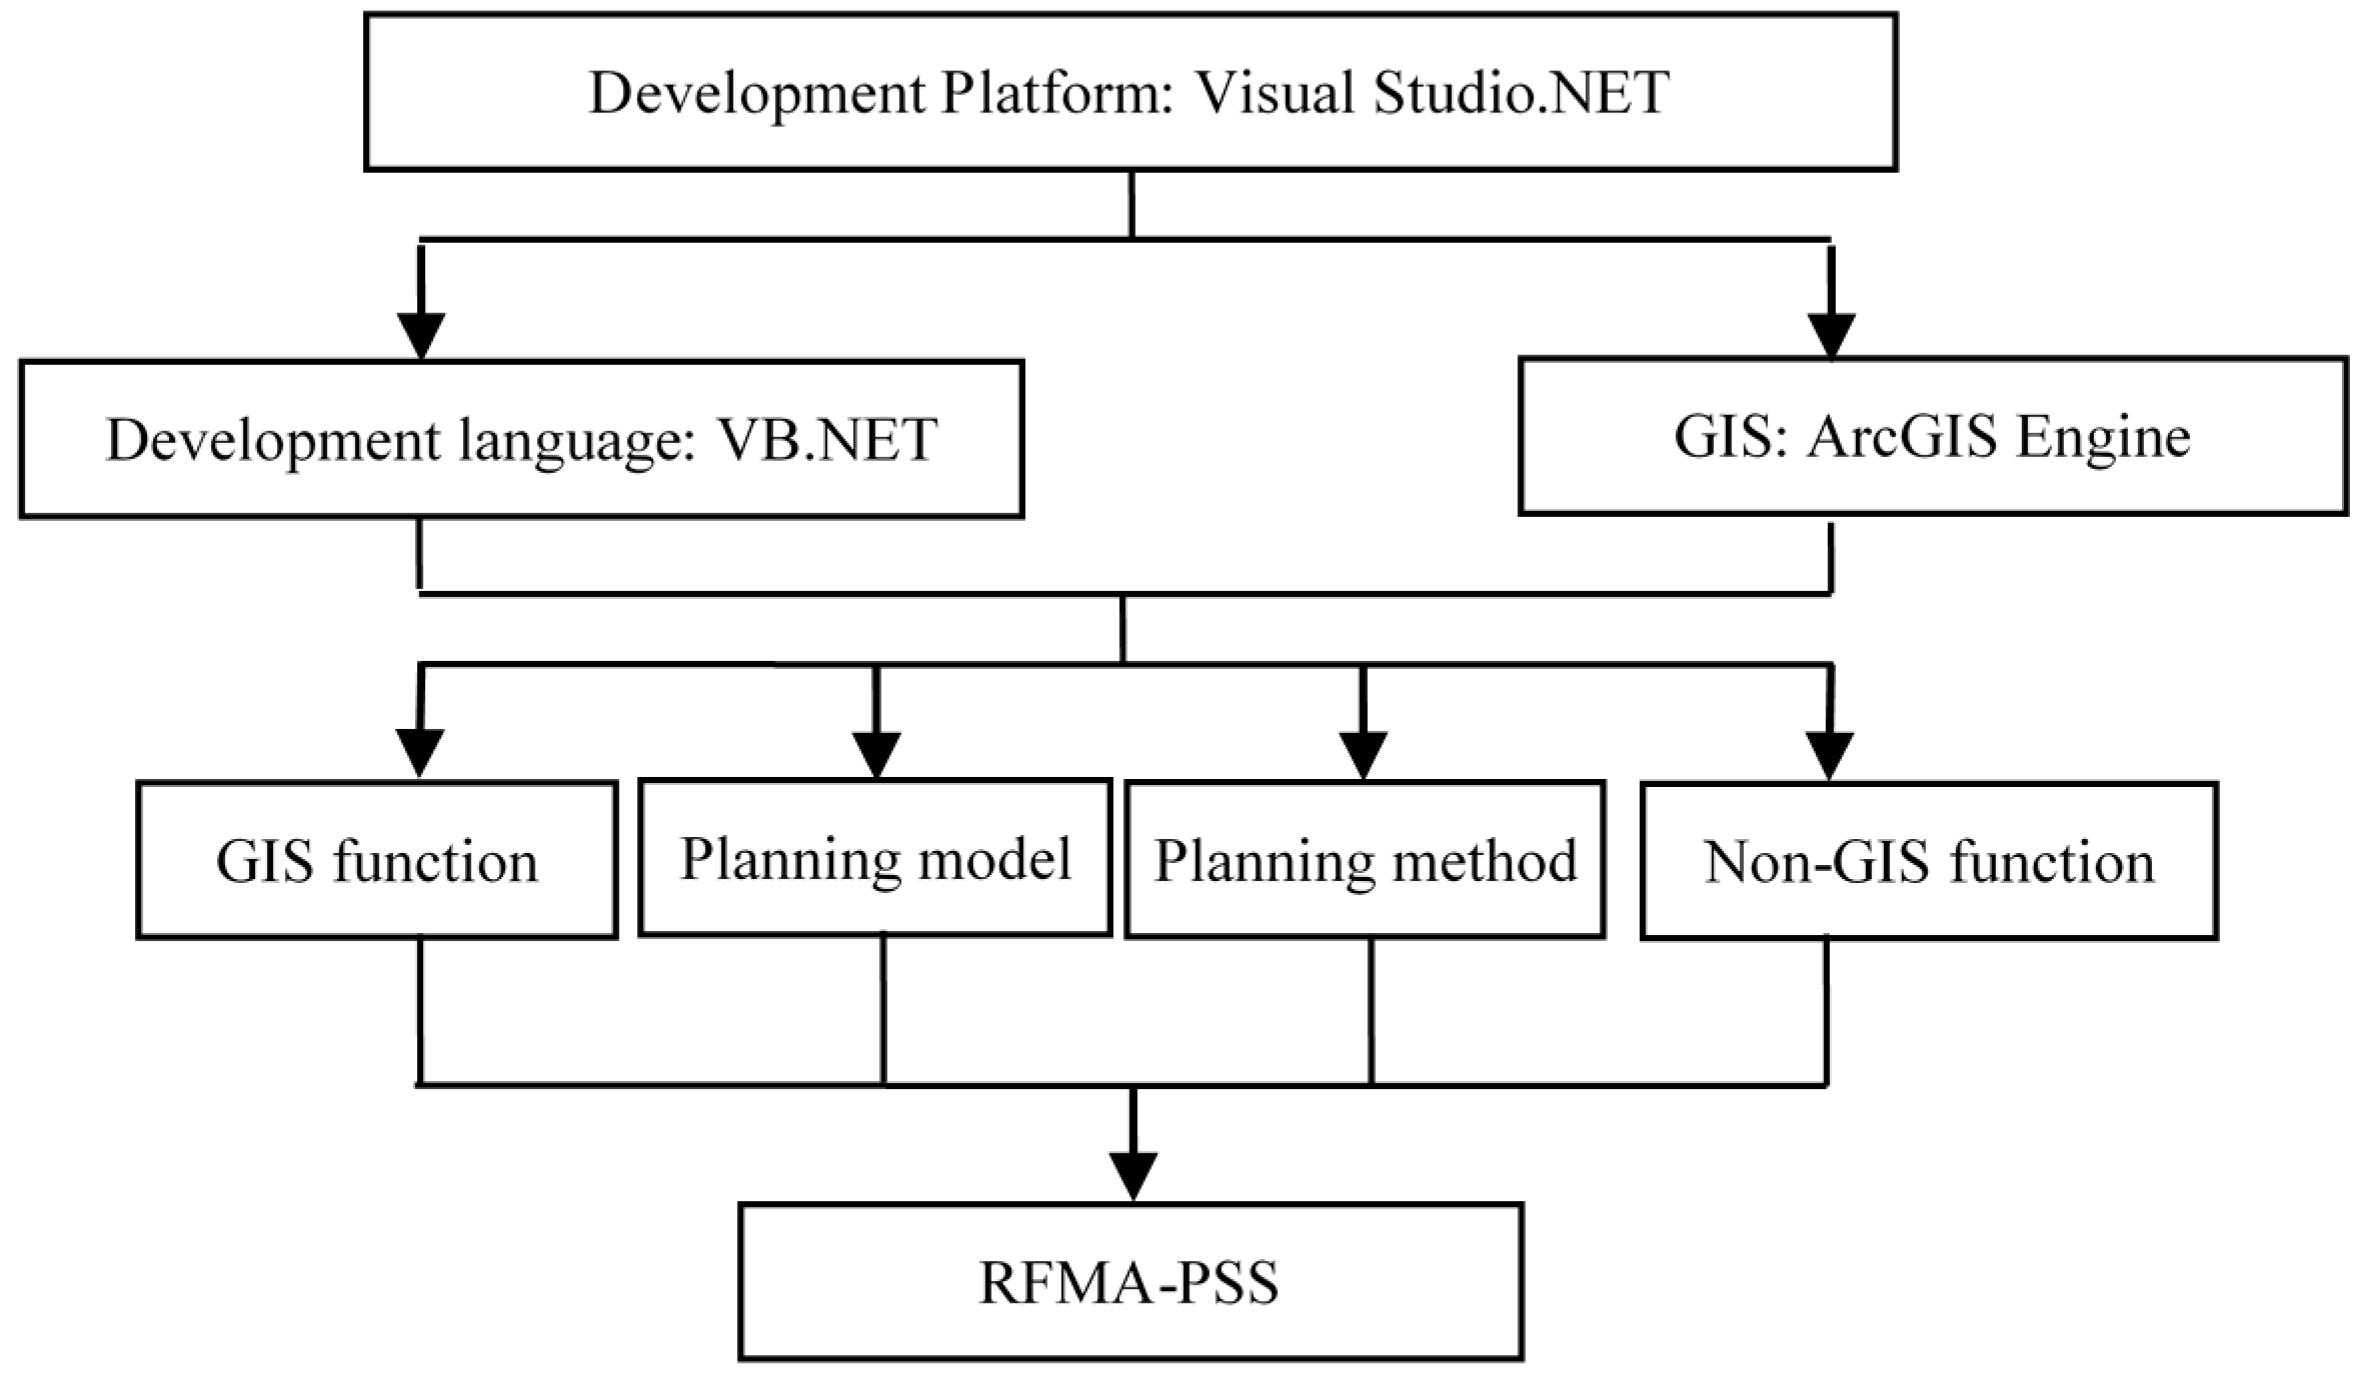
3.1. Development Platform
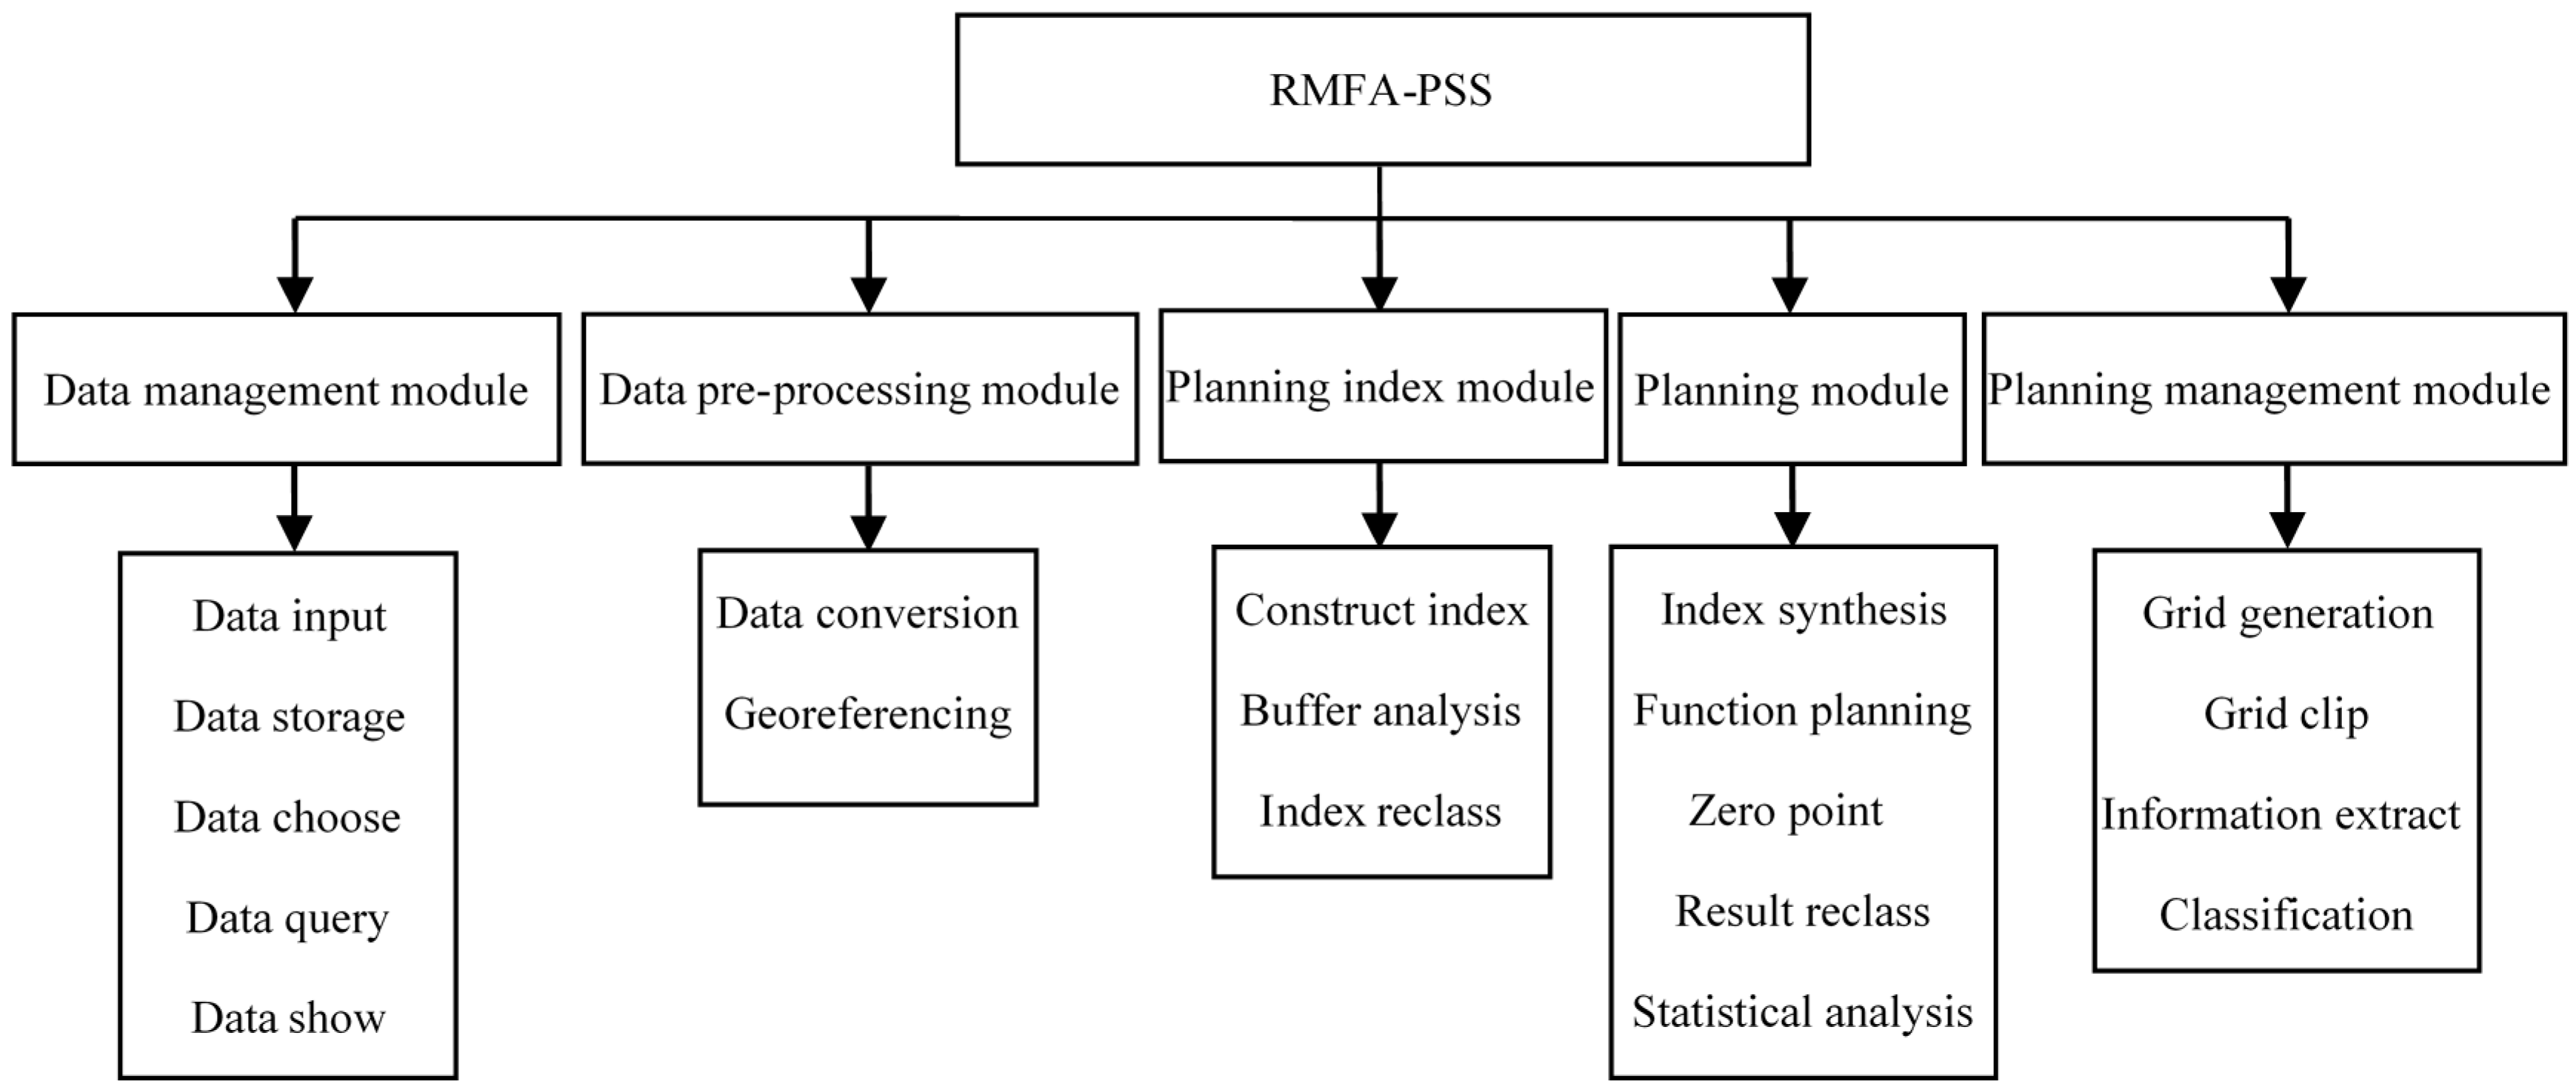
3.2. Structure of RMFA-PSS
3.3. Functions of RMFA-PSS
3.4. Summary of RMFA-PSS
4. Application of RMFA-PSS
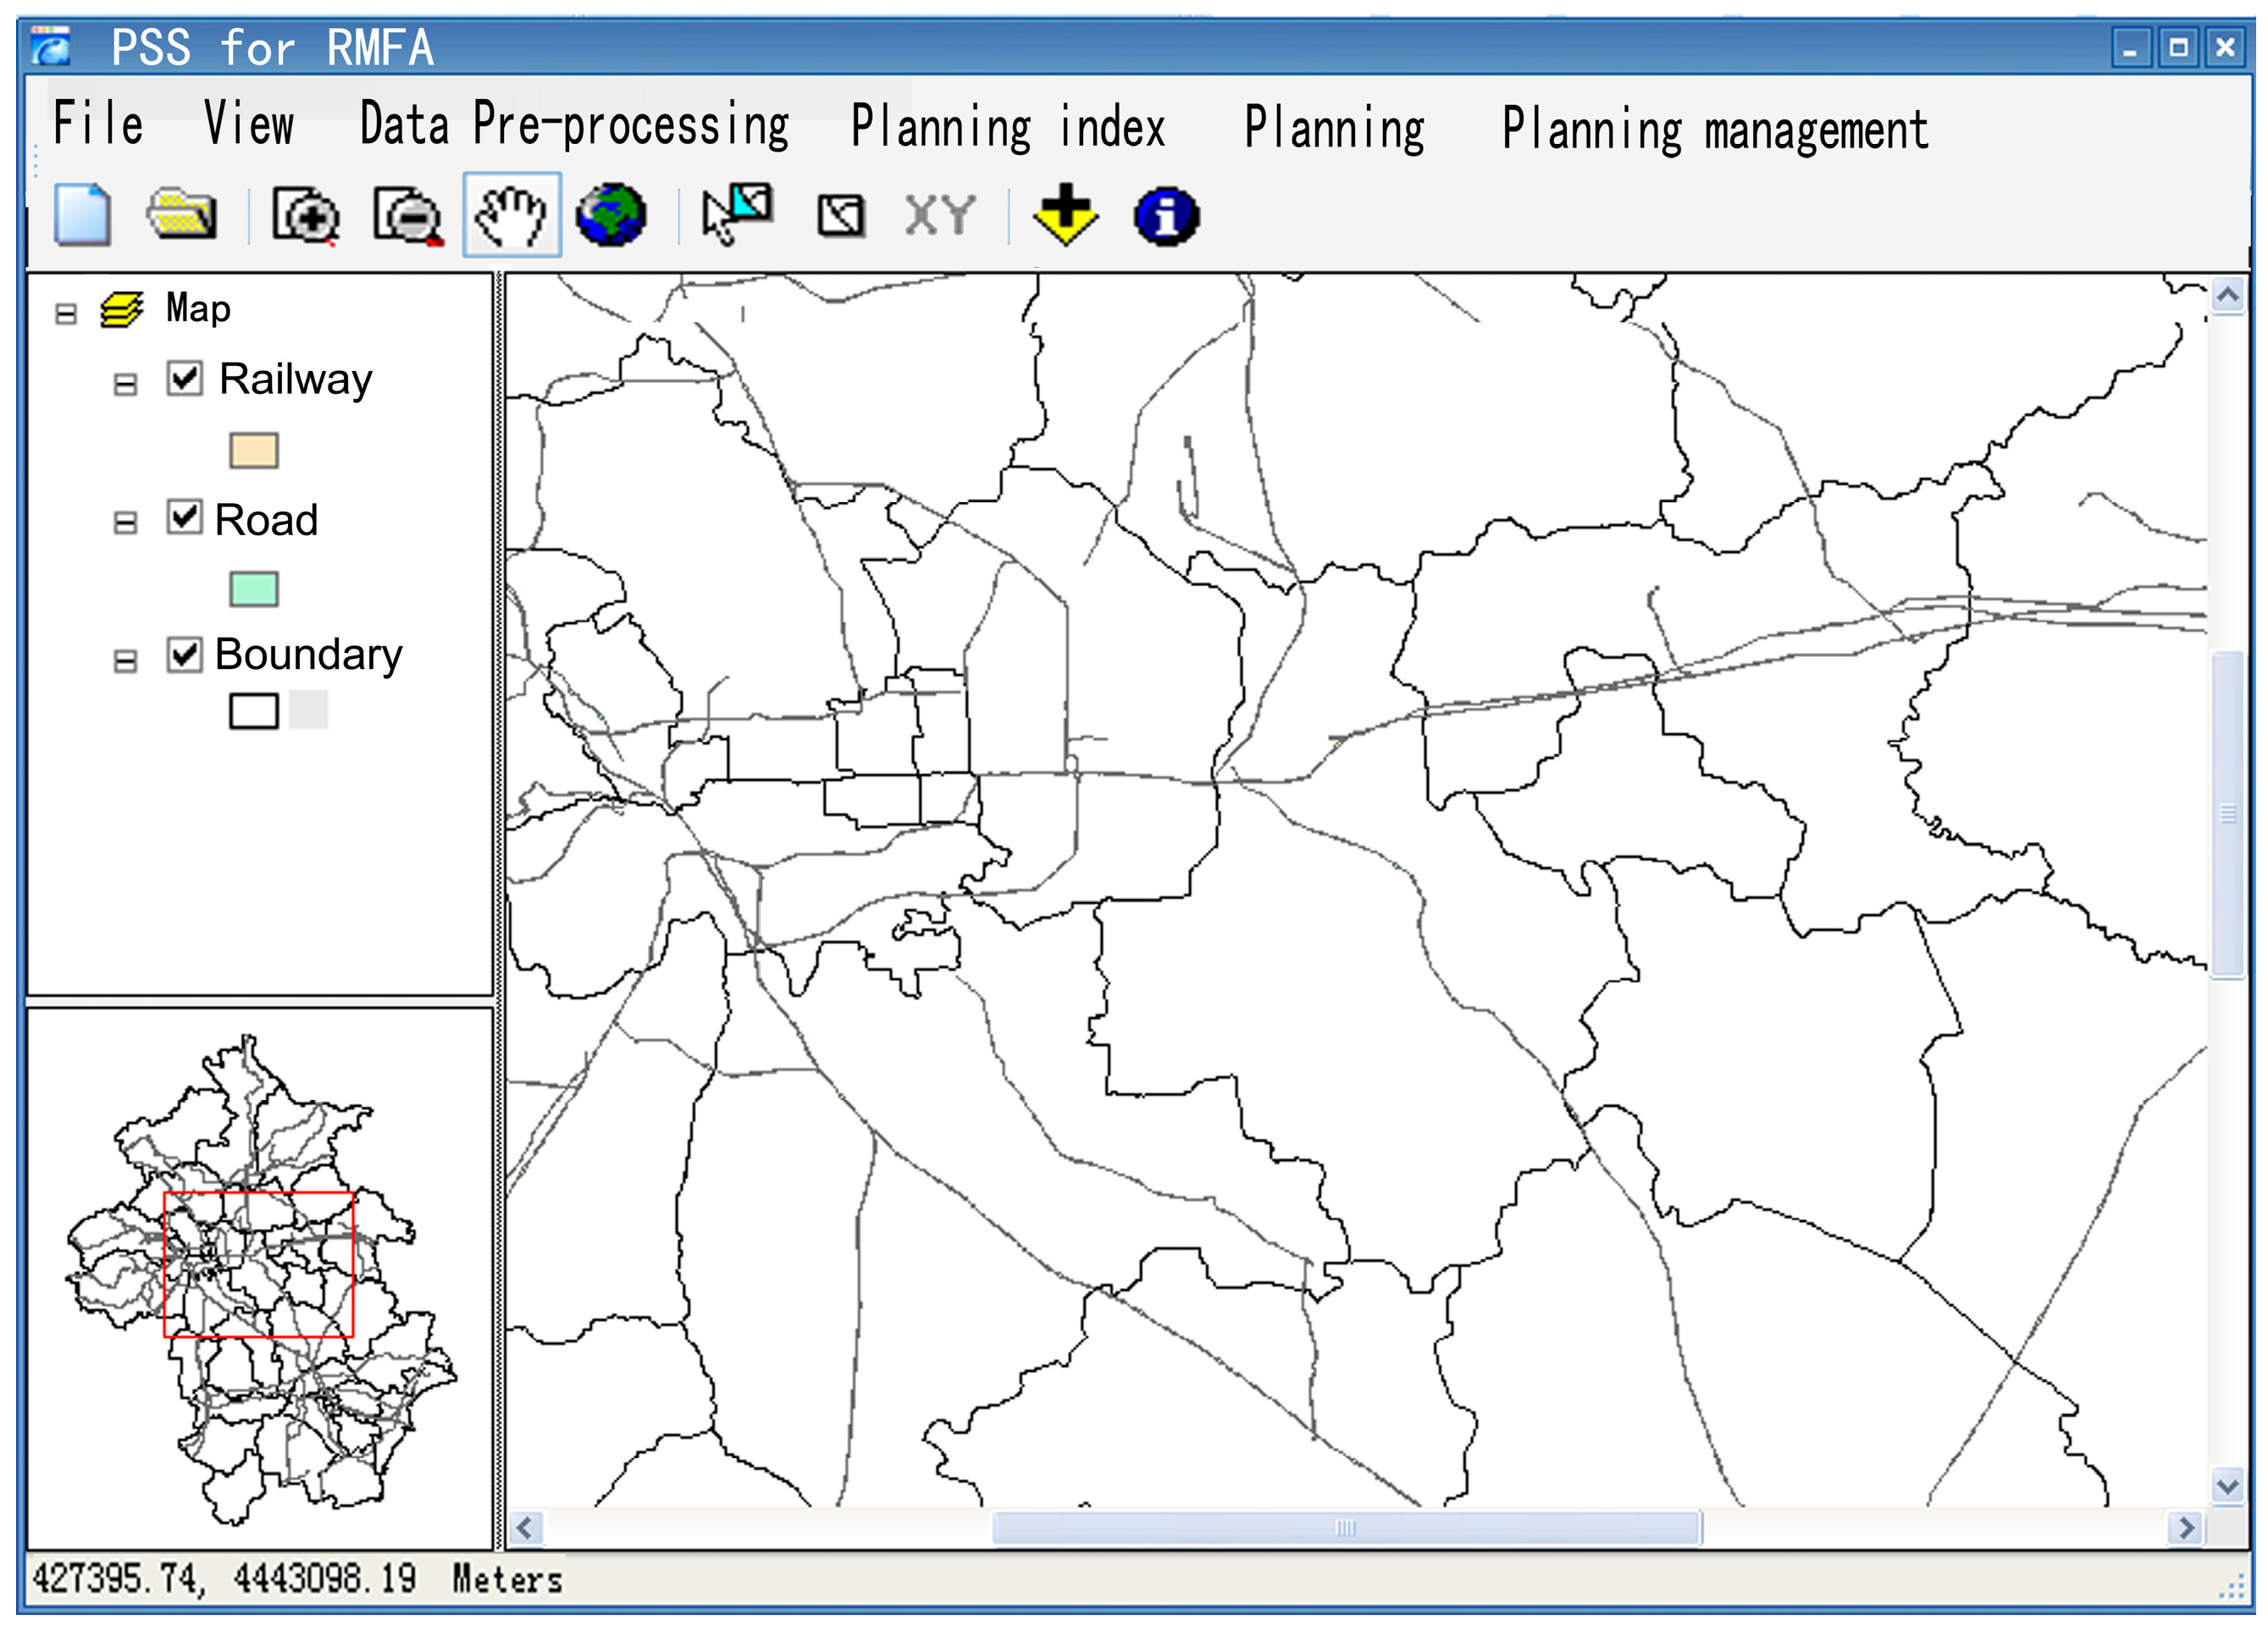
4.1. Study Area and Data
4.2. RMFA-PSS Operation
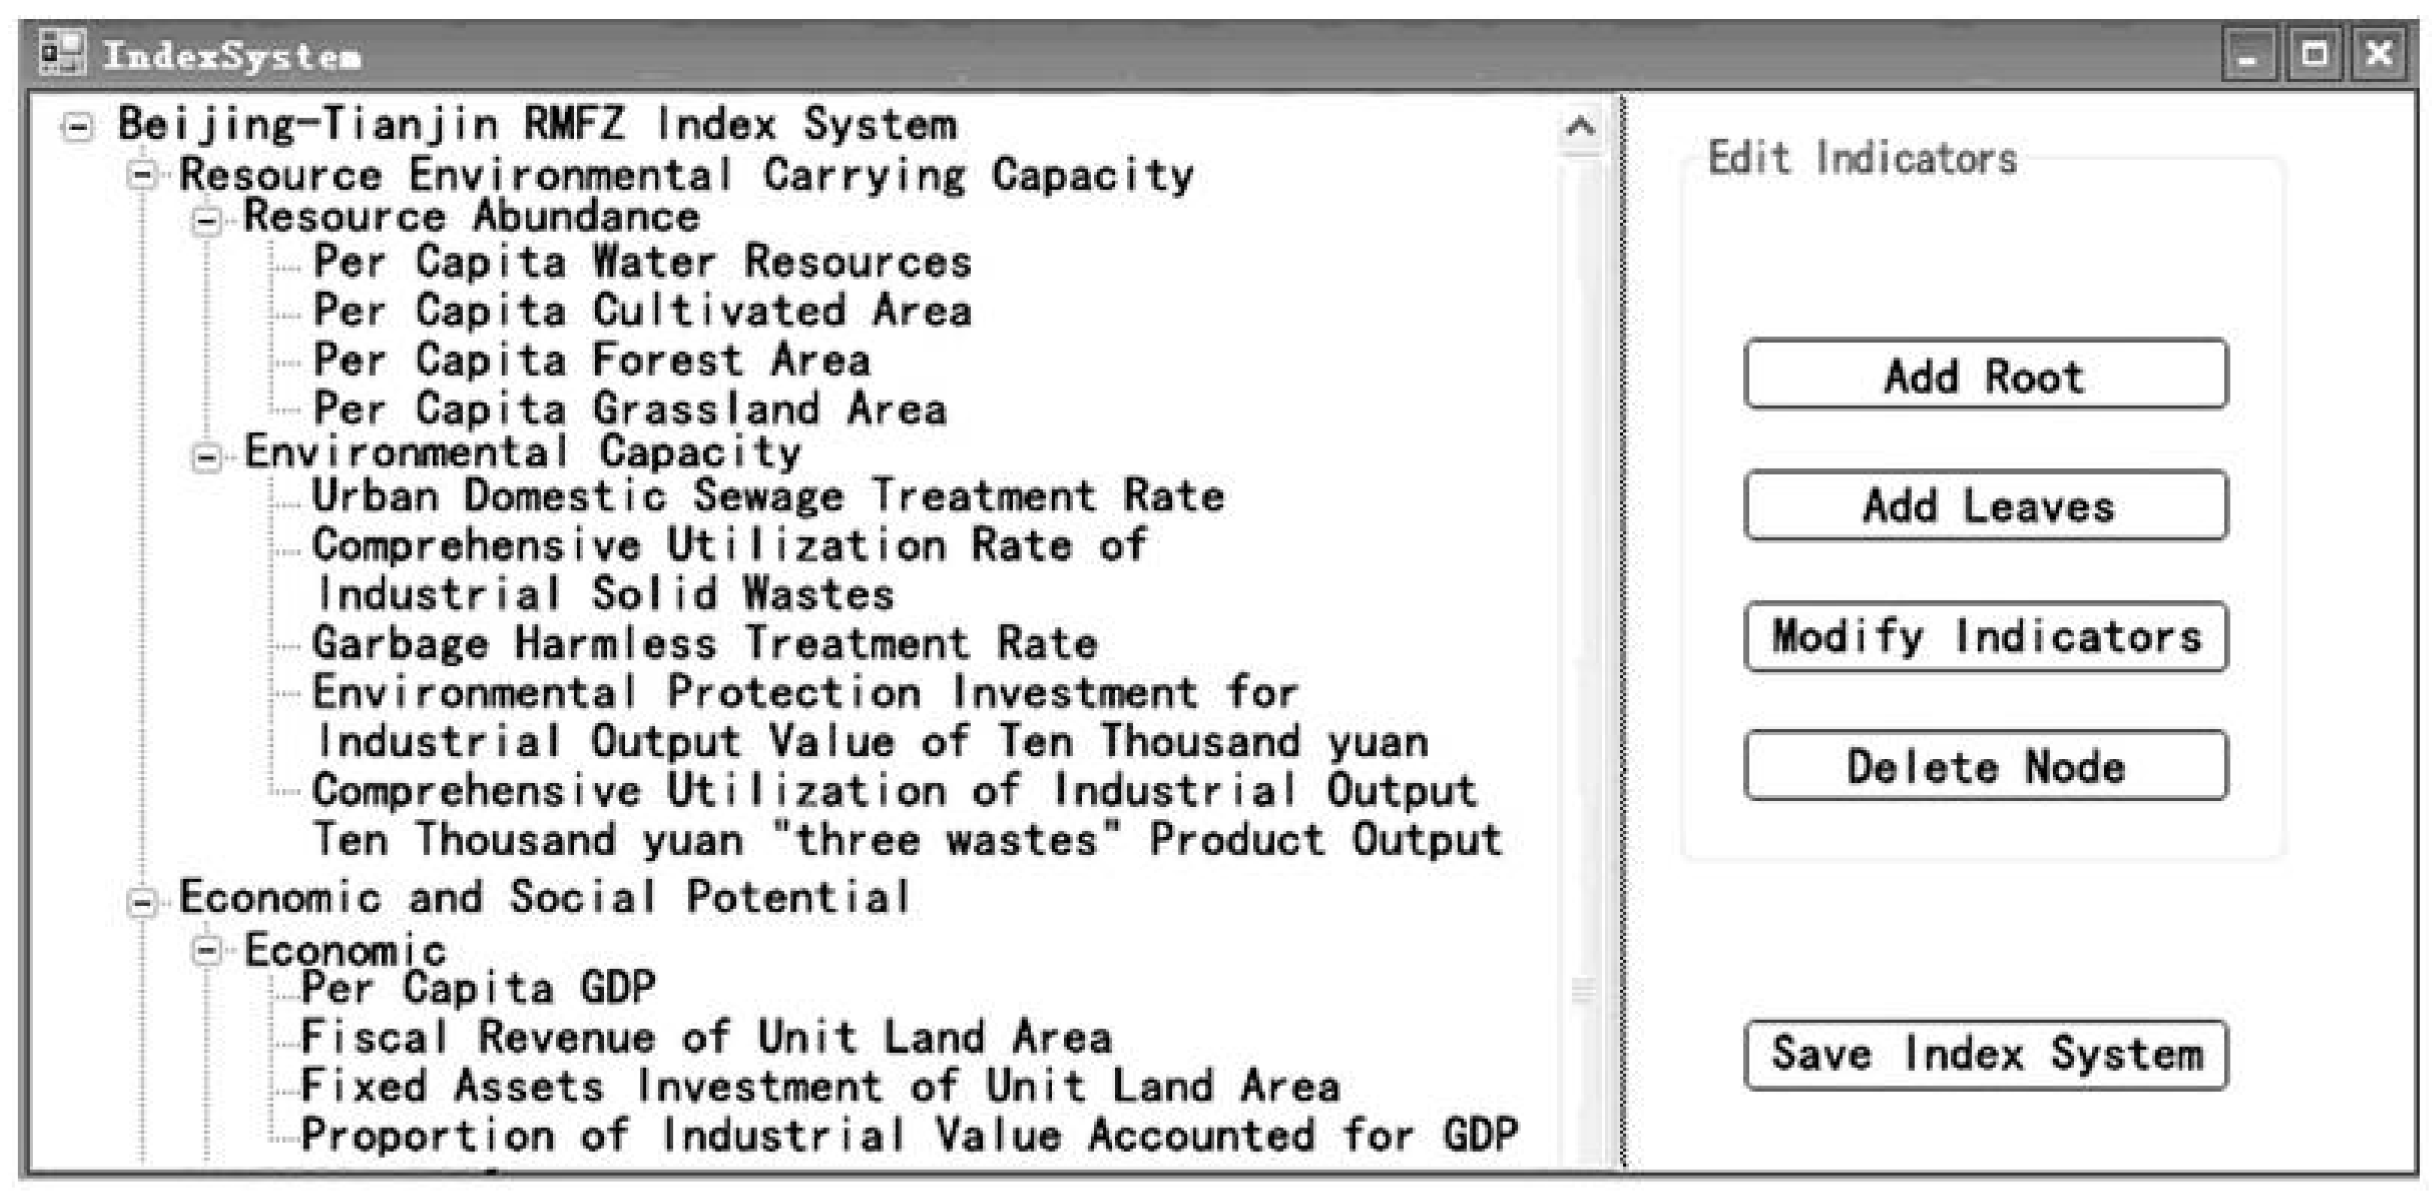
4.2.1. Index System
4.2.2. Force Calculation
- (1)
- Index rasterization. By using “index rasterization” command in “planning index” menu, the nine resource-environmental carrying capacity indexes are converted into the rasterized data in IMG format and saved respectively. The resolution set is 30 m in order to be consistent with the resolution of ETM images of the study area.
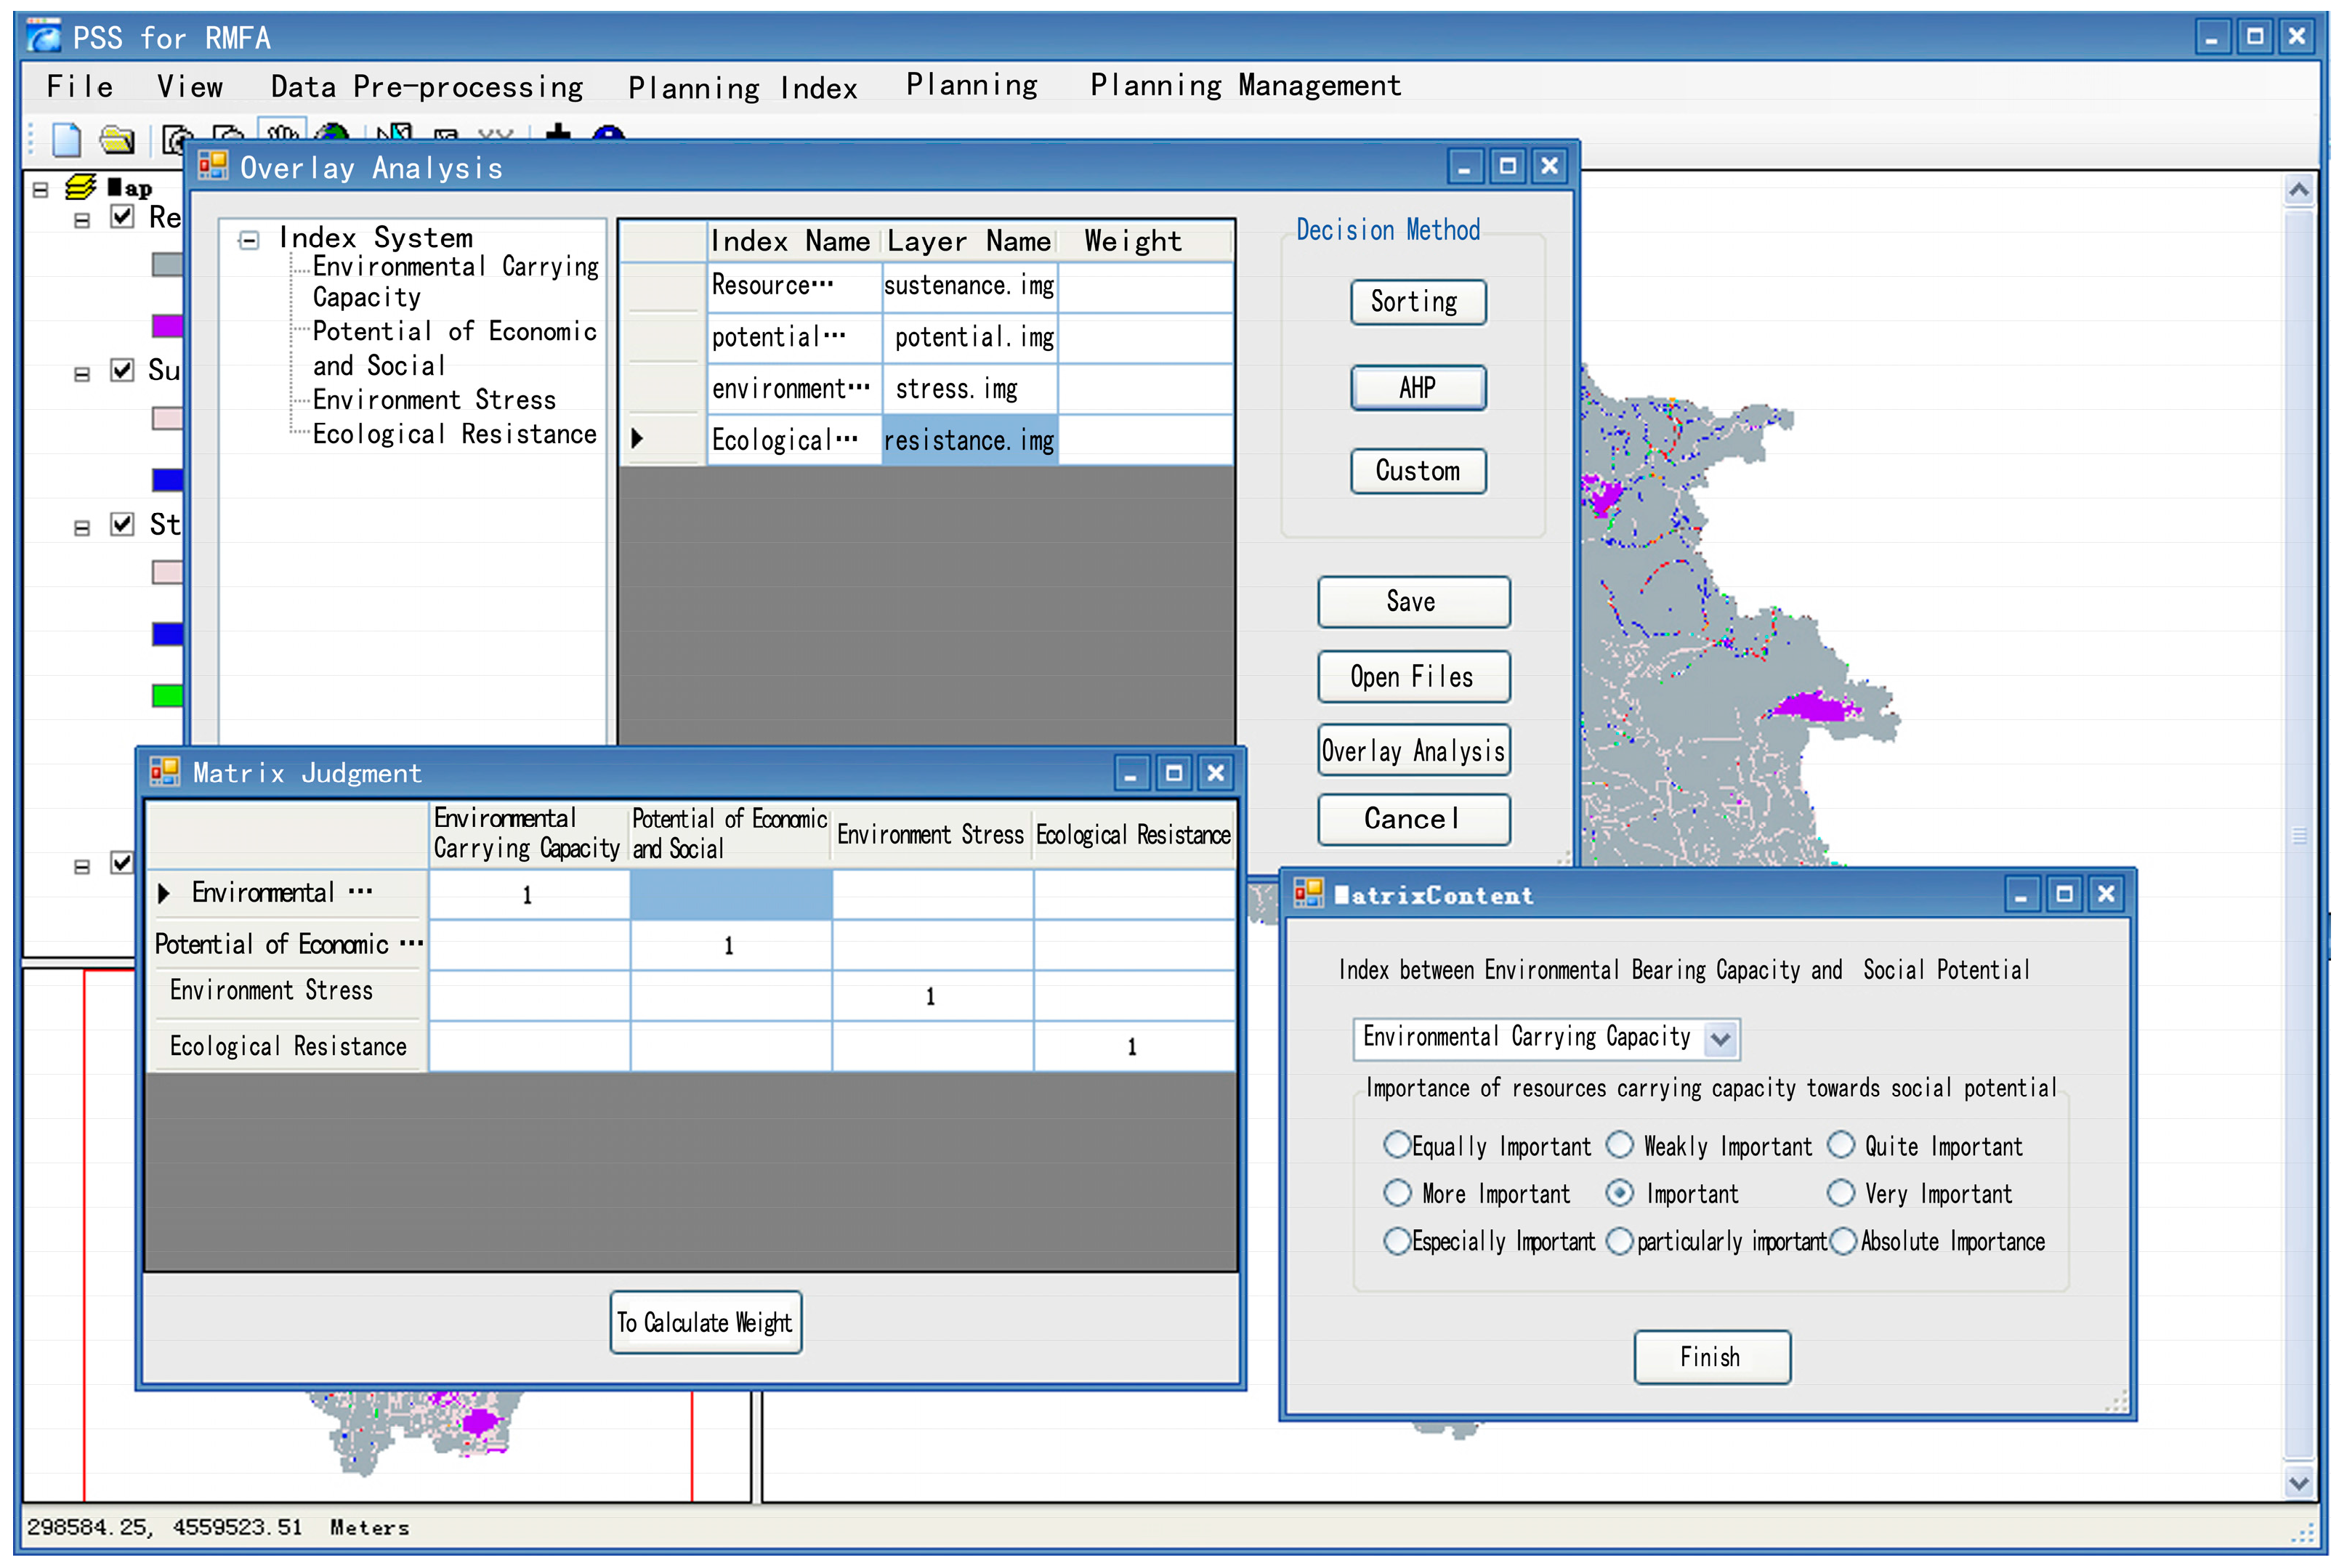
- (2)
- Index overlay synthesis. The “index synthesis” command in “planning” menu can be the completed index data loading, the index weight calculation, the index overlay analysis, and a series of other decision-making analyses (Figure 9).
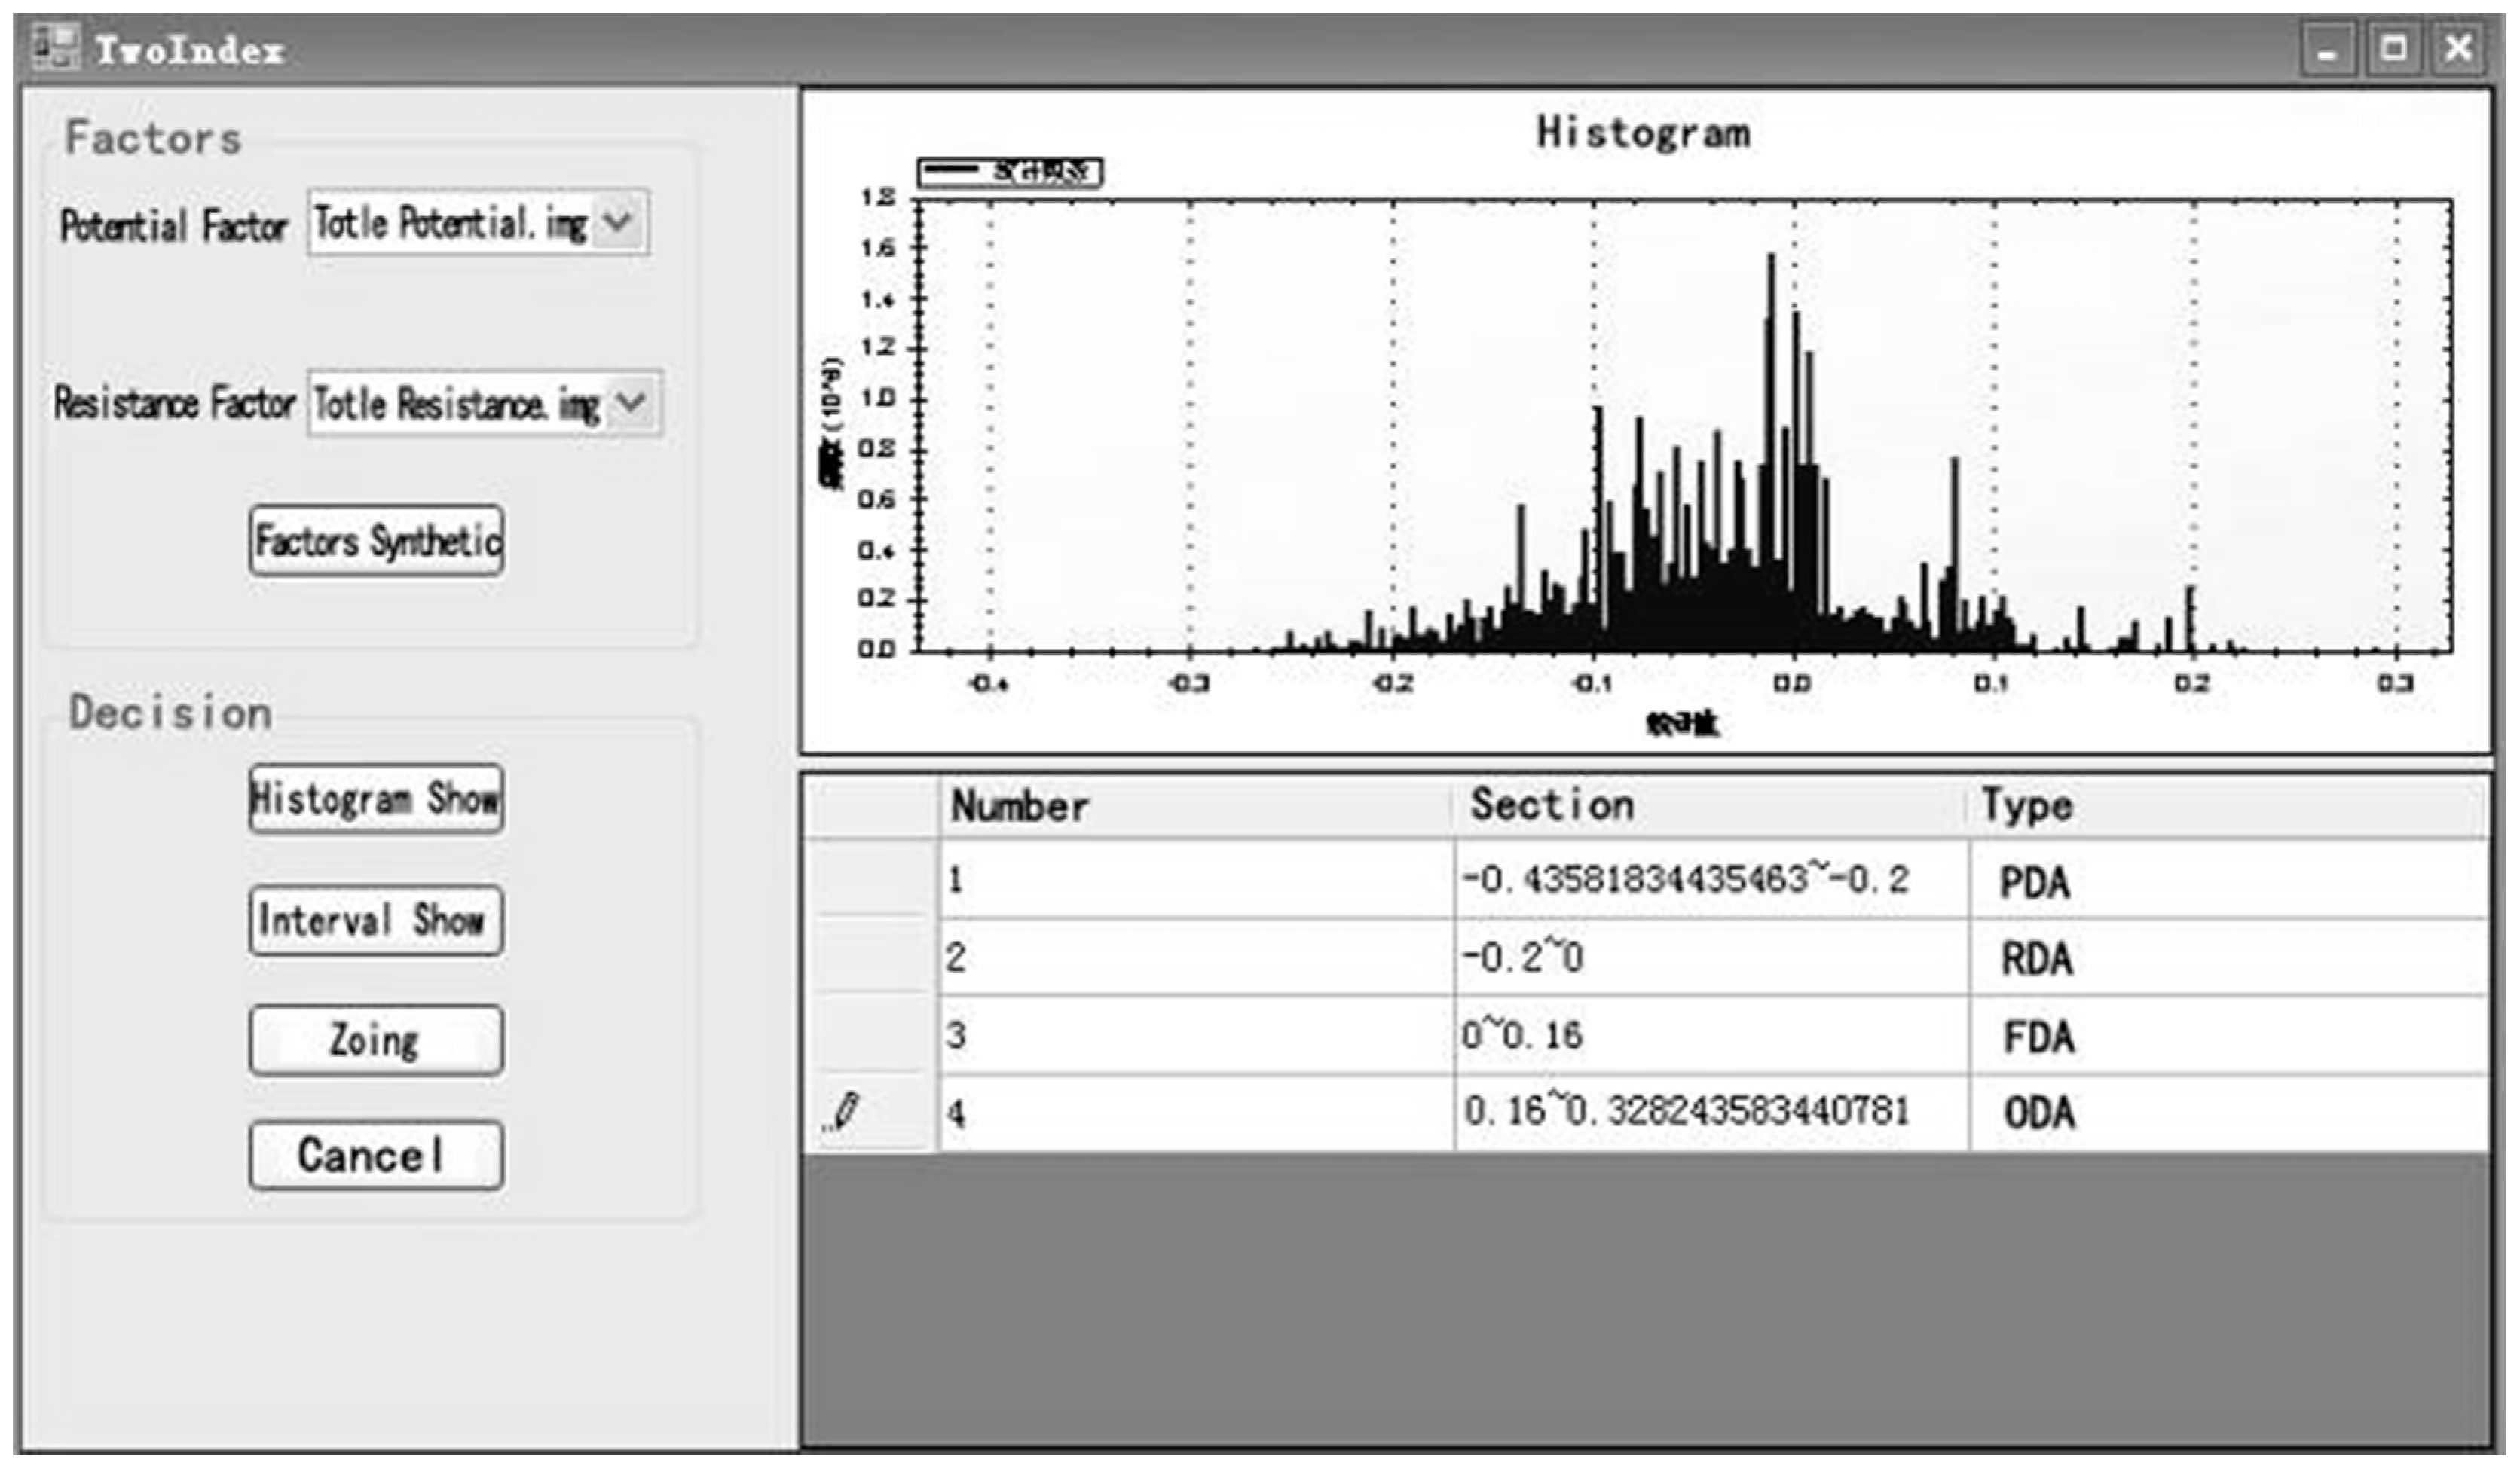
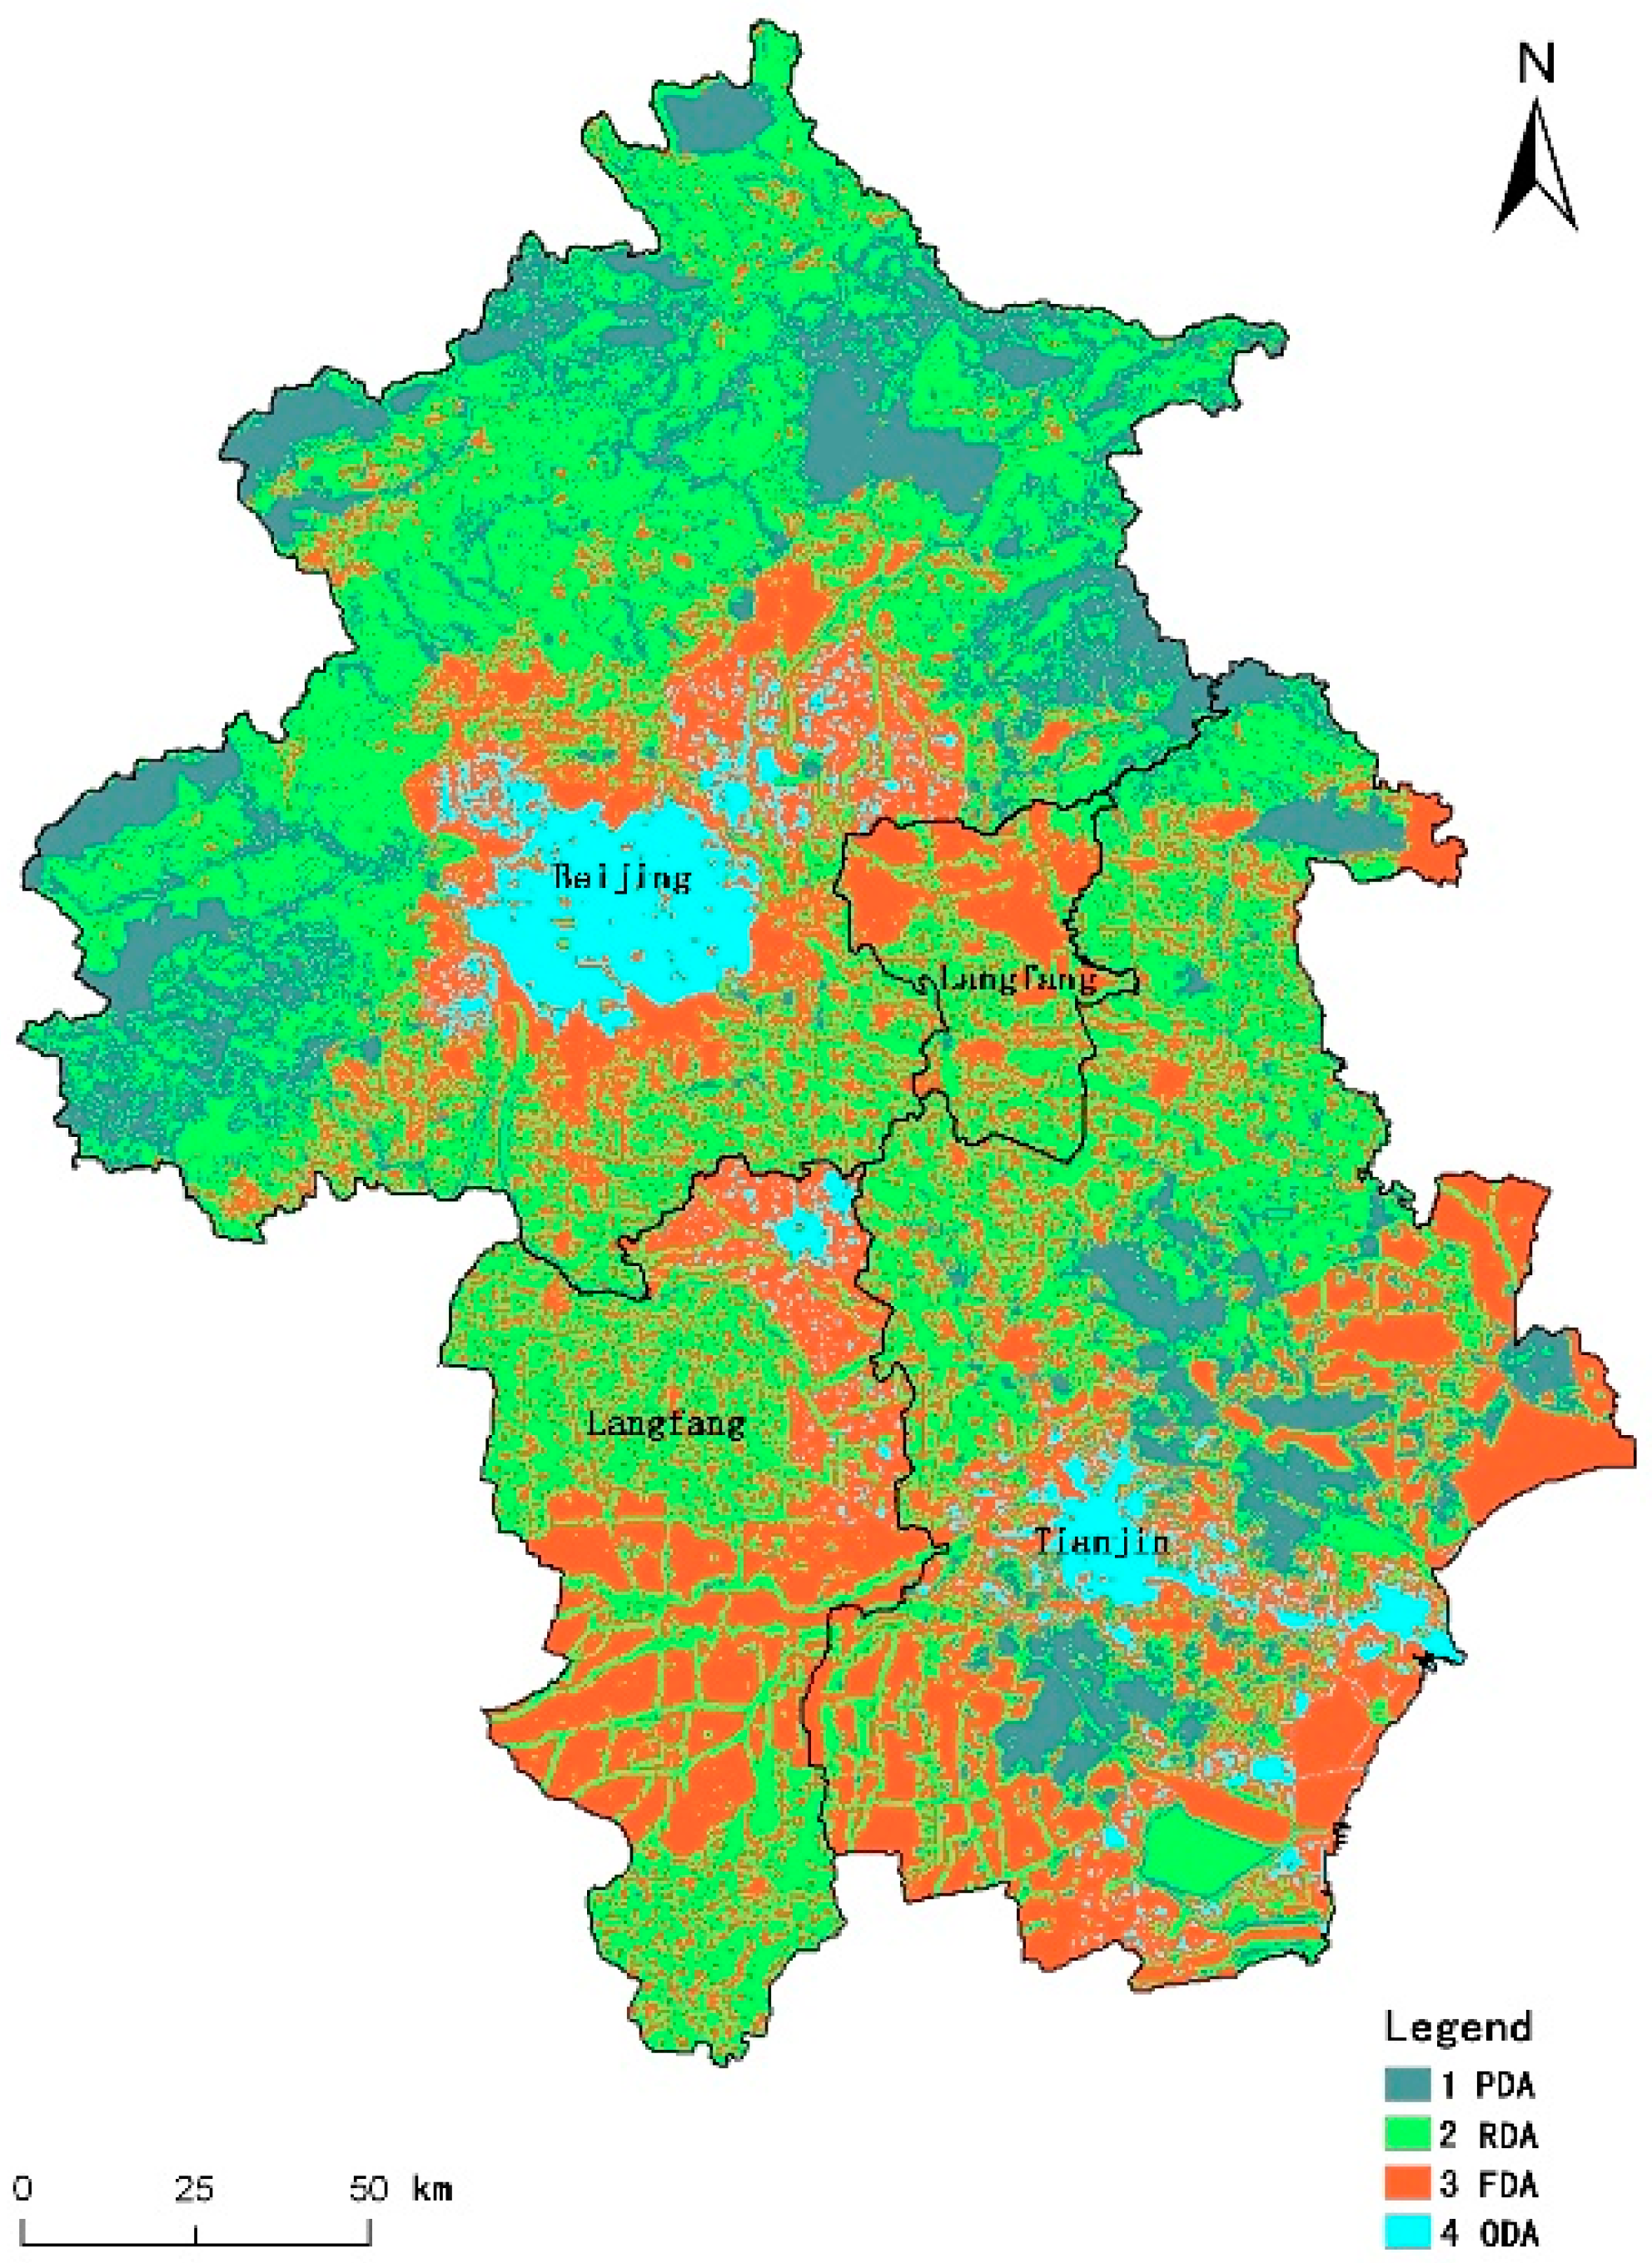
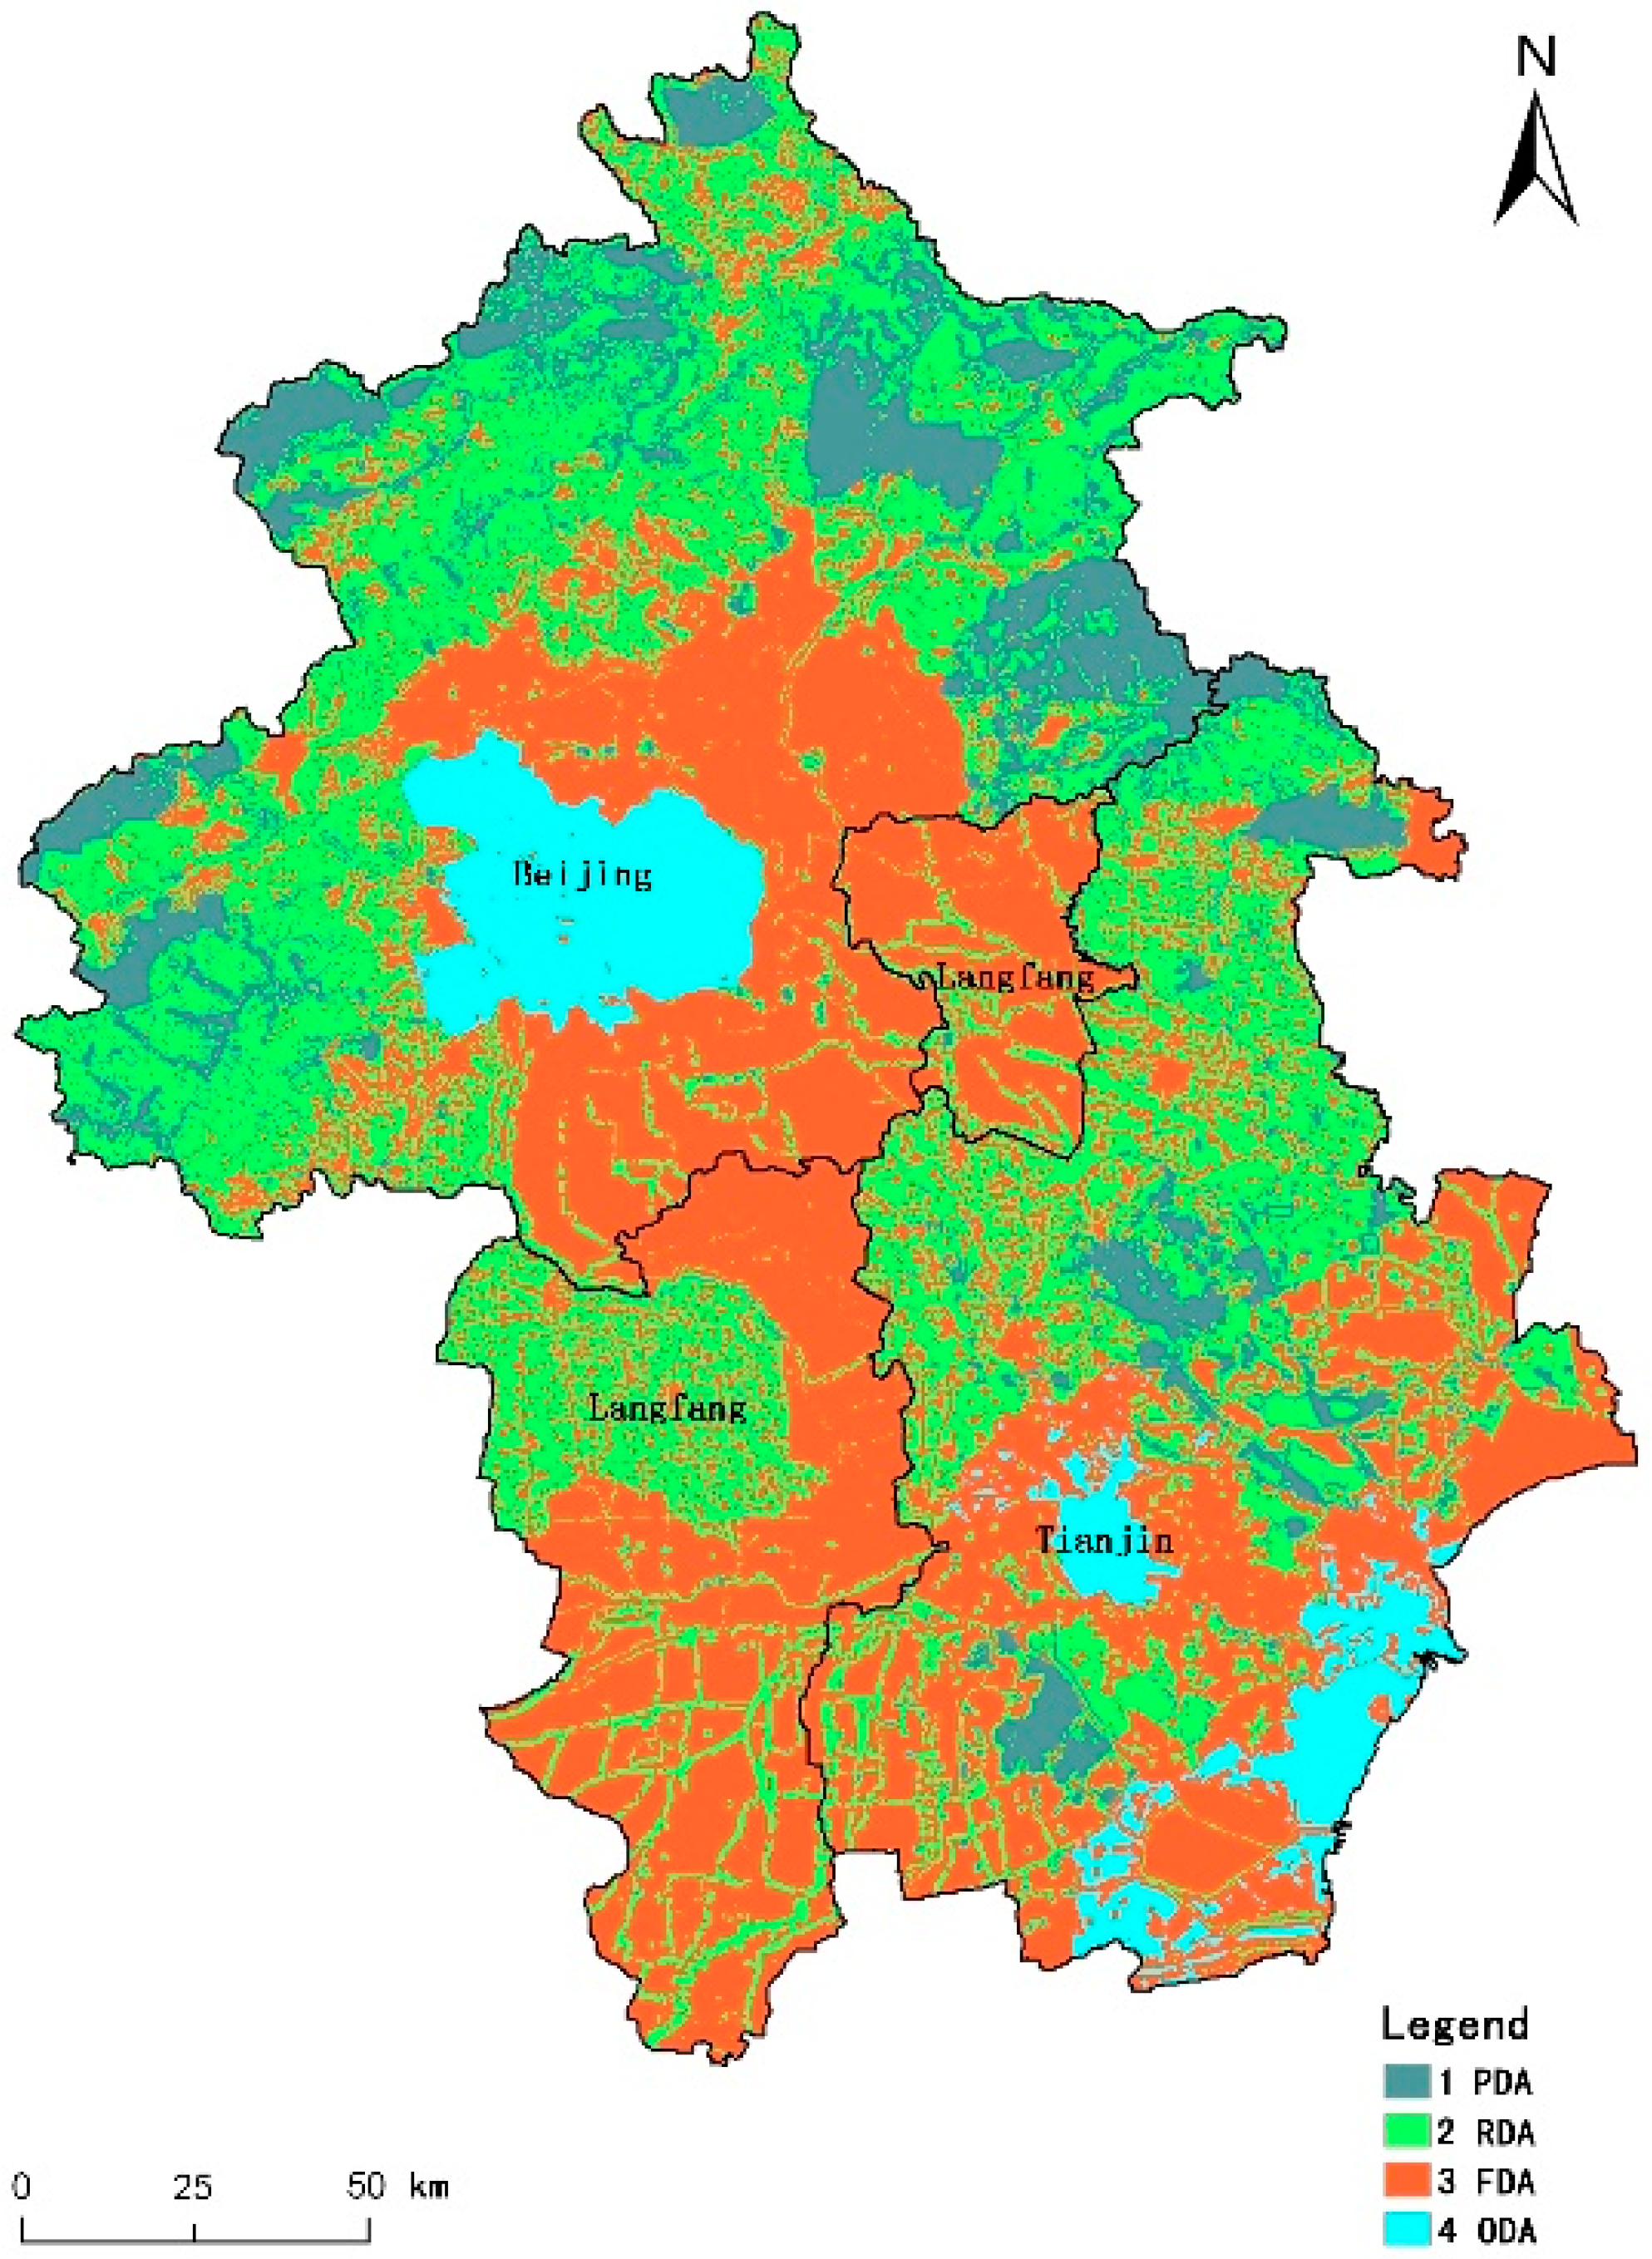
4.2.3. Comparative Analysis of Scenario Planning
5. Discussion and Conclusions
Acknowledgments
Author Contributions
Conflicts of Interest
References
- Xie, G.D.; Lu, C.X.; Zhen, L. Objective, progress and methodology of spatial function zoning. Geogr. Res. 2009, 28, 561–570. [Google Scholar]
- Huo, B. Revival and novation of strategic spatial planning of China. City Plan. Rev. 2007, 31, 19–29. [Google Scholar]
- Zhang, X.R.; Fang, C.L.; Wang, Z.B. Urban construction land suitability evaluation based on improved multi-criteria evaluation based on GIS (MCE-GIS): Case of New Hefei City, China. Chin. Geogr. Sci. 2013, 23, 740–753. [Google Scholar] [CrossRef]
- Stillwell, J. Planning Support Systems in Practice (Advances in Spatial Science); Springer: Heidelberg, Germany, 2002. [Google Scholar]
- Harris, B. Beyond geographic information systems: Computers and the planning professional. J. Am. Plan. Assoc. 1989, 55, 85–90. [Google Scholar] [CrossRef]
- Geertman, S.; Toppen, F.; Stillwell, J. Planning Support Systems for Sustainable Urban Development; Springer: Heidelberg, Germany, 2013. [Google Scholar]
- Landis, L.D. Imagining land use futures: Applying the California Urban Future Model. J. Am. Plan. Assoc. 1995, 61, 438–457. [Google Scholar] [CrossRef]
- Clarke, K.C.; Gaydos, L.; Hoppen, S. A self-modifying cellular automaton model of historical urbanization in the San Francisco Bay area. Environ. Plan. B Plan. Des. 1997, 24, 247–261. [Google Scholar] [CrossRef]
- Demetriou, D.; Stillwell, J.; See, L. Land consolidation in Cyprus: Why is an integrated planning and decision support system required? Land Use Policy 2012, 29, 131–142. [Google Scholar] [CrossRef]
- Kocabas, V.; Dragicevic, S.; Mccann, E. Integration of a GIS-Bayesian network agent-based model in a planning support system as framework for policy generation. J. Urban Reg. Inf. Syst. Assoc. 2012, 24, 35–52. [Google Scholar]
- Pettit, C.J. Use of a collaborative GIS-based planning-support system to assist in formulating a sustainable-development scenario for Hervey Bay, Australia. Environ. Plan. B Plan. Des. 2005, 32, 523–545. [Google Scholar] [CrossRef]
- Katoshevski, C.R.; Arentze, T.; Timmermans, H. A multi-agent planning support-system for assessing externalities of urban form scenarios: Results of case studies. Sustainability 2010, 2, 2253–2278. [Google Scholar] [CrossRef]
- Coutinho, R.J.; Simao, A.; Antunes, C.H. A GIS-based multicriteria spatial decision support system for planning urban infrastructures. Decis. Support Syst. 2011, 51, 720–726. [Google Scholar] [CrossRef]
- Kang, M.H.; Choi, H.R.; Kim, H.S. Development of a maritime transportation planning support system for car carriers based on genetic algorithm. Appl. Intell. 2012, 36, 585–604. [Google Scholar] [CrossRef]
- Long, Y.; Mao, Q.Z. Urban planning support system definition, objectives and framework. J. Tsinghua Univ. Sci. Technol. 2010, 50, 335–337. [Google Scholar]
- Du, N.R.; Li, Y. Planning support system (PSS) and its application to decision-making for urban spatial development. Eng. J. Wuhan Univ. 2005, 38, 137–142. [Google Scholar]
- Yeh, A.G.; Song, X.D.; Niu, X.Y. Geographic Information and Planning Support System; Science Press: Beijing, China, 2006. [Google Scholar]
- Niu, X.Y. Planning Support System: A new approach for computer-aided planning. Urban Plan. Forum 2006, 2, 96–101. [Google Scholar]
- Zhao, Y.; Shang, J.C.; Xu, L. Establishment and application of urbanization strategic environmental assessment integration technology system. Chin. Geogr. Sci. 2008, 18, 184–192. [Google Scholar] [CrossRef]
- Yang, L.; Zhang, Y.F.; Wang, B.C. Soil utilization and planning support system of the villages and towns based on GIS. Xinjiang Agric. Sci. 2008, 45, 264–269. [Google Scholar]
- Long, Y.; Shen, Z.J.; Mao, Q.Z. Urban growth control planning support system: approach, implementation and application. City Plan. Rev. 2011, 35, 62–71. [Google Scholar]
- Zhang, Y.; Zhang, H.Q.; Ni, D.Y. Agricultural land use optimal allocation system in developing area: Application to Yili watershed, Xinjiang Region. Chin. Geogr. Sci. 2012, 2, 232–244. [Google Scholar] [CrossRef]
- Fan, J.; Sun, W.; Zhou, K. Major function oriented zone: New method of spatial regulation for reshaping regional development pattern in China. Chin. Geogr. Sci. 2012, 22, 196–209. [Google Scholar] [CrossRef]
- Zhang, X.R.; Zong, Y.G. Application of model and method in the planning of region major functional zones—A case study of Beijing–Tianjin Region, China. Sci. Geog. Sin. 2010, 30, 728–734. [Google Scholar]
- Tang, G.A.; Yang, X. ArcGIS Spatial Analysis Experiments Tutorial; Science Press: Beijing, China, 2006. [Google Scholar]

| Content Comparison | DSS | PSS |
|---|---|---|
| Data form | Non-spatial data | Spatial data and non-spatial data |
| Data acquisition | Single: statistics | Variety: statistical, digitized scanning, image processing, etc. |
| Decision model | Non-spatial model | Spatial model based, supplemented by non-spatial model |
| Results output | Figures, tables | Graphics, images, tables, etc. |
| Combined with GIS | Generally no | Closely combined with GIS, there would be no PSS without GIS |
| Target Layer | Constrained Layer | Criteria Layer | Index Layer |
|---|---|---|---|
| RMFA planning | Resource-environmental carrying capacity | Resource abundance | Per capita water resources |
| Per capita cultivated area | |||
| Per capita forest area | |||
| Per capita grassland area | |||
| Environmental capacity | Urban domestic sewage treatment rate | ||
| Comprehensive utilization rate of industrial solid wastes | |||
| Garbage harmless treatment rate | |||
| Environment protection investment for industrial output value of ten thousand yuan | |||
| The product output value of comprehensive utilization of “three wastes” ten thousand yuan industrial output value | |||
| Economic-social potential | Economic | Per capita GDP | |
| Fiscal revenue of unit land area | |||
| Fixed assets investment of unit land area | |||
| Proportion of industrial value accounted for GDP | |||
| Transportation | Density of highway network | ||
| Density of railway network | |||
| town | Urbanization level | ||
| Proportion of urban construction land area accounted for total land area | |||
| Society | Population density | ||
| Per capita expenditure on education | |||
| Ten thousand people hospital bed number | |||
| Per capita social retail sales of consumer | |||
| Per capita postal business | |||
| Environmental stress | Pollution emissions | Amounts of wastewater discharged per ten thousand yuan industrial output value | |
| Amounts of SO2 discharged per ten thousand yuan industrial output value | |||
| Amounts of soot discharged per ten thousand yuan industrial output value | |||
| Ecological resistance | Terrain | Elevation | |
| Slope | |||
| Water | Main rivers | ||
| General rivers | |||
| Minor rivers | |||
| Important lakes | |||
| General lakes | |||
| Vegetation | Farmland | ||
| Woodland | |||
| Grassland | |||
| Unused land | |||
| Protected areas | Nature Reserve |
| Forces | Weights of the Restrictive Mode | Weights of the Promotive Mode |
|---|---|---|
| Carrying capacity | 0.10 | 0.10 |
| Potential | 0.31 | 0.53 |
| Stress | 0.06 | 0.06 |
| Resistance | 0.53 | 0.31 |
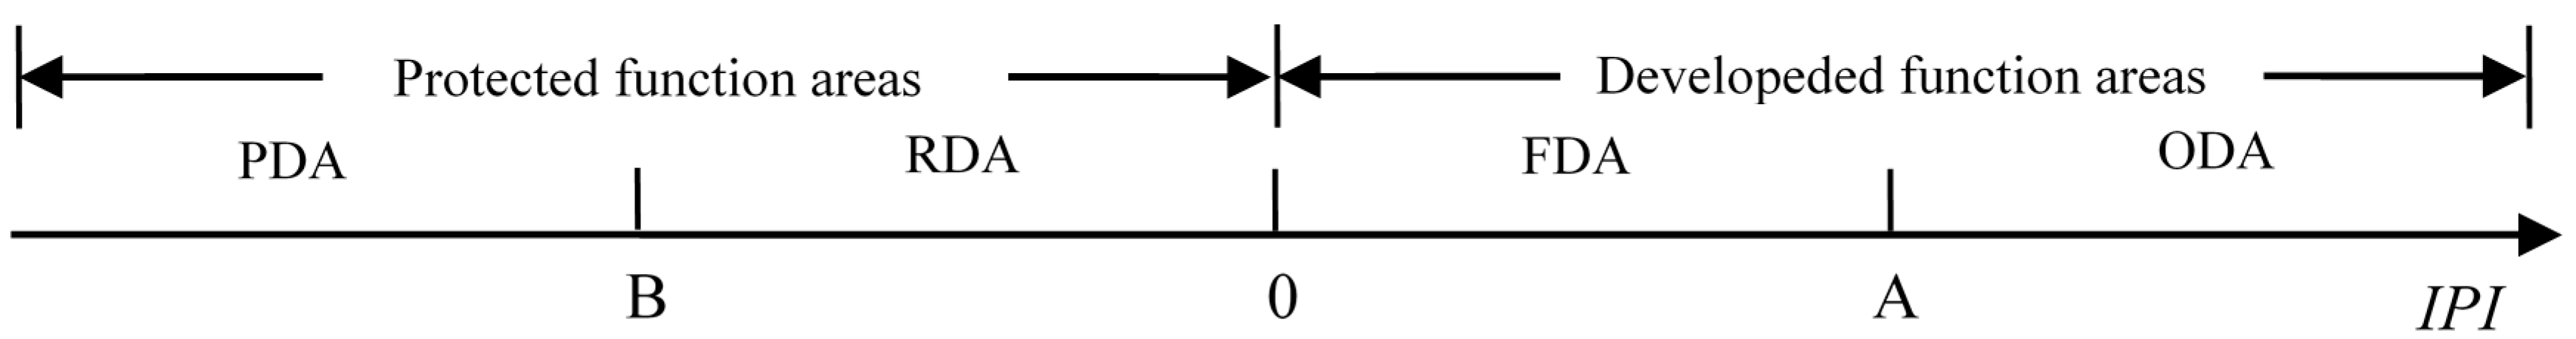
| Functional Area Type | Restrictive Development Mode | Promotive Development Mode | ||
|---|---|---|---|---|
| Area (km2) | Proportion (%) | Area (km2) | Proportion (%) | |
| PDA | 7752.06 | 22.53 | 5701.36 | 16.57 |
| RDA | 15927.33 | 46.29 | 13666.75 | 39.72 |
| FDA | 8997.62 | 26.15 | 12751.50 | 37.06 |
| ODA | 1730.71 | 5.03 | 2288.11 | 6.65 |
© 2016 by the authors; licensee MDPI, Basel, Switzerland. This article is an open access article distributed under the terms and conditions of the Creative Commons Attribution (CC-BY) license (http://creativecommons.org/licenses/by/4.0/).
Share and Cite
Zhang, X.; Hua, Q.; Zhang, L. Development and Application of a Planning Support System for Regional Spatial Functional Zoning Based on GIS. Sustainability 2016, 8, 909. https://doi.org/10.3390/su8090909
Zhang X, Hua Q, Zhang L. Development and Application of a Planning Support System for Regional Spatial Functional Zoning Based on GIS. Sustainability. 2016; 8(9):909. https://doi.org/10.3390/su8090909
Chicago/Turabian StyleZhang, Xiaorui, Qian Hua, and Linya Zhang. 2016. "Development and Application of a Planning Support System for Regional Spatial Functional Zoning Based on GIS" Sustainability 8, no. 9: 909. https://doi.org/10.3390/su8090909
APA StyleZhang, X., Hua, Q., & Zhang, L. (2016). Development and Application of a Planning Support System for Regional Spatial Functional Zoning Based on GIS. Sustainability, 8(9), 909. https://doi.org/10.3390/su8090909