
Risk vs. Reward: A Methodology to Assess Investment in Marine Energy

Abstract
:1. Introduction
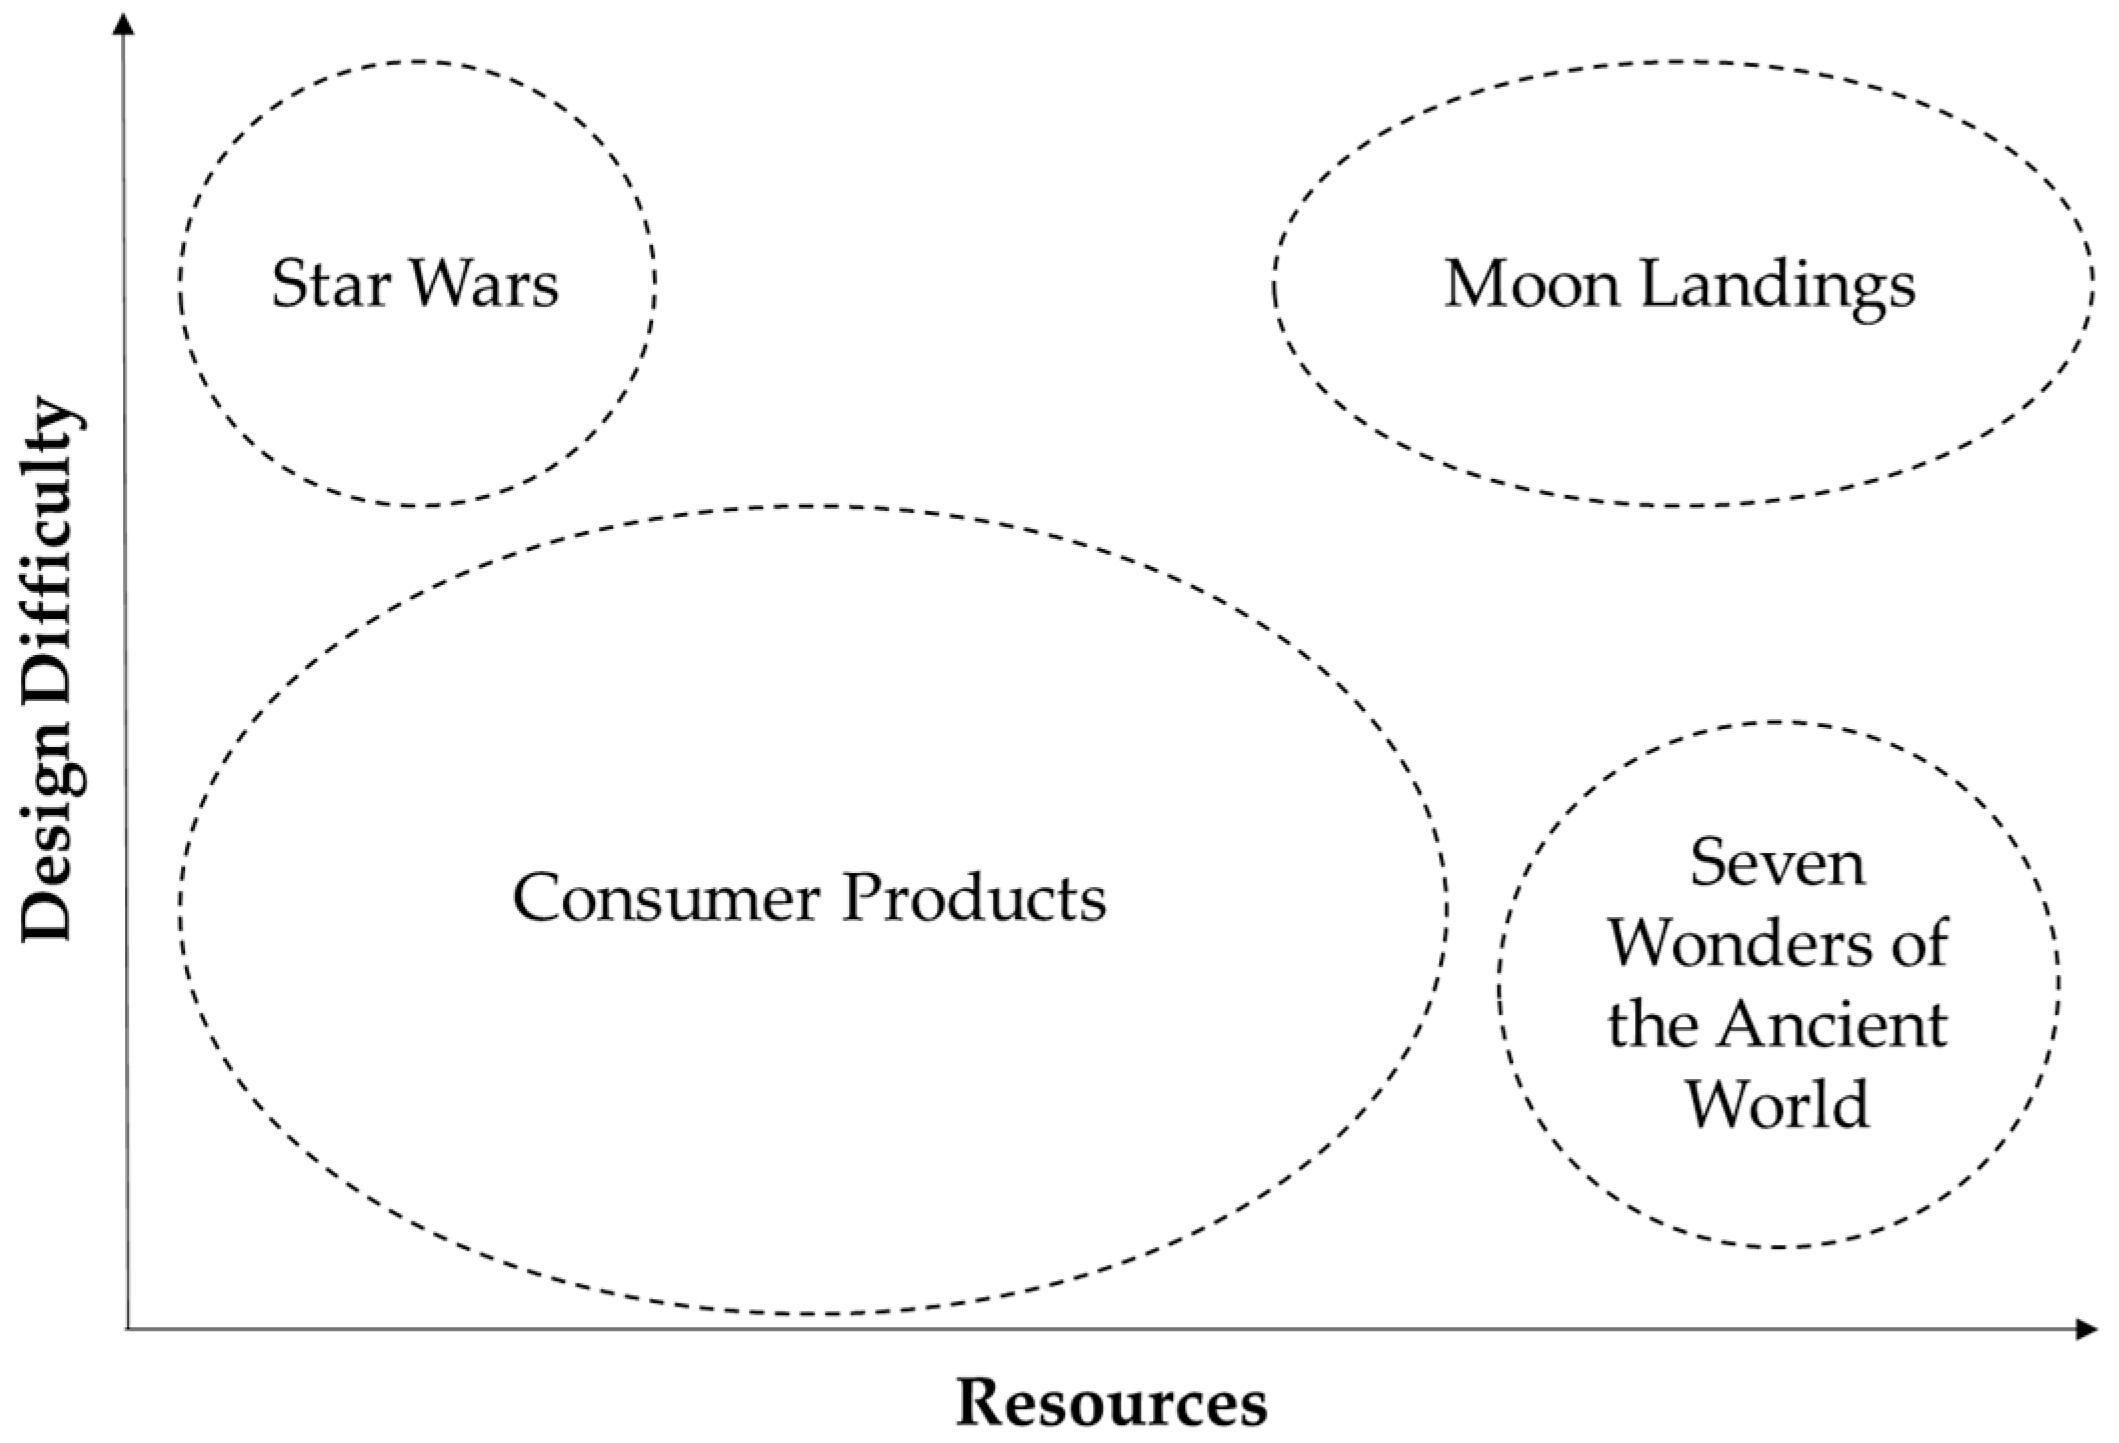
- “Consumer products” is the largest category and encompasses most projects. These projects are of a low to moderate design difficulty, requiring a low to moderate number of resources. This is representative of the majority of projects, which are considered an acceptable risk to a developer.
- “Star Wars” represents projects that are possible within our imagination, but technically not feasible using today’s technology.
- “Seven wonders of the ancient world” represents projects that require a vast amount of resources, however, are small to moderate in terms of design complexity.
- “Moon landing” represents projects that are both technically very challenging, pushing the boundaries of technology, and requiring a vast amount of resources to complete, such as the moon landings of the 1960s and 1970s.
2. Methodology
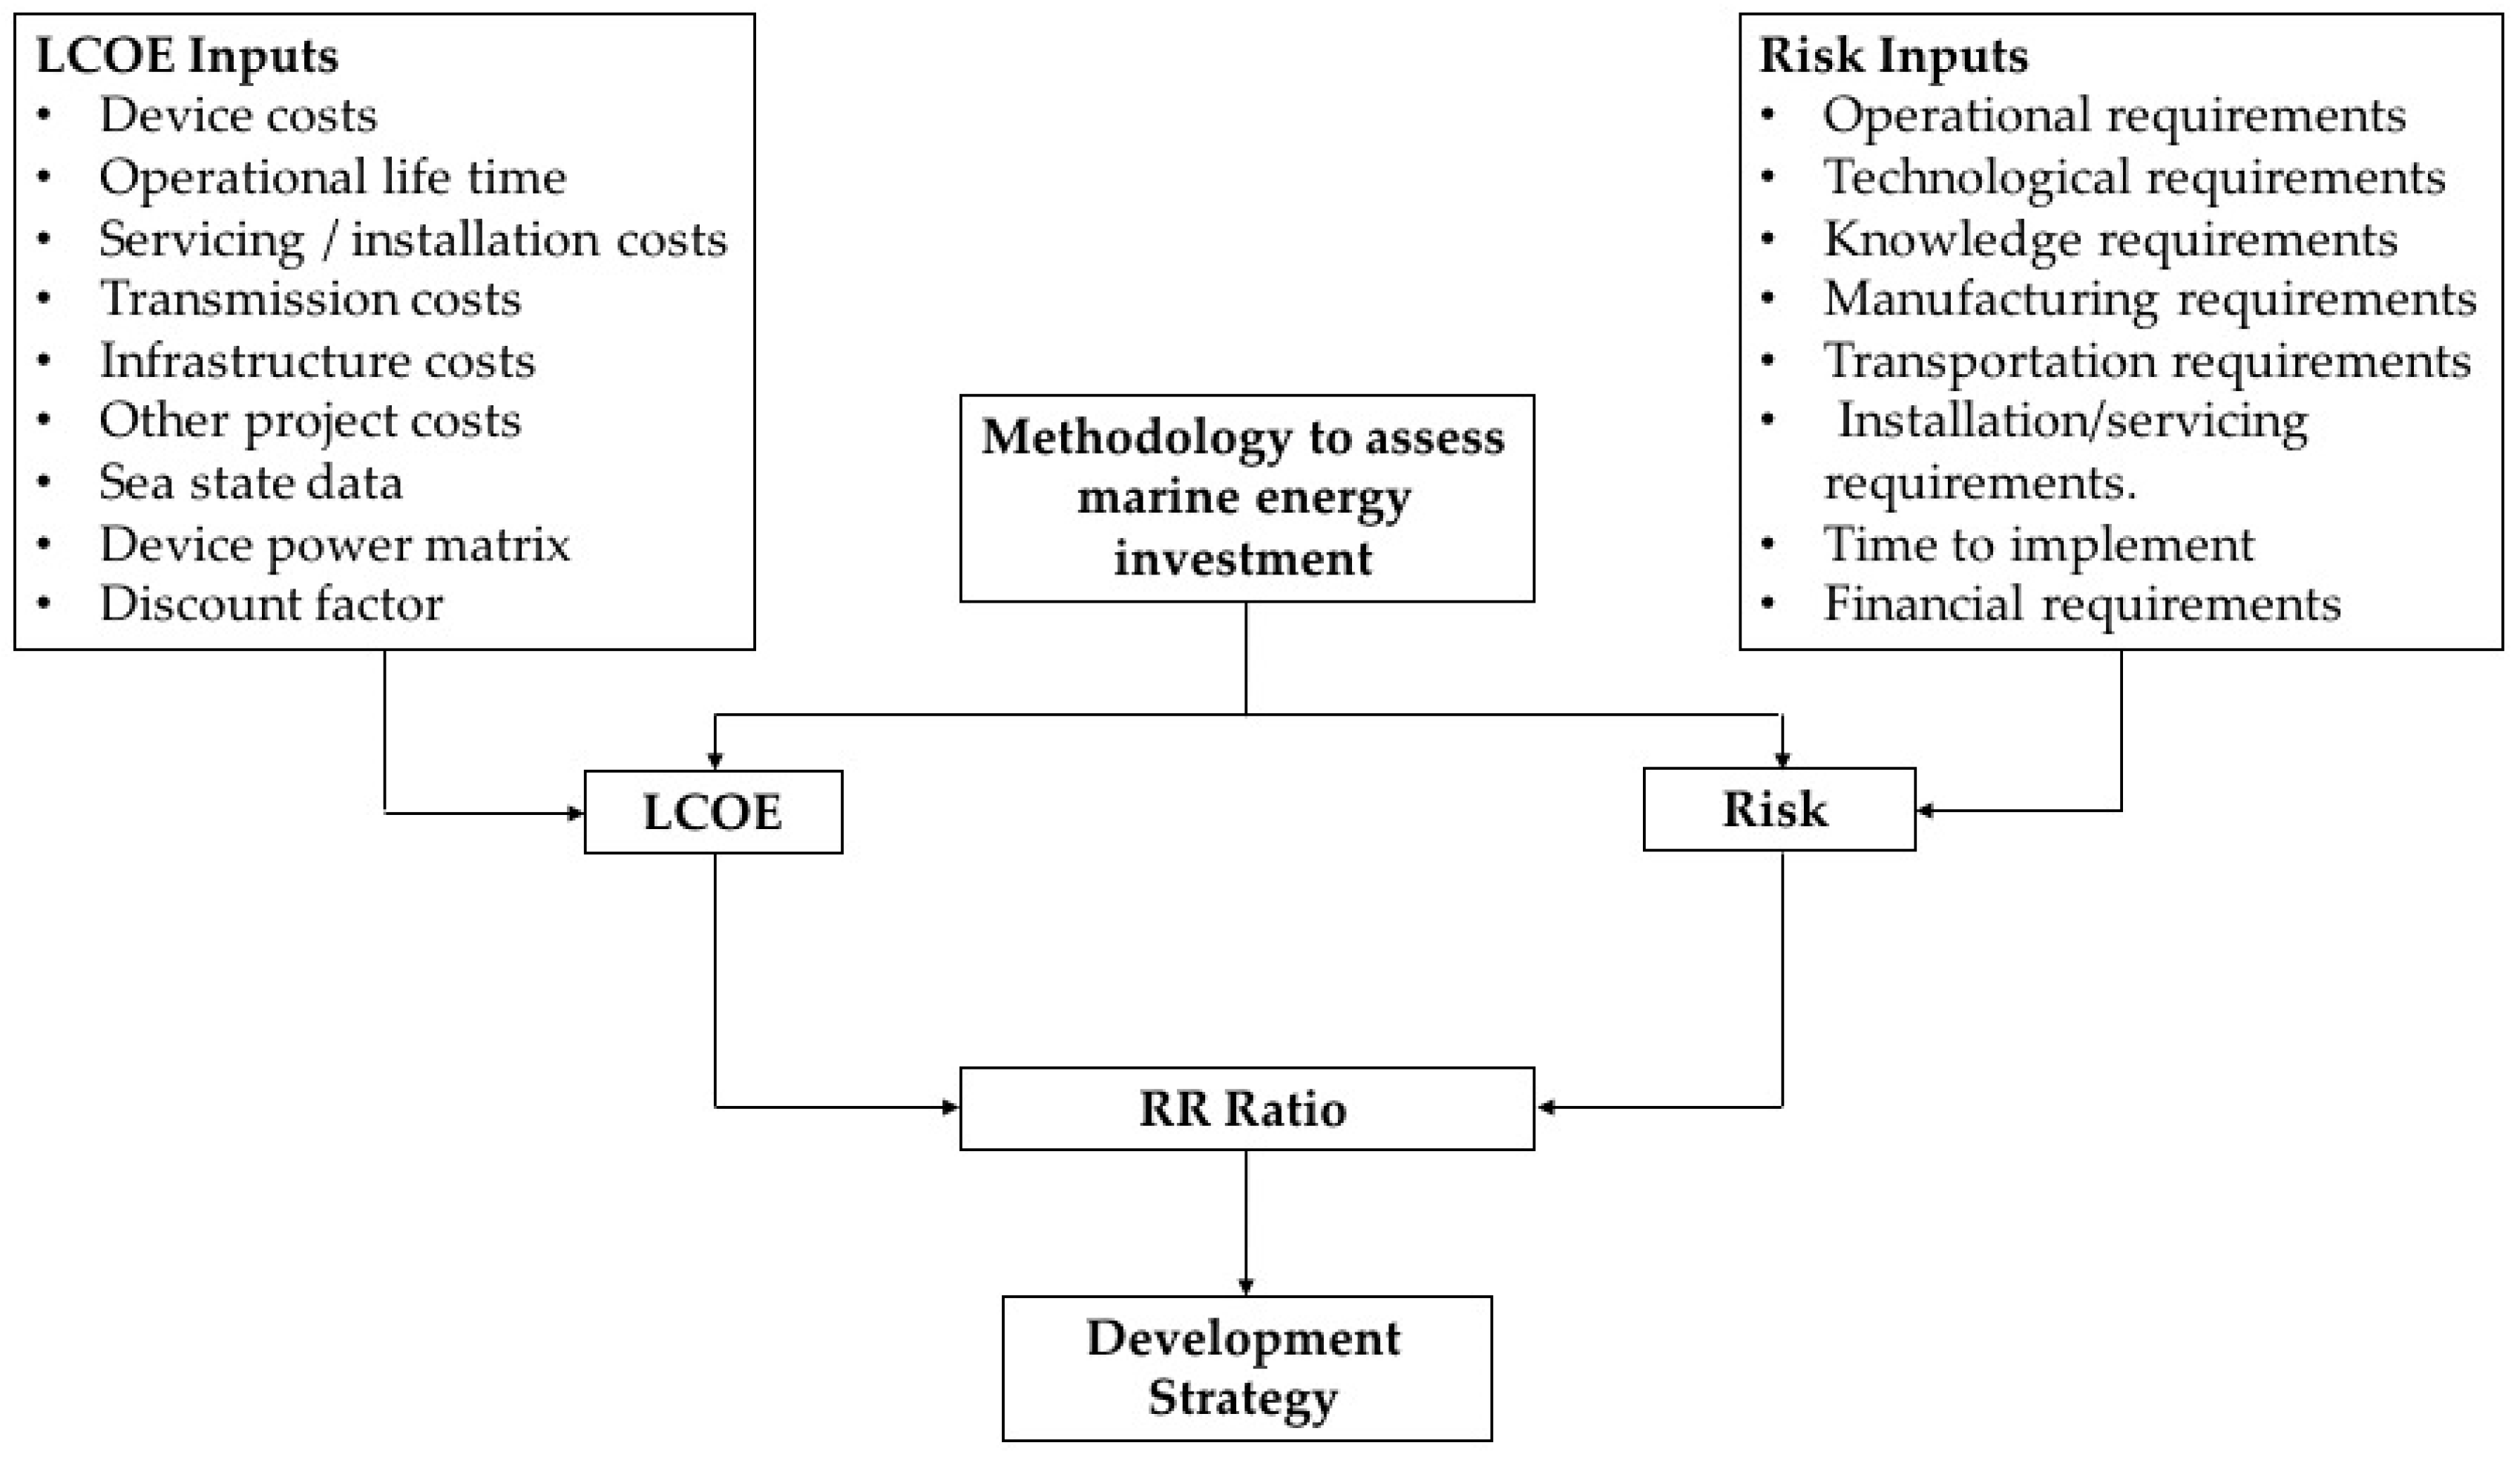
2.1. Methodology Overview
2.2. Devices
2.2.1. Device Overview
2.2.2. PWP Pelamis P1
2.2.3. CorPower Ocean Wave Energy Converter
2.3. Case Studies
2.3.1. Case Studies Overview
2.3.2. Case Study 1: Scale Investigation
2.3.3. Case Study 2: Structural Material Investigation
2.3.4. Case Study 3: Control System Investigation
2.3.5. Case Study 4: Power Take-off Investigation
2.3.6. Case Study 5: Combined Technologies Investigation
2.3.7. Deployment Capacities
2.4. LCOE Calculation
2.4.1. Overview
2.4.2. Cost Components
2.4.3. Scaling Costs
2.4.4. Material Changes
2.4.5. Grid Infrastructure Costs
2.4.6. Learning Factor
2.4.7. Locations and Sea States
2.4.8. Power Matrices
2.4.9. Availability
2.4.10. Control System Changes
2.4.11. Discount Rate
2.4.12. Validating the Model
2.5. Risk Analysis
2.5.1. Overview
2.5.2. Design Difficulty Metrics
How Scalable Is the Sub-System?
How Well Suited Is the Technology to Dealing with the Loading Placed upon It?
How Efficiently Does the Technology Perform Its Prime Function?
How Well Suited Is the Technology for the Marine Environment?
How Well Understood Is the Technology Exhibited in the Sub-System?
How Well Established Is the Reliability of the Technology?
What Levels of Maintenance Does the Technology Require?
How Many Manufacturing Steps Are Required to Take the Sub-System from the Final Engineering Design to a Fully Operational Device?
How Manufacturable Is the Technology Used within the Sub-System?
2.5.3. Resources Metrics
What Is the Total Cost of a Pilot Device Deployment?
What Learning Investment Is Required to Develop the Technology?
How Long Does the Device Take to Manufacture?
How Long Does the Device Take to Install in Its Deployment Location?
What Are the Infrastructure Requirements to Manufacture/Assemble the Device?
What Are the Infrastructure Requirements to Transportation and Install the Device?
What Are the Infrastructure Requirements to Service the Device?
2.6. RR Ratio
3. Results and Discussion
3.1. LCOE Analysis
3.2. Risk Scores
3.3. Monte Carlo Analysis
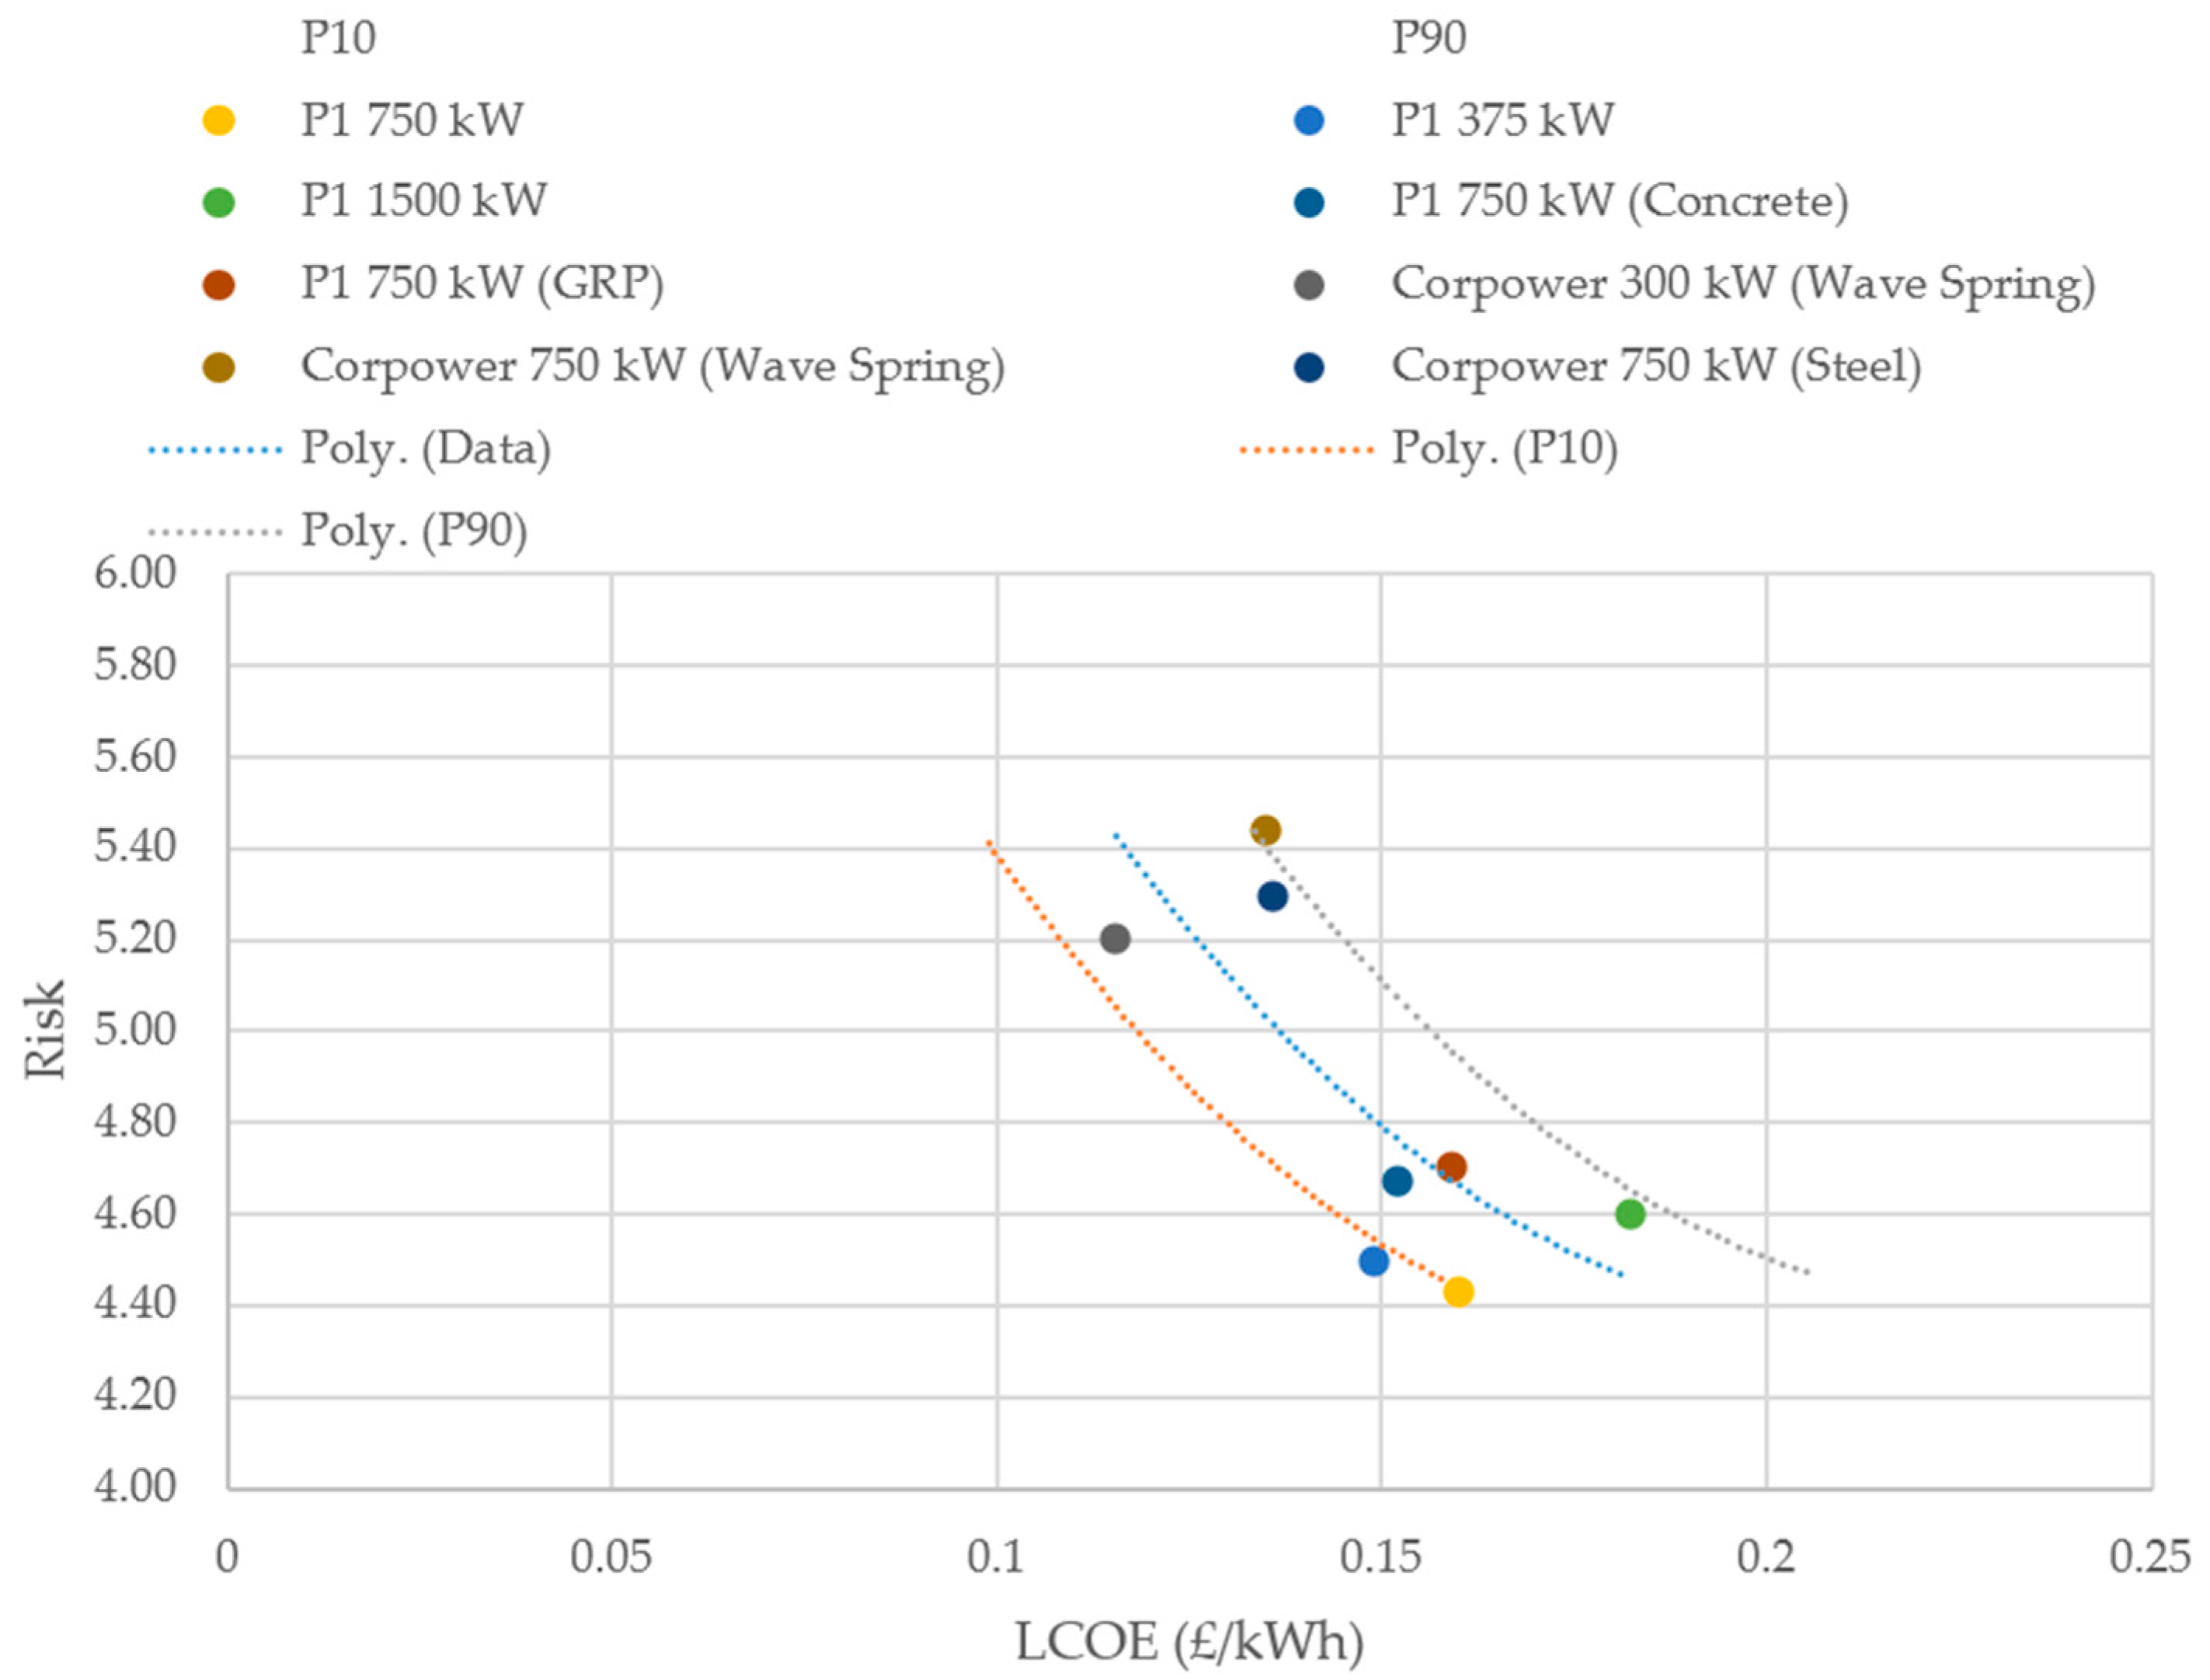
3.4. Risk vs. Reward
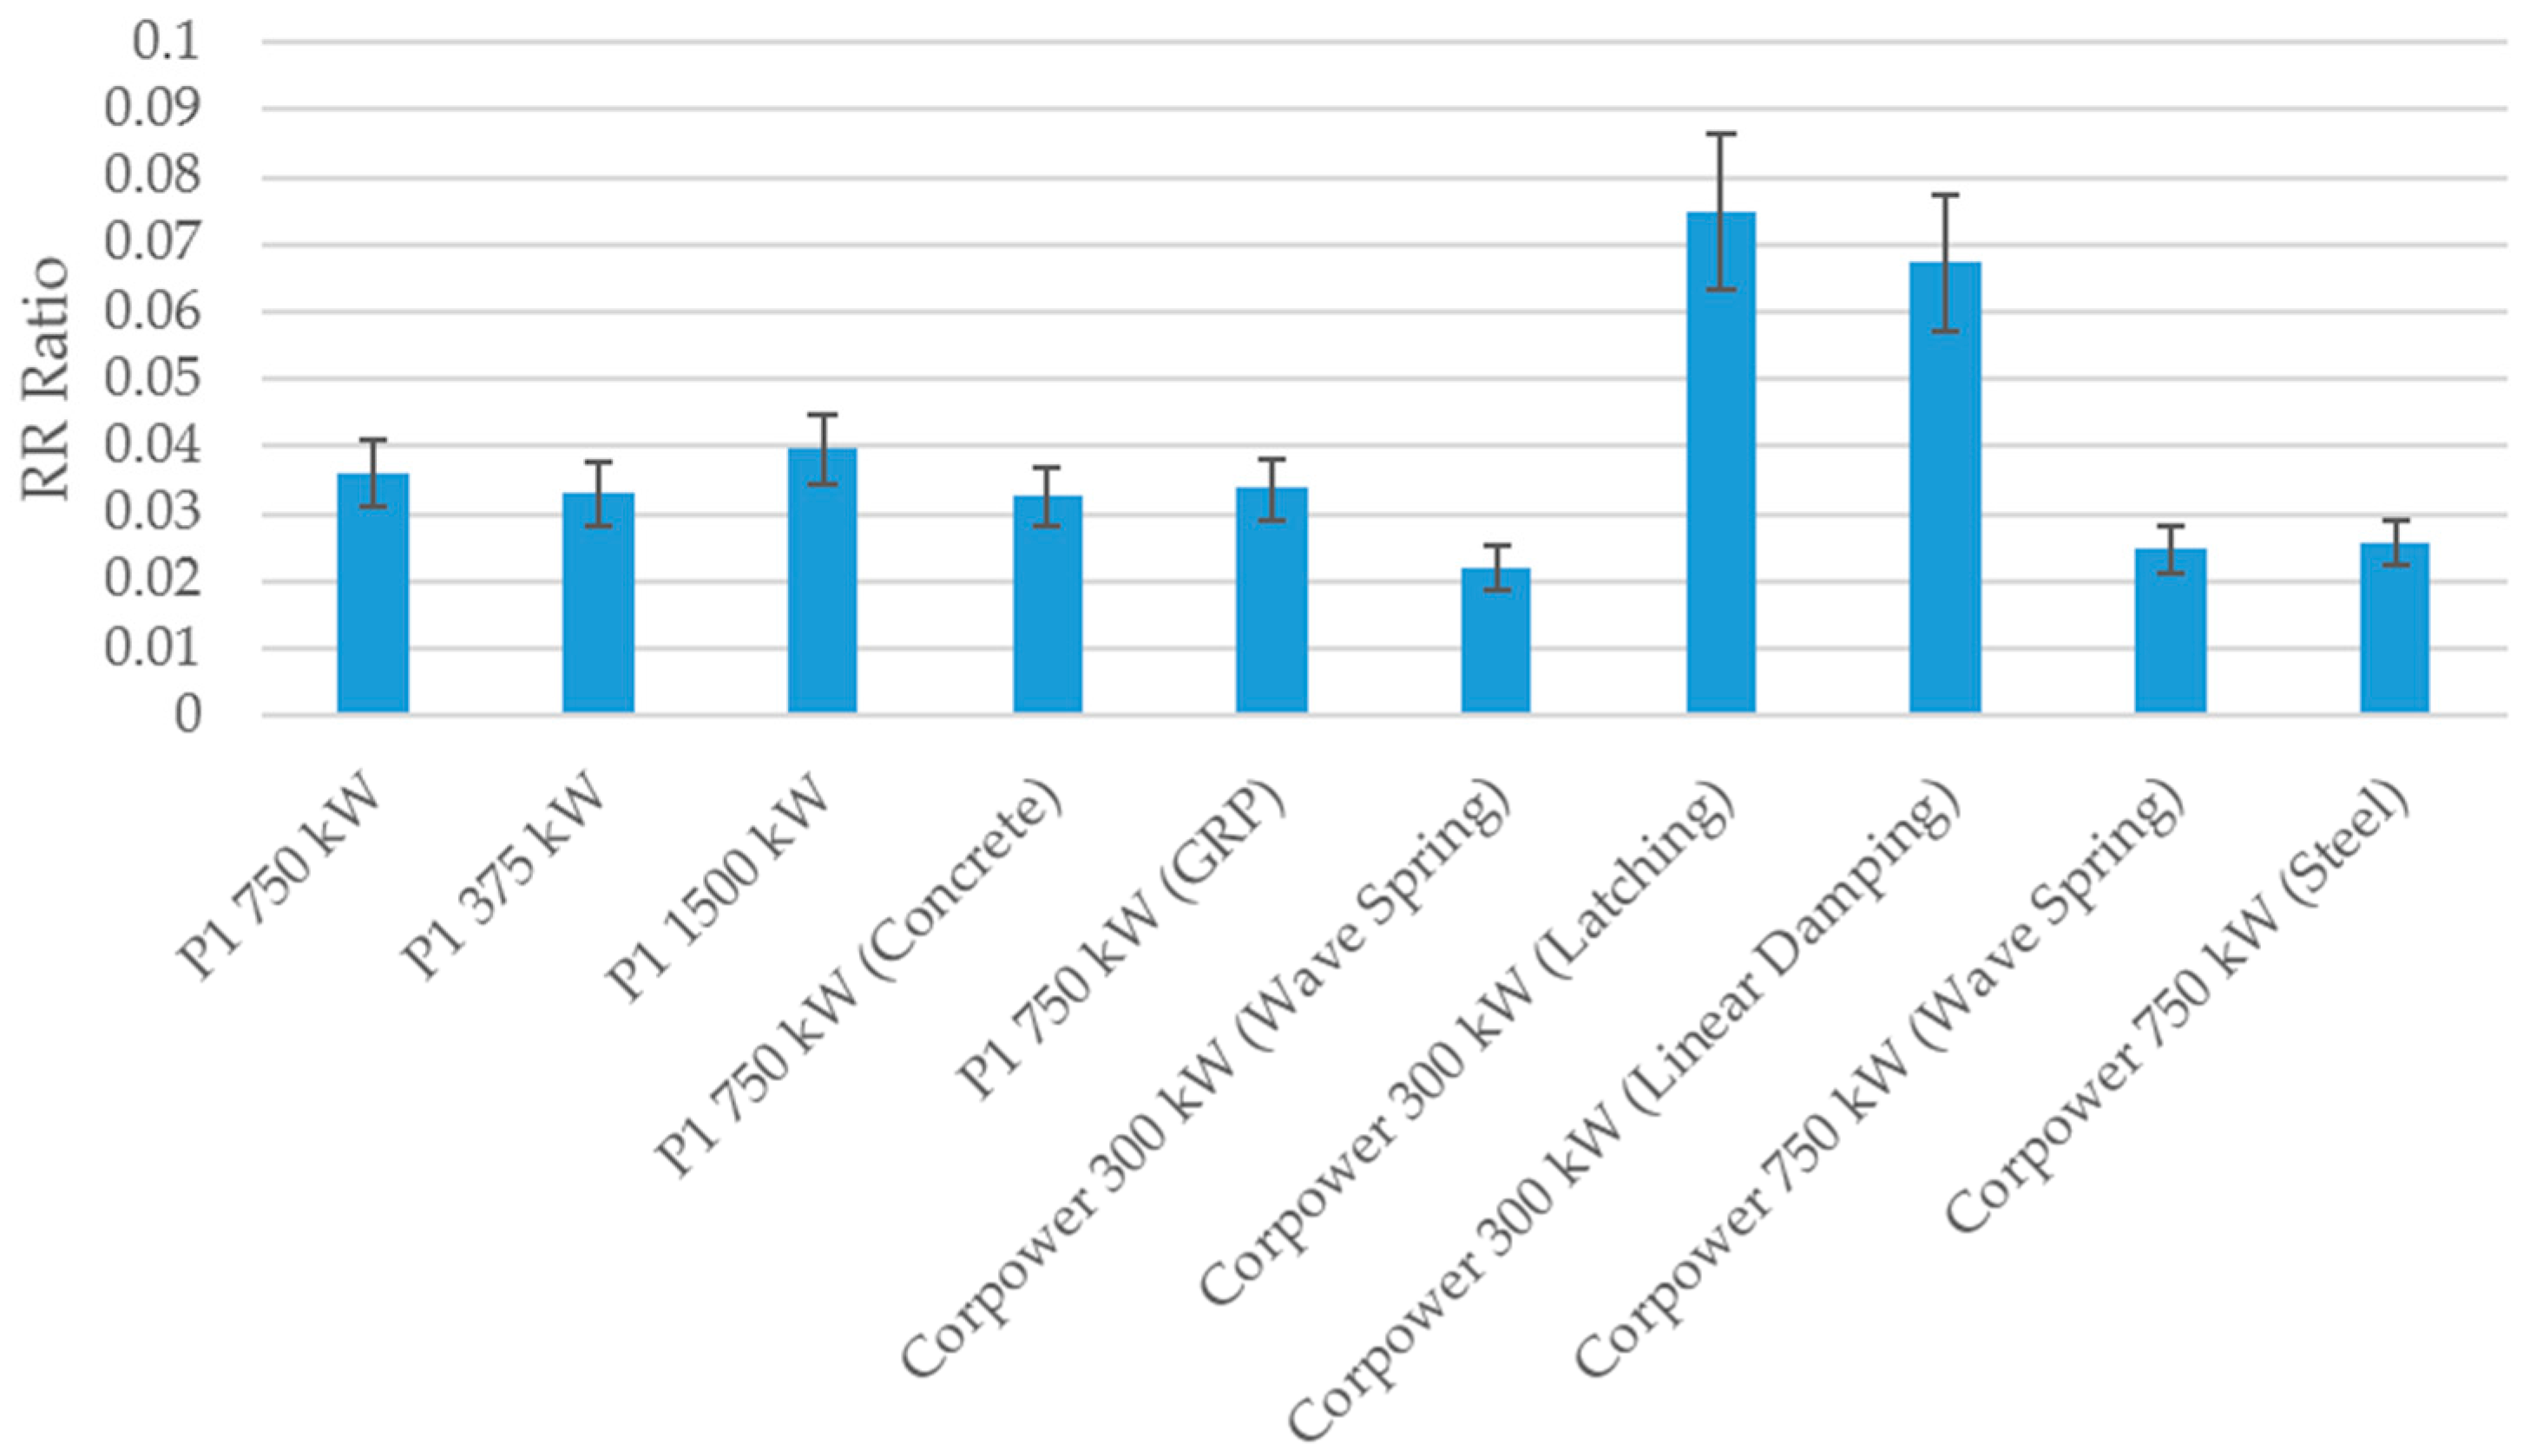
3.5. RR Ratio
3.6. Optimal Development Path for Wave Energy
4. Conclusions
Acknowledgments
Author Contributions
Conflicts of Interest
Appendix A. LCOE Calculation Data
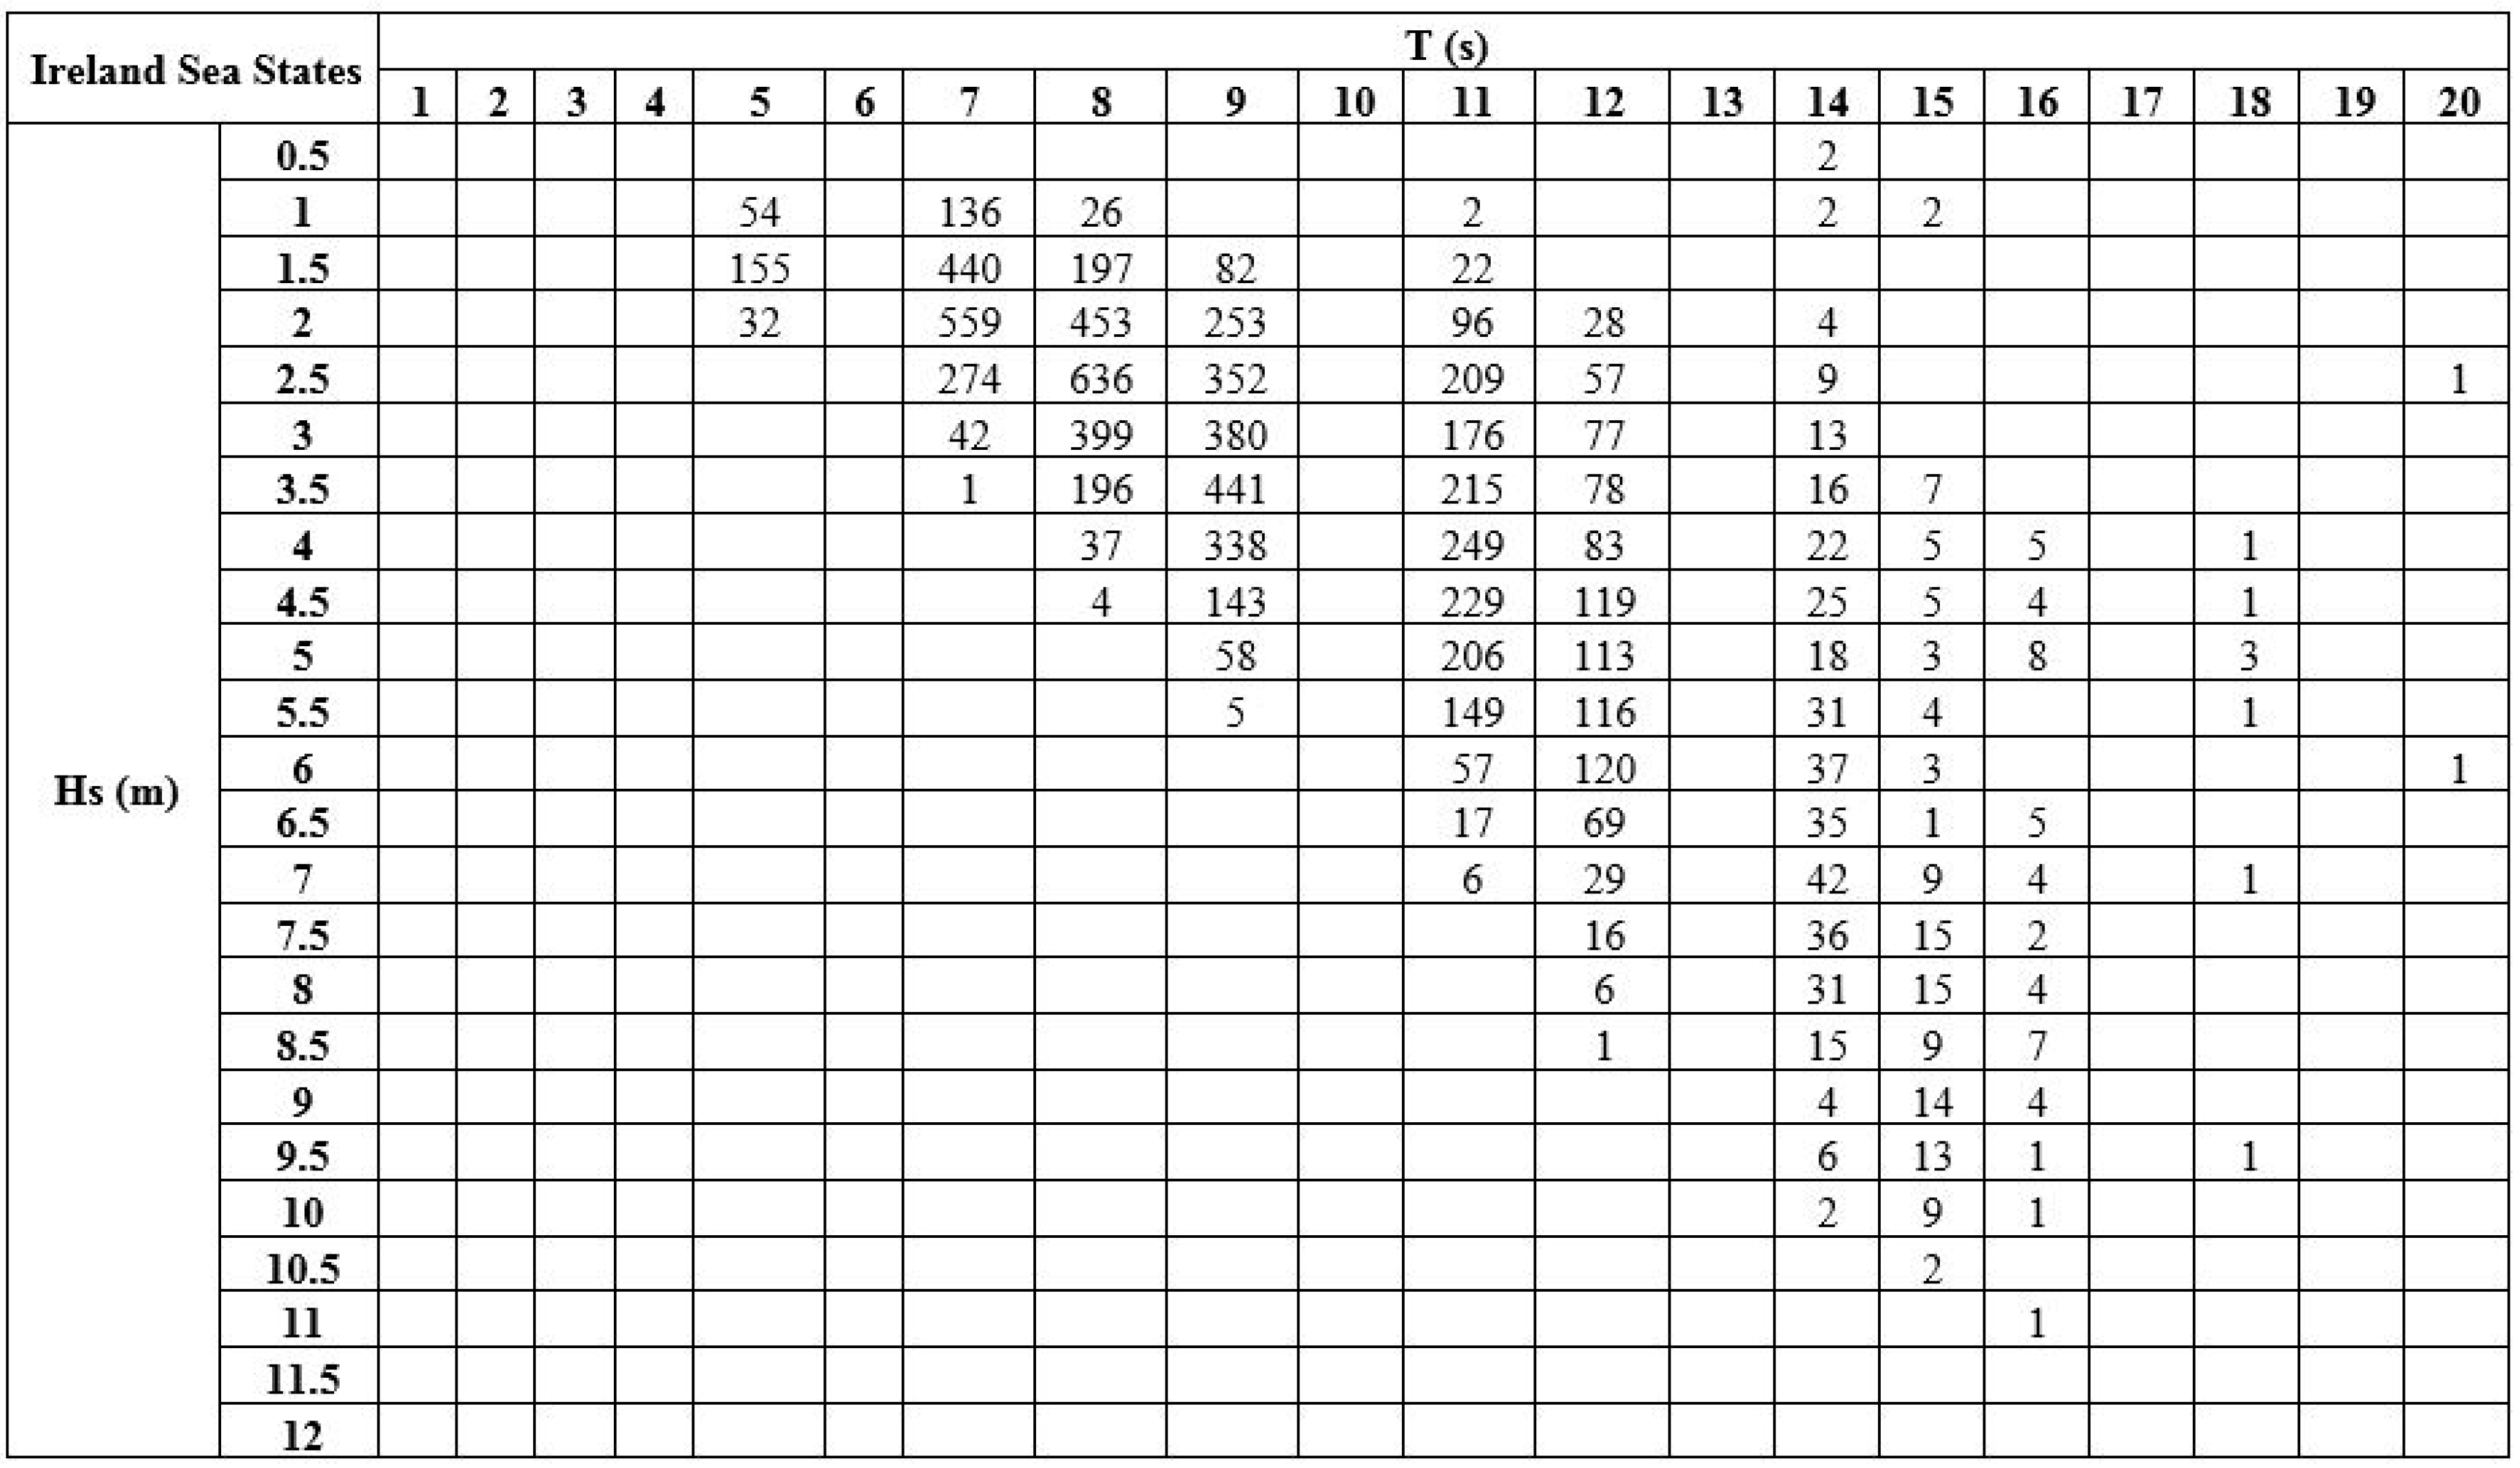
Appendix A.1. Sea States
Appendix A.1.1. Ireland (Belmullet Test Site) Sea State Matrix
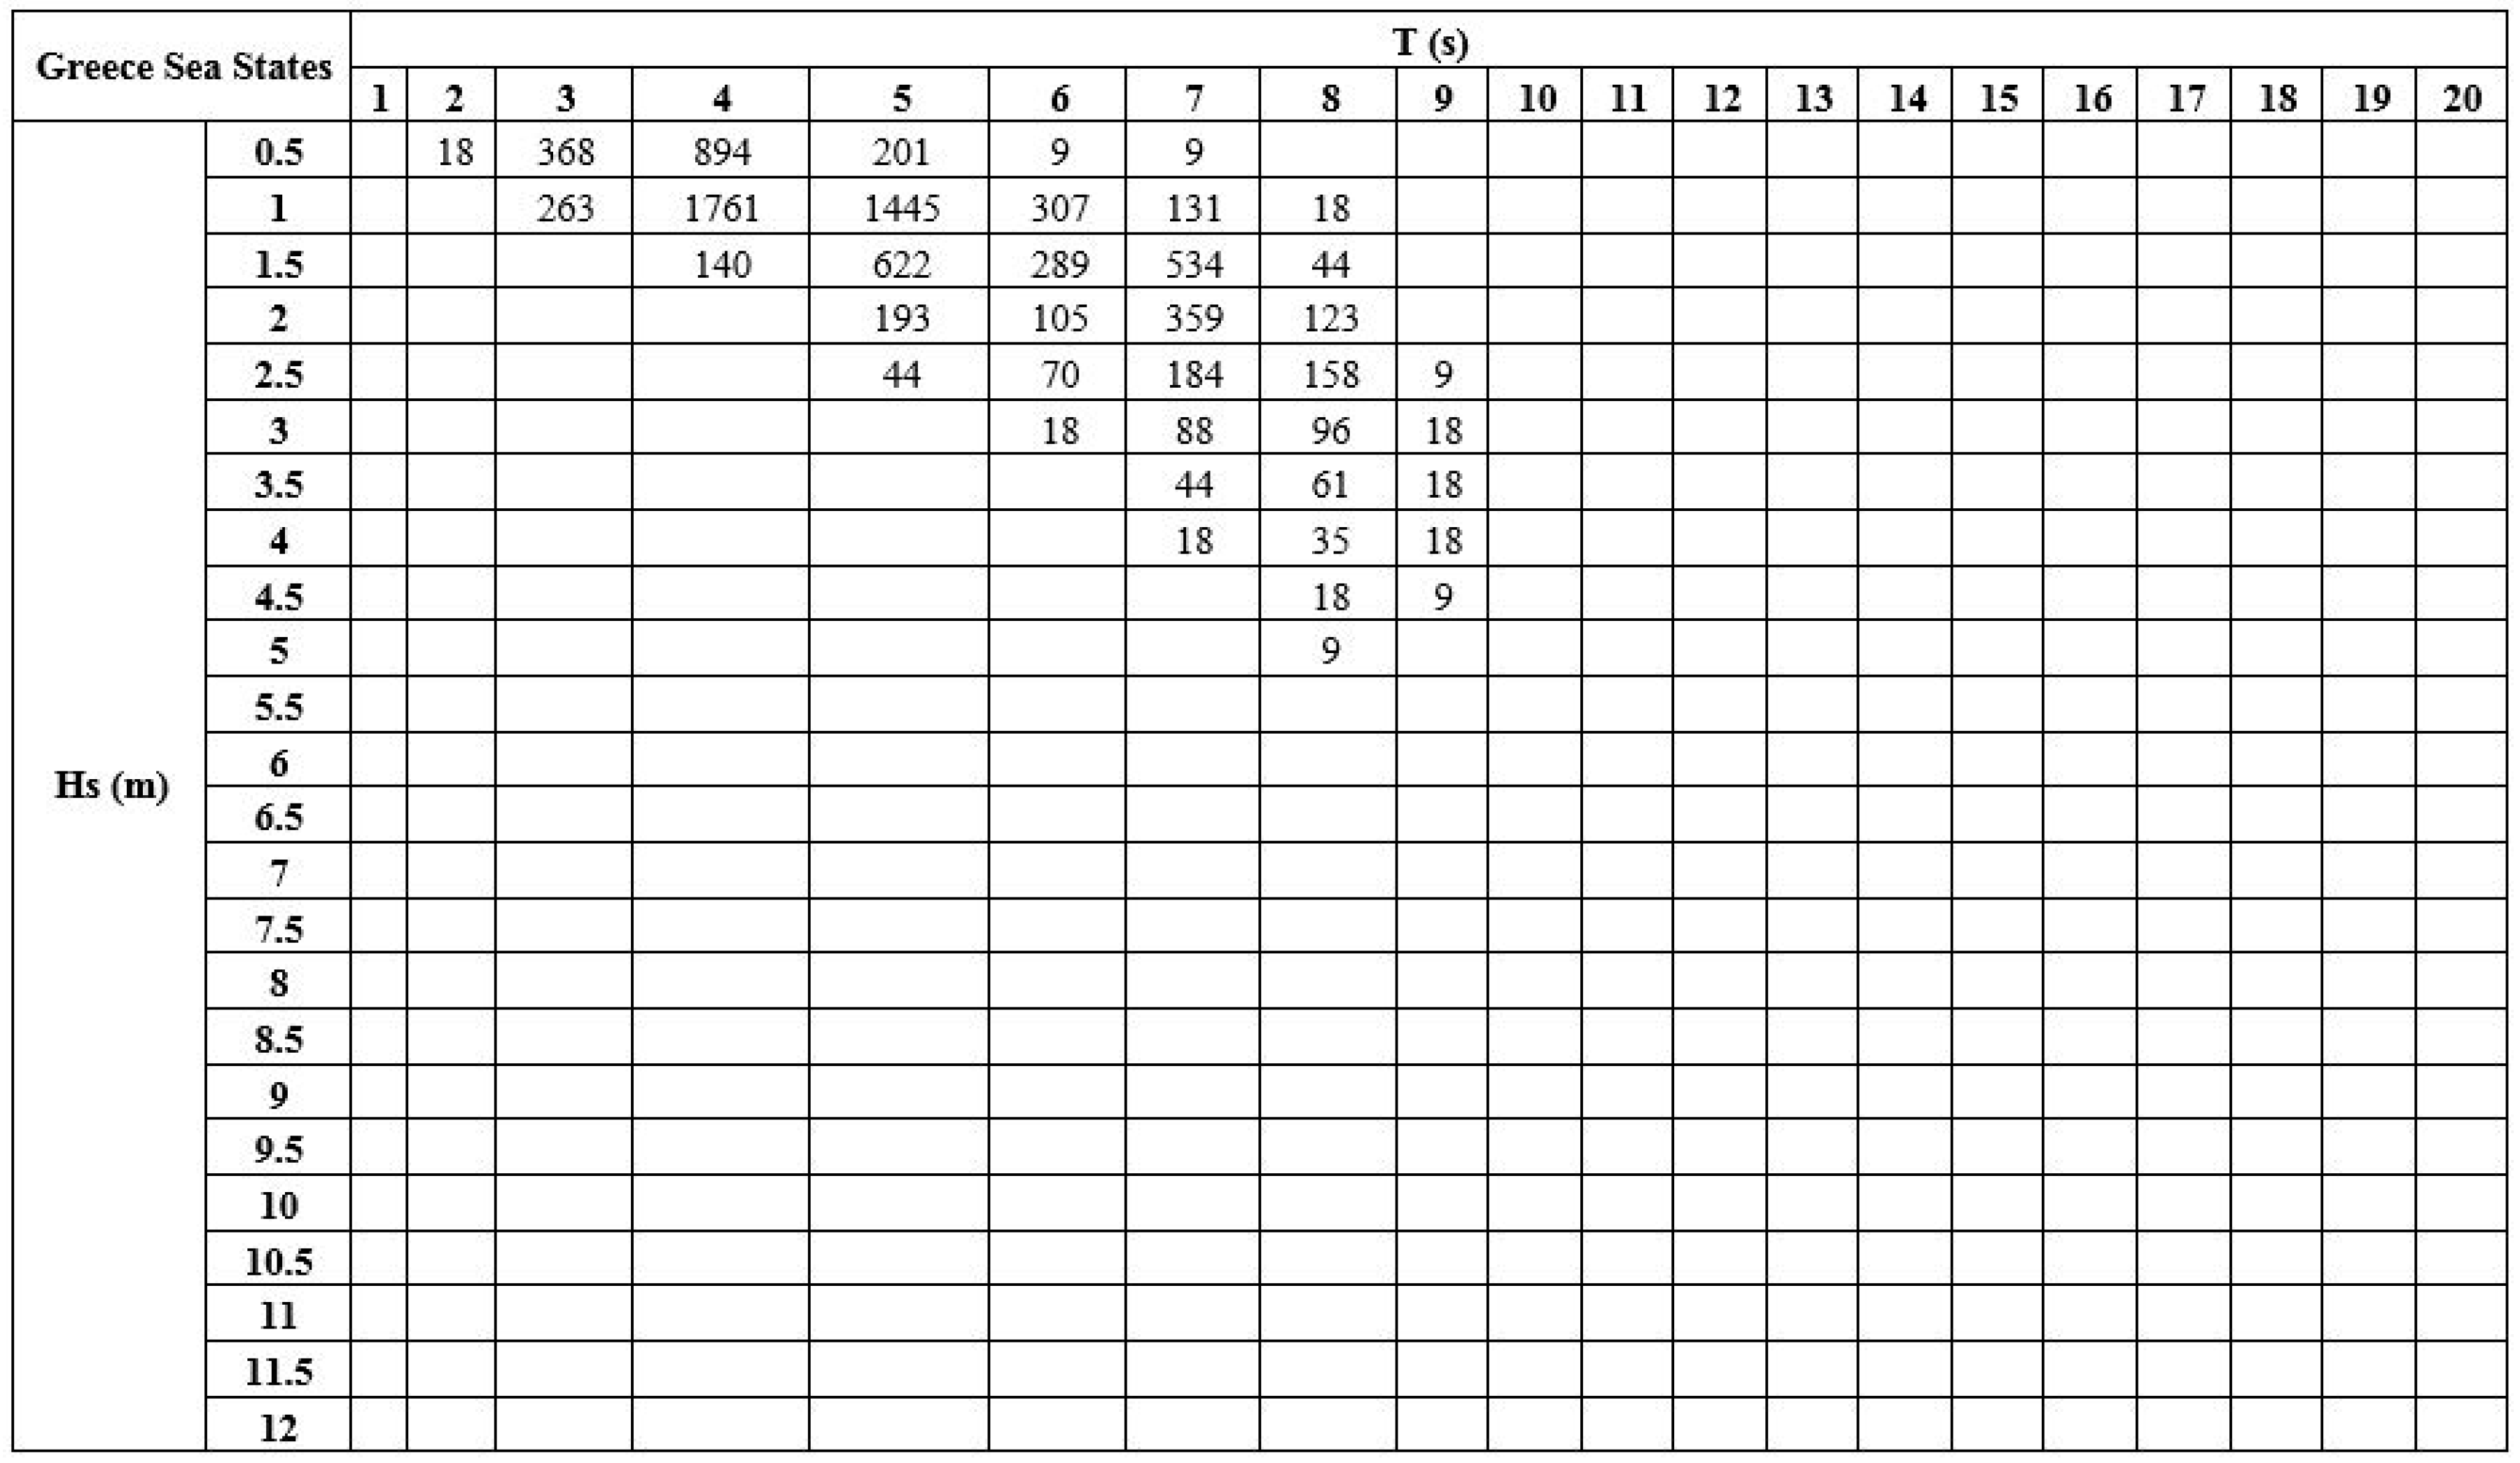
Appendix A.1.2. Greece (Ionian Sea) Sea State Matrix
Appendix A.2. Power Matrices
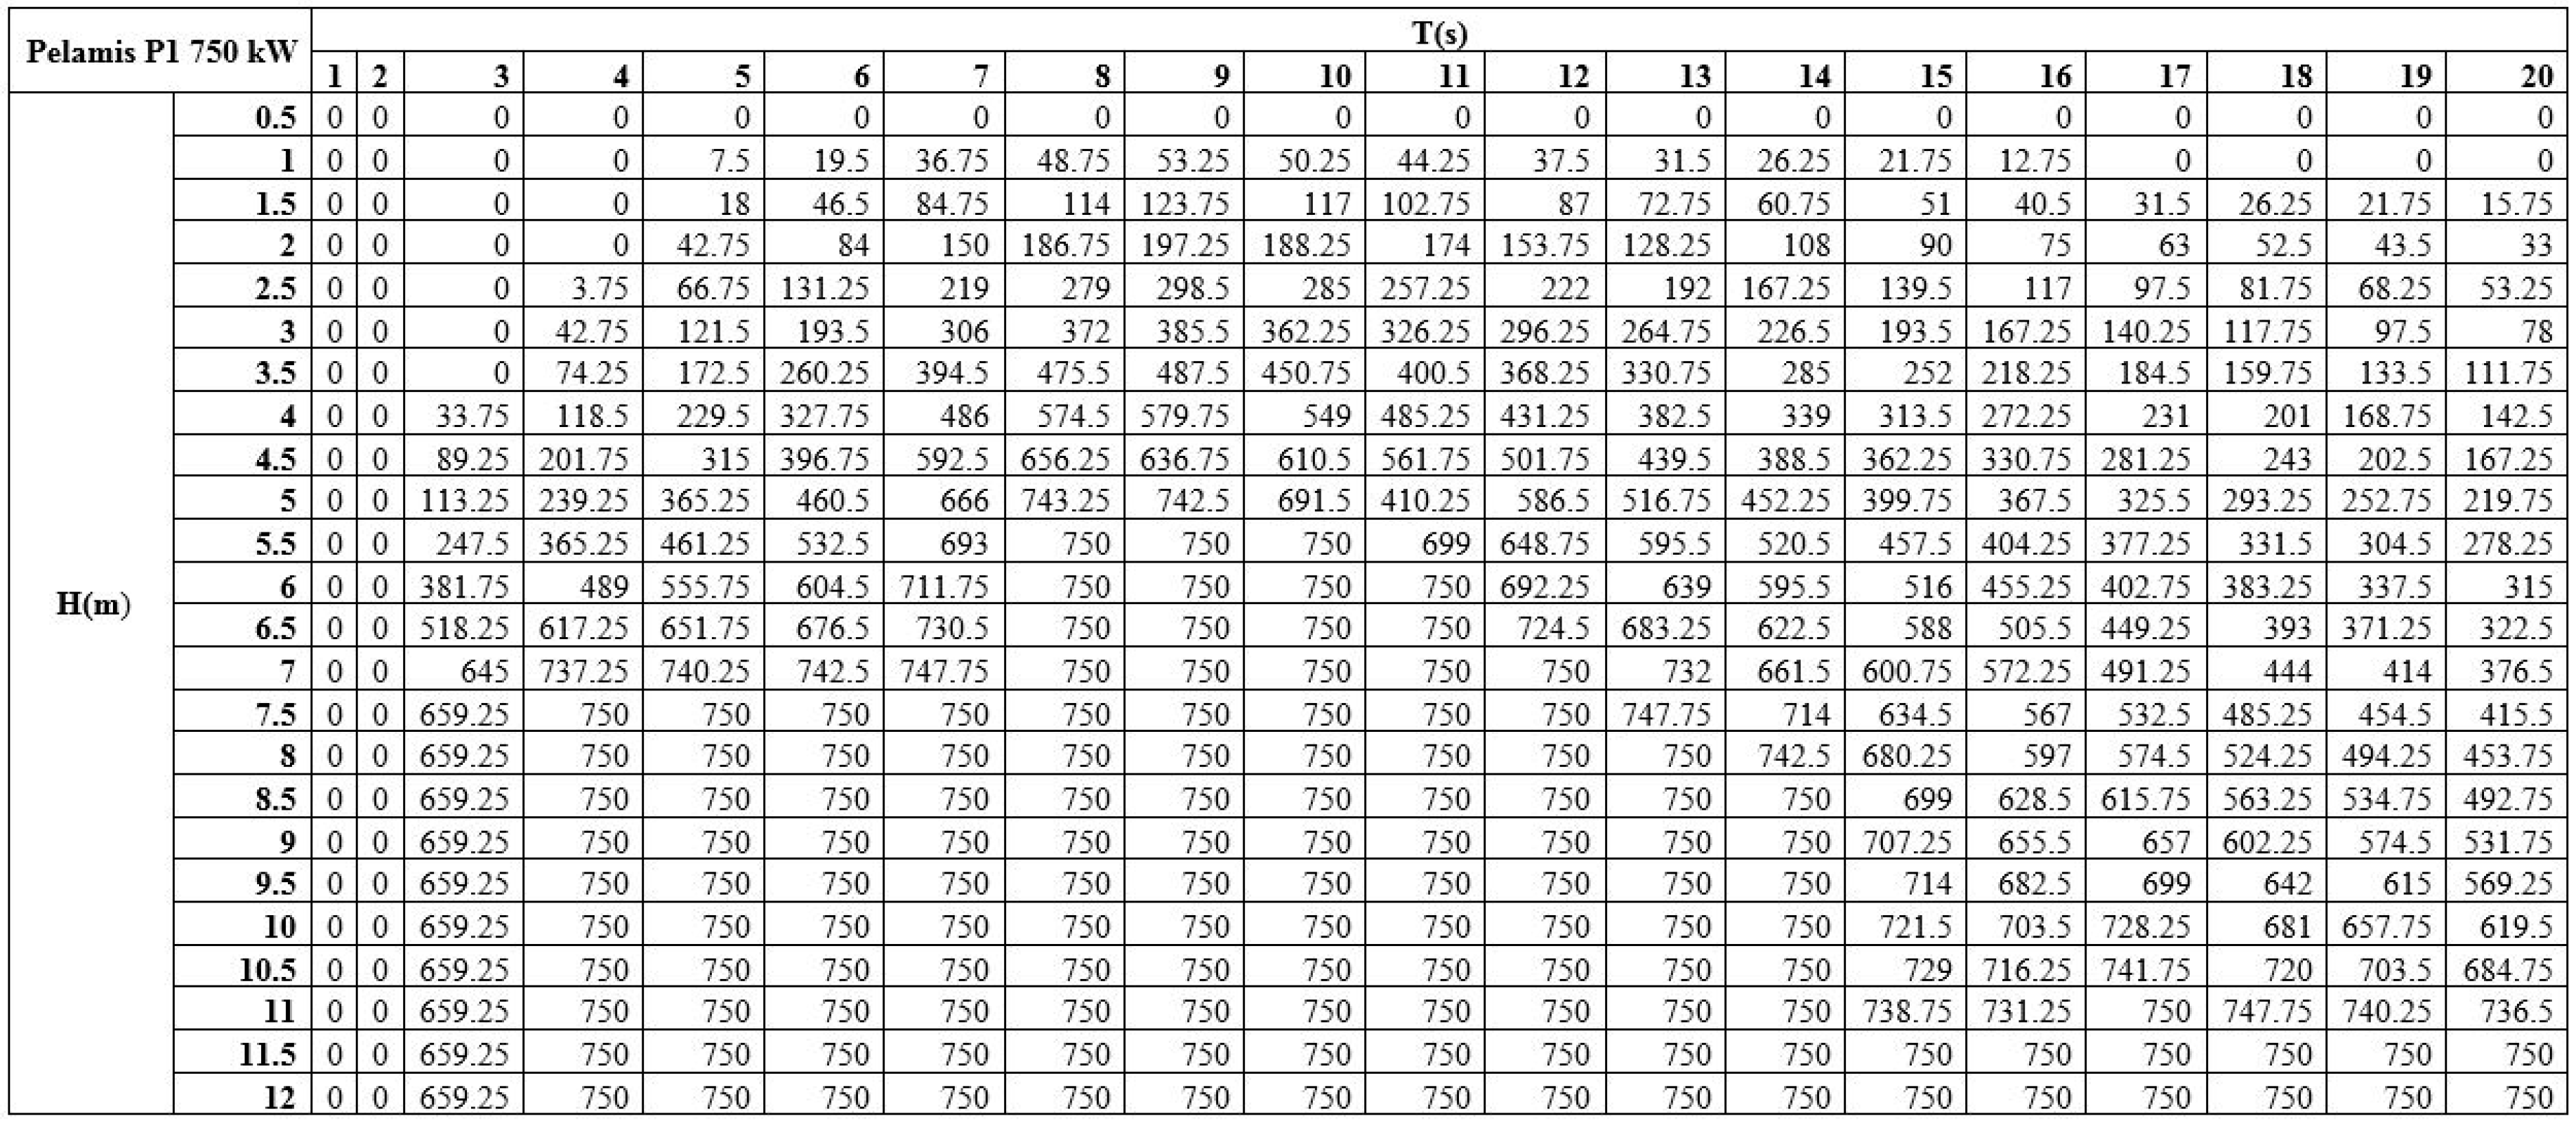
Appendix A.2.1. Pelamis P1 750 kW Power Matrix (kW)
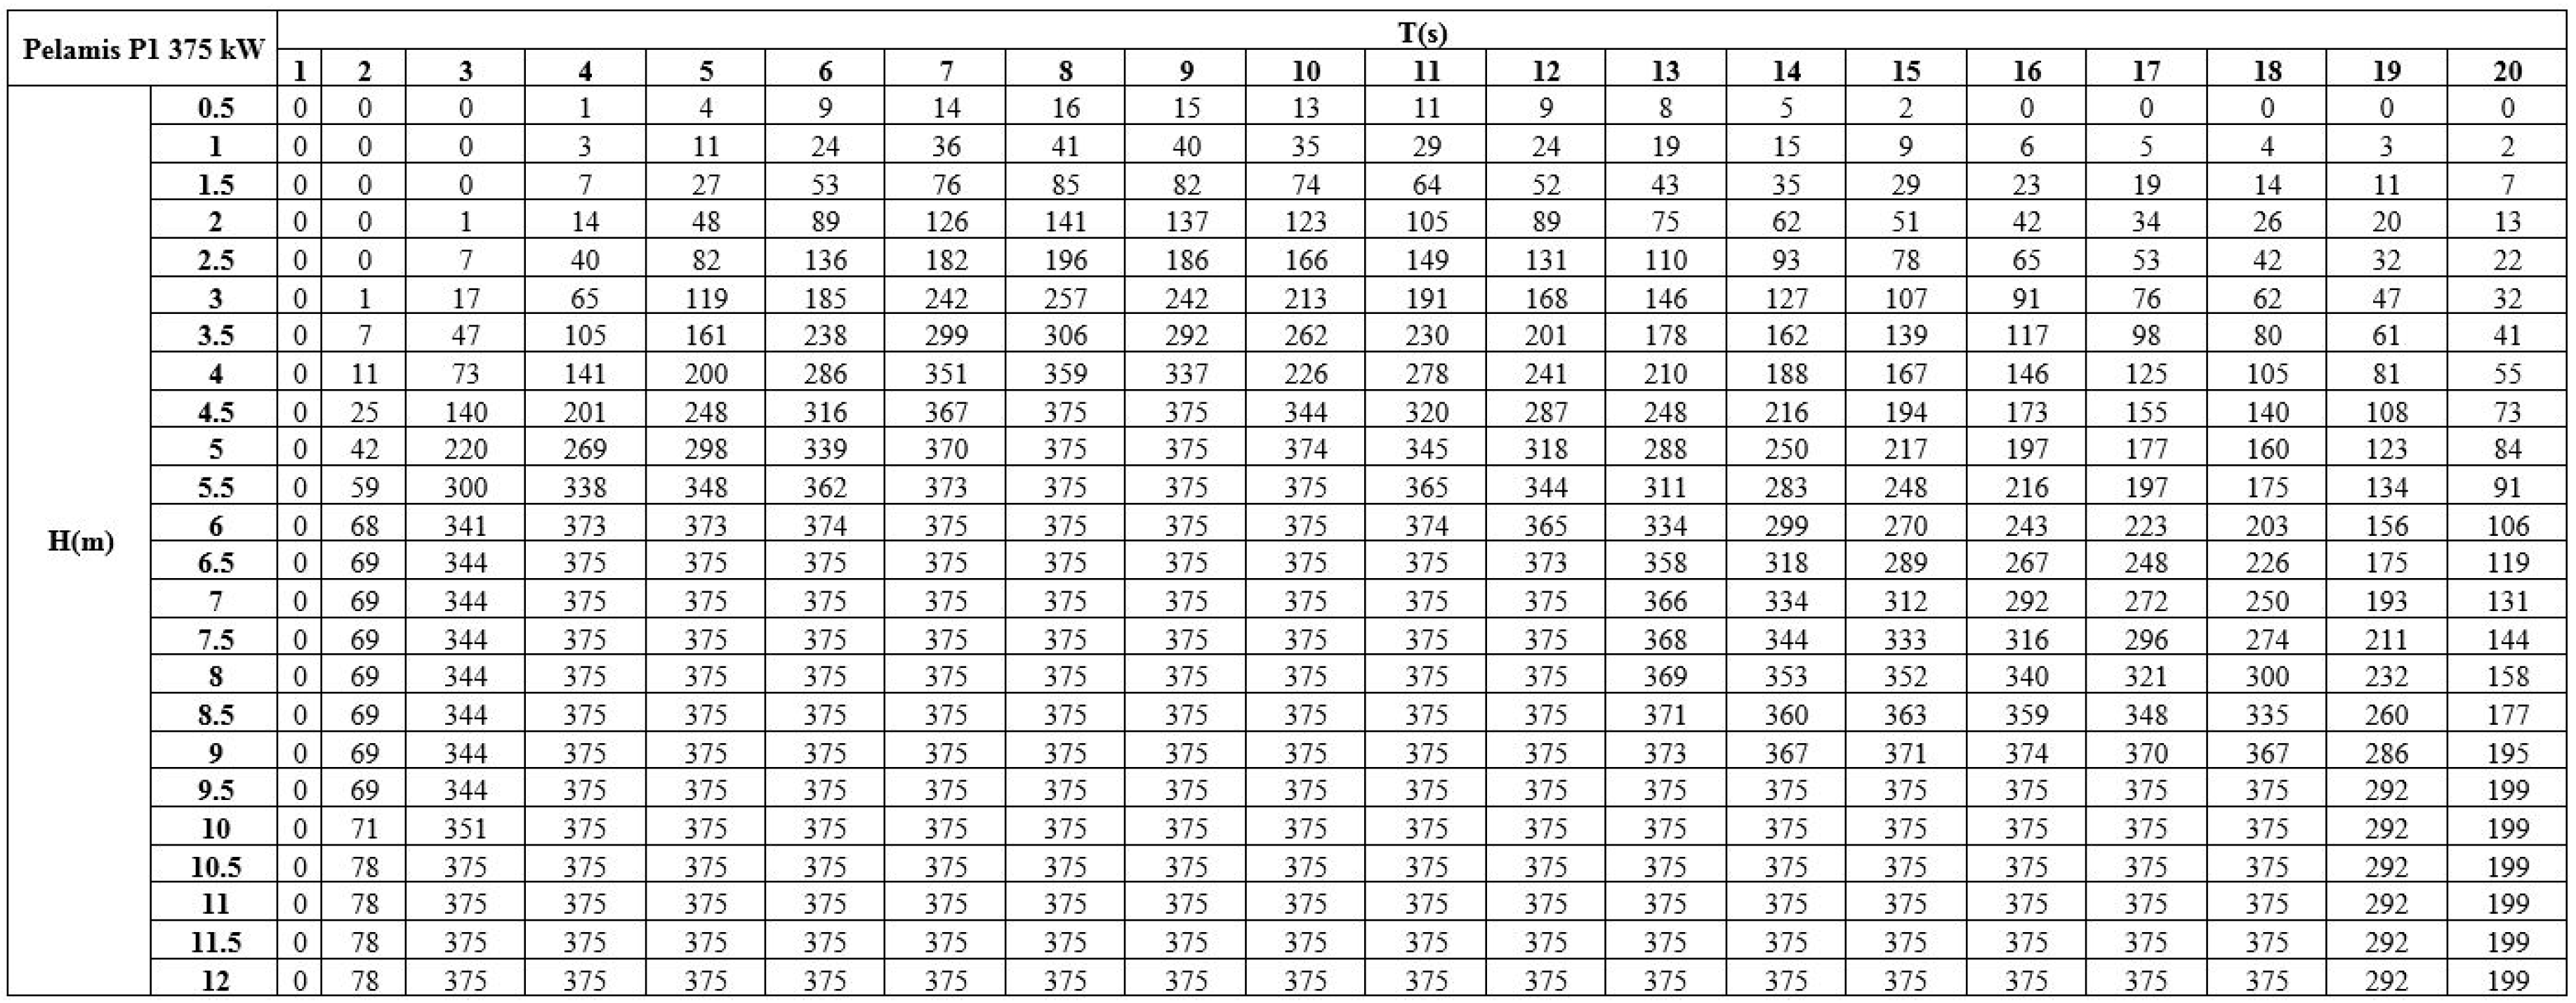
Appendix A.2.2. Pelamis P1 375 kW Power Matrix (kW)
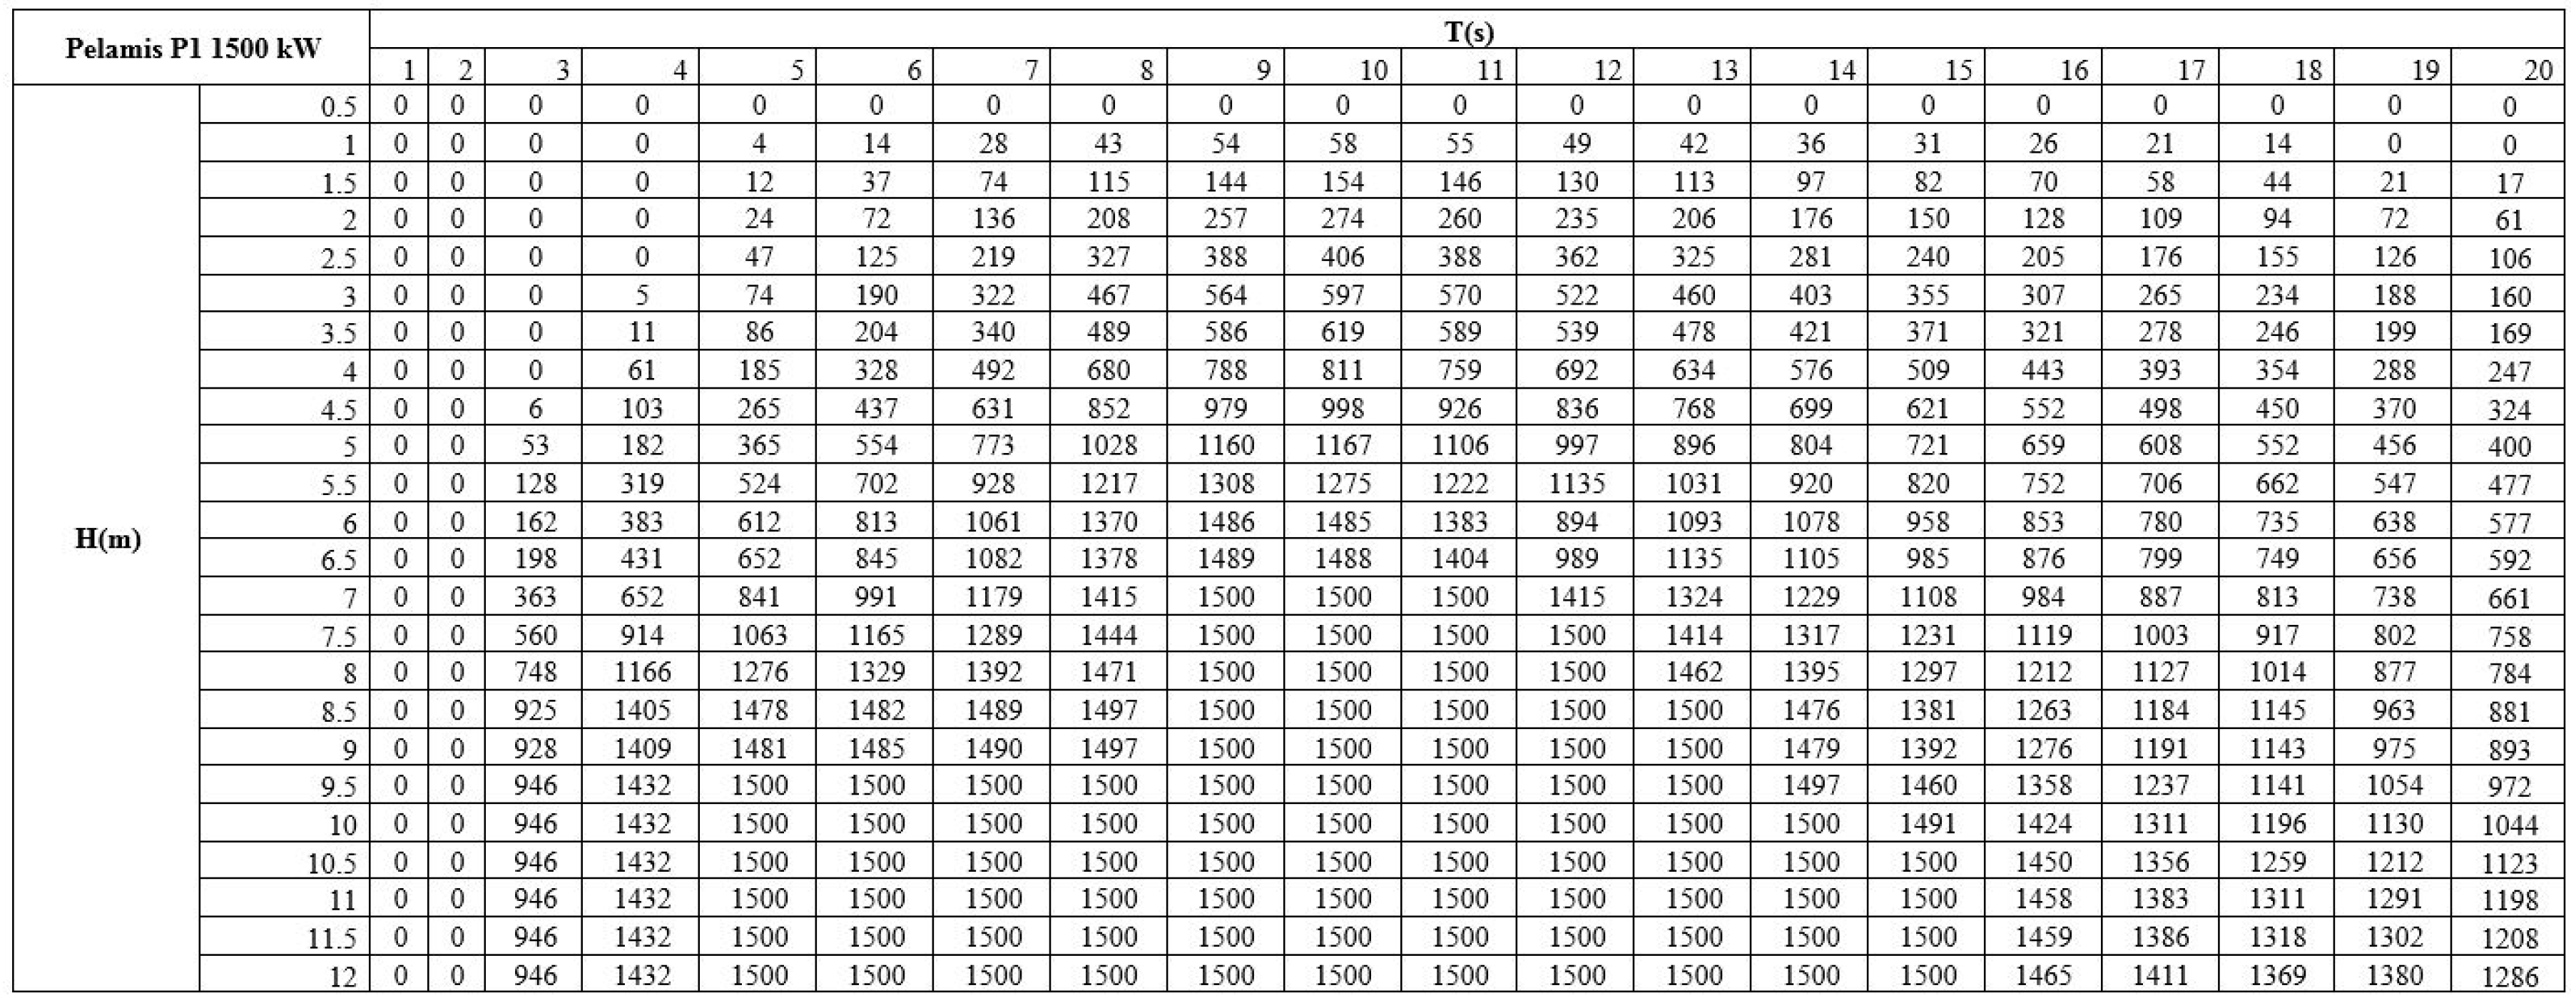
Appendix A.2.3. Pelamis P1 1500 kW Power Matrix (kW)
Appendix B. Justification of Risk Scores
Appendix B.1. Design Difficulty
Appendix B.1.1. How Scalable Is the Sub-System?

| Structure | Score | Justification |
|---|---|---|
| P1 750 kW | 1 | Device is made from steel plate which is formed and welded together. Steel plate can be considered to be infinitely scalable—large ships are made this way, these are larger than any WEC is likely to be. |
| P1 375 kW | ||
| P1 1500 kW | ||
| Corpower 750 kW (Steel) | ||
| P1 750 kW (Concrete) | 1 | The concrete Pelamis was considered to be infinitely scalable—widespread use of concrete in the construction industry to make massive structures. |
| P1 750 kW (GRP) | 2 | GRP was considered to be scalable up to a point. It has been extensively proven on small to moderate sized projects, however literature revealed that regulations within the shipping industry preventing the use of composites in large ships due to the high fire risk they pose [32]. This could be an issue developing a very large WEC. |
| Corpower 300 kW (Wave Spring) | ||
| Corpower 300 kW (Latching) | ||
| Corpower 300 kW (Linear Damping) | ||
| Corpower 750 kW (Wave Spring) |
| PTO | Score | Justification |
|---|---|---|
| P1 750 kW | 2 | Pelamis P1 uses conventional off the shelf hydraulics. These components are available in a range of sizes up to a point, however from the author’s knowledge of the hydraulics industry, at very large scales standard components may not exist, and it is likely that bespoke components would need to be manufactured. e.g., specially made rams or hydraulic motors for a very large Pelamis device. |
| P1 375 kW | ||
| P1 1500 kW | ||
| P1 750 kW (Concrete) | ||
| P1 750 kW (GRP) | ||
| Corpower 300 kW (Wave Spring) | 2 | The Corpower PTO was considered to be scalable up to a point, however it was assumed that at very large sizes the design details may need changed. Not enough data exists to accurately assess this. |
| Corpower 300 kW (Latching) | ||
| Corpower 300 kW (Linear Damping) | ||
| Corpower 750 kW (Wave Spring and Steel) |
| Control | Score | Justification |
|---|---|---|
| P1 750 kW | 2 | The control system is thought to be well suited up to a certain size, however the device will get to a point where its dynamics fall out of sync with the ocean waves in the way in which it was designed. |
| P1 375 kW | ||
| P1 1500 kW | ||
| P1 750 kW (Concrete) | ||
| P1 750 kW (GRP) | ||
| Corpower 300 kW (Wave Spring) | ||
| Corpower 300 kW (Latching) | ||
| Corpower 300 kW (Linear Damping) | ||
| Corpower 750 kW (Wave Spring and Steel) |
Appendix B.1.2. How Well Suited Is the Technology to Dealing with the Loading Placed upon It?
| Structure | Score | Justification |
|---|---|---|
| P1 750 kW | 2 | A structural design review of the Pelamis P1 indicated how the steel device would perform under fatigue (scores 3), extreme loading (scores 1) and ship impact (scores 2). This gave a total survivability score of 6, translating into a score of 2 for the survivability metric. |
| P1 375 kW | ||
| P1 1500 kW | ||
| Corpower 750 kW (Steel) | ||
| P1 750 kW (Concrete) | 2 | A structural design review of the concrete Pelamis P1 indicated how the device would perform under fatigue (scores 1), extreme loading (scores 1) and ship impact (scores 2). This gave a total survivability score of 6, translating into a score of 2 for the survivability metric. |
| P1 750 kW (GRP) | 2 | The same survivability logic was applied to the Corpower GRP devices as the GRP Pelamis, which therefore scored the same. |
| Corpower 300 kW (Wave Spring) | ||
| Corpower 300 kW (Latching) | ||
| Corpower 300 kW (Linear Damping) | ||
| Corpower 750 kW (Wave Spring) |
| PTO | Score | Justification |
|---|---|---|
| P1 750 kW | 2 | Industrial hydraulics can be designed to withstand very large loads and systems can be designed with blow off valves to protect the circuit (scores a 1 for extreme loading). Common to have cyclic loading on hydraulic systems however no standout fatigue performance in systems was recognised (scored 2). Ship impact was thought to be very destructive to hoses and other hydraulic components (scores 3). |
| P1 375 kW | ||
| P1 1500 kW | ||
| P1 750 kW (Concrete) | ||
| P1 750 kW (GRP) | ||
| Corpower 300 kW (Wave Spring) | 3 | All loads assumed to go through gearbox, without a load decoupling mechanism, suggesting little protection against extreme loading at PTO level (scores 3). No standout features identified with respect to fatigue (scores a 2). PTO unlikely to be serviceable after a ship impact, main concern would be input shaft bending (scores a 3). |
| Corpower 300 kW (Latching) | ||
| Corpower 300 kW (Linear Damping) | ||
| Corpower 750 kW (Wave Spring and Steel) |
| Control | Score | Justification |
|---|---|---|
| P1 750 kW | 2 | The control system for both concepts is designed to detune the device to sit under the surface of the waves in a storm, no stand out features so control survivability was considered as average [19,23]. |
| P1 375 kW | ||
| P1 1500 kW | ||
| P1 750 kW (Concrete) | ||
| P1 750 kW (GRP) | ||
| Corpower 300 kW (Wave Spring) | ||
| Corpower 300 kW (Latching) | ||
| Corpower 300 kW (Linear Damping) | ||
| Corpower 750 kW (Wave Spring and Steel) |
Appendix B.1.3. How Efficiently Does the Technology Perform Its Prime Function?
| Structure | Score | Justification |
|---|---|---|
| P1 750 kW | 2 | From the Pelamis P1 structural analysis document; the rigidity of steel was determined to be average (scores 2), resistance to buckling was determined to be poor (scores 3) and ballast requirement was determined to be average (scores 2) [19]. |
| P1 375 kW | ||
| P1 1500 kW | ||
| Corpower 750 kW (Steel) | ||
| P1 750 kW (Concrete) | 1 | From the Pelamis P1 structural analysis document; the rigidity of concrete was determined to be average (scores 2), resistance to buckling was determined to be very good (scores 1) and ballast requirement was determined to be low (scores 1) [19]. |
| P1 750 kW (GRP) | 3 | From the Pelamis P1 structural analysis document; the rigidity of GRP was determined to be poor (scores 3), resistance to buckling was determined to be poor (scores 3) and ballast requirement was determined to be high (scores 3). This logic was continued for the GRP Corpower device [19]. |
| Corpower 300 kW (Wave Spring) | ||
| Corpower 300 kW (Latching) | ||
| Corpower 300 kW (Linear Damping) | ||
| Corpower 750 kW (Wave Spring) |
| PTO | Score | Justification |
|---|---|---|
| P1 750 kW | 2 | Documentation on the PTO of the Pelamis P1 revealed that the efficiency of the system was around 80% translating to an efficiency score of 2. [15] |
| P1 375 kW | ||
| P1 1500 kW | ||
| P1 750 kW (Concrete) | ||
| P1 750 kW (GRP) | ||
| Corpower 300 kW (Wave Spring) | 1 | The efficiency of the Corpower WEC is commercially sensitive and cannot be disclosed, however translates to a risk score of 1. [23] |
| Corpower 300 kW (Latching) | ||
| Corpower 300 kW (Linear Damping) | ||
| Corpower 750 kW (Wave Spring and Steel) |
| Control | Score | Justification |
|---|---|---|
| P1 750 kW | 1 | Theoretical capture width of a line absorber of two wave lengths in length is 0.73λ, compares well to other WEC principals, indicating the potential of the control regime [33]. |
| P1 375 kW | ||
| P1 1500 kW | ||
| P1 750 kW (Concrete) | ||
| P1 750 kW (GRP) | ||
| Corpower 300 kW (Wave Spring) | 3 | Theoretical maximum capture width of a heaving body is 0.16λ, indicating a low theoretical capture width compared to other WEC types [15]. |
| Corpower 300 kW (Latching) | ||
| Corpower 300 kW (Linear Damping) | ||
| Corpower 750 kW (Wave Spring and Steel) |
Appendix B.1.4. How Well Suited Is the Technology for the Marine Environment?
| Structure | Score | Justification |
|---|---|---|
| P1 750 kW | 2 | Steel outer structure of Pelamis P1 will rust if not treated therefore. Needs painted for protection. |
| P1 375 kW | ||
| P1 1500 kW | ||
| Corpower 750 kW (Steel) | ||
| P1 750 kW (Concrete) | 1 | Concrete is well suited to the marine environment. No treatment is required. |
| P1 750 kW (GRP) | 1 | GRP is well suited to the marine environment and would not need any additional coatings or protection after the forming process has been completed [19]. Applies to both Pelamis and Corpower devices. |
| Corpower 300 kW (Wave Spring) | ||
| Corpower 300 kW (Latching) | ||
| Corpower 300 kW (Linear Damping) | ||
| Corpower 750 kW (Wave Spring) |
| PTO | Score | Justification |
|---|---|---|
| P1 750 kW | 3 | Off the shelf hydraulics are typically not water sealed or designed to work while submerged in water therefore these components would need packaged in a watertight space. Power electronics also need to be kept dry. |
| P1 375 kW | ||
| P1 1500 kW | ||
| P1 750 kW (Concrete) | ||
| P1 750 kW (GRP) | ||
| Corpower 300 kW (Wave Spring) | 3 | Steel gearbox would rust if exposed to sea water. Bearings are unlikely to be water sealed. Electric generators also unlikely to be sealed, therefore PTO needs sealed in a watertight container. |
| Corpower 300 kW (Latching) | ||
| Corpower 300 kW (Linear Damping) | ||
| Corpower 750 kW (Wave Spring and Steel) |
| Control | Score | Justification |
|---|---|---|
| P1 750 kW | 1 | This metric does not affect the control system. Scores lowest risk. |
| P1 375 kW | ||
| P1 1500 kW | ||
| P1 750 kW (Concrete) | ||
| P1 750 kW (GRP) | ||
| Corpower 300 kW (Wave Spring) | ||
| Corpower 300 kW (Latching) | ||
| Corpower 300 kW (Linear Damping) | ||
| Corpower 750 kW (Wave Spring and Steel) |
Appendix B.1.5. How Well Understood Is the Technology Exhibited in the Sub System?
| Structure | Score | Justification |
|---|---|---|
| P1 750 kW | 1 | Design and construction of floating steel structures extensively understood. |
| P1 375 kW | ||
| P1 1500 kW | ||
| Corpower 750 kW (Steel) | ||
| P1 750 kW (Concrete) | 1 | Concrete is widely used and knowledge is very good. |
| P1 750 kW (GRP) | 2 | GRP is understood however knowledge is less wide spread than steel and concrete and experts are required to implement effectively. |
| Corpower 300 kW (Wave Spring) | ||
| Corpower 300 kW (Latching) | ||
| Corpower 300 kW (Linear Damping) | ||
| Corpower 750 kW (Wave Spring) |
| PTO | Score | Justification |
|---|---|---|
| P1 750 kW | 1 | Hydraulic systems are widely understood by many hence the knowledge required to implement these systems is widely available. |
| P1 375 kW | ||
| P1 1500 kW | ||
| P1 750 kW (Concrete) | ||
| P1 750 kW (GRP) | ||
| Corpower 300 kW (Wave Spring) | 1 | The gears, generators, flywheels and dampers that make up the Corpower PTO are very common and well understood technologies, hence the knowledge complexity risk is low. |
| Corpower 300 kW (Latching) | ||
| Corpower 300 kW (Linear Damping) | ||
| Corpower 750 kW (Wave Spring and Steel) |
| Control | Score | Justification |
|---|---|---|
| P1 750 kW | 3 | Developing this control system requires in very depth knowledge of dynamics and wave mechanics. Knowledge complexity was considered to be the highest risk. This was considered to apply to the control system for both the Pelamis P1 and the Corpower WEC. |
| P1 375 kW | ||
| P1 1500 kW | ||
| P1 750 kW (Concrete) | ||
| P1 750 kW (GRP) | ||
| Corpower 300 kW (Wave Spring) | ||
| Corpower 300 kW (Latching) | ||
| Corpower 300 kW (Linear Damping) | ||
| Corpower 750 kW (Wave Spring and Steel) |
Appendix B.1.6. How Well Established Is the Reliability of the Technology?
| Structure | Score | Justification |
|---|---|---|
| P1 750 kW | 1 | As steel floating structures are very well understood, the reliability of such structures is well known and tested. |
| P1 375 kW | ||
| P1 1500 kW | ||
| Corpower 750 kW (Steel) | ||
| P1 750 kW (Concrete) | 3 | No one has made a floating concrete WEC before, additionally fatigue is hard to calculate for reinforced concrete. Reliability is unknown. |
| P1 750 kW (GRP) | 2 | Reliability of GRP as a structural material is understood and has been researched and tested in different industries. Data for its use on large WECs is however limited. |
| Corpower 300 kW (Wave Spring) | ||
| Corpower 300 kW (Latching) | ||
| Corpower 300 kW (Linear Damping) | ||
| Corpower 750 kW (Wave Spring and Steel) |
| PTO | Score | Justification |
|---|---|---|
| P1 750 kW | 1 | Reliability of off the shelf components is very well understood—components are extensively tested in development and tried and tested in other industries. |
| P1 375 kW | ||
| P1 1500 kW | ||
| P1 750 kW (Concrete) | ||
| P1 750 kW (GRP) | ||
| Corpower 300 kW (Wave Spring) | 3 | As the Corpower PTO is a bespoke device, and a full sized system has not been tested in the marine environment, the PTO reliability was determined to be unknown. |
| Corpower 300 kW (Latching) | ||
| Corpower 300 kW (Linear Damping) | ||
| Corpower 750 kW (Wave Spring and Steel) |
| Control | Score | Justification |
|---|---|---|
| P1 750 kW | 2 | Reliability of control system in real waves relatively unknown, there is however some test data present from the few deployments of the device. |
| P1 375 kW | ||
| P1 1500 kW | ||
| P1 750 kW (Concrete) | ||
| P1 750 kW (GRP) | ||
| Corpower 300 kW (Wave Spring) | 3 | Reliability of control system in real waves unknown as a full size device has never been tested in the ocean environment. |
| Corpower 300 kW (Latching) | ||
| Corpower 300 kW (Linear Damping) | ||
| Corpower 750 kW (Wave Spring and Steel) |
Appendix B.1.7. What Levels of Maintenance Does the Technology Require?
| Structure | Score | Justification |
|---|---|---|
| P1 750 kW | 3 | Literature revealed that the Pelamis is expected to need touch up paint at one point though out its life. |
| P1 375 kW | ||
| P1 1500 kW | ||
| Corpower 750 kW (Steel) | ||
| Corpower 750 kW (Steel) | ||
| P1 750 kW (Concrete) | 1 | Concrete was found to be maintenance free [19]. |
| P1 750 kW (GRP) | 1 | GRP was found to be maintenance free [19]. |
| Corpower 300 kW (Wave Spring) | ||
| Corpower 300 kW (Latching) | ||
| Corpower 300 kW (Linear Damping) | ||
| Corpower 750 kW (Wave Spring) |
| PTO | Score | Justification |
|---|---|---|
| P1 750 kW | 3 | Literature revealed that the P1 PTO needs replacement at one point in its lifetime. |
| P1 375 kW | ||
| P1 1500 kW | ||
| P1 750 kW (Concrete) | ||
| P1 750 kW (GRP) | ||
| Corpower 300 kW (Wave Spring) | 3 | Literature suggests that the drive units will need replacement at some point in the lifetime of the device. |
| Corpower 300 kW (Latching) | ||
| Corpower 300 kW (Linear Damping) | ||
| Corpower 750 kW (Wave Spring and Steel) |
| Control | Score | Justification |
|---|---|---|
| P1 750 kW | 1 | The control systems for both devices is expected to need very little, if any, maintenance. |
| P1 375 kW | ||
| P1 1500 kW | ||
| P1 750 kW (Concrete) | ||
| P1 750 kW (GRP) | ||
| Corpower 300 kW (Wave Spring) | ||
| Corpower 300 kW (Latching) | ||
| Corpower 300 kW (Linear Damping) | ||
| Corpower 750 kW (Wave Spring and Steel) |
Appendix B.1.8. How Many Manufacturing Steps Are Required to Take the Subsystem from the Final Engineering Design to a Fully Operational Device?
| Structure | Score | Justification |
|---|---|---|
| P1 750 kW | 3 | Structure of the Pelamis P1 is novel and bespoke, parts need to be cut, formed and joined. Considered as 3 steps. |
| P1 375 kW | ||
| P1 1500 kW | ||
| Corpower 750 kW (Steel) | ||
| P1 750 kW (Concrete) | 4 | Concrete structure needs mould to be made, concrete to be poured with wires tensioned, mould removal and final assembly. This was considered as 4 or more steps. |
| P1 750 kW (GRP) | 4 | Manufacturing a GRP structure requires many steps—moulds must be made, the layup must be applied to the mould, the mould closed, resin injected into the mould, then the curing process. Determined to be made of a minimum of 4 steps. |
| Corpower 300 kW (Wave Spring) | ||
| Corpower 300 kW (Latching) | ||
| Corpower 300 kW (Linear Damping) | ||
| Corpower 750 kW (Wave Spring) |
| PTO | Score | Justification |
|---|---|---|
| P1 750 kW | 2 | The off the shelf components require assembly into a system and are then integrated into the device. Two step process. |
| P1 375 kW | ||
| P1 1500 kW | ||
| P1 750 kW (Concrete) | ||
| P1 750 kW (GRP) | ||
| Corpower 300 kW (Wave Spring) | 3 | PTO for the Corpower device is bespoke, most of the main components will need to be manufactured and assembled. The cascade gearbox is bespoke and requires advanced machining work, before assembly and integration into the device. Determined to be 3 steps. |
| Corpower 300 kW (Latching) | ||
| Corpower 300 kW (Linear Damping) | ||
| Corpower 750 kW (Wave Spring and Steel) |
| Control | Score | Justification |
|---|---|---|
| P1 750 kW | 4 | Many testing steps required to produce working control system. Evidence of many different tank tests at different scales for both devices. Determined to be 4 or more steps. |
| P1 375 kW | ||
| P1 1500 kW | ||
| P1 750 kW (Concrete) | ||
| P1 750 kW (GRP) | ||
| Corpower 300 kW (Wave Spring) | ||
| Corpower 300 kW (Latching) | ||
| Corpower 300 kW (Linear Damping) | ||
| Corpower 750 kW (Wave Spring and Steel) |
Appendix B.1.9. How Manufacturable Is the Technology Used within the Sub-System?
| Structure | Score | Justification |
|---|---|---|
| P1 750 kW and Corpower 750 kW (Steel) | 2 | The 750 kW Pelamis determined to be manufactured in moderate production numbers. The complexity of the manufacturing process was thought to be minimal due to the relative ease of shaping and joining steel plate. |
| P1 375 kW | 3 | High production numbers and same process complexity logic as 750 kW device. |
| P1 1500 kW | 1 | Low production numbers and same process complexity logic as 750 kW device. |
| P1 750 kW (Concrete) | 3 | Pouring concrete into a mould and pre-tensioning the reinforcement steel was considered a complex manufacturing process. 750 kW device made in moderate volumes. |
| Corpower 300 kW (Wave Spring) | 4 | Manufacturing GRP was determined to be a complex manufacturing process. Being below 500 kW these devices were considered to be made in large production volumes. |
| Corpower 300 kW (Latching) | ||
| Corpower 300 kW (Linear Damping) | ||
| Corpower 750 kW (Wave Spring) | 3 | Manufacturing GRP was determined to be a complex manufacturing process. Devices rated between 0.5 and 1 MW, production volumes considered to be moderate. |
| P1 750 kW (GRP) |
| PTO | Score | Justification |
|---|---|---|
| P1 750 kW | 2 | Hydraulic PTO only requires components to be assembled together—straightforward process. Moderate production numbers. |
| P1 375 kW (GRP) | Hydraulic PTO only requires components to be assembled together—straightforward process. Large production numbers. | |
| P1 750 kW (Concrete) | Hydraulic PTO only requires components to be assembled together—straightforward process. Moderate production numbers. | |
| P1 750 kW (GRP) | ||
| P1 1500 kW | 1 | Hydraulic PTO only requires components to be assembled together—straightforward process. Small production numbers. |
| Corpower 300 kW (Wave Spring) | 4 | Components in cascade gearbox would require advanced but widely available technology to manufacture. Other components are assumed to be bought as standard parts and simply assembled together. Large production volumes. |
| Corpower 300 kW (Latching) | ||
| Corpower 300 kW (Linear Damping) | ||
| Corpower 750 kW (Wave Spring and Steel) | 3 | Same as other Corpower PTOs however produced in moderate production volumes. |
| Control | Score | Justification |
|---|---|---|
| P1 750 kW | 2 | Requires specialist computer modelling tools and wave tank test equipment to develop. Wave simulation software and wave tanks are assumed to be advanced, but well established technologies. Independent of production volumes. |
| P1 375 kW | ||
| P1 1500 kW | ||
| P1 750 kW (Concrete) | ||
| P1 750 kW (GRP) | ||
| Corpower 300 kW (Wave Spring) | ||
| Corpower 300 kW (Latching) | ||
| Corpower 300 kW (Linear Damping) | ||
| Corpower 750 kW (Wave Spring and Steel) |
Appendix B.2. Resources
Appendix B.2.1. What Is the Total Cost of a Pilot Device?
| Structure | Score | Justification |
|---|---|---|
| P1 750 kW | 3, 3, 4 | P10—£13,383,695. Average—£14,919,338. P90—£16,547,591. Scores 3, 3, 4. (P10, average, P90) |
| P1 375 kW | 3, 3, 3 | P10—£10,772,590. Average—£11,753,375. P90—£12,865,759. Scores 3, 3, 3. (P10, average, P90) |
| P1 1500 kW | 4, 4, 5 | P10—£16,371,734. Average—£18,241,800. P90—£20,380,437. Scores 4, 4, 5. (P10, average, P90) |
| P1 750 kW (Concrete) | 3, 3, 4 | P10—£13,570,693. Average—£14,977,575. P90—£16,559,417. Scores 3, 3, 4. (P10, average, P90) |
| P1 750 kW (GRP) | 3, 4, 4 | P10—£13,570,724. Average—£15,073,104. P90—£16,679,225. Scores 3, 4, 4. (P10, average, P90) |
| Corpower 300 kW (Wave Spring) | 2, 2, 3 | P10—£9,387,824. Average—£10,179,709. P90—£11,086,531. Scores 2, 2, 3. (P10, average, P90) |
| Corpower 300 kW (Latching) | 3, 3, 4 | P10—£13,300,704. Average—£14,789,700. P90—£16,467,015. Scores 3, 3, 4. (P10, average, P90) |
| Corpower 300 kW (Linear Damping) | 2, 3, 3 | P10—£9,714,931. Average—£10,516,052. P90—£11,418,993. Scores 2, 3, 3. (P10, average, P90) |
| Corpower 750 kW (Wave Spring) | 3, 3, 3 | P10—£10,288,754. Average—£11,277,621. P90—£12,365,014. Scores 3, 3, 3. (P10, average, P90) |
Appendix B.2.2. What Learning Investment Is Required to Develop the Technology?
| Structure | Score | Justification |
|---|---|---|
| P1 750 kW | 3, 6, 9 | P10—£2.95 billion. Average—£5.27 billion. P90—£8.74 billion. Scores 3, 6, 9. (P10, average, P90) |
| P1 375 kW | 5, 6, 9 | P10—£4.08 billion. Average—£5.78 billion. P90—£8.45 billion. Scores 5, 6, 9. (P10, average, P90) |
| P1 1500 kW | 2, 5, 10 | P10—£1.93 billion. Average—£4.84 billion. P90—£9.27 billion. Scores 2, 5, 10. (P10, average, P90) |
| P1 750 kW (Concrete) | 3, 6, 9 | P10—£2.97 billion. Average—£5.36 billion. P90—£8.86 billion. Scores 3, 6, 9. (P10, average, P90) |
| P1 750 kW (GRP) | 3, 6, 9 | P10—£3.06 billion. Average—£5.40 billion. P90—£8.82 billion. Scores 3, 6, 9. (P10, average, P90) |
| Corpower 300 kW (Wave Spring) | 4, 6, 8 | P10—£3.56 billion. Average—£5.08 billion. P90—£7.3 billion. Scores 4, 6, 8. (P10, average, P90) |
| Corpower 300 kW (Latching) | 6, 8, 11 | P10—£5 billion. Average—£7.34 billion. P90—£10.34 billion. Scores 6, 8, 11. (P10, average, P90) |
| Corpower 300 kW (Linear Damping) | 4, 5, 8 | P10—£3.62 billion. Average—£5.22 billion. P90—£7.46 billion. Scores 4, 5, 8. (P10, average, P90) |
| Corpower 750 kW (Wave Spring) | 4, 6, 9 | P10—£3.9 billion. Average—£5.62 billion. P90—£8.2 billion. Scores 4, 6, 9. (P10, average, P90) |
Appendix B.2.3. How Long Does the Device Take to Manufacture?
| Structure | Score | Justification |
|---|---|---|
| P1 750 kW | 3 | Literature revealed that at full capacity PWP would produce 10 MW per year. Based on a 40 h working week it was calculated that 2080 h a year would be available to manufacture ten 1 MW devices, hence the manufacturing output is 208 h/MW. It has been recognised that this is a fairly crude justification and more research is required to accurately obtain a score. |
| Corpower 750 kW (Steel) | ||
| P1 375 kW | ||
| P1 1500 kW | ||
| P1 750 kW (Concrete) | 3 | Literature revealed that concrete can take several weeks to set properly, therefore, it was determined that the device would take significantly longer to manufacture than an offshore wind turbine. This assumption has however been made in ignorance due to no reliable data available for this particular metric. |
| Corpower 300 kW (Wave Spring) | 2 | It was assumed that the GRP devices would take a similar time to manufacture (per MW) as offshore wind turbines. Offshore wind turbines are made from a combination of structural steel, GRP and pre-assembled modular units such as the generator, gearbox and power electronics. This was assumed to be similar to the subsystems that make up the GRP structured WECs therefore the manufacturing time was considered to be comparable. |
| Corpower 300 kW (Latching) | ||
| Corpower 300 kW (Linear Damping) | ||
| Corpower 750 kW (Wave Spring) | ||
| P1 750 kW (GRP) |
Appendix B.2.4. How Long Does the Device Take to Install in Its Deployment Location?
| Structure | Score | Justification |
|---|---|---|
| P1 750 kW | 1 | Literature revealed that the Pelamis P1 could be installed in 30 min, well within the minimum 6-h weather window therefore the installation time was thought to be low risk [19]. The 1500 kW device was assumed to be installable in under 6 h, as doubling the capacity was thought to only increase installation time a little, if any. |
| P1 375 kW | ||
| P1 1500 kW | ||
| P1 750 kW (Concrete) | ||
| P1 750 kW (GRP) | ||
| Corpower 300 kW (Wave Spring) | 1 | Literature revealed that the Corpower wave energy converter can be installed and removed within 30 min, well within the minimum 6-h weather window therefore the installation time was thought to be low risk [23]. The 750 kW device was assumed to be installable in under 6 h, as doubling the capacity was thought to only increase installation time a little, if any. Scores 1. |
| Corpower 300 kW (Latching) | ||
| Corpower 300 kW (Linear Damping) | ||
| Corpower 750 kW (Wave Spring and Steel) |
Appendix B.2.5. What Are the Infrastructure Requirements to Manufacture/Assemble the Device?
| Structure | Score | Justification |
|---|---|---|
| P1 750 kW | 1 | Devices are all transportable by road so can be manufactured in land. The Pelamis structural design report detailed that there were many locations where concrete and steel P1 structural tubes could be manufactured [19]. |
| P1 375 kW | ||
| P1 750 kW (Concrete) | ||
| P1 1500 kW | 2 | 1500 kW device was deemed too large to transport therefore facilities for manufacture would be required by the sea. It is assumed that this device can be manufactured in existing shipping yards. |
| P1 750 kW (GRP) | 2 | The Pelamis structural design report indicated that the choice of manufacturing locations for GRP devices of this scale is limited. |
| Corpower 300 kW (Wave Spring) | 3 | This device is too large to be transported by road (see R6) and we know from the Pelamis report that there are limited locations where GRP structures can be built. This suggests that these devices would require a manufacturing facility on the shore. Large GRP structures have been developed by the wind energy industry however this has required serious investments in infrastructure. |
| Corpower 300 kW (Latching) | ||
| Corpower 300 kW (Linear Damping) | ||
| Corpower 750 kW (Wave Spring and Steel) |
Appendix B.2.6. What Are the Infrastructure Requirements to Transport and Install the Device?
| Structure | Score | Justification |
|---|---|---|
| P1 750 kW | 1 | The 750 kW Pelamis device is designed to fit onto the back of a lorry in sections for transportation. |
| P1 375 kW | 1 | The 375 kW device smaller than 750 kW so should easily fit onto conventional lorries. |
| P1 1500 kW | 3 | The 1500 kW device is unlikely to fit onto roads within the legal size and weight restrictions. |
| P1 750 kW (Concrete) | 3 | Pelamis P1 structural design report classifies handling Concrete device as “v. difficult” [19]. Unlikely to be transportable by road. |
| P1 750 kW (GRP) | 1 | Pelamis P1 structural design report classifies handling GRP device as “easy” [19]. Likely that it can be transported by road. |
| Corpower 300 kW (Wave Spring) | 3 | The dimensions of this device suggest that the moulded structures will not be transportable by road. The dimensions cannot be disclosed however they are too large to realistically fit onto a standard HGV. |
| Corpower 300 kW (Latching) | ||
| Corpower 300 kW (Linear Damping) | ||
| Corpower 750 kW (Wave Spring and Steel) | 3 | The diameter of this device is expected to be significantly larger than the 300 kW device, which is not transportable by road. |
Appendix B.2.7. What Are the Infrastructure Requirements to Servicing the Device?
| Structure | Score | Justification |
|---|---|---|
| P1 750 kW | 2 | Literature revealed that the Pelamis P1 would require removal from site to conduct all routine maintenance [15]. |
| P1 375 kW | ||
| P1 1500 kW | ||
| P1 750 kW (Concrete) | ||
| P1 750 kW (GRP) | ||
| Corpower 300 kW (Wave Spring) | 2 | Literature revealed that the Corpower WEC would require removal from site to conduct all routine maintenance [23]. |
| Corpower 300 kW (Latching) | ||
| Corpower 300 kW (Linear Damping) | ||
| Corpower 750 kW (Wave Spring and Steel) |
References
- Joint Research Centre Institute for Energy and Transport. 2014 JRC Ocean Energy Status Report; European Commission: Luxembourg, 2015. [Google Scholar]
- SI Ocean. Ocean Energy: State of the Art. 1992. Available online: http://si-ocean.eu/en/upload/docs/WP3/Technology%20Status%20Report_FV.pdf (accessed on 25 August 2016).
- The Crown Estate. Offshore Wind Cost Reduction: Pathways Study. 2012. Available online: https://www.thecrownestate.co.uk/media/5493/ei-offshore-wind-cost-reduction-pathways-study.pdf (accessed on 25 August 2016).
- MacGillivray, A.; Jeffrey, H.; Hanmer, C.; Magagna, D.; Raventos, A.; Badcock-Broe, A. Ocean Energy Technology: Gaps and Barriers, SI Ocean. 2013. Available online: http://www.si-ocean.eu/en/upload/docs/WP3/Gaps%20and%20Barriers%20Report%20FV.pdf (accessed on 25 August 2016).
- Wilson, C. Up-scaling, formative phases, and learning in the historical diffusion of energy technologies. Energy Policy 2012, 50, 81–94. [Google Scholar] [CrossRef]
- International Energy Agency (IEA). Projected Costs of Generating Electricity; IEA: Paris, France, 2010. [Google Scholar]
- O’Connor, M.; Lewis, T.; Dalton, G. Techno-economic performance of the Pelamis P1 and Wavestar at different ratings and various locations in Europe. Renew. Energy 2012, 50, 889–900. [Google Scholar] [CrossRef]
- De Andres, A.; MacGillivray, A.; Cuanche, R.; Jeffrey, H. Factors affecting LCOE of ocean energy technologies: A study of technology and deployment attractiveness. In Proceedings of the International Conference on Ocean Energy, Halifax, NS, Canada, 4–6 November 2014.
- Chozas, J.F.; Kofoed, J.P.; Jensen, N.E.H. User Guide—COE Calculation Tool for Wave Energy Converters; Aalborg University: Aalborg, Denmark, 2014. [Google Scholar]
- Stevens, R.; Brook, P.; Jackson, K.; Stuart, A. Systems Engineering: Coping with Complexity; Prentice Hall Europe: Harlow, UK, 1998. [Google Scholar]
- University of Edinburgh. Open Sea Operating Experience to Reduce Wave Energy Costs; OPERA: Edinburgh, UK, 2016. [Google Scholar]
- Weber, J. WEC Technology Readiness and Performance Matrix—Finding the best research technology development trajectory. In Proceedings of the 4th International Conference on Ocean Energy, Dublin, Ireland, 17–19 October 2012.
- Farrell, N.; O’Donoghue, C.; Morrissey, K. Quantifying the uncertainty of wave energy conversion device cost for policy appraisal: An Irish case study. Energy Policy 2015, 1, 62–77. [Google Scholar] [CrossRef]
- Moody, J.A.; Chapman, W.L.; van Voorhees, F.D.; Bahill, A.T. Metrics and Case Studies for Evaluating Engineering Designs; Prentice Hall PTR: Upper Saddle River, NJ, USA, 1997. [Google Scholar]
- Yemm, R.; Pizer, D.; Retzler, C.; Henderson, R. Pelamis: Experience from Concept to Connection. Phil. Trans. R. Soc. A 2012, 370, 365–380. [Google Scholar] [CrossRef] [PubMed]
- Todalshaug, J.H.; Asgeirsson, G.S.; Hjalmarsson, E.; Maillet, J.; Moller, P.; Pires, P.; Guerinel, M.; Lopes, M. Tank Testing of an inherently phase controlled Wave Energy Converter. In Proceedings of the 11th European Wave and Tidal Energy Conference, Nantes, France, 6–11 September 2015.
- De Andres, A.; Maillet, J.; Todalshaug, J.H.; Moller, P.; Bould, D.; Jeffrey, H. Decision making metrics for techno-economic assessment of wave energy converters. Energies 2016, 1, 9. [Google Scholar]
- SI Ocean. Ocean Energy: Cost of Energy and Cost Reduction Opportunities. 2013. Available online: http://si-ocean.eu/en/upload/docs/WP3/CoE%20report%203_2%20final.pdf (accessed on 25 August 2016).
- Ocean Power Delivery. Pelamis WEC—Main Body Structural Design and Material Selection. 2003. Available online: http://webarchive.nationalarchives.gov.uk/tna/+/http:/www.dti.gov.uk/renewables/publications/pdfs/v0600197.pdf/ (accessed on 25 August 2016). [Google Scholar]
- Suarez, F.F.; Utterback, J.M. Dominant designs and the survival of firms. Strateg. Manag. J. 1995, 16, 415–430. [Google Scholar] [CrossRef]
- Ocean Energy Systems (OES). International LCOE for Ocean Energy Technologies. 2015. Available online: https://www.ocean-energy-systems.org/news/international-lcoe-for-ocean-energy-technology/ (accessed on 25 August 2016).
- Entec UK Ltd. Cost Estimation Methodology; The Carbon Trust: Edinburgh, UK, 2006. [Google Scholar]
- Corpower Ocean. Front-End Engineering and Design Study: Stage 3. HiDrive PTO—Scale 1:2—25 kW; Corpower Ocean: Stockholm, Sweden, 2015. [Google Scholar]
- MacGillivray, A. Economically Sustainable Development of Wave and Tidal Stream Energy Technologies; The University of Edinburgh: Edinburgh, UK, 2015. [Google Scholar]
- O’Connor, M.; Lewis, T.; Dalton, G. Weather window analysis of Irish west coast wave data with relevance to operations and maintenace of marine renewables. Renew. Energy 2013, 52, 57–66. [Google Scholar] [CrossRef]
- Wave Energy Scotland. Call Guidance Document; Wave Energy Scotland: Inverness, UK, 2015. [Google Scholar]
- Guanche, R.; de Andres, A.D.; Simal, P.D.; Vidal, C.; Losada, I.J. Uncertainty analysis of wave energy farms financial indicators. Renew. Energy 2014, 1, 570–580. [Google Scholar] [CrossRef]
- Astariz, S.; Iglesias, G. Wave energy vs. other energy sources: A reassessment of the economics. Int. J. Green Energy 2016, 13, 747–755. [Google Scholar] [CrossRef]
- Mukora, A.; Winskel, M.; Jeffrey, H.; Mueller, M. Learning curves for emerging energy technologies. Proc. Inst. Civ. Eng. Energy 2009, 162, 151–159. [Google Scholar] [CrossRef]
- Siemens. A New Spin on Production. Siemens, 1 October 2014. Available online: http://www.siemens.com/innovation/en/home/pictures-of-the-future/energy-and-efficiency/sustainable-power-generation-efficient-wind-turbine-production.html (accessed on 5 February 2016).
- Dunn, W.L.; Shultis, J.K. Exploring Monte Carlo Methods; Elsevier: Amsterdam, The Netherlands, 2011. [Google Scholar]
- Materials Today. Why Not Composites in Ships? Materials Today. Available online: http://www.materialstoday.com/carbon-fiber/features/why-not-composites-in-ships/ (accessed on 20 March 2016).
- House of Lords European Union Comittee. 27th Report of Session 2007–08, THe EU’s Target for Renewable Energy: 20% by 2020, Volume I: Report. Available online: http://www.publications.parliament.uk/pa/ld200708/ldselect/ldeucom/175/175.pdf (accessed on 15 October 2015).
| Case Study | Device | Design Change | Notes |
|---|---|---|---|
| 1 |
| Scale | Testing the effect of device scale on value for risk. Three Froude scaled variants of Pelamis P1. |
| 2 |
| Material | Testing the effect of structure on value for risk. Three structural variants of Pelamis P1. |
| 3 |
| Control regime | Testing the effect of control system on value for risk. Three variants of the Corpower WEC operating under different control regimes. |
| 4 |
| PTO | Comparing the PTO of the CorPower device to the PTO of the Pelamis P1. Mature vs. novel technology. |
| 5 |
| Material, PTO, control system | Comparing the value for risk of an up-scaled CorPower device (exhibiting many technologies to achieve cost reduction; material, PTO, control system) to the Pelamis P1 which represents more mature, less risky technologies. |
| Cost Component | Factor | Reference |
|---|---|---|
| Installation | 0.33 | D |
| Spare parts | 0.02 | D |
| Rent | 0.02 | D |
| Site investigation | 0.02 | D |
| Grid connection | 0.05 | D |
| Management | 0.1 | TIC |
| Decommissioning | 0.1 | TIC |
| Insurance | 0.03 | TIC |
| O&M | 0.03 | TIC |
| Device | Reference Cost (£) | £/MW | Scaling Factor | Scaled Cost (£) |
|---|---|---|---|---|
| 750 kW | Pelamis P1 | 1,372,020 | 1 | 743,178 |
| 375 kW | Pelamis P1 | 1,372,020 | 1.25 | 743,178 |
| 1500 kW | Pelamis P1 | 1,372,020 | 0.75 | 2,058,030 |
| 750 kW | CorPower Ocean | N/A | 0.625 | N/A |
| Device | Cost (Thousand £) | Reduction (%) |
|---|---|---|
| Commercial Steel P1 | 1332 | 2.9 |
| Commercial Concrete P1 | 1294 | 5.7 |
| Commercial GRP P1 | 1360 | 0.8 |
| Costs | Commercial Deployment (Million £) |
|---|---|
| Onshore Cable | 8.67 |
| Offshore Cable | 1.47 |
| Onshore Substation | 5.14 |
| Offshore Substation | 0.69 |
| Total | 15.97 |
| Location | Availability |
|---|---|
| Ireland | 0.75 |
| Greece | 0.55 |
| Control Regime | PTO Force Ratio |
|---|---|
| Linear Damping | 1.24 |
| Latching | 4.27 |
| WaveSpring | 1 |
| LCOE Calculation | Ireland | Greece |
|---|---|---|
| O’Connor (£kWh) | 0.18 | 0.75 |
| Hutcheson (£kWh) | 0.14 to 0.18 | 0.83 to 0.98 |
| Difference (%) | −28.6 to 0 | 9.6 to 23.5 |
| Design Difficulty Metrics | Marine Energy Metric | Category Weighting |
|---|---|---|
| Design type |
| 1.5 |
| Knowledge complexity |
| 1 |
| Steps |
| 1 |
| Quality |
| 1 |
| Process Design |
| 0.5 |
| Resources Metrics | Marine Energy Metric | Category Weighting |
|---|---|---|
| Cost |
| 1.5 |
| Time |
| 1 |
| Infrastructure |
| 1 |
| Score | Description |
|---|---|
| 1 | The technology can be easily scaled, to any likely scale without significant redesign of the sub-system. |
| 2 | The technology can be easily scaled without significant redesign to a point; however, for very large devices a significant redesign would be required. |
| 3 | The technology does not lead itself to being scaled in its current configuration, unless a significant re-design is carried out. |
| 4 | The technology cannot be scaled from its current form without a significant engineering breakthrough in the technology. |
| Score | Description |
|---|---|
| 1 | Good survivability. Combined score 3 or 4 |
| 2 | Average survivability. Combined score 5 to 7 |
| 3 | Poor survivability. Combined score 8 or 9 |
| System | Metric | 1 | 2 | 3 |
|---|---|---|---|---|
| Structure | Rigidity, buckling, ballast requirement | 3 or 4 | 5 to 7 | 8 or 9 |
| PTO | Energy conversion efficiency of entire system | >90% | >50% | <50% |
| Control | Maximum theoretical capture width (in terms of oncoming wavelength) | >0.5 λ | 0.5 λ to 0.25 λ | <0.25 λ |
| Score | Description |
|---|---|
| 1 | Technology well suited to the marine environment, will not corrode or bio-foul in sea water in its standard untreated form. |
| 2 | The technology is not well suited to the marine environment in its standard form but can be chemically treated to protect it. |
| 3 | The technology is not well suited to the marine environment and cannot be treated to protect it. It can be sealed in a protective casing. |
| Score | Description |
|---|---|
| 1 | The technology is well understood by many and has been commercialised. |
| 2 | The technology is well understood by only specialists and has been commercialised. |
| 3 | The technology is understood only by specialists in a research sense and has never been commercialised. |
| Score | Description |
|---|---|
| 1 | Reliability of the technology is very well understood with extensive data to prove it. |
| 2 | Reliability of the technology is known to an extent, with some test data/operational data. |
| 3 | Reliability of the technology is unknown, with no reliable test data. |
| Score | Description |
|---|---|
| 1 | The technology is designed to be maintenance-free for the lifetime of the device. |
| 2 | The technology requires only light maintenance at regular intervals. Maintenance conducted offshore. |
| 3 | The technology requires replacement/overhaul once throughout the lifetime of the device. Maintenance carried out on shore. |
| 4 | The technology is designed to need replacing/overhauling several times throughout the device’s life span. Maintenance carried out on shore. |
| Score | Description |
|---|---|
| 1 | Off-the-shelf assembly fits straight into device (one step). |
| 2 | Off-the-shelf components assembled into sub-system, then installed in device (two steps). |
| 3 | Bespoke components requiring a few manufacturing steps before being assembled into the sub-system and then being installed into the device (three steps). |
| 4 | Bespoke components requiring many manufacturing steps before being assembled into the sub-system before being installed into the device (four or more steps). |
| Score | Description |
|---|---|
| 1 |
|
| 2 |
|
| 3 |
|
| 4 |
|
| 5 |
|
| Score | Cost (Million £) |
|---|---|
| 1 | <5 |
| 2 | 5 to 10 |
| 3 | 10 to 15 |
| 4 | 15 to 20 |
| 5 | 20 to 25 |
| 6 | 25 to 30 |
| 7 | 30 to 35 |
| 8 | 35 to 40 |
| 9 | >40 |
| Score | Cost (Million £) |
|---|---|
| 1 | <1 |
| 2 | 2 to 3 |
| 3 | 2 to 3 |
| 4 | 3 to 4 |
| 5 | 4 to 5 |
| 6 | 5 to 6 |
| 7 | 6 to 7 |
| 8 | 7 to 8 |
| 9 | 8 to 9 |
| 10 | 9 to 10 |
| 11 | >10 |
| Score | Description |
|---|---|
| 1 | Manufacturing time is under 66 h/MW |
| 2 | Manufacturing time is between 66 h/MW and 100 h/MW |
| 3 | Manufacturing time is over 100 h/MW |
| Score | Description |
|---|---|
| 1 | At least 6 h and up to 2 m wave height |
| 2 | At least 6 h and up to 1.5 m wave height At least 12 h and up to 2 m wave height |
| 3 | At least 24 h and up to 1.5 m wave height At least 12 h and up to 1.5 m wave height At least 24 h and up to 2 m wave height |
| 4 | At least 6 h and up to 1 m wave height At least 12 h and up to 1 m wave height |
| 5 | At least 24 h and 1 m wave height |
| Score | Description |
|---|---|
| 1 | Existing and widely available facilities can be used to manufacture the device. These include land-based workshops that can be used to assemble the technology. |
| 2 | Existing and widely available port facilities can be used to manufacture the device. Specially built facilities are required to manufacture the device. Facilities can be inland. |
| 3 | Specially built facilities are required to manufacture the device. Facilities must be on the shore so the device can be deployed straight to the sea. |
| Score | Description |
|---|---|
| 1 |
|
| 2 |
|
| 3 |
|
| Score | Description |
|---|---|
| 1 | Small non-specialist vessels required to do offshore maintenance. |
| 2 | Small non-specialist vessels required to retrieve the device for maintenance. Specialist vessels required to do offshore maintenance. |
| 3 | Specialist vessels required to retrieve the device for onshore maintenance. |
| Case Study | Device | LCOE (£/kWh) |
|---|---|---|
| 1 | P1 750 kW | 0.16 |
| P1 375 kW | 0.149 | |
| P1 1500 kW | 0.182 | |
| 2 | P1 750 kW Concrete | 0.152 |
| P1 750 kW GRP | 0.159 | |
| 3 | CorPower Ocean 300 kW (WaveSpring) | 0.115 |
| CorPower Ocean 300 kW (Latching) | 0.409 | |
| CorPower Ocean 300 kW (Linear Damping) | 0.359 | |
| 4 | CorPower Ocean 750 kW (Steel) | 0.136 |
| 5 | CorPower Ocean 750 kW (GRP) | 0.135 |
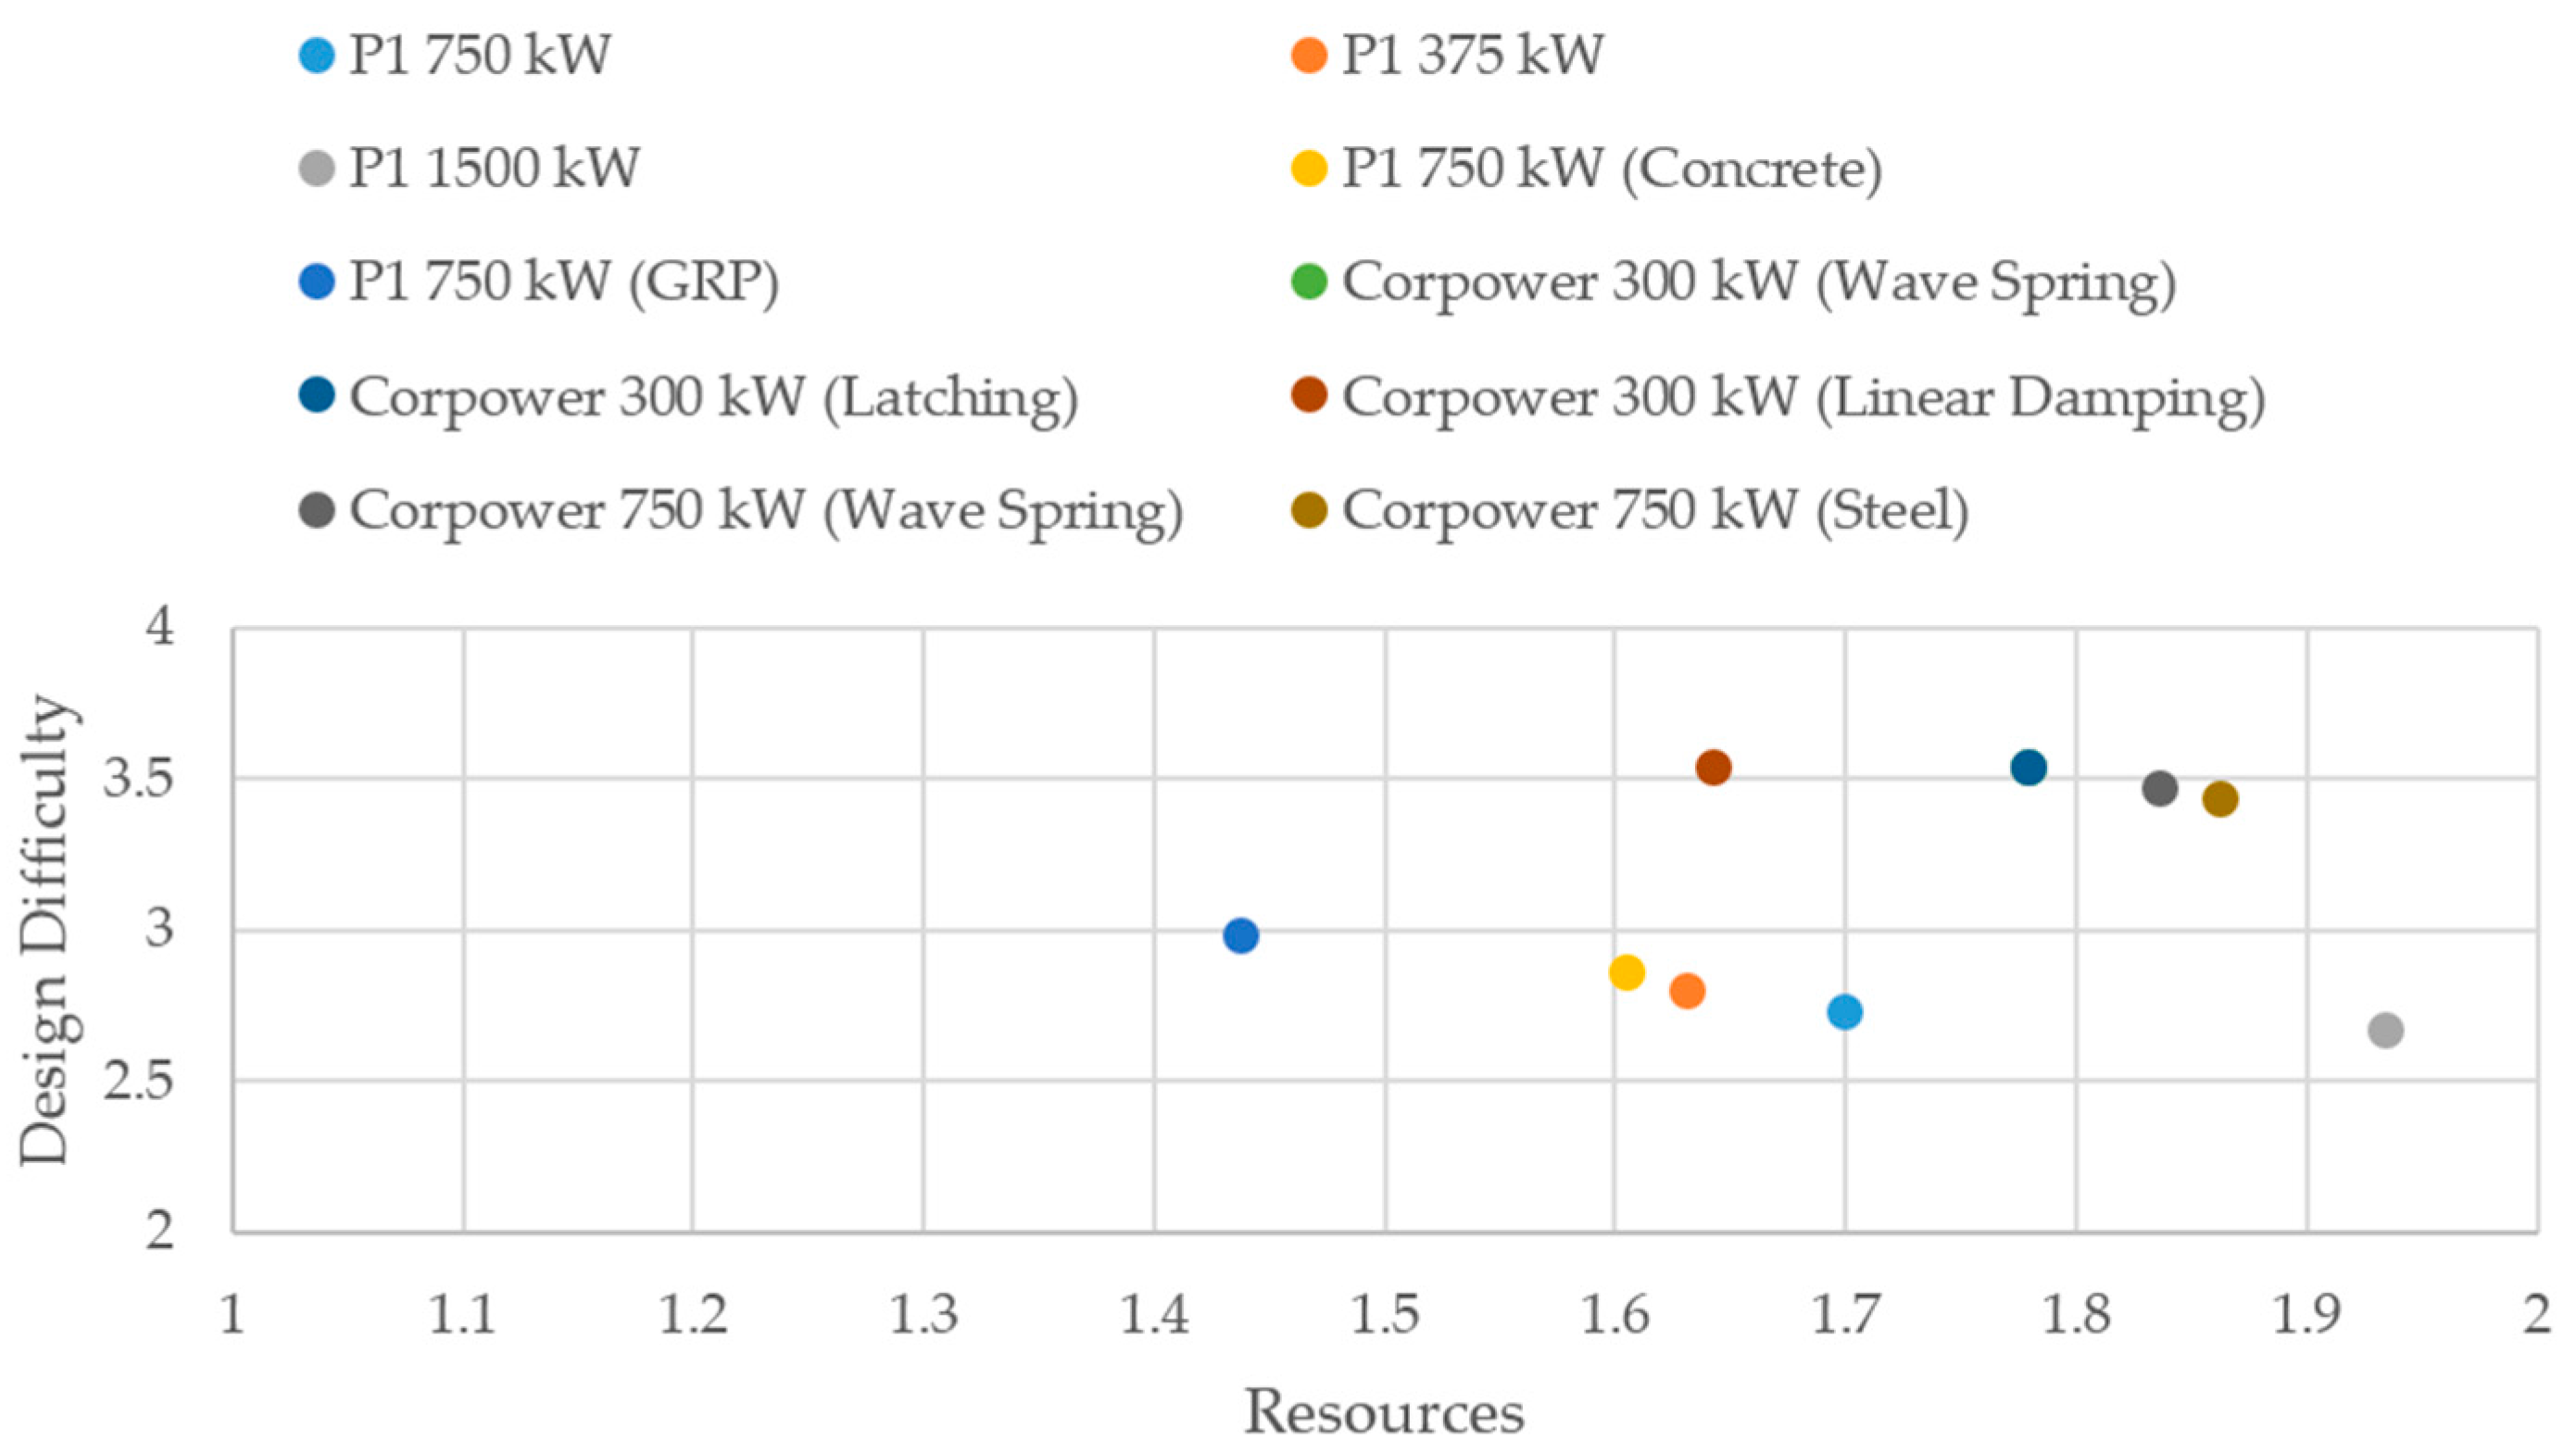
| Case Study | Device | Design Difficulty | Resources | Combined Risk |
|---|---|---|---|---|
| 1 | P1 750 kW | 2.73 | 1.7 | 4.43 |
| P1 375 kW | 2.8 | 1.63 | 4.5 | |
| P1 1500 kW | 2.66 | 1.93 | 4.6 | |
| 2 | P1 750 kW Concrete | 2.86 | 1.60 | 4.67 |
| P1 750 kW GRP | 2.98 | 1.44 | 4.7 | |
| 3 | CorPower Ocean 300 kW (WaveSpring) | 3.53 | 1.53 | 5.2 |
| CorPower Ocean 300 kW (Latching) | 3.53 | 1.78 | 5.45 | |
| CorPower Ocean 300 kW (Linear Damping) | 3.53 | 1.64 | 5.33 | |
| 4 | CorPower Ocean 750 kW (Steel) | 3.43 | 1.86 | 5.3 |
| 5 | CorPower Ocean 750 kW (GRP) | 3.47 | 1.84 | 5.44 |
| Case Study | Device | P10 | P50 | P90 | Std. Dev. | Coefficient of Variation |
|---|---|---|---|---|---|---|
| 1 | P1 750 kW | 0.139 | 0.16 | 0.183 | 0.017 | 10.6% |
| P1 375 kW | 0.128 | 0.149 | 0.171 | 0.018 | 12.1% | |
| P1 1500 kW | 0.158 | 0.182 | 0.206 | 0.013 | 6.3% | |
| 2 | P1 750 kW Concrete | 0.131 | 0.152 | 0.173 | 0.016 | 10.5% |
| P1 750 kW GRP | 0.138 | 0.159 | 0.182 | 0.017 | 10.7% | |
| 3 | CorPower Ocean 300 kW (WaveSpring) | 0.099 | 0.115 | 0.134 | 0.013 | 11.3% |
| CorPower Ocean 300 kW (Latching) | 0.347 | 0.409 | 0.473 | 0.047 | 11.5% | |
| CorPower Ocean 300 kW (Linear Damping) | 0.306 | 0.359 | 0.414 | 0.04 | 11.1% | |
| 4 | CorPower Ocean 750 kW (Steel) | 0.118 | 0.136 | 0.154 | 0.014 | 10.3% |
| 5 | CorPower Ocean 750 kW (GRP) | 0.117 | 0.135 | 0.154 | 0.014 | 10.4% |
| Trend Line | Equation | R2 |
|---|---|---|
| Average | y = 122.85x2 − 50.994x + 9.6763 | 0.565 |
| P10 | y = 130.04x2 − 49.547x + 9.0408 | 0.537 |
| P90 | y = 114.78x2 − 52.296x + 10.372 | 0.599 |
| Rank | Device | Sub-System | % Reduction in RR Ratio |
|---|---|---|---|
| 1 | 300 kW CorPower Ocean (WaveSpring) | Control | 39% |
| 2 | 750 kW CorPower Ocean (GRP) | Combined | 31% |
| 3 | 750 kW CorPower Ocean (Steel) | PTO | 29% |
| 4 | 750 kW Pelamis P1 (Concrete) | Structure | 10% |
| 5 | 375 kW Pelamis P1 (Steel) | Scale | 8% |
| 6 | 750 kW Pelamis P1 (GRP) | Material | 6% |
© 2016 by the authors; licensee MDPI, Basel, Switzerland. This article is an open access article distributed under the terms and conditions of the Creative Commons Attribution (CC-BY) license (http://creativecommons.org/licenses/by/4.0/).
Share and Cite
Hutcheson, J.; De Andrés, A.; Jeffrey, H. Risk vs. Reward: A Methodology to Assess Investment in Marine Energy. Sustainability 2016, 8, 873. https://doi.org/10.3390/su8090873
Hutcheson J, De Andrés A, Jeffrey H. Risk vs. Reward: A Methodology to Assess Investment in Marine Energy. Sustainability. 2016; 8(9):873. https://doi.org/10.3390/su8090873
Chicago/Turabian StyleHutcheson, John, Adrián De Andrés, and Henry Jeffrey. 2016. "Risk vs. Reward: A Methodology to Assess Investment in Marine Energy" Sustainability 8, no. 9: 873. https://doi.org/10.3390/su8090873
APA StyleHutcheson, J., De Andrés, A., & Jeffrey, H. (2016). Risk vs. Reward: A Methodology to Assess Investment in Marine Energy. Sustainability, 8(9), 873. https://doi.org/10.3390/su8090873