
Development of Hybrid Model for Estimating Construction Waste for Multifamily Residential Buildings Using Artificial Neural Networks and Ant Colony Optimization

Abstract
:1. Introduction
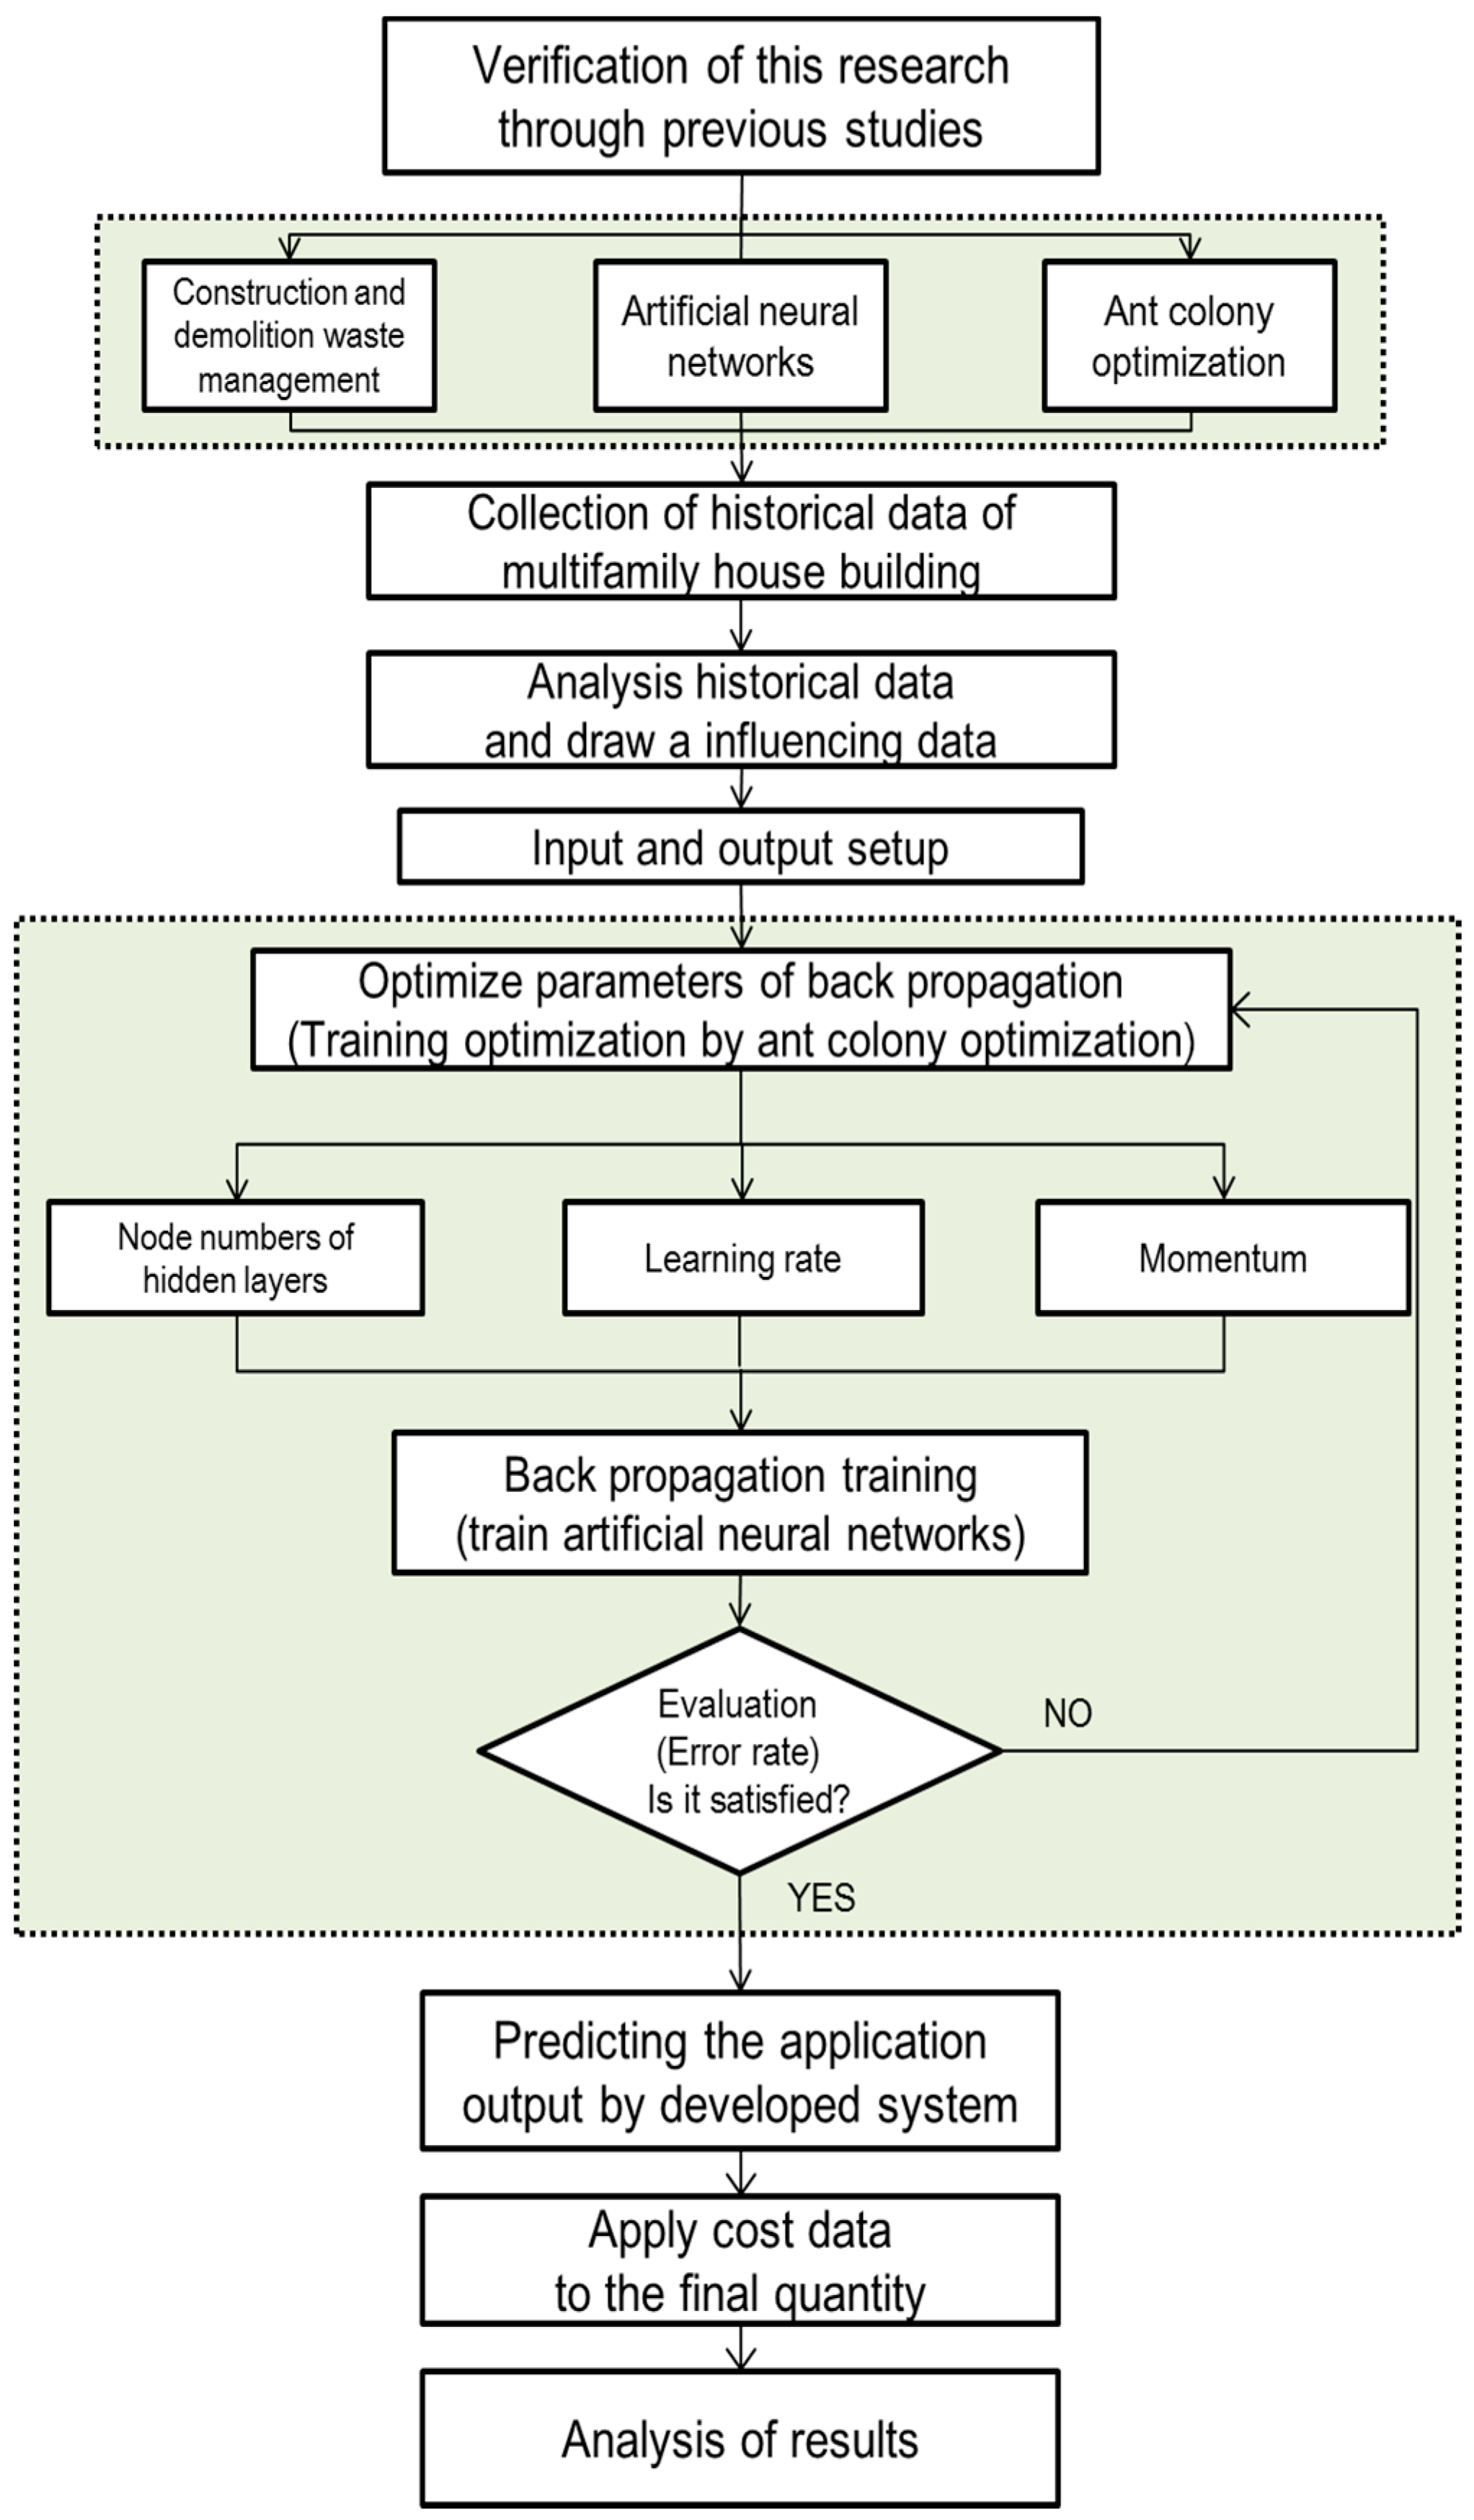
2. Methodology
3. Literature Review
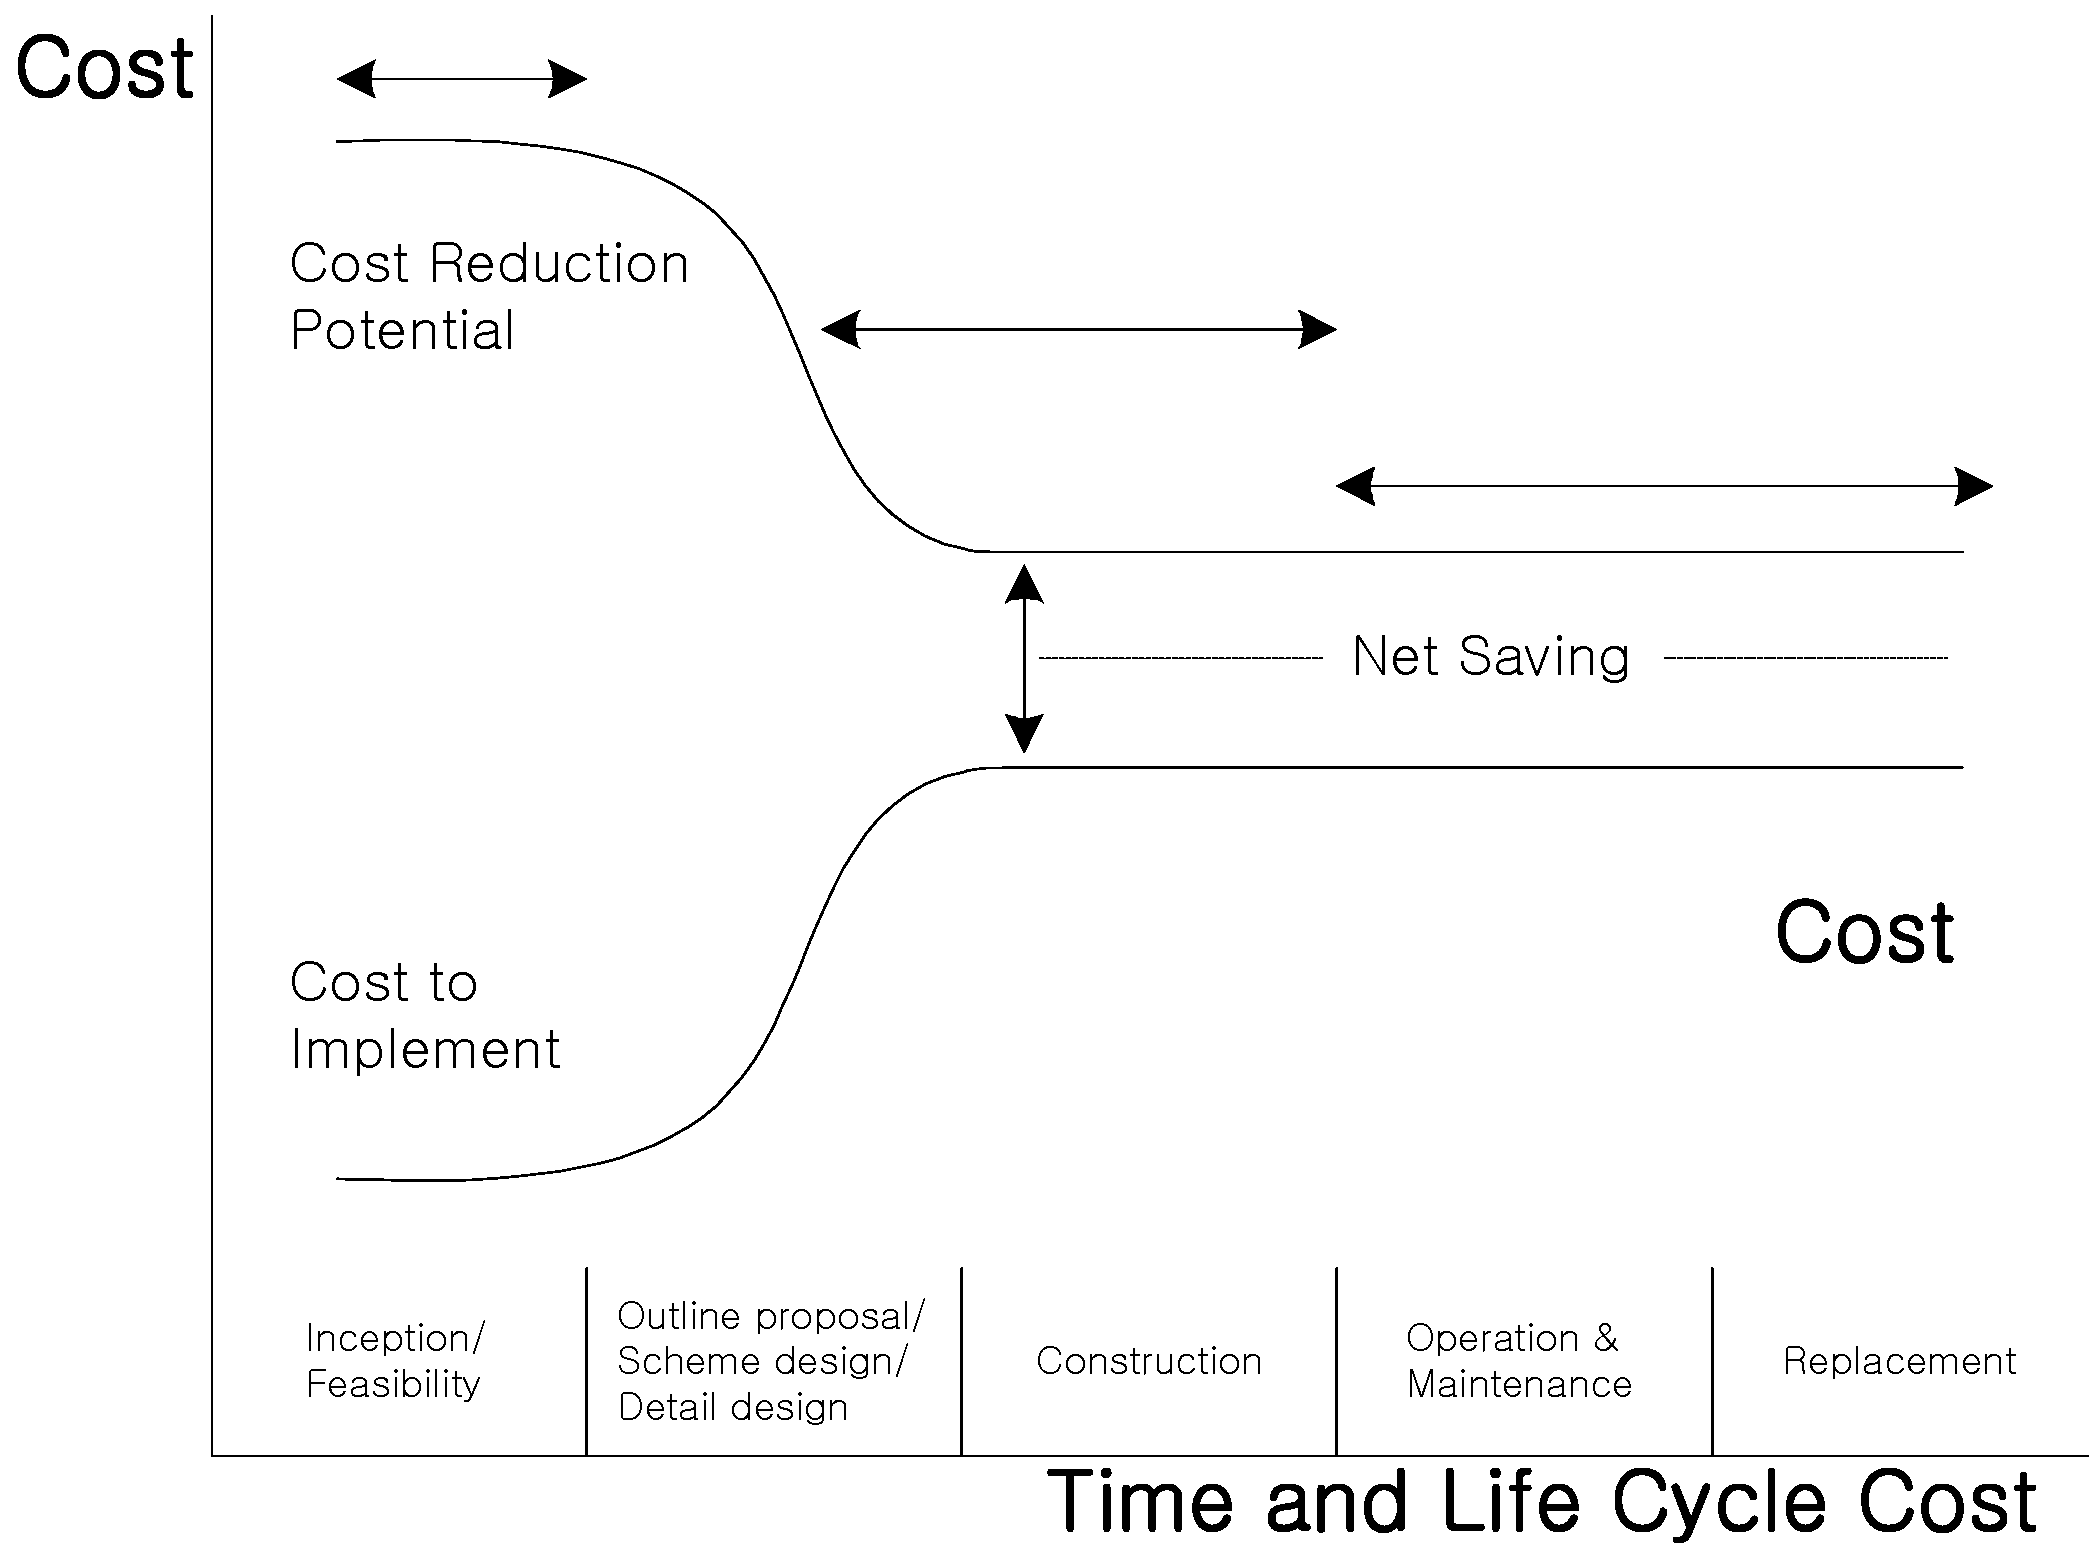
3.1. Cost Estimation of Construction Waste
3.2. Construction Waste Management
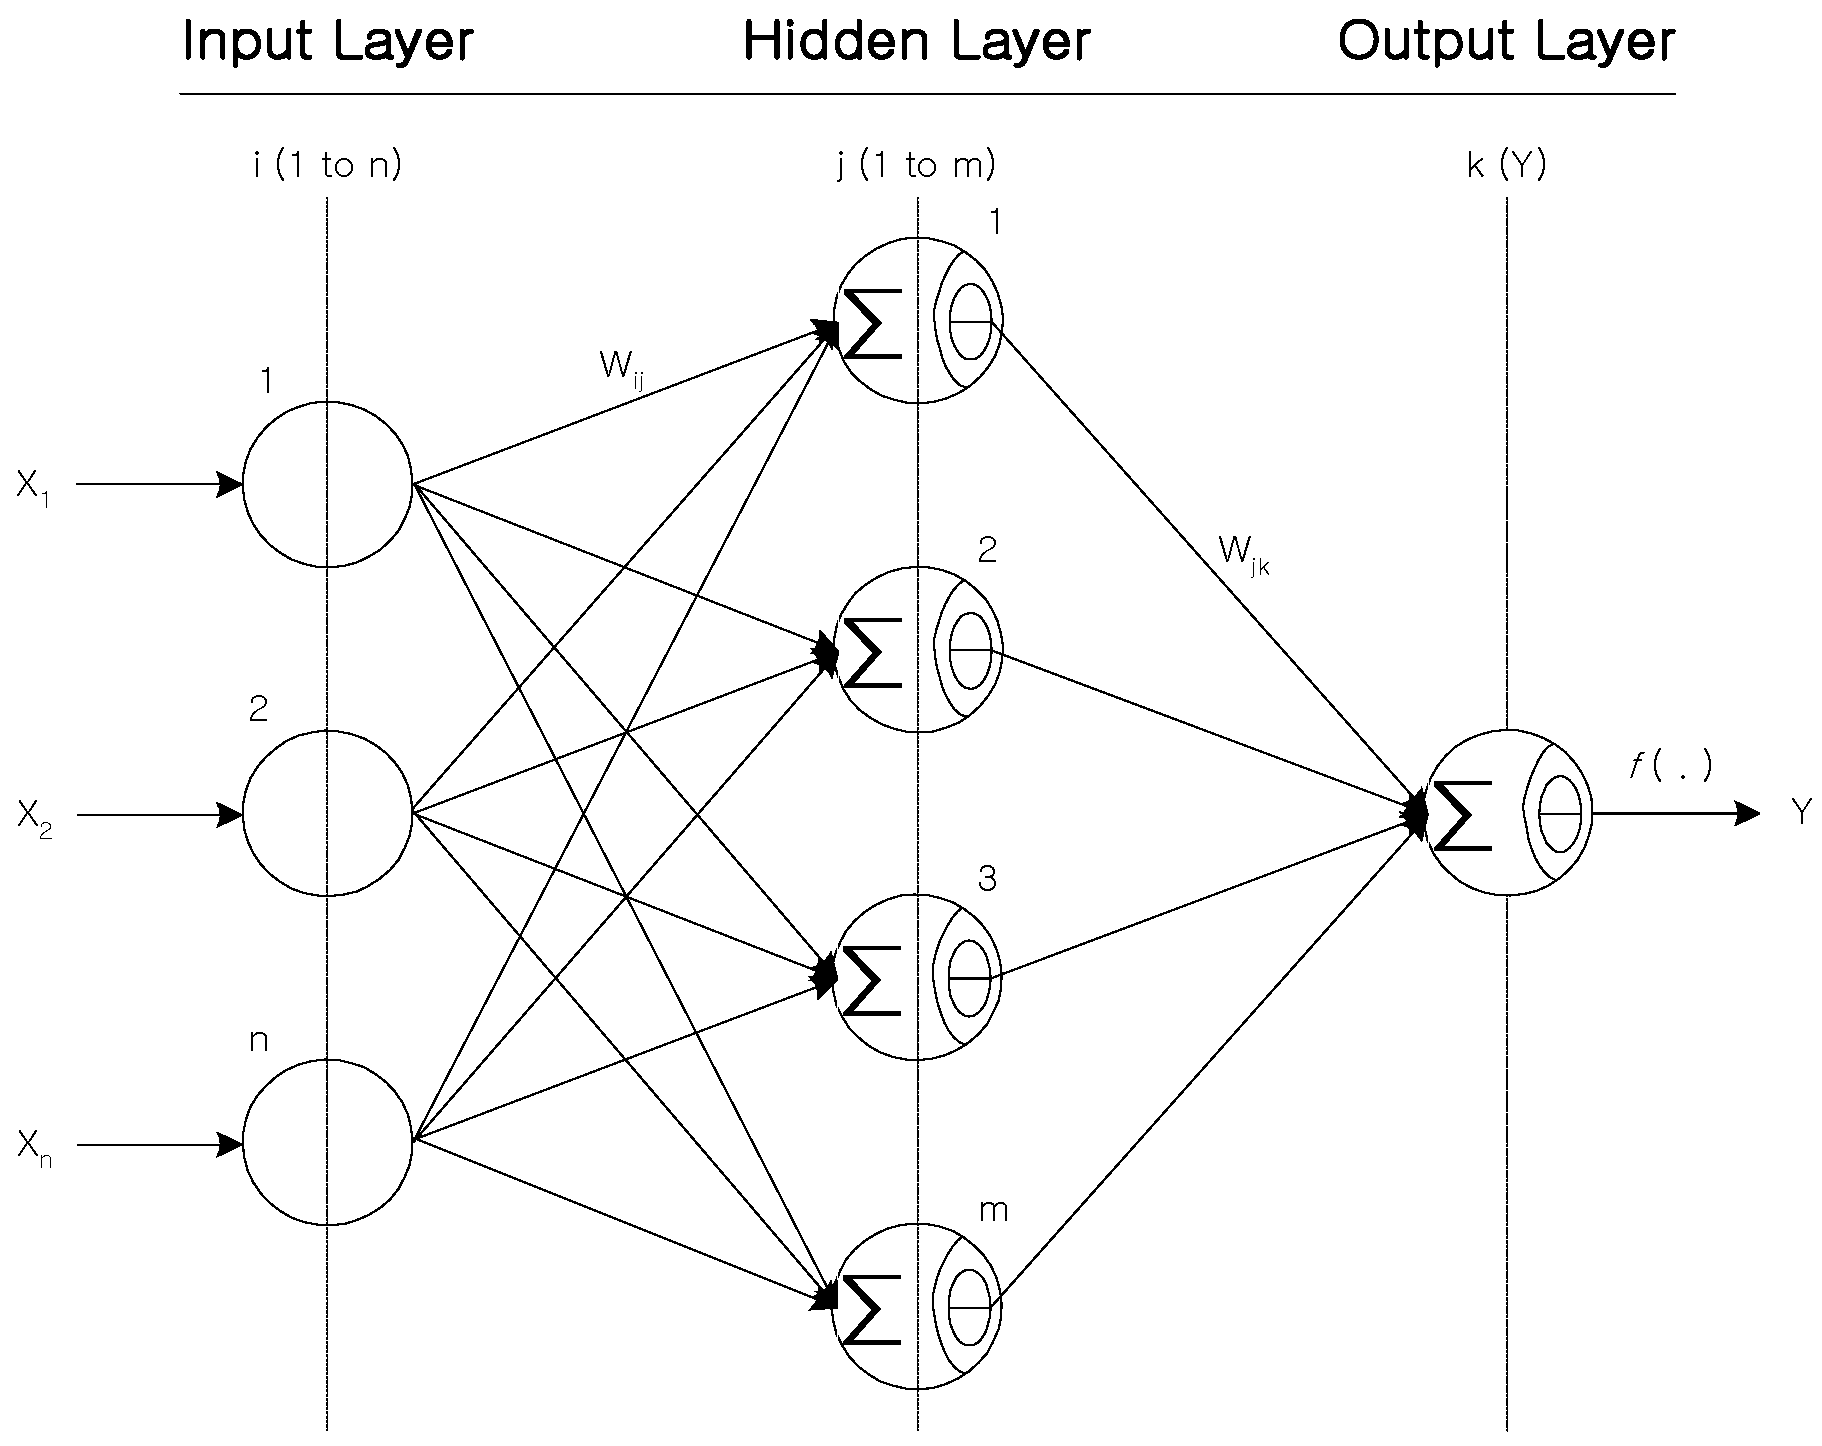
3.3. Artificial Neural Networks
3.4. Ant Colony Optimization
4. Model Development
4.1. Artificial Neural Networks
4.2. Description of Data
4.3. Parameter Set-up
5. Model Application
5.1. Evaluation
5.2. Standardization of Cost Data
6. Results
7. Discussion
8. Conclusions
Acknowledgments
Author Contributions
Conflicts of Interest
References
- Begum, R.A.; Siwar, C.; Pereira, J.J.; Jaafar, A.H. A benefit-cost analysis on the economic feasibility of construction waste minimisation: The case of Malaysia. Resour. Conserv. Recycl. 2006, 48, 86–98. [Google Scholar] [CrossRef]
- Fatta, D.; Papadopoulos, A.; Avramikos, E.; Sgourou, E.; Moustakas, K.; Kourmoussis, F.; Mentzis, A.; Loizidou, M. Generation and management of construction and demolition waste in Greece—An existing challenge. Resour. Conserv. Recycl. 2003, 40, 81–91. [Google Scholar] [CrossRef]
- Poon, C.S.; Yu, A.T.; Jaillon, L. Reducing building waste at construction sites in Hong Kong. Constr. Manag. Econ. 2004, 22, 461–470. [Google Scholar] [CrossRef]
- Ndihokubwayo, R.; Haupt, T. Variation orders on construction projects: Value-adding or waste? Int. J. Constr. Proj. Manag. 2009, 1, 1–17. [Google Scholar]
- Seo, S.; Hwang, Y. An estimation of construction and demolition debris in Seoul, Korea: Waste amount, type, and estimating model. J. Air Waste Manag. Assoc. 1999, 49, 980–985. [Google Scholar] [CrossRef]
- Skoyles, E.R. Materials wastage—A misuse of resources. Batiment Int. Build. Res. Pract. 1976, 4, 232. [Google Scholar] [CrossRef]
- Finnie, G.R.; Wittig, G.E.; Desharnais, J.M. A comparison of software effort estimation techniques: Using function points with neural networks, case-based reasoning and regression models. J. Syst. Softw. 1997, 39, 281–289. [Google Scholar] [CrossRef]
- Perera, S.; Watson, I. Collaborative case-based estimating and design. Adv. Eng. Softw. 1998, 29, 801–808. [Google Scholar] [CrossRef]
- Trost, S.M.; Oberlender, G.D. Predicting accuracy of early cost estimates using factor analysis and multivariate regression. J. Constr. Eng. Manag. 2003, 129, 198–204. [Google Scholar] [CrossRef]
- Kong, F.; Wu, X.; Cai, L. Application of RS-SVM in construction project cost forecasting. In Proceedings of the 4th International Conference on Wireless Communications, Networking and Mobile Computing, Dalian, China, 12–14 October 2008.
- Garza, J.M.D.L.; Rouhana, K.G. Neural networks versus parameter-based applications in cost estimating. Cost Eng. 1995, 37, 14–18. [Google Scholar]
- Bode, J. Neural networks for cost estimation: Simulations and pilot application. Int. J. Prod. Res. 2000, 38, 1231–1254. [Google Scholar] [CrossRef]
- Murtala, A.L. Neural Network-Based Cost Predictive Model for Building Works. Ph.D. Thesis, Covenant University, Ota, Nigeria, 2011. [Google Scholar]
- Kim, S.; Shim, J.H. Combining case-based reasoning with genetic algorithm optimization for preliminary cost estimation in construction industry. Can. J. Civ. Eng. 2014, 41, 65–73. [Google Scholar] [CrossRef]
- Viharos, Z.J.; Mikó, B. Artificial neural network approach for injection mould cost estimation. In Proceedings of the 44th CIRP Conference on Manufacturing Systems, New Worlds of Manufacturing, Madison, WI, USA, 1–3 June 2009.
- Chan, S.M. Maintenance and Limitations Issues of Case-Based Reasoning Technology in a Manufacturing Application. Available online: http://www.aaai.org/Papers/Workshops/1999/WS-99-10/WS99-10-004.pdf (accessed on 29 August 2016).
- An, S.H.; Park, U.Y.; Kang, K.I.; Cho, M.Y.; Cho, H.H. Application of support vector machines in assessing conceptual cost estimates. J. Comput. Civ. Eng. 2007, 21, 259–264. [Google Scholar] [CrossRef]
- Zade, M.J.G.; Noori, R. Prediction of municipal solid waste generation by use of artificial neural network: A case study of mashhad. Int. J. Environ. Res. 2008, 2, 13–22. [Google Scholar]
- Noori, R.; Abdoli, M.A.; Ghazizade, M.J.; Samieifard, R. Comparison of neural network and principal component-regression analysis to predict the solid waste generation in Tehran. Iran. J. Public Health 2009, 38, 74–84. [Google Scholar]
- Kim, G.H.; Shin, J.M.; Kim, S.; Shin, Y. Comparison of school building construction costs estimation methods using regression analysis, neural network, and support vector machine. J. Build. Constr. Plan. Res. 2013, 1, 1–7. [Google Scholar] [CrossRef]
- Hegazy, T.; Fazio, P.; Moselhi, O. Developing practical neural network applications using back-propagation. Comput. Aided Civ. Infrastruct. Eng. 1994, 9, 145–159. [Google Scholar] [CrossRef]
- Zhang, J.R.; Zhang, J.; Lok, T.M.; Lyu, M.R. A hybrid particle swarm optimization–back-propagation algorithm for feedforward neural network training. Appl. Math. Comput. 2007, 185, 1026–1037. [Google Scholar] [CrossRef]
- Li, H.M.; Wang, Z.F. Applying self-adaptive ant colony optimization for construction time-cost optimization. In Proceedings of the International conference on Management Science and Engineering, Moscow, Russia, 14–16 September 2009; pp. 283–289.
- Colorni, A.; Dorigo, M.; Maniezzo, V. Distributed optimization by ant colonies. In Proceedings of the ECAL91—European Conference on Artificial Life, Paris, France, 11–13 December 1991; Varela, F., Bourgine, P., Eds.; Elsevier Publishing: Amsterdam, The Netherlands, 1991; pp. 134–142. [Google Scholar]
- Ashena, R.; Moghadasi, J. Bottom hole pressure estimation using evolved neural networks by real coded ant colony optimization and genetic algorithm. J. Pet. Sci. Eng. 2011, 7, 375–385. [Google Scholar] [CrossRef]
- Liu, J.; Wang, Y. Cost analysis of construction and demolition waste management: Case study of the Pearl river delta of China. Open Constr. Build. Technol. J. 2013, 7, 251–263. [Google Scholar] [CrossRef]
- Wu, Z.; Fan, H.; Liu, G. Forecasting construction and demolition waste using gene expression programming. J. Comput. Civ. Eng. 2013, 29, 04014059. [Google Scholar] [CrossRef]
- Flanagan, R.; Tate, B. Cost Control in Building Design; Wiley-Blckwell Press: Oxford, UK, 1997. [Google Scholar]
- Wrap. Builders: Reducing the Cost of Waste on Site. Available online: http://www.wrap.org.uk/sites/files/wrap/Onsite%20Builders.pdf (accessed on 15 April 2016).
- Clackmannanshire Council. Construction Waste. 2016. Available online: http://www.clacksweb.org.uk/environment/constructionsitewastemanagement/ (accessed on 5 March 2016).
- Gbekor, A. Domestic Waste Management. In Ghana Environmental Protection Agency (EPA) Newsletter; Ghana EPA: Accra, Ghana, 2003; Volume 47, pp. 145–150. [Google Scholar]
- Mohd, F.Y. Study on Construction & Demolition Waste Management in Construction Site. Ph.D. Thesis, Universiti Malaysia Pahang, Pekan, Malaysia, 2006. [Google Scholar]
- Bossink, B.A.G.; Brouwers, H.J.H. Construction waste: Quantification and source evaluation. J. Constr. Eng. Manag. 1996, 122, 55–60. [Google Scholar] [CrossRef]
- Li, J.B.; Chung, Y.K. A novel back-propagation neural network training algorithm designed by an ant colony optimization. In Proceedings of the IEEE/PES Transmission and Distribution Conference and Exhibition: Asia and Pacific, Dalian, China, 18 August 2005; pp. 1–5.
- Wang, L.; Wang, D.; Ding, N. Research on BP neural network optimal method based on improved ant colony algorithm. In Proceedings of the Second International Conference on Computer Engineering and Applications (ICCEA), Bali Island, Indonesia, 19–21 March 2010; Volume 1, pp. 117–121.
- Wang, H.; Guo, W. ACO optimizing neural network for macroscopic water distribution system modeling. In Proceedings of the International Conference on Intelligent Computing and Cognitive Informatics (ICICCI), Kuala Lumpur, Malaysia, 22–23 June 2010; pp. 367–370.
- Hatampour, A.; Razmi, R.; Sedaghat, M.H. Improving performance of a neural network model by artificial ant colony optimization for predicting permeability of petroleum reservoir rocks. Middle-East J. Sci. Res. 2013, 13, 1217–1223. [Google Scholar]
- Solís-Guzmán, J.; Marrero, M.; Montes-Delgado, M.V.; Ramirez-de-Arellano, A. A Spanish model for quantification and management of construction waste. Waste Manag. 2009, 29, 2542–2548. [Google Scholar] [CrossRef] [PubMed]
- Rumelhart, D.E.; McClelland, J.L. Learning the past tenses of English verbs: Implicit rules or parallel distributed processing. In Mechanisms of Language Acquisition; MacWhinney, B., Ed.; MIT Press: Cambridge, MA, USA, 1987; pp. 195–248. [Google Scholar]
- Mao, S.; Wan, W.; Wang, R.; Gao, Y. The application of ant colony algorithm and artificial neural network in tax assessment. In Proceedings of the International Conference on Audio Language and Image Processing (ICALIP), Shanghai, China, 23–25 November 2010; pp. 1433–1436.
- Skitmore, M. Construction Prices: The Market Effect; University of Salford Environmental Resources Unit: Salford, UK, 1987. [Google Scholar]
- Adeli, H.; Wu, M. Regularization neural network for construction cost estimation. J. Constr. Eng. Manag. 1998, 124, 18–24. [Google Scholar] [CrossRef]
- Sivagaminathan, R.K.; Ramakrishnan, S. A hybrid approach for feature subset selection using neural networks and ant colony optimization. Expert Syst. Appl. 2007, 33, 49–60. [Google Scholar] [CrossRef]
- Coulibaly, P.; Baldwin, C.K. Nonstationary hydrological time series forecasting using nonlinear dynamic methods. J. Hydrol. 2005, 307, 164–174. [Google Scholar] [CrossRef]


| Description | Min. | Max. | Average | Remark | |
|---|---|---|---|---|---|
| Input | Location | Seoul, Gyeonggi, Incheon, Daegu, Busan, Gwangju | Categorical | ||
| Stories | 2 | 17 | 5 | Numerical | |
| No. of buildings | 1 | 56 | 7.1 | ||
| Completion year | 1959 | 1986 | 1976 | ||
| Demolition year | 1998 | 2010 | 2006 | ||
| No. of houses | 20 | 2260 | 254 | ||
| Gross floor area | 730 | 104,434.6 | 14,212 | ||
| Lot area (m2) | 1015 | 934,597 | 23,638 | ||
| Output | Total quantity of construction waste | ||||
| No. | Historical Quantity (m3) | Simple ANNs | ANNs + ACO | ||||
|---|---|---|---|---|---|---|---|
| Expect Quantity | Error Rate (%) | Accuracy (%) | Expect Quantity | Error Rate (%) | Accuracy (%) | ||
| 1 | 9975 | 13,535 | 26.3 | 73.7 | 11,572 | 13.8 | 86.2 |
| 2 | 24,775 | 27,035 | 8.36 | 91.64 | 23,114 | 6.7 | 93.3 |
| 3 | 6300 | 7374 | 14.56 | 85.44 | 6304 | 0.06 | 99.94 |
| 4 | 8190 | 14,459 | 43.36 | 56.64 | 11,712 | 30.07 | 69.93 |
| 5 | 57,461 | 41,828 | 27.2 | 72.79 | 43,880 | 23.64 | 76.36 |
| 6 | 18,276 | 19,071 | 4.17 | 95.83 | 17,447 | 4.53 | 95.46 |
| 7 | 4725 | 6657 | 29.02 | 70.98 | 5392 | 12.37 | 87.63 |
| 8 | 12,650 | 11,278 | 10.85 | 89.15 | 9135 | 27.78 | 72.21 |
| 9 | 6310 | 4583 | 27.37 | 72.63 | 5331 | 15.52 | 84.48 |
| 10 | 55,666 | 59,786 | 6.89 | 93.11 | 56,498 | 1.47 | 98.53 |
| 11 | 145,432 | 125,760 | 13.52 | 86.47 | 128,843 | 11.41 | 88.59 |
| 12 | 89,373 | 86,029 | 3.74 | 96.26 | 92,137 | 2.99 | 97 |
| 13 | 63,517 | 55,578 | 12.49 | 87.5 | 59,524 | 6.29 | 93.71 |
| 14 | 10,334 | 12,877 | 19.75 | 80.25 | 13,791 | 25.06 | 74.93 |
| 15 | 30,415 | 38,620 | 21.25 | 78.75 | 41,362 | 26.47 | 73.53 |
| MAERs | 17.92 | 13.88 | |||||
| Accuracy | 82.08 | 86.12 | |||||
| Mean | Std. Deviation | Std. Error | Accuracy | Efficiency Coefficient | |
|---|---|---|---|---|---|
| Simple ANNs | 17.9231 | 10.7816 | 2.8815 | 82.0768 | 0.988757 |
| ANNs + ACO | 13.8788 | 10.0168 | 2.6771 | 86.1212 | 0.988914 |
| No. | Historical Cost (1000 KRW) | Simple ANNs | ANNs + ACO | ||||
|---|---|---|---|---|---|---|---|
| Quantity (Ton) | Unit Cost | Expect Cost | Quantity (Ton) | Unit Cost | Expect Cost | ||
| 1 | 262,270 | 22,332.75 | 15,935 | 355,872 | 19,093.8 | 15,935 | 304,260 |
| 2 | 651,403 | 44,607.75 | 15,935 | 710,824 | 38,138.1 | 15,935 | 607,731 |
| 3 | 165,644 | 12,167.1 | 15,935 | 193,883 | 10,401.6 | 15,935 | 165,749 |
| 4 | 215,338 | 23,857.35 | 15,935 | 380,167 | 19,324.8 | 15,935 | 307,941 |
| 5 | 1,510,808 | 69,016.2 | 15,935 | 1,099,773 | 72,402 | 15,935 | 1,153,726 |
| 6 | 480,526 | 31,467.15 | 15,935 | 501,429 | 28,787.55 | 15,935 | 458,730 |
| 7 | 124,233 | 10,984.05 | 15,935 | 175,031 | 8896.8 | 15,935 | 141,771 |
| 8 | 332,603 | 18,608.7 | 15,935 | 296,530 | 15,072.75 | 15,935 | 240,184 |
| 9 | 165,907 | 7561.95 | 15,935 | 120,500 | 8796.15 | 15,935 | 140,167 |
| 10 | 1,463,612 | 98,646.9 | 15,935 | 1,571,938 | 9,3221.7 | 15,935 | 1,485,488 |
| 11 | 3,823,807 | 207,504 | 15,935 | 3,306,576 | 212,590.95 | 15,935 | 3,387,637 |
| 12 | 2,349,862 | 141,947.85 | 15,935 | 2,261,939 | 152,026.05 | 15,935 | 2,422,535 |
| 13 | 1,670,037 | 91,703.7 | 15,935 | 1,461,298 | 98,214.6 | 15,935 | 1,565,050 |
| 14 | 271,709 | 21,247.05 | 15,935 | 338,572 | 22,755.15 | 15,935 | 362,603 |
| 15 | 799,694 | 63,723 | 15,935 | 1,015,426 | 68,247.3 | 15,935 | 1,087,521 |
| Year | Unit | Cost (KRW) |
|---|---|---|
| 1998 | Per ton | 13,854 |
| 1999 | 14,524 | |
| 2000–2001 | 15,066 | |
| 2002–2003 | 15,767 | |
| 2004–2007 | 15,896 | |
| 2008–2009 | 17,921 | |
| 2010 | 16,239 | |
| Average | 15,935 |
© 2016 by the authors; licensee MDPI, Basel, Switzerland. This article is an open access article distributed under the terms and conditions of the Creative Commons Attribution (CC-BY) license (http://creativecommons.org/licenses/by/4.0/).
Share and Cite
Lee, D.; Kim, S.; Kim, S. Development of Hybrid Model for Estimating Construction Waste for Multifamily Residential Buildings Using Artificial Neural Networks and Ant Colony Optimization. Sustainability 2016, 8, 870. https://doi.org/10.3390/su8090870
Lee D, Kim S, Kim S. Development of Hybrid Model for Estimating Construction Waste for Multifamily Residential Buildings Using Artificial Neural Networks and Ant Colony Optimization. Sustainability. 2016; 8(9):870. https://doi.org/10.3390/su8090870
Chicago/Turabian StyleLee, Dongoun, Seungho Kim, and Sangyong Kim. 2016. "Development of Hybrid Model for Estimating Construction Waste for Multifamily Residential Buildings Using Artificial Neural Networks and Ant Colony Optimization" Sustainability 8, no. 9: 870. https://doi.org/10.3390/su8090870
APA StyleLee, D., Kim, S., & Kim, S. (2016). Development of Hybrid Model for Estimating Construction Waste for Multifamily Residential Buildings Using Artificial Neural Networks and Ant Colony Optimization. Sustainability, 8(9), 870. https://doi.org/10.3390/su8090870