Article

Comprehensive Benefit Evaluation of the Power Distribution Network Planning Project Based on Improved IAHP and Multi-Level Extension Assessment Method

Department of Economics and Management, North China Electric Power University, Baoding 071003, China
*
Author to whom correspondence should be addressed.
Sustainability 2016, 8(8), 796; https://doi.org/10.3390/su8080796
Submission received: 25 May 2016 / Revised: 21 July 2016 / Accepted: 8 August 2016 / Published: 13 August 2016

Abstract

:
Reasonable distribution network planning is an essential prerequisite of the economics and security of the future power grid. The comprehensive benefit evaluation of a distribution network planning project can make significant contributions towards guiding decisions during the planning scheme, the optimization of the distribution network structure, and the rational use of resources. In this paper, in light of the characteristics of the power distribution network, the comprehensive benefit evaluation index system is constructed considering the influencing factors of technical benefit, economic benefit, and social benefit. To eliminate the influence of subjective factors on the evaluation effects and the uncertainty of the influencing factors effectively, the improved interval analytic hierarchy process is employed to calculate the index weights more simply. Moreover, based on the traditional single-factor extension evaluation, this study proposes a multi-level extension assessment model to evaluate the comprehensive benefit of the power distribution network planning project. The model can not only identify the key factors that affect the evaluation effect of the power distribution network planning project, but also can predict the overall development trend of the project. Finally, using a specific urban distribution network planning project as an example, the findings indicate that the comprehensive benefit grade of this power distribution network planning project is “better” due to the benefit grade variable eigenvalue j * [ 3.33 , 3.418 ] [ 3 , 4 ] , and illustrates that the model is credible and practical to achieve the comprehensive benefit evaluation of the power distribution network planning project.

1. Introduction

With the rapid expansion of cities in China, the formation of overall planning schemes seems an inevitable trend of urban development. As an indispensable part of urban planning, the status of urban distribution network planning has been significantly enhanced. In the past few years, the transformation and planning of urban distribution network projects have been carried out. However, there are still some urgent problems to be solved in the planning of the power distribution network. For instance, how can we reasonably evaluate the planning results of an urban distribution network? How can we analyze the comprehensive benefit of urban distribution network planning quantitatively? The traditional assessment of an urban distribution network planning project has been mainly the individual evaluations, including reliability [1,2,3,4,5,6], safety [7], power quality [8], risk [9], and efficiency [10]. These studies tend to evaluate the technical level of the power distribution network from different aspects with little attention to the comprehensive benefit assessment of the distribution network planning project. Very little literature refers to the benefit evaluation. For instance, Cheumchit [11] evaluated the benefit of comprehensive planning of the high and medium voltage distribution network. Borchard [12] assessed the benefit of voltage comprehensive planning considering the network costs and power quality. The direct guidance of the construction of distribution networks seems very poor.
Recently, research on the comprehensive evaluation of power distribution network planning projects have been given extensive attention, but the comprehensive benefit assessment seems relatively inadequate. Fan [13] used the fuzzy comprehensive evaluation method to evaluate risk, but the method may be greatly influenced by human subjective factors. Ma [14] and Wang [15] respectively established the evaluation index system considering the preparation work, the whole process, and the operational ability of power grid construction projects, but the complete theory to assess the distribution network planning project was not formed. Yang [16] studied the power network renovation project based on the fuzzy Analytic Hierarchy Process (AHP), and applied the interval number to weaken the human subjective factors on the evaluation results. However, before the fuzzy comprehensive evaluation, the membership degree of each index needs to be determined by the associated experts with great subjectivity. Zhang [17] employed the gray fuzzy theory to evaluate the power network project, but the irrationality of the ideal index system can inversely affect the evaluation results. Therefore, from the previous literature, it can be concluded that there still exists some problems about the comprehensive evaluation of power distribution network planning projects, comprising the incomplete evaluation index system, the irrationality of the determination of weights without considering the uncertainty, fuzziness of experts’ judgment, and the imperfection of the evaluation method.
Regarding the aforementioned issues, this paper implements a comprehensive optimization and adjustment to the evaluation index system based on identifying the type of the object to be evaluated, thus the index system can comprehensively reflect the benefit of the power distribution network planning project. Wang [18] proposed a novel power quality evaluation method based on the interval number theory to achieve the assessment of power quality more precisely. Zeng [19] introduced the interval number theory to solve uncertainty problems, and built an interval-number model for life-cycle energy savings and emission-reduction benefits of wind power projects. The persistent model can deal with the disturbance from uncertainty factors and provide a reliable decision-making basis for the wind power project. In addition, Huang [20] employed the Interval Analytic Hierarchy Process (IAHP) to evaluate the levels of construction safety management. Wei [21] applied the IAHP to perform decision-making regarding power system projects. Therefore, in this paper the interval number theory is introduced to improve the traditional AHP for obtaining the reasonable weights of evaluation indices. Concerning the imperfection of the evaluation method, the extension theory was originally put forward by Cai [22] in 1983. Based on formal logic tools, the rules and methods required to solve the contradiction problem can be analyzed qualitatively and quantitatively. Integrated with objects, with values based on certain characteristics, the extension assessment method can quantify the qualitative indices and obtain the precise quantitative evaluation results by using the correlation function. Consequently, this method has been widely used in a wealth of research regarding evaluations, such as risk evaluation of power projects [23,24], external economic evaluation of wind power engineering projects [25], stability evaluation for high rock slope [26], groundwater quality assessment [27], and comprehensive evaluation of coordination development for regional power grids and renewable energy power supplies [28]. The extension assessment method does not need to judge the membership degree of each index according to the expert’s experience, and can reduce the influence of subjective factors on the evaluation results effectively, thus obtaining scientific and reasonable evaluation results. Therefore, based on qualitative and quantitative analysis, in this study the multi-level extension assessment method is utilized to evaluate the comprehensive benefit of the urban distribution network planning project. In addition, the correlation function and the correlation degree for extension sets are all utilized. Therefore, the problems of uncertainty, fuzziness, and subjectivity in terms of determining the weight, which previously affected the evaluation of the benefit of the power distribution network planning project, are all resolved. The main contributions of this paper are as follows:
(1)
From previous literature, it can be found that the current studies mainly focus on the individual technical or economic level evaluations of the power distribution network planning project, such as reliability, security, power quality, and investment benefit. Therefore, this paper attempts to perform the comprehensive benefit evaluation on the power distribution network planning project considering technical benefit, economic benefit, and social benefit;
(2)
To address the issues of uncertainty, fuzziness, and subjectivity in terms of determining the weight, which strongly affect the evaluation results of the comprehensive benefit of the power distribution network planning project, this paper constructs an improved IAHP method by introducing the interval number to replace the element of judgment matrix and uses a novel approach of consistency testing based on a linear programming model to solve the problem of incomplete consistency of the interval number judgment matrix;
(3)
In order to solve the multi-factor evaluation problem, this study establishes the multi-level extension evaluation method to expand the single-factor extension evaluation model by introducing the index weight, and obtaining the results of the multi-level extension evaluation of the object to be evaluated according to the maximum membership degree law.
The remainder of this paper is structured as follows: Section 2 describes the comprehensive benefit evaluation index system of the power distribution network planning project; Section 3 introduces the principles of the improved IAHP, multi-level extension assessment method, and the evaluation process of the proposed approach; The evaluation method reported in this research is examined by a case study in Section 4; Conclusions about the proposed model are given in Section 5.

2. Comprehensive Benefit Evaluation Index System of the Power Distribution Network Planning Project

2.1. Comprehensive Benefit Evaluation Index System

The establishment of the comprehensive benefit evaluation index system of the urban distribution network planning project plays a pivotal role in conducting a comprehensive benefit evaluation of the project. A reasonable index system has positive implications on the assessment results of the power distribution network planning project. According to the features of the power distribution network and the suggestions of power experts, the comprehensive benefit evaluation index system of the power distribution network planning project can be framed by using the basic principles of AHP. Comprehensive benefits of the power distribution network planning project can be analyzed from the three aspects of technical benefit, economic benefit, and social benefit quantitatively. In order to make the evaluation index system a better fit for real conditions, the selected evaluation indicators include both quantitative indicators and some qualitative indicators that are difficult to quantify. The comprehensive benefit evaluation index system of the power distribution network planning project is listed in Table 1.

2.2. Analysis of the Benefit Evaluation Index

2.2.1. Technical Benefit

Technical Benefit is defined as the technological improvement after completing the distribution network construction based on the planning. In this study, the technical benefit of the distribution network can be analyzed from the perspectives of reliability, safety, and flexibility.
(1)
Reliability
Reliability includes the average interruption hours of customers, reliability rate of power supply, and the cable adoption rate. Average interruption hours of customers and the reliability rate of power supply can reflect the failure rate of the equipment. Cable adoption rate can represent the level of equipment which affects the reliability of the power supply. The definitions of these indices are described as follows:
T = ( t × h m ) h
where T is the average interruption hours of customers; t is the duration time of each interruption; h m represents the customers of each interruption; h represents the total interruption of customers.
R S I = ( 1 t T ) × 100 %
where R S I is the reliability rate of the power supply; t is the average interruption hours of customers; T is the time period of the statistic.
d = l L × 100 %
where d denotes the cable adoption rate; l is the length of cable; L is the line length of corresponding voltage class.
(2)
Safety
Safety contains the voltage qualification rate, “N−1” pass rate, and the power supply radius. The voltage qualification rate can be defined as the ratio of the time of normal voltage to the total time of the voltage monitoring during the measurement period. “N−1” pass rate refers to the phenomenon that any other line does not exceed its normal or emergency limits when the network loses any of its lines. The power supply radius of the following lines refers to the line length between the low-voltage side of the substation (distribution transformer) and the farthest load point of the line to its power supply.
(3)
Flexibility
Flexibility includes the capacity-load ratio and the connection rate of stations. The capacity-load ratio is utilized to measure the coordination of the load and the capacity of the power grid. It can determine whether the capacity can meet the load demand and cannot result in excessive investment. The connection rate of stations is an index which reflects the structure of the distribution network. The outgoing line of the substation has clear advantages in enhancing the structure of the distribution network, load transfer, and in improving the reliability and the economy of the distribution network. The equations of the two indices can be given as follows:
R s = S P max
where R s is the capacity-load ratio; S is the total capacity of transformer; P max is the peak load.
f = i , j = 1 , i j n N i j i = 1 n N i i , j = 1 , i j n N i j
where f is the connection rate of stations; N i is the number of outgoing lines of the i th substation; N i j is the number of lines in connection with the j th substation in the outgoing line of the i th substation.

2.2.2. Economic Benefit

Regarding the market economy, economic rationality needs to be paid attention in addition to the technical feasibility of the distribution network. Considering the time value of the capital, the planning scheme should have high economic benefits. Therefore, the economic benefit of the distribution network is evaluated from the aspects of the technical economic benefit and the financial benefit of the enterprise.
(1)
Technical Economic Benefit
Technical economic benefit comprises the integrated network loss rate and the equipment utilization ratio. The integrated network loss rate can be defined as the increment of system loss caused by the increment of electric energy consumption per unit in a specific time and operation mode. Integrated network loss rate, which directly impacts the economic benefit of the distribution network, is an important indicator of the planning design and the operation of the distribution network. There are many methods used in the distribution network loss calculation such as the power flow calculation method, the equivalent resistance method, and the maximum current method. Mining the value of the existing equipment and increasing the utilization ratio of the equipment has strong influences on improving the economic benefit and social benefit of the distribution network. The equipment utilization ratio is the ratio of actual operating indicators of the elements to the rated operating indicators of the elements. The formulas of these indices are given as:
{ P L = i = 1 n j = 1 n V i V j G i j cos θ i j Q L = i = 1 n j = 1 n V i V j B i j cos θ i j
where P L is the loss of active power; Q L is the loss of reactive power; θ i j is phase angle difference between the θ i of the node voltage V i and the θ j of the node voltage V j ; G i j and B i j are respectively the corresponding elements of the admittance matrix.
η = P L cos φ × S N × 100 %
where η is the equipment utilization ratio; P L is the actual maximum load of the equipment (MW); cos φ is the power factor; S N is the rated capacity (MVA).
(2)
Financial Benefit of the Enterprise
Net present value and the payback period of investment constitute the financial benefit of the enterprise. Net Present Value (NPV), which is most frequently used in the equipment Life Cycle Cost (LCC) method, can reflect the return of the capital effectively. If NPV is negative, then the project is not desirable. Conversely, if the NPV is positive, then the investment income may be higher as the NPV becomes larger. The payback period of investment represents the time required to offset the total investment of the project after completion of the project, which is the indicator of the turnover rate of the capital. The two indices can be defined by:
N P V = t = 0 n [ B ( t ) C s ( t ) ] ( P / F , r , t )
where B ( t ) is the added value of the t th year; C s ( t ) is the cost for equipment maintenance in the t th year; P is the present value; F is the final value; r is the discount rate.
t = 1 P t ( C I n , t C O u t , t ) ( 1 + i ) t = 0
where P t is the payback period of investment; C I n , t and C O u t , t are the cash inflow and cash outflow of the t th year; i is the interest rate.

2.2.3. Social Benefit

The continuous development of power supply enterprises and the improvement of service quality can make positive contributions to promoting the development of society and the improvement of people’s living standards. The enhancement of the reliability and the quality of the power supply can be conductive to the increment of economic benefit. The planning and transformation of the distribution network effectively contributes to the conservation of energy, resources, and the environment. Given the social economy, social environment, and natural environment, this paper analyzes the social benefit of the distribution network.
(1)
Social Economic Benefit
The social economic benefit mainly involves the contribution to the effective growth of the national economy and the optimization of the industrial structure. Gross Domestic Product (GDP), which has a close relationship with electricity sales, is an important index to measure the overall level of economic development. Thus, in this paper the direct contribution rate of the GDP is applied to identify the influence of distribution network planning on the national economy. The annual revenue of electricity sales can be estimated by using the annual load forecasting of the specific power distribution network planning project and the corresponding electricity price. The GDP can be estimated using the method proposed by Abeysinghe [29]. The formula is:
S = C G × 100 %
where S is the direct contribution rate of the GDP; C is the annual revenue of electricity sales; G is the GDP of the corresponding year.
(2)
Social Environment Benefit
The implementation of power distribution network planning projects, which may promote the development of the power industry and related industries, can bring a significant direct employment benefits and indirect employment benefit. The direct employment benefit is the direct employment opportunities that the project itself can provide. The indirect employment benefit refers to the indirect employment opportunities provided by the supporting or related projects of the distribution network planning project, as well as the additional investment produced by the construction of the project. In this research, the employment rate is used to measure the social environment benefit. The employment rate can be described as follows:
r = e t E t × 100 %
where r is the employment rate; e t is the new employment brought by the distribution network planning projects directly and indirectly in the t th year according to the specific project; E t is the total number of new employment in the t th year estimated by historical employment data.
(3)
Natural Environment Benefit
The environment quality is a qualitative concept of environmental assessment stemming from the specific needs of humans, which can reflect the human expectations of all elements of the environment. The optimal planning of the power distribution network is conducive to reducing the network loss and saving land area, and achieving the goals of energy-saving and emission reduction, thus obtaining potential natural environment benefit.

3. Comprehensive Benefit Evaluation of Power Distribution Network Planning Based on Improved IAHP and Multi-Level Extension Assessment Method

3.1. Improved IAHP Method

Different indexes have different natures, meanings, and influences on the evaluation system. Index weights reflect their importance in the index system, but the determination of index weight tends to be affected by subjective factors greatly. Therefore, the choice of an appropriate method to determine the index weight is directly related to the rationality of the comprehensive evaluation result.
At present, the methods to determine the index weight mainly include the subjective weighting method and the objective weighting method. Among them, the subjective method can be largely affected by subjective factors. The objective method cannot fully reflect the actual power grid investment and construction projects. Therefore, the improved method or the combination of the subjective and objective weighting methods is usually employed to determine the index weight, in order to reduce the influence of subjective factors on the evaluation results. AHP [30], which was conceived as a practical multi-criteria decision making method, can be applied to analyze the problem which is difficult to describe quantitatively. However, there are some limitations in the application of AHP. For instance, the data obtained by using AHP is “point” data, but the real system seems more flexible. Thus, large errors may be produced using this approach. In addition, the “point” data tends to be inappropriate since incomplete information can lead to uncertain judgments of the experts when making decisions.
Concerning the aforementioned limitations, this paper adopts the IAHP, which was proposed by Wu [31], to determine the relative importance of the benefit index of urban distribution network planning. Using interval number theory, IAHP can be utilized to solve the uncertainty and fuzzy problems under the condition of incomplete information [31]. For instance, Zhang evaluated the relative mining intensity in western China based on IAHP, and obtained high results [32]. Moreover, considering the incomplete consistency of the judgment matrix obtained by the pertinent experts, in this paper the consistency test method based on the linear programming model is applied to improve the IAHP method to provide more complete information for decision makers [33].

3.1.1. Establishment of the Hierarchy Structure of the Benefit Evaluation Index System

In light of the basic principles of AHP, the hierarchy structure is shown in Table 1 through analysis of the influencing factors of the comprehensive benefit of distribution network planning.

3.1.2. Establishment of the Hierarchy Structure of the Benefit Evaluation Index System

On the basis of the reciprocity rule of a 1−9 scale, the relative importance of each evaluation index can be compared and we can obtain the interval number judgment matrix as follows [34]:
A = [ [ 1 , 1 ] [ a 12 , a 12 + ] [ a 1 n , a 1 n + ] [ a 21 , a 21 + ] [ 1 , 1 ] [ a 2 n , a 2 n + ] [ a n 1 , a n 1 + ] [ a n 2 , a n 2 + ] [ a n n , a n n + ] ]
where a i j + and a i j are the upper limit and lower limit of the relative importance of i and j .
Then, according to the operation rules of interval number theory [35], we obtain A = [ A , A + ]
A + = [ 1 a 12 + a 1 n + a 21 + 1 a 2 n + a n 1 + a n 2 + a n n + ] , A = [ 1 a 12 a 1 n a 21 1 a 2 n a n 1 a n 2 a n n ]
where A + is the upper matrix; A is the lower matrix.
The largest eigenvalue and its corresponding normalized eigenvectors with positive components can be calculated by using the interval eigenvalue method [36]. The equations are as follows:
k = j = 1 n 1 i = 1 n a i j + m = j = 1 n 1 i = 1 n a i j
λ max = i = 1 n ( A w ) i / n w i λ max + = i = 1 n ( A + w + ) i / n w i +
where λ max and λ max + are the largest eigenvalues, and k and m are the coefficients of λ max and λ max + .

3.1.3. Consistency Test of the Interval Number Judgment Matrix

(1)
Complete Consistency
Based on the definition of complete consistency, if i , j , m = 1 , 2 , , n , a i m = a i j a j m supports it, then the judgment matrix satisfies the condition of complete consistency, and its eigenvectors corresponding to the maximum eigenvalue can be regarded as the weight of each index. At this point, the standard of the consistency check of the judgment matrix of the traditional AHP is the same as that of the interval number judgment matrix.
(2)
Incomplete Consistency
If the judgment matrix does not satisfy the complete consistency condition, the matrix can be considered as an incomplete consistent judgment matrix. The standard of the consistency check of the interval number judgment matrix is different from that of the traditional IAHP. In order to eliminate the complex computing process of weight, this study improves upon the traditional IAHP [33]. The standard of incomplete consistency check of the improved IAHP is shown in the following equation:
z * = i = 1 n ( w i + w i _ ) < R
where z * represents the consistency of the interval number judgment matrix, the smaller z * , the better the consistency; n is the order of the judgment matrix A ; R is the relative coefficient of z * and conformance rate ( n = 3 , R = 0.9376 ; n = 4 , R = 0.8266 ); w + and w are the normalized eigenvectors that correspond to the maximum eigenvalues λ max + and λ max . If the judgment matrix passes the test, the degree of inconsistency is in the permissible range and eigenvectors corresponding to the maximum eigenvalue can be regarded as the weight of each evaluation index.

3.2. Multi-Level Extension Assessment Method

Extension evaluation is one of the important applications of extension theory which was proposed by Cai [22]. Extension evaluation can conduct the qualitative and quantitative analyses by using the correlation function, and determine the rank of the object to be evaluated. However, the traditional extension evaluation is only limited to the evaluation of a single factor. Therefore, when the evaluation object contains a number of indicators and categories, it is necessary to expand the theory of single-factor extension evaluation to solve the problems of multi-factor evaluation. Based on the single-factor extension evaluation, the multi-level extension evaluation method introduces the index weight and can obtain the result of the multi-level extension evaluation of the object to be evaluated according to the maximum membership degree law. The following steps constitute the multi-level extension evaluation method:
Step 1:
Determine Classical Field
All indices can be divided into j ( j = 1 , 2 , 3 , , n ) levels and described as the following matter-element model. The classical field is represented by [25]:
R j = ( N j , C k , V j k ) = [ N j C 1 V j 1 C 2 V j 2 C m V j m ] = [ N j C 1 < a j 1 , b j 1 > C 2 < a j 2 , b j 2 > C m < a j m , b j m > ]
where R j is the j th grade of the matter-element model; N j is the j th grade of the object in classical field; V j k = < a j k , b j k > ( j = 1 , 2 , , n ; k = 1 , 2 , , m ) is the corresponding value range of N j related to C k .
Step 2:
Determine Controlled Field
The controlled field is shown as follows [25]:
R p = ( P , C k , V p k ) = [ P C 1 V p 1 C 2 V p 2 C m V p m ] = [ P C 1 < a p 1 , b p 1 > C 2 < a p 2 , b p 2 > C m < a p m , b p m > ]
where P is the object with the grade; V p k = < a p k , b p k > ( j = 1 , 2 , , n ; k = 1 , 2 , , m ) is the corresponding value range of P pertinent to C k .
Step 3:
Determine the Matter-Element to Be Evaluated
The matter-element to be evaluated can be described as [25]:
R = ( N , C k , V k ) = [ N C 1 V 1 C 2 V 2 C m V m ]
where R is the matter-element to be evaluated; V k is the value range of N related to C k .
Step 4:
Establish the Correlation Function and Compute the Correlation Degree
Establishing the correlation function can make the correlation degree between the object to be evaluated and the classical field of the matter-element model more accurate without relying on subjective judgment or statistics. The correlation degree can be calculated as follows [25]:
K j ( V k ) = { ρ ( V k , V j k ) ρ ( V k , V p k ) ρ ( V k , V j k ) V k V j k ρ ( V k , V j k ) | V j k | V k V j k ( k = 1 , 2 , , m ; j = 1 , 2 , , n )
where K j ( V k ) is the correlation degree of the k th index pertinent to the j th level; | V j k | is the distance of the classical field of the k th index pertinent to the j th level; ρ ( V k , V j k ) is the distance of the matter-element to be evaluated related to the k th index and the j th level with the corresponding classical field; ρ ( V k , V p k ) is the distance of the matter-element to be evaluated relative to the kth index and the controlled field, and
{ ρ ( V k , V j k ) = | V k a j k + b j k 2 | b j k a j k 2 ρ ( V k , V p k ) = | V k a p k + b p k 2 | b p k a p k 2
Step 5:
Multi-Level Extension Assessment
Using the weight obtained by the improved IAHP method and the correlation degree of the inferior index, the correlation function value of the superior index and the overall object related to jth level can be calculated by formula (22) [25].
K j ( N ) = i = 1 m W i K j ( V i )
where W i is the weight of C i ; j = 1 , 2 , , n ; i = 1 , 2 , , m .
According to the maximum membership degree law, the evaluation results of the different indicators, and the object to be assessed can be gained by:
K j ( N ) = max 1 j n K j ( N )
In addition, in order to reflect the level of the object to be evaluated more accurately, the membership grade of the object to be evaluated can be obtained by calculating the eigenvalue of the grade variable, and then the overall development trend of the object to be evaluated can be determined [25].
K ¯ j ( N ) = K j ( N ) max 1 j n K j ( N ) max 1 j n K j ( N ) min 1 j n K j ( N )
j * = j = 1 n j K ¯ j ( N ) j = 1 n K ¯ j ( N )
where j * is the grade variable eigenvalue of N .

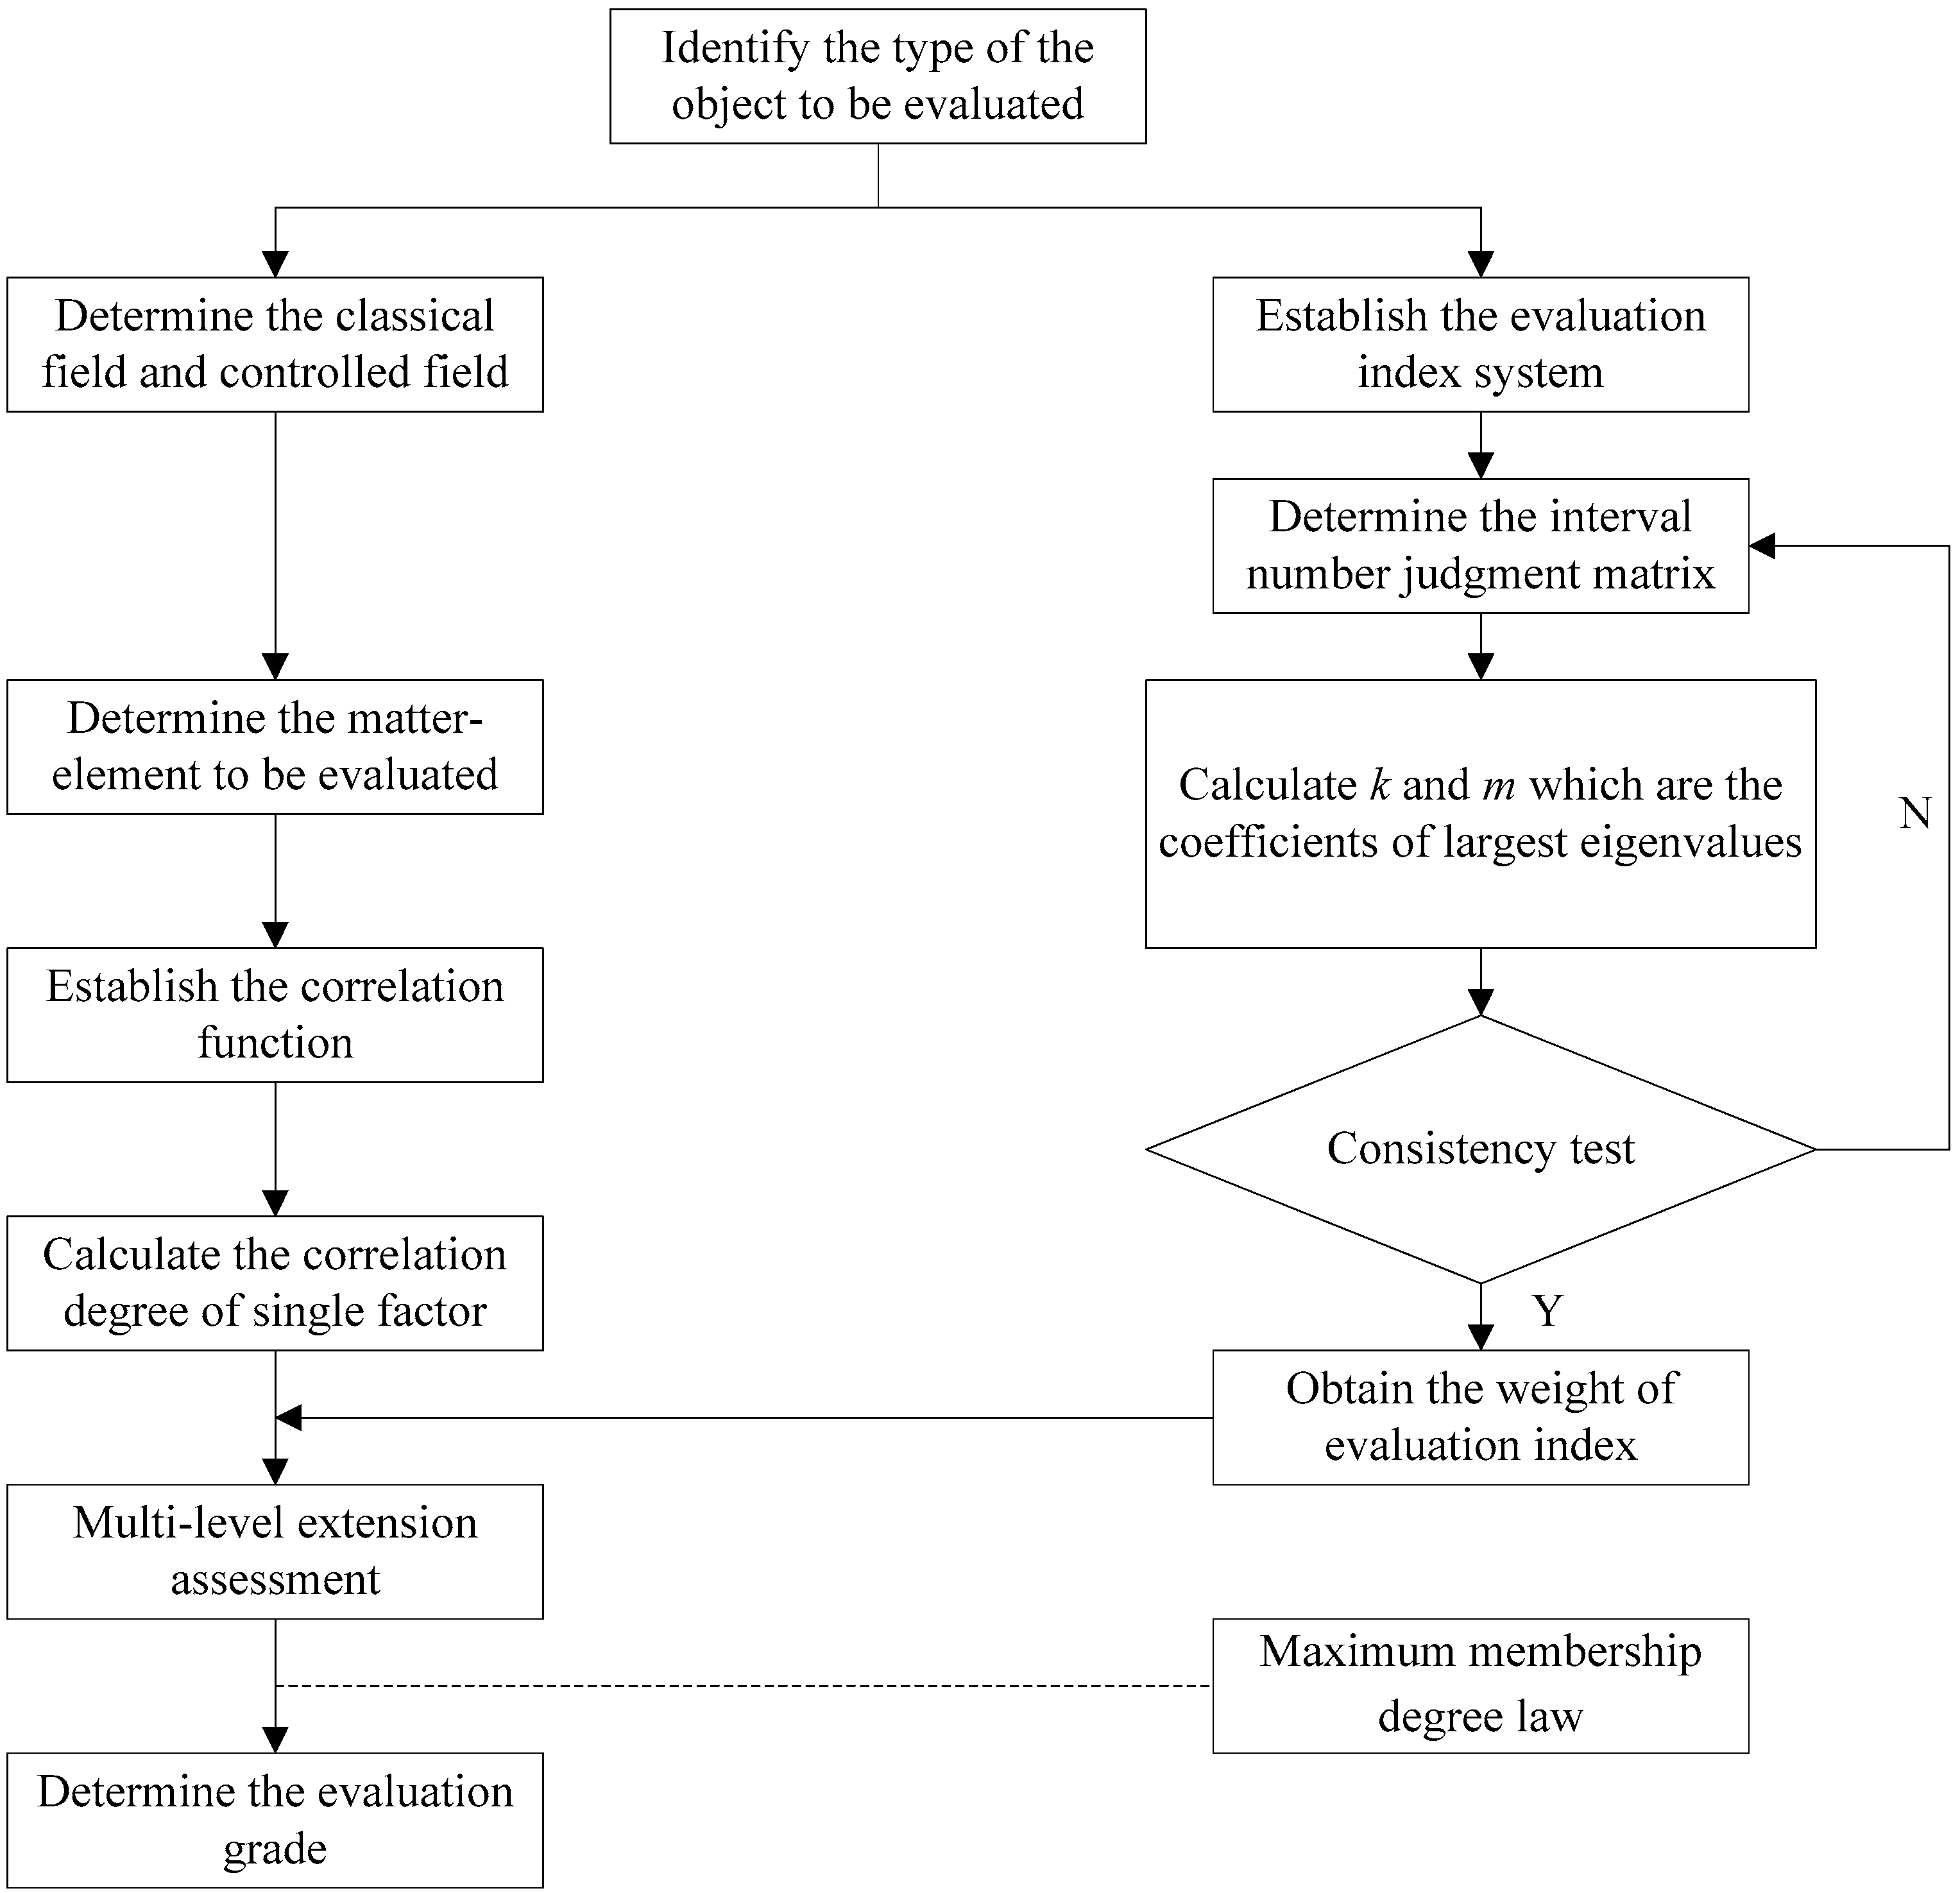
3.3. Evaluation Process of the Comprehensive Benefit of Urban Distribution Planning

In this paper, the improved IAHP and multi-level extension assessment methods are employed to evaluate the comprehensive benefit of urban distribution planning. The proposed method does not need to judge the degree of membership of each index according to the experience of experts, and reduces the influence of subjective factors on the evaluation results. Thus, the evaluation results seem more scientific and reasonable. The evaluation process is shown in Figure 1.

4. Case Study

In this paper, a power distribution planning project of one city in China was used to validate the proposed model based on the improved IAHP and multi-level extension assessment methods. The “point” load forecasting method and the growth rate method are utilized to predict the future load demand in this power project. According to the relevant information of the distribution network planning project to be constructed and the relevant equations provided in this study, the actual data of the comprehensive benefit evaluation index is listed in Table 13.

4.1. Classification of Evaluation Index

In light of how the State Grid Corporation of China uses scoring rules for project evaluation classification, the comprehensive benefit evaluation effects of the power distribution network planning project can be classified into four grades: poor, fair, good, and better, corresponding to N = (N1,N2,N3,N4). The score range of each grade is divided as shown in Table 2.
Then, on the basis of the above division rule of grades and the relevant standards [37], the division criteria of the comprehensive benefit evaluation index of the power distribution network planning project can be given as shown in Table 3.

4.2. Determine the Classical Field and Controlled Field

According to the division rules of grades and using the index “A1”as an example, the classical field and the controlled field of the comprehensive benefit evaluation index can be shown as follows:
R 1 ( A 1 ) = [ N 1 A 11 < 0 , 60 > A 12 < 0 , 60 > A 13 < 0 , 60 > ] R 2 ( A 1 ) = [ N 2 A 11 < 60 , 75 > A 12 < 60 , 75 > A 13 < 60 , 75 > ] R 3 ( A 1 ) = [ N 3 A 11 < 75 , 90 > A 12 < 75 , 90 > A 13 < 75 , 90 > ] R 4 ( A 1 ) = [ N 4 A 11 < 90 , 100 > A 12 < 90 , 100 > A 13 < 90 , 100 > ] R p ( A 1 ) = [ N p A 11 < 0 , 100 > A 12 < 0 , 100 > A 13 < 0 , 100 > ]

4.3. Calculate Index Weight and Correlation Degree

The specific score of each evaluation index can be obtained by the actual planning data of the city, which is described in Table 13. For the index without a unified evaluation standard, the score can be determined by the expert scoring method based on the real data of the index. And, the scores of the remaining indicators can be determined according to the criteria and the actual values given in Table 3 and Table 13. The weights of all indices can be obtained according to Table 4, Table 5, Table 6, Table 7, Table 8, Table 9, Table 10, Table 11 and Table 12, and the consistency tests of all the judgment matrixes have been checked by using the method involved in this study.
Moreover, the distance of the third-level index and the classical field can be calculated by using Equation (21), which is displayed in Table 13. Finally, according to the interval weights obtained from the improved IAHP method and the distance of the third-level index and the classical field in Table 13, the evaluation grades and the correlation degree of the object to be assessed, first-level index, and second-level index can be obtained by using Equations (20) and (22), as shown in Table 14.

4.4. Rate the Comprehensive Benefit of the Power Distribution Network Planning Project

From Table 6, according to the maximum membership degree law, it can be concluded that K 4 ( N ) = max 1 j 4 K j ( N ) . Thus, the comprehensive benefit of the power distribution network planning project belongs to the “better” grade. The grade variable eigenvalue j * represents the comprehensive benefit level deflection degree to its adjacent levels. Use j * [ 0 , 1 ] , [ 1 , 2 ] , [ 2 , 3 ] and [ 3 , 4 ] to represent the comprehensive benefit level “poor”, ”fair”, ”good”, and “better”, respectively. In this paper, the benefit grade variable eigenvalue j * can be computed by using Equations (24) and (25), which is j * [ 3.33 , 3.418 ] [ 3 , 4 ] . Therefore, the evaluation result indicates that the comprehensive benefit grade of the power distribution network planning project is “better”, and there is a development trend towards “better”. In addition, from Table 6 it can be seen that the grades of the economic benefit and social benefit of the power distribution network planning project both equals three, related to the “good” level, implying that the basic economic planning target has been achieved. The grade of the technical benefit of the power distribution network planning project is 4, related to the “better” level, which reveals that the technology of the power distribution network planning project has been improved on the basis of the predetermined target and provides some reference for the construction and decision-making of similar power distribution network planning projects.
In addition, from Table 6 the evaluation effect of safety is “better”, which is higher than that for reliability and flexibility, illustrating that safety is the key factor for enhancing the technical benefit. The evaluation effect of operating economic benefit is better than the financial benefit of the enterprise, indicating that the optimization of the power supply region division, adopting the energy-saving equipment, improving the cable using rate, reasonable reactive power compensation, and maximally reducing the integrated network loss all seem very necessary to enhance the financial benefit of the enterprise. And the evaluation effect of the social environment benefit is better than both the social economic benefit and natural environment benefit, implying that the social environment should get more attention with regards to improving the social benefit. Thus, in order to further improve the comprehensive benefit of the power distribution network construction project, it may be reasonable to focus on the safety, operating economic benefit, and social economic benefit.

5. Conclusions

In this paper, a new comprehensive benefit evaluation approach of the power distribution network planning project based on the improved IAHP approach and the multi-level extension assessment method is proposed. First, according to the principle of AHP, the comprehensive benefit evaluation index system can be constructed considering technical benefit, economic benefit, and social benefit. Then, in order to alleviate the impacts of subjective factors on the evaluation results, the interval number is applied to replace the element of judgment matrix. And a novel method of consistency testing based on the linear programming model is put forward to address the issue of incomplete consistency of the interval number judgment matrix. Moreover, combined with the experience of power experts and quantitative analysis, a comprehensive benefit evaluation method on the basis of multi-level extension assessment theory is formulated to accommodate the flexible characteristic of the power distribution network planning project. The feasibility of this proposed approach has been verified by using the analysis of an example and by proposing some measures to improve the comprehensive benefit. The experimental results indicate that the comprehensive benefit grade of the power distribution network planning project is “better” since the correlation degree is [0.024, 0.055] at j = 4 and the benefit grade variable eigenvalue is j * [ 3.33 , 3.418 ] [ 3 , 4 ] . In brief, this paper offers a new method to solve similar problems of power distribution network construction projects.

Acknowledgments

This study is supported by the Humanities and Social Sciences Planning Foundation of the Ministry of Education of China (Grant No. 16YJA790052).

Author Contributions

Qunli Wu designed this paper and provided overall guidance; Chenyang Peng wrote the whole manuscript.

Conflicts of Interest

The authors declare no conflict of interest.

References

  1. Li, W.; Wang, P.; Li, Z.; Liu, Y. Reliability evaluation of complex radial distribution systems considering restoration sequence and network constraints. IEEE Trans. Power Deliv. 2004, 19, 753–758. [Google Scholar] [CrossRef]
  2. Hu, B.; He, X.-H.; Cao, K. Reliability evaluation technique for electrical distribution networks considering planned outages. J. Electr. Eng. Technol. 2014, 9, 1482–1488. [Google Scholar] [CrossRef]
  3. Bai, H.; Miao, S.; Zhang, P.; Bai, Z. Reliability evaluation of a distribution network with microgrid based on a combined power generation system. Energies 2015, 8, 1216–1241. [Google Scholar] [CrossRef]
  4. Dumbrava, V.; Lazaroiu, C.; Roscia, C.; Zaninelli, D. Expansion planning and reliability evaluation of distribution networks by heuristic algorithms. In Proceedings of the 2011 10th International Conference on Environment and Electrical Engineering (EEEIC), Rome, Italy, 8–11 May 2011; pp. 1–4.
  5. Goswami, P.; Chowdhury, S.; Chowdhury, S.; Song, Y.; Das, J. Reliability evaluation of distribution system. In Proceedings of the 42th International Conference on Universities Power Engineering Conference 2007, Brighton, UK, 4–6 September 2007; pp. 158–166.
  6. Makinen, A.; Partanen, J.; Lakervi, E. Reliability evaluation as part of computer-aided power distribution network design. In Proceedings of the IEEE International Symposium on Circuits and Systems, Espoo, Finland, 7–9 June 1988; pp. 1631–1634.
  7. Jayaweera, D.; Islam, S. Security assessment in active distribution networks with change in weather patterns. In Proceedings of the International Conference on Probabilistic Methods Applied to Power Systems (PMAPS), Durham, UK, 7–10 July 2014; pp. 1–6.
  8. Nahman, J.; Peric, D. Distribution system performance evaluation accounting for data uncertainty. IEEE Trans. Power Deliv. 2003, 18, 694–700. [Google Scholar] [CrossRef]
  9. Šarić, M. Fuzzy approach for evaluating risk of service interruption used as criteria in electricity distribution network planning. In Proceedings of the 2014 12th Symposium on Neural Network Applications in Electrical Engineering (NEUREL), Belgrade, Serbia, 25–27 November 2014; pp. 79–84.
  10. Dashti, R.; Yousefi, S.; Moghaddam, M.P. Comprehensive efficiency evaluation model for electrical distribution system considering social and urban factors. Energy 2013, 60, 53–61. [Google Scholar] [CrossRef]
  11. Cheumchit, T.; Borchard, T. Benefits from the comprehensive planning of the high and medium voltage network. Int. Energy J. 2007, 8, 7–14. [Google Scholar]
  12. Borchard, T.; Haubrich, H.-J. Evaluating the benefit of voltage comprehensive planning of high and medium voltage networks. In Proceedings of the Third International Conference on Electric Utility Deregulation and Restructuring and Power Technologies, DRPT 2008, Nanjing, China, 6–9 April 2008; pp. 823–828.
  13. Fan, C.; Dou, F.; Tong, B.; Long, Z. Risk analysis based on ahp and fuzzy comprehensive evaluation for maglev train bogie. Math. Probl. Eng. 2016. [Google Scholar] [CrossRef]
  14. Ma, X.; Lu, S.; Zhou, Y. The post-evaluation index system for preparatory work of transmission and transformation projects. In Proceedings of the Power Engineering and Automation Conference (PEAM), Wuhan, China, 8–9 September 2011; pp. 363–366.
  15. Wang, H.; Lin, Z.; Wen, F.; Huang, J. A comprehensive evaluation index system for power system operation. In Proceedings of the International Conference on Sustainable Power Generation and Supply (SUPERGEN 2012), Hangzhou, China, 8–9 Septemebr 2012; pp. 1–6.
  16. Yang, W.; He, Y.; Li, D.; Li, Y.; Li, F. Comprehensive post-evaluation method of power network renovation project based on fuzzy interval evaluation and analytic hierarchy process. Power Syst. Technol. 2009, 33, 33–37. [Google Scholar]
  17. Zhang, G.-Q.; Zhang, W.; Xu, Z.-F. Transformer substation construction project postevaluation base on improved gray fuzzy theory. In Proceedings of the 2011 International Conference on Electric Technology and Civil Engineering (ICETCE), Lushan, China, 22–24 April 2011; pp. 1829–1832.
  18. Wang, Z.; Fan, L.; Su, H. A comprehensive power quality evaluation model based on interval number theory. Power Syst. Prot. Control 2012, 40, 41–45. [Google Scholar]
  19. Zeng, M.; Zou, J.; Xu, W.; Liu, H.; Liu, C. Estimation of life-cycle emission reduction benefits for wind power project based on interval-number theory. Autom. Electr. Power Syst. 2011, 35, 17–21. [Google Scholar]
  20. Huang, G.; Yang, C.; Wu, Z.; Liu, H. Application of interval analytic hierarchy process in construction safety management. In Proceedings of the 2010 International Conference on E-Product E-Service and E-Entertainment (ICEEE), Jiaozuo, China, 7–9 November 2010; pp. 1–4.
  21. Wei, W.; Huang, J.; Luo, F.Z.; Chen, F.; Bao, H.L.; Yang, J.L. Applications of interval theory in the evaluation and decision making of power system projects. Appl. Mech. Mater. 2013, 385–386, 1873–1878. [Google Scholar] [CrossRef]
  22. Cai, W. Extension theory and its application. Chin. Sci. Bull. 1999, 44, 1538–1548. [Google Scholar] [CrossRef]
  23. He, Y.-X.; Dai, A.-Y.; Zhu, J.; He, H.-Y.; Li, F. Risk assessment of urban network planning in china based on the matter-element model and extension analysis. Int. J. Electr. Power Energy Syst. 2011, 33, 775–782. [Google Scholar] [CrossRef]
  24. Li, C.; Liu, Y.; Li, S. Risk evaluation of qinghai–tibet power grid interconnection project for sustainability. Sustainability 2016, 8, 85. [Google Scholar] [CrossRef]
  25. Li, H.-Z.; Guo, S. External economies evaluation of wind power engineering project based on analytic hierarchy process and matter-element extension model. Math. Probl. Eng. 2013. [Google Scholar] [CrossRef]
  26. Zhao, B.; Xu, W.; Liang, G.; Meng, Y. Stability evaluation model for high rock slope based on element extension theory. Bull. Eng. Geol. Environ. 2015, 74, 301–314. [Google Scholar] [CrossRef]
  27. Jing, J.; Hui, Q.; Chen, Y.-F.; Xi, W.-J. Assessment of groundwater quality based on matter element extension model. J. Chem. 2013. [Google Scholar] [CrossRef]
  28. Xu, X.; Niu, D.; Qiu, J.; Wu, M.; Wang, P.; Qian, W.; Jin, X. Comprehensive evaluation of coordination development for regional power grid and renewable energy power supply based on improved matter element extension and topsis method for sustainability. Sustainability 2016, 8, 143. [Google Scholar] [CrossRef]
  29. Abeysinghe, T.; Lee, C. Best linear unbiased disaggregation of annual gdp to quarterly figures: The case of malaysia. J. Forecast. 1998, 17, 527–537. [Google Scholar] [CrossRef]
  30. Saaty, T.L. How to make a decision: The analytic hierarchy process. Eur. J. Oper. Res. 1990, 48, 9–26. [Google Scholar] [CrossRef]
  31. Wu, Y.; Zhu, W.; Li, X.; Gao, R. Interval approach to analysis of hierarchy porcess. J. Tianjin Univer. Sci. Technol. 1995, 28, 700–705. [Google Scholar]
  32. Zhang, N.; Pan, D.-J.; Zhao, Y.-M.; Li, C.-M.; Wu, H. Evaluation of relative mining intensity in western China based on interval analytic hierarchy process. Electron. J. Geotech. Eng. 2014, 19, 2941–2953. [Google Scholar]
  33. Li, W.; Guo, J. Interval weights and consistency check of judgment matrix in the analytic hierarchy process. J. Syst. Manag. 2004, 13, 530–532. [Google Scholar]
  34. Ma, L.; Lu, Z.; Hu, H. A fuzzy comprehensive evaluation method for economic operation of urban distribution network based on interval number. Trans. China Electrotech. Soc. 2012, 27, 163–171. [Google Scholar]
  35. Zeng, M.; Zhao, J.; Liu, H.; Xu, S. Investment benefit analysis based on interval number for distributed generation. Electr. Power Autom. Equip. 2012, 32, 22–26. [Google Scholar]
  36. Guo, H.; Xu, H.; Liu, L. Threat assessment for air combat target based on interval topsis. Syst. Eng. Electron. 2009, 31, 2914–2917. [Google Scholar]
  37. SGCC. Corporate Standards of State Grid Corporation of China. In The Guide of Planning and Design of Distribution Network; State Grid Corporation of China: Beijing, China, 2013; pp. 1–35. (In Chinese) [Google Scholar]
Figure 1. Evaluation process of the comprehensive benefit of the power distribution planning project.
Sustainability 08 00796 g001
Table 1. Comprehensive benefit evaluation index system of the power distribution network planning project.
ObjectFirst-Level IndexSecond-Level IndexThird-Level Index
Comprehensive benefit of urban distribution network planning project G Technical benefit A Reliability A 1 Average interruption hours of customer A 11
Reliability rate of power supply A 12
Cable adoption rate A 13
Safety A 2 Voltage qualification rate A 21
“N−1” pass rate A 22
Power supply radius A 23
Flexibility A 3 Capacity-load ratio A 31
Connection rate of stations A 32
Economic benefit B Technical economic benefit B 1 Integrated network loss rate B 11
Equipment utilization ratio B 12
Financial benefit of enterprise B 2 Net present value B 21
Payback period of investment B 22
Social benefit C Social economic benefit C 1 Direct contribution rate of GDP C 11
Social environmental benefit C 2 Employment rate C 21
Natural environmental benefit C 3 Improvement of environment C 31
Table 2. Division rule of grades.
Evaluation Grade ( N ) N 1 N 2 N 3 N 4
Score range[0, 60][60, 75][75, 90][90, 100]
Evaluation effectsPoorFairGoodBetter
Table 3. Division criteria of the comprehensive benefit evaluation index.
IndexGrade of Comprehensive Benefit Evaluation Index
[90, 100][75, 90][75, 90][0, 60]
A 11 0 1 h 3 h 1 h 9 h 3 h ≥9h
A 12 95 % 100 % 90 % 95 % 85 % 90 % 0 85 %
A 13 80 % 100 % 60 % 80 % 30 % 60 % 0 30 %
A 21 90 % 100 % 85 % 90 % 80 % 85 % 0 80 %
A 22 90 % 100 % 80 % 90 % 60 % 80 % 0 60 %
A 23 2 k m 3 k m 3 k m 3.5 k m ( 1.5 k m 2 k m ) 3.5 k m 4 k m ( 1 k m 1.5 k m ) 4 k m 5 k m ( 0 1 k m )
A 31 1.6 1.9 1.9 2.0 ( 1.5 1.6 ) 2.0 2.3 ( 1.3 1.5 ) 2.3 3 ( 0 1.3 )
A 32 90 % 100 % 80 % 90 % 60 % 80 % 0 60 %
B 11 0 0.5 % 0.8 % 0.5 % 1.5 % 0.8 % 5 % 1.5 %
B 12 60 % 100 % 35 % 60 % 20 % 35 % 0 20 %
B 21 1
B 22 10 y 8 y 12 y 10 y 14 y 12 y 18 y 14 y
C 11 8 % 10 % 6 % 8 % 4 % 6 % 0 6 %
C 21 0.09 % 0.10 % 0.08 % 0.09 % 0.07 % 0.08 % 0 0.07 %
C 31 80 % 100 % 60 % 80 % 40 % 60 % 0 40 %
1 “—” represents that the index does not have a unified scoring standard.
Table 4. The calculation results of the first-level index.
A B C x x + k m Interval Weights
A [1, 1][1/4, 1/3][4, 5]0.4880.4810.9671.023[0.472, 0.492]
B [3, 4][1, 1][6, 7]0.3490.363[0.337, 0.371]
C [1/5, 1/4][1/7, 1/6][1, 1]0.0810.078[0.078, 0.080]
Table 5. The calculation results of the “ A ” index.
A 1 A 2 A 3 x x + k m Interval Weights
A 1 [1, 1][1, 2][4, 5]0.5110.5150.9191.076[0.469, 0.554]
A 2 [1/2, 1][1, 1][3, 4]0.3710.381[0.341, 0.410]
A 3 [1/5, 1/4][1/4, 1/5][1, 1]0.1180.104[0.108, 0.112]
Table 6. The calculation results of the “ B ” index.
B 1 B 2 x x + k m Interval Weights
B 1 [1, 1][1/5, 1/3]0.2080.2080.9571.041[0.199, 0.217]
B 2 [3, 5][1, 1]0.7920.792[0.758, 0.824]
Table 7. The calculation results of the “ C ” index.
C 1 C 2 C 3 x x + k m Interval Weights
C 1 [1, 1][5, 6][2, 3]0.5970.5980.9521.039[0.569, 0.621]
C 2 [1/6, 1/5][1, 1][1/5, 1/4]0.0910.087[0.087, 0.090]
C 3 [1/3, 1/2][4, 5][1, 1]0.3120.315[0.297, 0.328]
Table 8. The calculation results of the “ A 1 ” index.
A 11 A 12 A 13 x x + k m Interval Weights
A 11 [1, 1][1/4, 1/3][3, 4]0.2490.2460.9611.032[0.240, 0.254]
A 12 [3, 4][1, 1][5, 7]0.6600.662[0.634, 0.683]
A 13 [1/4, 1/3][1/7, 1/5][1, 1]0.0910.092[0.087, 0.095]
Table 9. The calculation results of the “ A 2 ” index.
A 21 A 22 A 23 x x + k m Interval Weights
A 21 [1, 1][3, 4][4, 5]0.9430.9350.9641.035[0.910, 0.968]
A 22 [1/4, 1/3][1, 1][1, 8/5]0.2600.280[0.251, 0.290]
A 23 [1/5, 1/4][5/8, 1][1, 1]0.2060.218[0.199, 0.225]
Table 10. The calculation results of the “ A 3 ” index.
A 31 A 32 x x + k m Interval Weights
A 31 [1, 1][1/3, 1]0.3750.3750.8861.118[0.346, 0.419]
A 32 [1, 3][1, 1]0.6250.625[0.541, 0.699]
Table 11. The calculation results of the “ B 1 ” index.
B 11 B 12 x x + k m Interval Weights
B 11 [1, 1][2, 3]0.7080.7080.9571.041[0.678, 0.737]
B 12 [1/3, 1/2][1, 1]0.2920.292[0.279, 0.304]
Table 12. The calculation results of the “ B 2 ” index.
B 21 B 22 x x + k m Interval Weights
B 21 [1, 1][3, 4]0.7750.7750.9751.025[0.755, 0.794]
B 22 [1/4, 1/3][1, 1]0.2250.225[0.219, 0.231]
Table 13. The distance of the third-level index, the classical field, and the basic data.
Second-Level IndexInterval WeightsThird-Level IndexActual ValuesScoresInterval WeightsDistance of the Third-Level Index to be Evaluated Relative to the Classical Field
j = 1 j = 2 j = 3 j = 4
A 1 [0.469, 0.554] A 11 2 hour83[0.240, 0.254]−0.575−0.3200.467−0.151
A 12 99.96%99[0.634, 0.683]−0.975−0.960−0.9000.100
A 13 50%70[0.087, 0.095]−0.1800.333−0.143−0.210
A 2 [0.341, 0.410] A 21 94%94[0.910, 0.968]−0.850−0.760−0.4000.400
A 22 93%93[0.251, 0.290]−0.825−0.720−0.3000.300
A 23 2.5 km95[0.199, 0.225]−0.875−0.800−0.5000.500
A 3 [0.108, 0.112] A 31 1.8297[0.346, 0.419]−0.925−0.880−0.7000.544
A 32 75%71[0.541, 0.699]−0.2750.267−0.121−0.310
B 1 [0.199, 0.217] B 11 0.7%85[0.678, 0.737]−0.625−0.4000.333−0.250
B 12 55%87[0.279, 0.304]−0.675−0.4800.200−0.188
B 2 [0.758, 0.824] B 21 4672[0.755, 0.794]−0.3000.200−0.097−0.391
B 22 11.5 year78[0.219, 0.231]−0.450−0.1200.200−0.353
C 1 [0.569, 0.621] C 11 7.4%86[1.000, 1.000]−0.650−0.4400.267−0.222
C 2 [0.087, 0.090] C 21 0.084%82[1.000, 1.000]−0.550−0.2800.467−0.308
C 3 [0.297, 0.328] C 31 62%76[1.000, 1.000]−0.400−0.0400.067−0.368
Table 14. Multi-level extension assessment results for the comprehensive benefit evaluation of the power distribution network planning project.
IndexCorrelation DegreesInterval WeightsGrades
j = 1 j = 2 j = 3 j = 4
G [−0.571, −0.551][−0.432, −0.326][−0.216, −0.196][0.024, 0.055] 4
A [−0.967, −0.881][−0.818, −0.572][−0.529, −0.480][0.190, 0.250][0.472, 0.492]4
B [−0.203, −0.201][−0.063, −0.060][0.050, 0.060][−0.129, −0.126][0.337, 0.371]3
C [−0.584, −0.537][−0.312, −0.287][0.212, 0.230][−0.287, −0.263][0.078, 0.080]3
A 1 [−0.829, −0.796][−0.705, −0.680][−0.510, −0.494][0.010, 0.012][0.469, 0.554]4
A 2 [−1.259, −1.155][−1.125, −1.032][−0.587, −0.539][0.539, 0.587][0.341, 0.410]4
A 3 [−0.580, −0.469][−0.182, −0.160][−0.378, −0.308][0.011, 0.021][0.108, 0.112]4
B 1 [−0.666, −0.612][−0.441, −0.405][0.282 ,0.306][−0.241, −0.222][0.199, 0.217]3
B 2 [−0.342, −0.325][0.125, 0.131][−0.031, −0.029][−0.392, −0.373][0.758,0.824]2
C 1 [−0.650, −0.650][−0.440, −0.440][0.267, 0.267][−0.222, −0.222][0.569, 0.621]3
C 2 [−0.550, −0.550][−0.280, −0.280][0.467, 0.467][−0.308, −0.308][0.087, 0.090]3
C 3 [−0.400, −0.400][−0.040, −0.040][0.067, 0.067][−0.368, −0.368][0.297, 0.328]3

