1. Introduction
This paper reports the relationship between the government subsidy program and the technical design and performance of solar water pumping systems that are installed in off-grid rural villages in the mountainous hinterland of Nepal. We investigate, using a non-parametric productive efficiency measurement method, whether the ad valorem subsidy introduced by the government tends to be associated with the larger size of the system, thus to the inefficient use of limited financial resources of the Nepali government. The results indicate that those villages with a higher dependence on the subsidy tend to install solar water pumping systems with excessive capacity. Thus, we conclude that, on one hand, this subsidy program effectively increases the overall cases of solar water pumping systems across the nation, and on the other hand, it associates non-negligible costs of distorted incentives with the villagers. With respect to whether the resources that are inefficiently allocated to production and subsidy should be spent on building additional solar-photovoltaic water pumping systems (SWPSs), our results indicate that the inefficiently allocated resources for production and subsidy are equivalent to 68% more SWPS water supplied to households or 45% more SWPS installations.
In contrast to previous literature that examined SWPS installation, our findings add quantitative policy implications for executing agencies that support SWPS installation under tight budget constraints. A number of papers investigates the effect of advance technology adoption. For example, among the former, Requate [
1] studies the development of advanced environmental technology and the timing of taxation policy implementation. More recently, Ouchida and Goto [
2] examine the optimal policy concerning environmental R&D. Rather than investigating the impact of advanced environmental technology, the current paper focuses on the social relevance of efficiently implementing the already existing technology. Despite its importance, previous articles on SWPS have only minimally addressed quantitative policy implications. Bhandari and Stadler [
3], Nepal [
4] and Surendra et al. [
5] have examined the status of installation; Gurung et al. [
6] have provided a snapshot of government subsidy policies; and Shrestha [
7] has conducted a case study to assess the performance and problems associated with SWPSs in three villages. There is no empirical evidence that addresses the efficiency/effectiveness of countrywide SWPS adoption. The current paper fills this gap, albeit not completely, by providing insights for designing polices of renewable energy in the off-grid mountainous hinterland of Nepal.
The geographically challenged mountainous hinterland in rural Nepal faces severe underdevelopment problems due to a lack of fundamental social infrastructure. The electricity infrastructure in Nepal is insufficient with an overall on-the-grid electrification rate in Nepal as low as 56%, and this rate is significantly lower in rural areas (Ministry of Science, Technology and Environment, Government of Nepal [
8]). Due to frequent blackouts, water provision that does not depend on electricity is widely utilized, even in the capital city of Kathmandu. The lack of electricity causes water provision difficulties, especially in mountainous areas where the altitudinal variations are significant between the water source and the community. In the mountainous areas of Nepal, there are few solar panels and micro waterpower generators to generate electricity; however, water supply primarily depends on human labor. Villagers, especially women and female children, often spend substantial time just conveying water to their families every day. To overcome this challenge, the installation of solar powered water provision systems (solar-photovoltaic water pumping systems (SWPSs)), an essential labor saving technology, has recently been implemented and is expected to spread nationwide in Nepal.
SWPS is a composite package that uses photovoltaic energy to draw water from alternative sources to a distribution tank, which is then connected to community taps using the force of gravity. According to our preliminary survey in three villages in rural Nepal, the time saved due to SWPS installation is an average of approximately 60 min per round trip, and the SWPS could save villagers as much as four hours a day. However, we learned that this figure should be regarded cautiously, as villagers do not usually wear watches and time perceptions vary.
The first case of SWPS installation dates back to 1982; however, since then, the number of SWPSs has not grown as fast as expected because their installation has been exclusively dependent on international non-governmental organizations (NGOs). Under Nepal’s Ministry of Science, Technology and Environment, the Alternative Energy Promotion Center (AEPC) was established in 1996 with a mission to promote renewable energy in Nepal. In the initial phase of the AEPC, most of the SWPSs were installed as government pilot projects, as solar energy was not a priority and was used primarily for solar home systems with much smaller panels due to the associated high costs. In 2004, the AEPC adopted its current policy, which provides matching subsidies to partly cover the initial cost of an SWPS. Although the AEPC estimates the potential demand for SWPSs to be more than 1000 villages, the Nepali government’s tight financial constraints require that the installation process is both economically and technologically sound. Finding an efficient way to promote SWPS installation through the subsidy policy is, therefore, an acute research agenda item, both from the technical and the social perspectives. By collecting original field data from 38 wards in all seven regions of Nepal, this paper identifies technically efficient SWPS cases and then investigates potential economic policies that will enhance the performance of the SWPS.
We adopted a two-stage approach to attain this objective. In the first stage, we conducted a data envelopment analysis (DEA) to measure the SWPS’s productive efficiency in each village, which we defined as the actual number of households that the SWPS serves relative to the predicted number based on the size of the inputs (e.g., tank capacity, transmission pipe length, and solar panels’ peak kilowatts). DEA is a standard methodology of benchmarking productive efficiency that was originally developed by Farrel [
9] and followed by seminal works by Charnes, Cooper and Rhodes [
10] and Banker, Charnes and Cooper [
11]. DEA is widely used in the field of planning and operational research as it can handle joint production that involves multiple outputs without reference to the price or other nominal data that are often unavailable in the development context. The obtained efficiency scores were then attributed to differences in institutional settings and the system’s technical design. Our results show, inter alia, that abundant financial support from the government results in inefficient systems and that charging user fees significantly discourages villagers from SWPS participation, hence undermining the potential benefits of SWPSs.
To date, there is no existing research regarding SWPS efficiency and its social and technical determinant factors. However, Campana, Li, and Yan [
12] analyzed an efficient SWPS design wherein they place greater emphasis on the technical aspects—such as the type of electric current and photovoltaic array—than on social factors. Shrestha [
7] provides a descriptive study based on SWPS observations in three villages and makes policy suggestions for specific cases based on the experiences in these three villages. To date, there are at least 128 cases of SWPS installation that have received government or other external support. However, it usually takes several days to access mountainside villages in Nepal for data collection. Given these circumstances, this paper uses geographically comprehensive data that are based on observations in 38 villages across all seven regions of Nepal to provide the first quantitative analysis of efficient SWPS design and policy.
In the next section, we review the social background and the Nepali government’s current policy relating to SWPS promotion.
Section 3 then presents the methodology for empirical analysis, followed by a description of the data and results in
Section 4. Finally,
Section 5 concludes our paper.
2. Social Background and Subsidy Program for the SWPS in Rural Nepal
2.1. The SWPS as an Immediate Option for Water Supply in the Mountainous Areas of Nepal
Access to a sustainable and convenient water supply is vital to improving the livelihoods of rural populations. However, the people living in Nepal’s mountainous areas face substantial challenges in obtaining drinking water. Numerous rounds of carrying water tanks require them to walk long distances in hilly mountainous areas. They often spend hours walking to and from water sources several times a day. This trek is not only a tedious daily activity, but it is also a waste of useful time that could be alternatively invested in other productive activities. Because women and children are usually the ones to retrieve the water, drinking water provisions raise social issues to be considered when addressing development challenges.
Easy access to a drinking water supply significantly affects the quality of rural livelihoods. Although the conventional water pumping system is driven by diesel energy or grid-connected electricity power and enables rural villagers to have improved water accessibility, neither diesel nor electricity is an immediate and available option for remote mountainous areas in Nepal. On the one hand, as an imported commodity, diesel is an exceptionally expensive fuel for rural Nepal due to the significant cost of transportation. On the other hand, because the electrification rate remains at 71.6%, even including off-grid alternative energy sources in rural Nepal (IEA 2012), it takes some time for marginalized mountainous areas to be fully electrified. Furthermore, even in the grid-connected areas, serious power shortages and breakdowns are prevalent phenomena due to insufficient power development compared with the rapid growth of urban electricity demand. In particular, heavy dependence on hydropower poses a serious challenge for a stable power supply during the winter seasons when available water is limited. Considering the current perspective for power development in the near future, it is unrealistic to predict a stable electricity supply for the purpose of energizing a drinking water supply.
The SWPS is a promising alternative tool that offers an improved water supply for disadvantaged areas and greatly improves the livelihoods of rural settlers. The SWPS is a comprehensive package that typically contains the following: (1) solar photovoltaic arrays; (2) a water storage tank located near a water source (e.g., river, stream, pond, or rivulet); (3) a distribution tank located at the highest point in the village to store water that is pumped up using electric power; (4) a water pump for drawing up water from storage to the distribution tank; (5) community taps for water distribution; and (6) other auxiliary equipment and facilities. Gravity delivers water from the distribution tank to community taps located in the village. The capacities of tanks and solar photovoltaic modules differ according to the number of beneficiaries, water resource availability, water head and other geographic conditions. Villagers are freed from walking long distances to water sources in the hilly mountains and are able to retrieve water from their respective taps near their homes. Because solar radiation influences water availability via the SWPS, the water is not always accessible from the taps, especially during the rainy seasons. Nonetheless, even though the SWPS is not the perfect solution for improving water access, villagers can enjoy better livelihoods due to the reduction in the work and time required to retrieve water.
2.2. Policy Scheme for Promoting SWPS Installation
Because SWPS installation costs have increased tremendously, acquiring external funding to facilitate installation is necessary. The APEC, as an executing agency, has various funding opportunities with foreign (mostly European) donors for the promotion of renewable energy in Nepal. Since 2004, the APEC has continued its subsidy programs as an institutional strategy to promote solar technology and proliferate the adoption of SWPSs nationwide. From 2004 to 2012, the first program was designed and implemented as a part of the Renewable Energy Project (REP) with funding support from the European Union (EU), and 30 SWPSs have been successfully installed. Because the REP focuses on the institutional application of solar technology in remote districts of Nepal, many efforts have been made to develop and establish the foundation of the current policy framework and procedures via a participatory community approach. In step with the REP, a Nepali government initiative and Phase II of the Energy Sector Assistant Program (ESAPII), the policy scheme was continued to further promote SWPS installation. Because the KfW Development Bank (KfW) joined the ESAPII in 2009 and offered additional funding to install 100 SWPSs, the SWPS component began in 2010 under the ESAPII. The actual SWPS installation under ESAPII produced 25 units. Since 2012, the KfW has continued to support the SWPS component on a much larger scale with the National Rural and Renewable Energy Program (NRREP), which is jointly supported by the Danish International Development Agency (Danida), the Norwegian Agency for Development Cooperation (Norad) and the KfW.
Because SWPS installation under the AEPC depends on different funding sources, there is no consistent record of achievements. Thus, to better understand the history of SWPS installation, we worked with the AEPC.
Table 1 displays the best of what we discovered through our joint efforts with the AEPC as of late 2014. We confirm that at least 192 SWPS units have been planned, of which 128 have been installed across Nepal. However, there are still cases that are not documented in detail. One group includes 16 SWPS units installed by the AEPC, but we were unable to identify any specific projects. Another group includes at least six SWPS units that were installed by international NGOs and other organizations without going through the AEPC. Because more cases of this type may exist, the total number herein is minimum bound.
The AEPC currently provides subsidies for a maximum of 75% of the total construction cost, not to exceed 1.0 million rupees (recently increased to 1.5 million rupees), for each SWPS that passes the technical feasibility assessments, which include geographical conditions, social considerations (e.g., economic status, community mobilization, and maintenance), and financial capabilities to cover the remaining costs. Areas that are connected to grid electricity are also excluded from eligible site listings.
The AEPC designates nine local NGOs as regional service centers (RSCs) throughout the country. The RSCs regularly publicize and promote the AEPC’s SWPS subsidy program via respective local radio stations and open windows for villagers to voice potential demands. When villagers voice their demands to the RSCs, a pre-feasibility study (PFS) is conducted as a first step. The study assesses the following three conditions:
- (1)
The claim (demand) is real.
- (2)
A water resource is available.
- (3)
A sufficient number of households are involved in the claim.
With respect to the availability of annual funds from the AEPC subsidy program for each RSC and the results of the PFS, the feasible candidates for the claims are selected and move on to a feasibility study (FS) undertaken by the RSC. As villagers have little knowledge about the SWPS and its modalities, the RSCs are usually closely involved in completing the application. Because villagers should raise some portion of the total cost, including in-kind contributions of labor and land, it is critically important to establish mutual agreements regarding the allocation of financial burdens among prospective beneficiaries in advance. It may sometimes be possible to raise additional funding from local government units (e.g., district development committees and village development committees) and local private banks, and moreover, the RSC could help coordinate such financial planning. Accordingly, it is evident that communities play a vital role in ensuring the sustainability of SWPS projects. Among other things, communities establish water use rules, recruit personnel for maintenance purposes, and collect maintenance fees. The FS ensures that candidates’ claims meet the following nine eligibility requirements and evaluation criteria:
- (1)
The village is not connected to the national power grid.
- (2)
Sufficient water head, i.e., the difference in elevation between the water tank and water source is adequate.
- (3)
Available daily water resource is more than 25 L per person, which falls far below the World Health Organization (WHO) standard of 45 L.
- (4)
The number of beneficiary households is approximately 40–60.
- (5)
The anticipated water use is exclusively for drinking and/or irrigation and does not conflict with other purposes, such as micro hydropower and tourism.
- (6)
Adequate financial contributions from villagers are available.
- (7)
Adequate in-kind contributions from villagers exist.
- (8)
The extent of social disadvantages, such as female village heads, and the involvement of lower castes, meet requirement standards.
- (9)
There exists evidence of preparedness of maintenance and the ability to maintain a sustainable operation.
If the FS confirms that the candidate village meets all required criteria, then the RSC guides villagers to form a users’ committee and formally apply for a water right permit from the district development committee. Successful issuance of the water right permit allows the RSC to proceed to the next and final step, namely, the detail feasibility study (DFS). The RSC dispatches a team of engineers and technicians into the field to conduct the DFS and implement geographical and hydrological measures, technical designs, and financial planning to establish a detailed plan for the SWPS that includes close communication and discussions with the users’ committee. As an outcome of the DFS, the proposed plan is then finally submitted to the AEPC for final approval. After approval by the APEC committee, private solar companies are recruited through competitive bidding to initiate construction.
3. Methodology of SWPS Performance Measurement and Evaluation
We first used data envelopment analysis (DEA) to estimate the productive efficiency of the SWPS at the village level in rural Nepal. Obtained efficiency scores were then regressed on social and technical factors to investigate their association with the potential improvement of the system’s efficiency. Social factors include the number of user charges and governmental subsidies and the initial installation cost per household. Technical factors refer to the extent of variations in water sources, access to technical consultants during the system design stage, and collection tanks’ capacities, along with the cross terms with the distribution tank capacities.
3.1. Measurement of the SWPS Productive Efficiency at the Ward Level
We employed output-oriented DEA to assess the technical efficiency of the SWPS in 38 villages (i.e., wards) in rural Nepal. DEA is widely used for efficiency measurements in various industries and economies. Taniguchi and Kaneko [
13] estimated the operational efficiency of the rural electrification program in Bangladesh, and Ha et al. [
14,
15,
16] measured and compared the productive efficiencies of transportation sectors in Asia, for example. Output-oriented DEA measures the productive efficiency of a decision-making unit (DMU) as the relative distance to the production possibility frontier in the direction of output expansion. The efficiency of the
kth DMU is defined as the maximum value of
hk in the following linear programming problem:
In this problem,
xjk is the
jth input and
yik is the
ith output of the
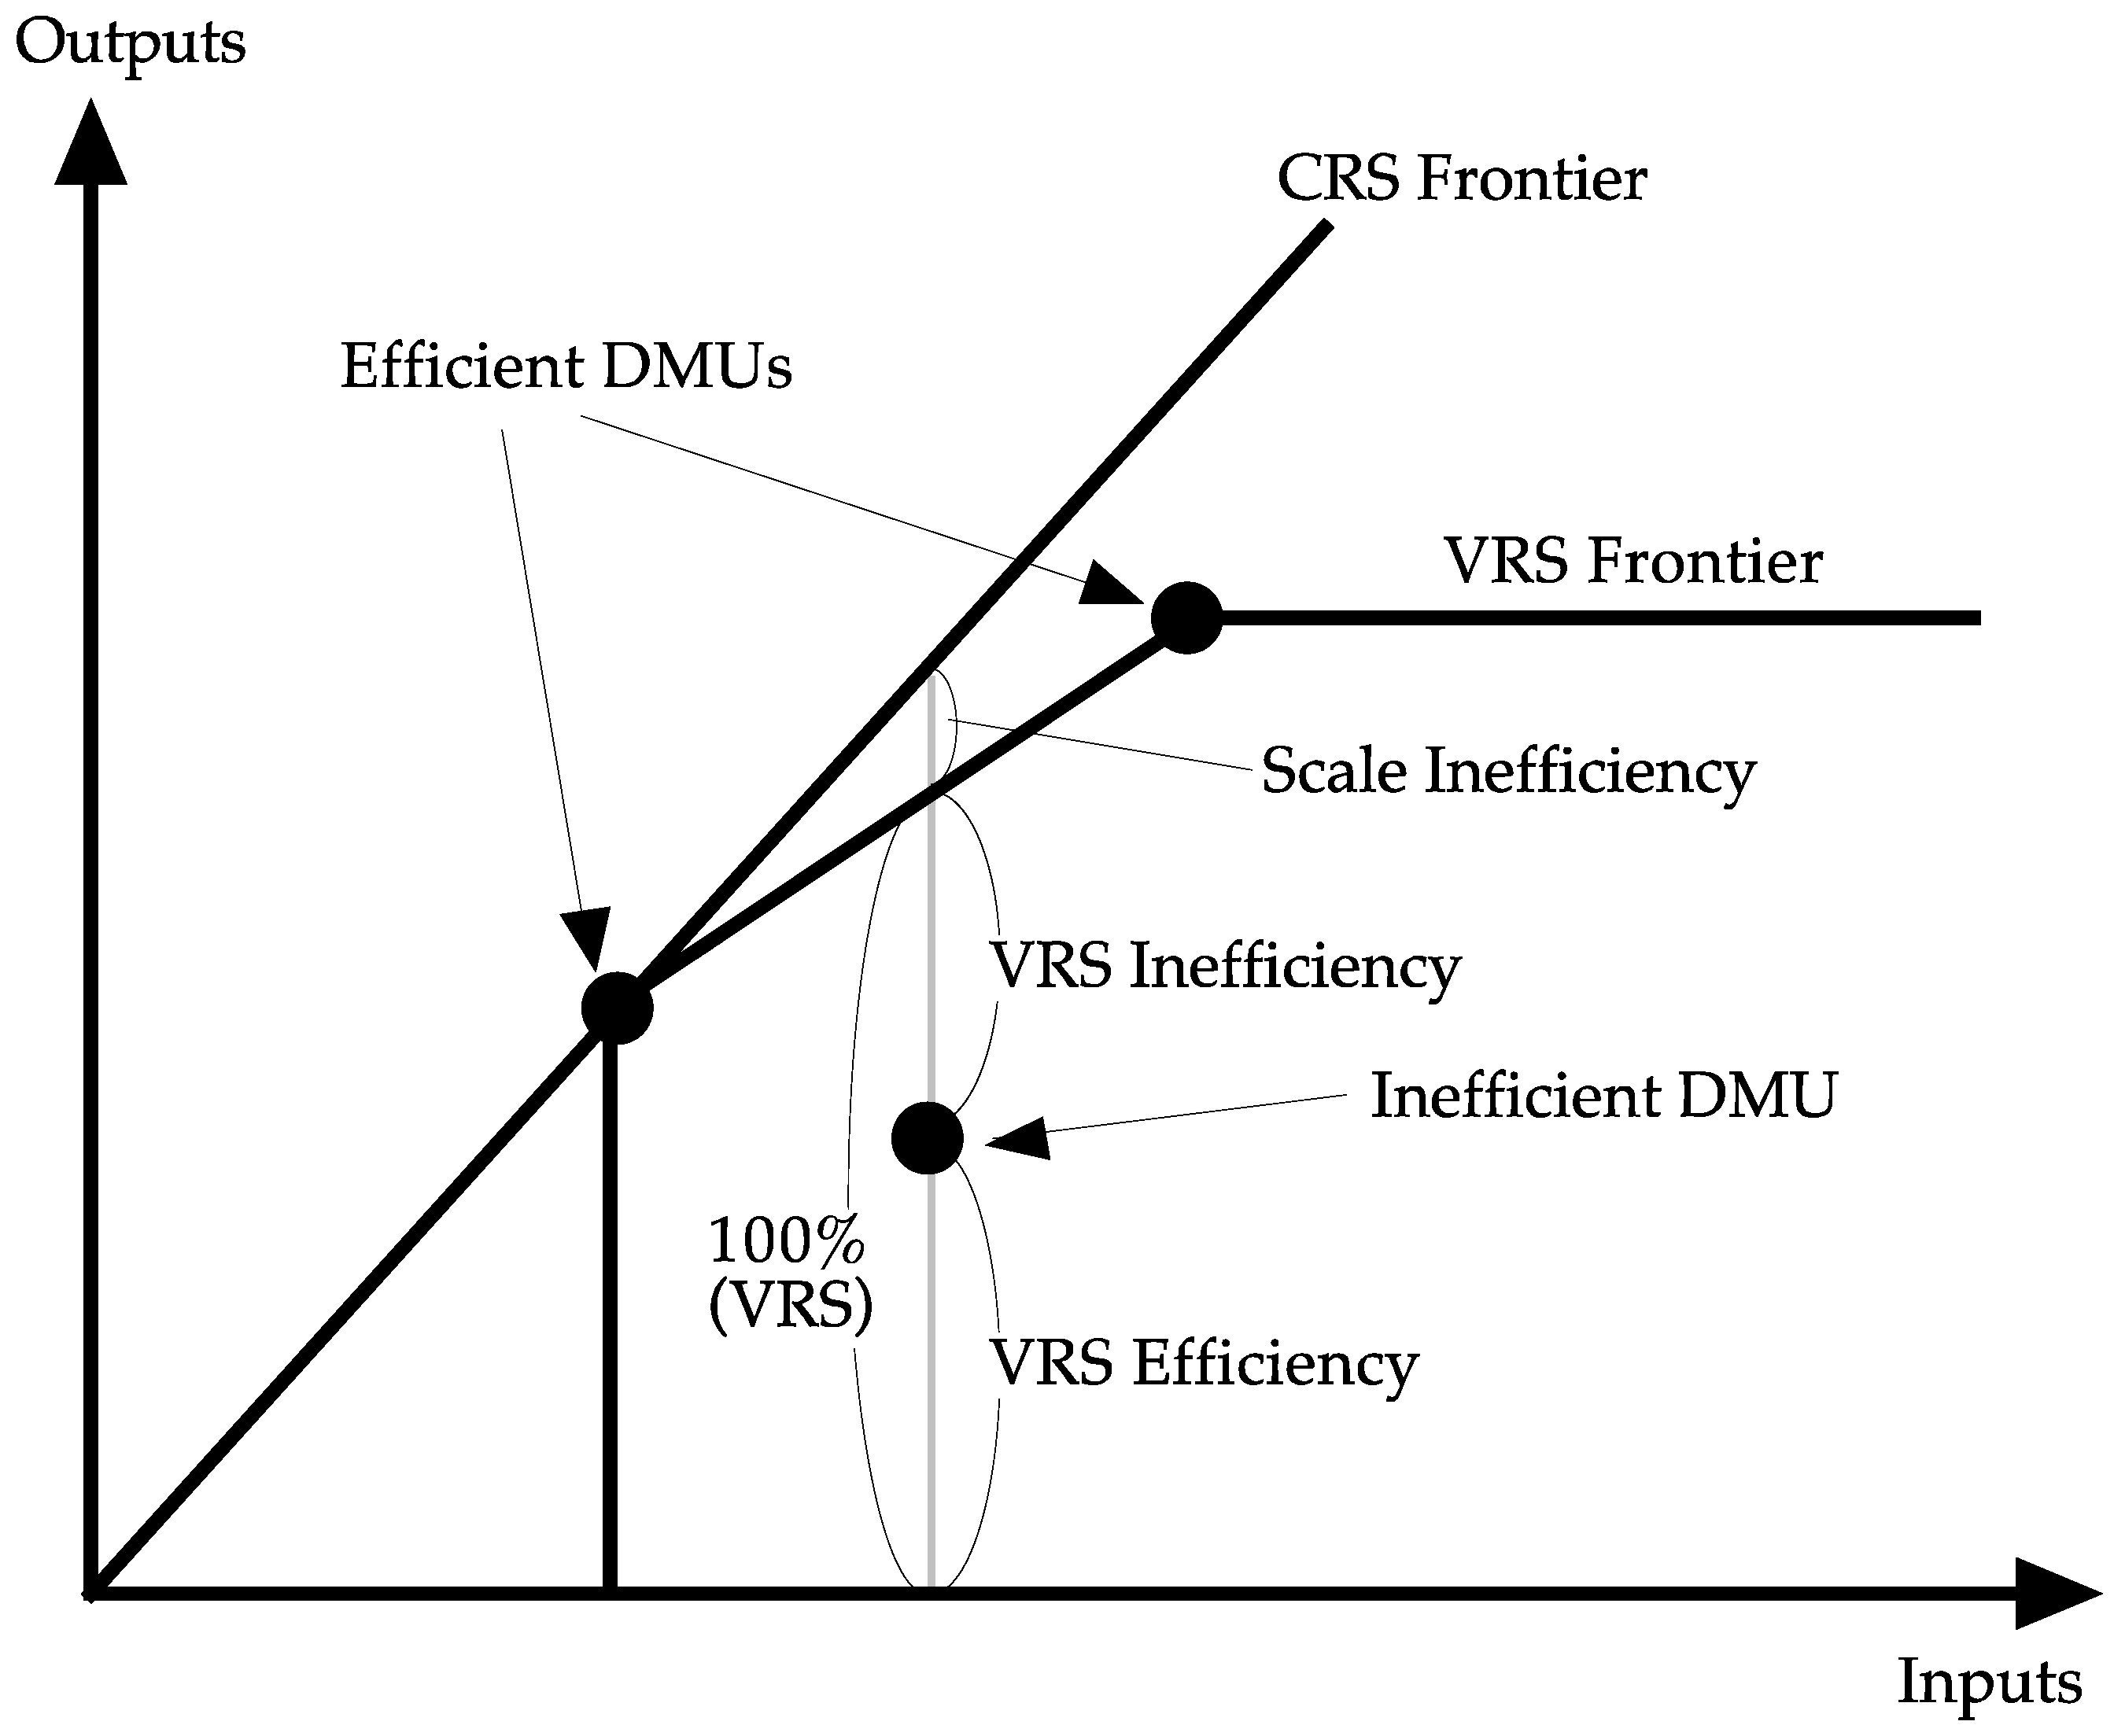
kth DMU. The last line of the problem assumes the variable-return-to-scale (VRS) of production. With respect to constant-return-to-scale (CRS) productive efficiency, such restrictions are not present. Thus, one can obtain the scale efficiency by using the ratio of the VRS efficiency.
Figure 1 illustrates the measurements of DEA efficiency scores in the case of one output and one input.
Our DMU is at the ward level, which is the smallest jurisdictional unit in Nepal, as it is the ward that makes various decisions concerning SWPS installation. Those inputs that are a part of the production technology are included as factors of production in measuring the efficiency of the production process with DEA. In our analysis, the production set spans a space of three inputs and one output, i.e., M = 3 and N = 1. The three inputs are distribution tank capacity, solar panels’ peak kilowatts, and the length of the transmission pipes, whereas the output is the total number of households serviced by the SWPS.
3.2. Social and Technical Factors that Influence the Productive Efficiency of SWPSs
We then analyzed the obtained efficiency scores, as discussed in the previous section, using Tobit regression on social and technical factors. DEA yields efficiency scores that are 100% for multiple DMUs, along with efficiency scores that are strictly below unity for inefficient ones. In other words, the observed efficiency scores are censored at one and thus require Tobit regression. We estimate the following:
Here, is the latent dependent variable; xi is the vector of independent variables including social and technical factors; and yi is the observed efficiency scores obtained in the previous section. We assume normality for the distribution of error terms (εi) and estimate using the maximum-likelihood method.
The social factors considered herein are the sum proportion of government subsidies in the total installation cost, monthly user charges per participating household, and the initial construction and installation cost per household. The technical factors include accessibility to expert advice during the planning process (as a dummy), the number of alternative water sources, and the collection tank’s capacity and its cross term with distribution tank capacity. Unlike the distribution tank, the capacity of the collection tank is defined technologically by the type and flow volume of the water source available. The cross term of the tank capacity determines whether the marginal productivity of one tank is decreasing or increasing the capacity of another, thus determining whether these two tanks are technical substitutes or complements.
5. Conclusions
In the geographically challenged mountainous hinterland of rural Nepal, basic social infrastructure (e.g., electricity, water, and education) is often lacking. These problems are intertwined with one another, and we hope that examining SWPSs will illuminate these difficult issues. However, because rural villages face tight financial and resource constraints, identifying efficient SWPS installation methods should be an important item on the policy agenda. By collecting original field data from 38 wards in all seven regions of Nepal, this paper has identified the technically efficient cases of SWPS use and investigated relevant economic policies that can enhance SWPS performance.
There are a total 1757 households across Nepal that are supplied with SWPS water in those 38 villages according to our sample. We defined the SWPS’s productive efficiency as the actual number of households that are served by the SWPS relative to the number predicted based on the size of the inputs (e.g., tank capacity, transmission pipe length, and solar panels’ peak kilowatts), and we measured its efficiency for each SWPS unit using DEA. The results indicate that inefficiency is equivalent to 1200 SWPS water supplied households, or 68% of the current number. Moreover, the inefficiency in subsidy allocation is equivalent to approximately 45% of the total subsidies spent by the government on SWPS installations.
The obtained DEA efficiency scores were then attributed to the differences in social and technical factors. On the one hand, Tobit regression results indicate that distribution and collection tanks are technically substitutive in the SWPS. On the other hand, the results suggest that abundant financial support from the government tends to be associated with the installation of inefficient systems. We also find that charging user fees is associated with fewer villagers using the SWPS. It is possible, however, that this is because of economies of scale in the maintenance of an SWPS, such that the necessary charge per household is smaller as the number of supplied households is larger, and hence, the efficiency score is relatively higher.


