
Analyzing the Effects of Spatial Interaction among City Clusters on Urban Growth—Case of Wuhan Urban Agglomeration


Abstract
:1. Introduction
2. Materials and Methods
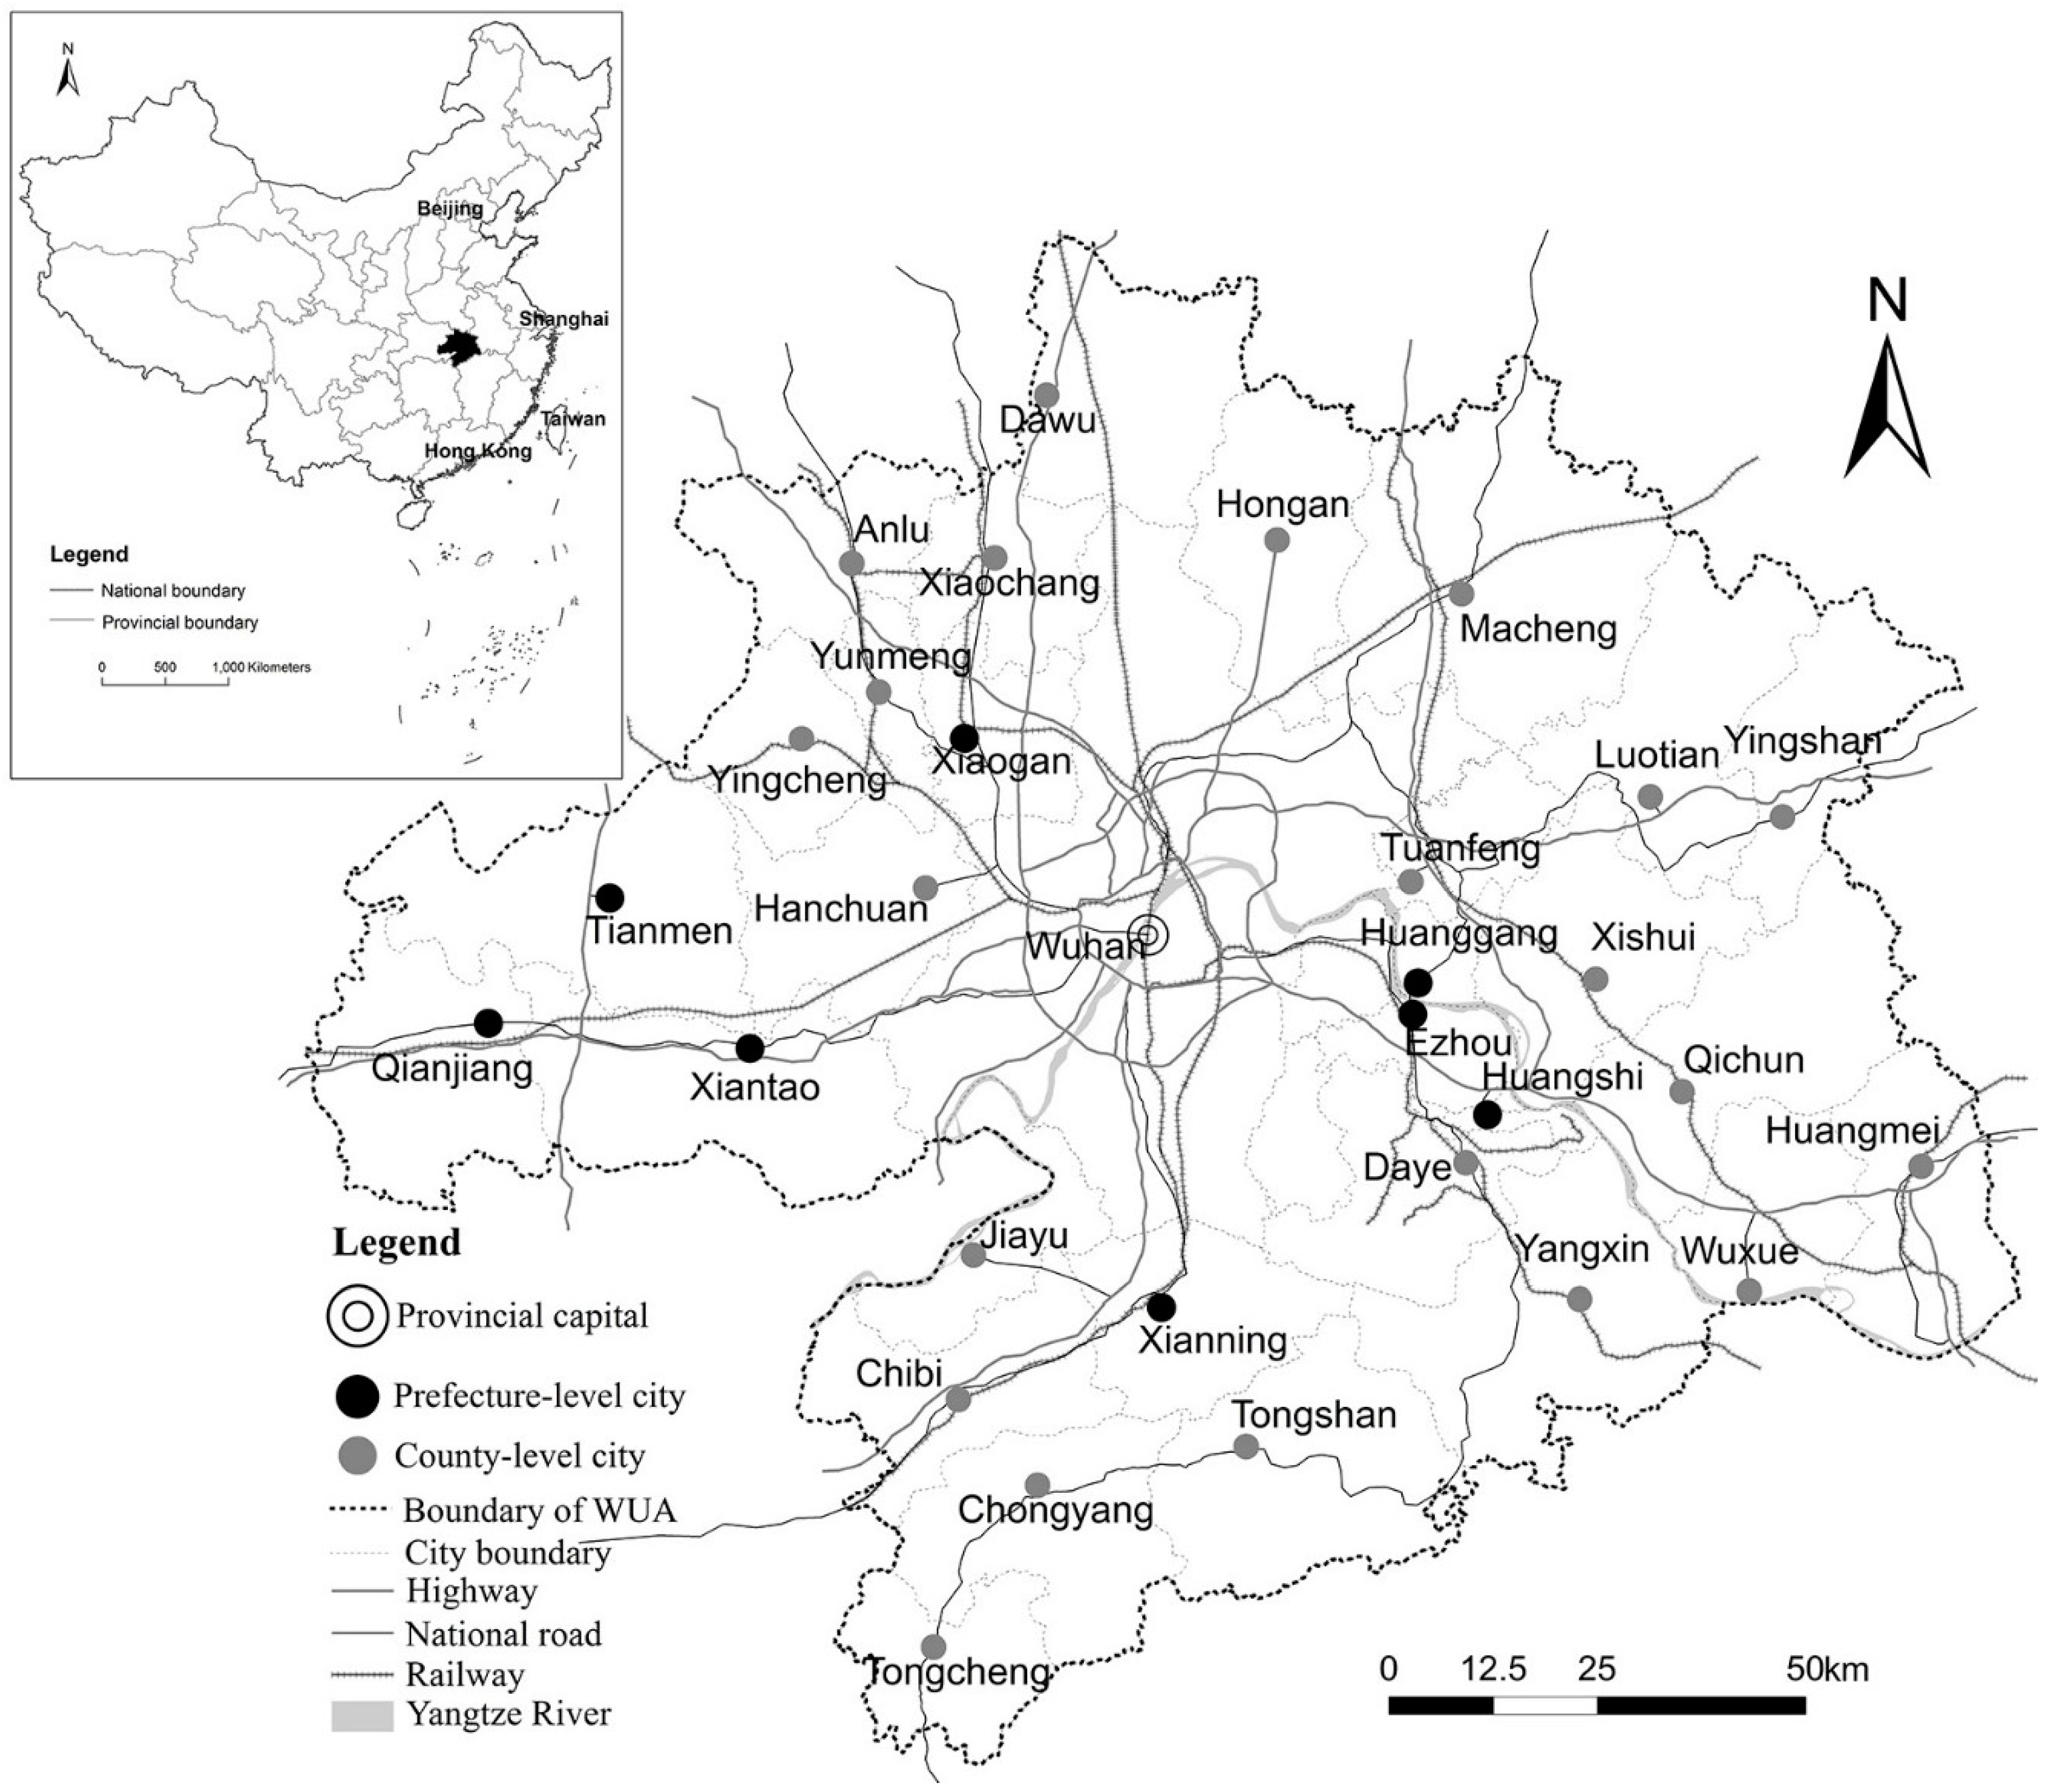
2.1. Study Area
2.2. Data Source
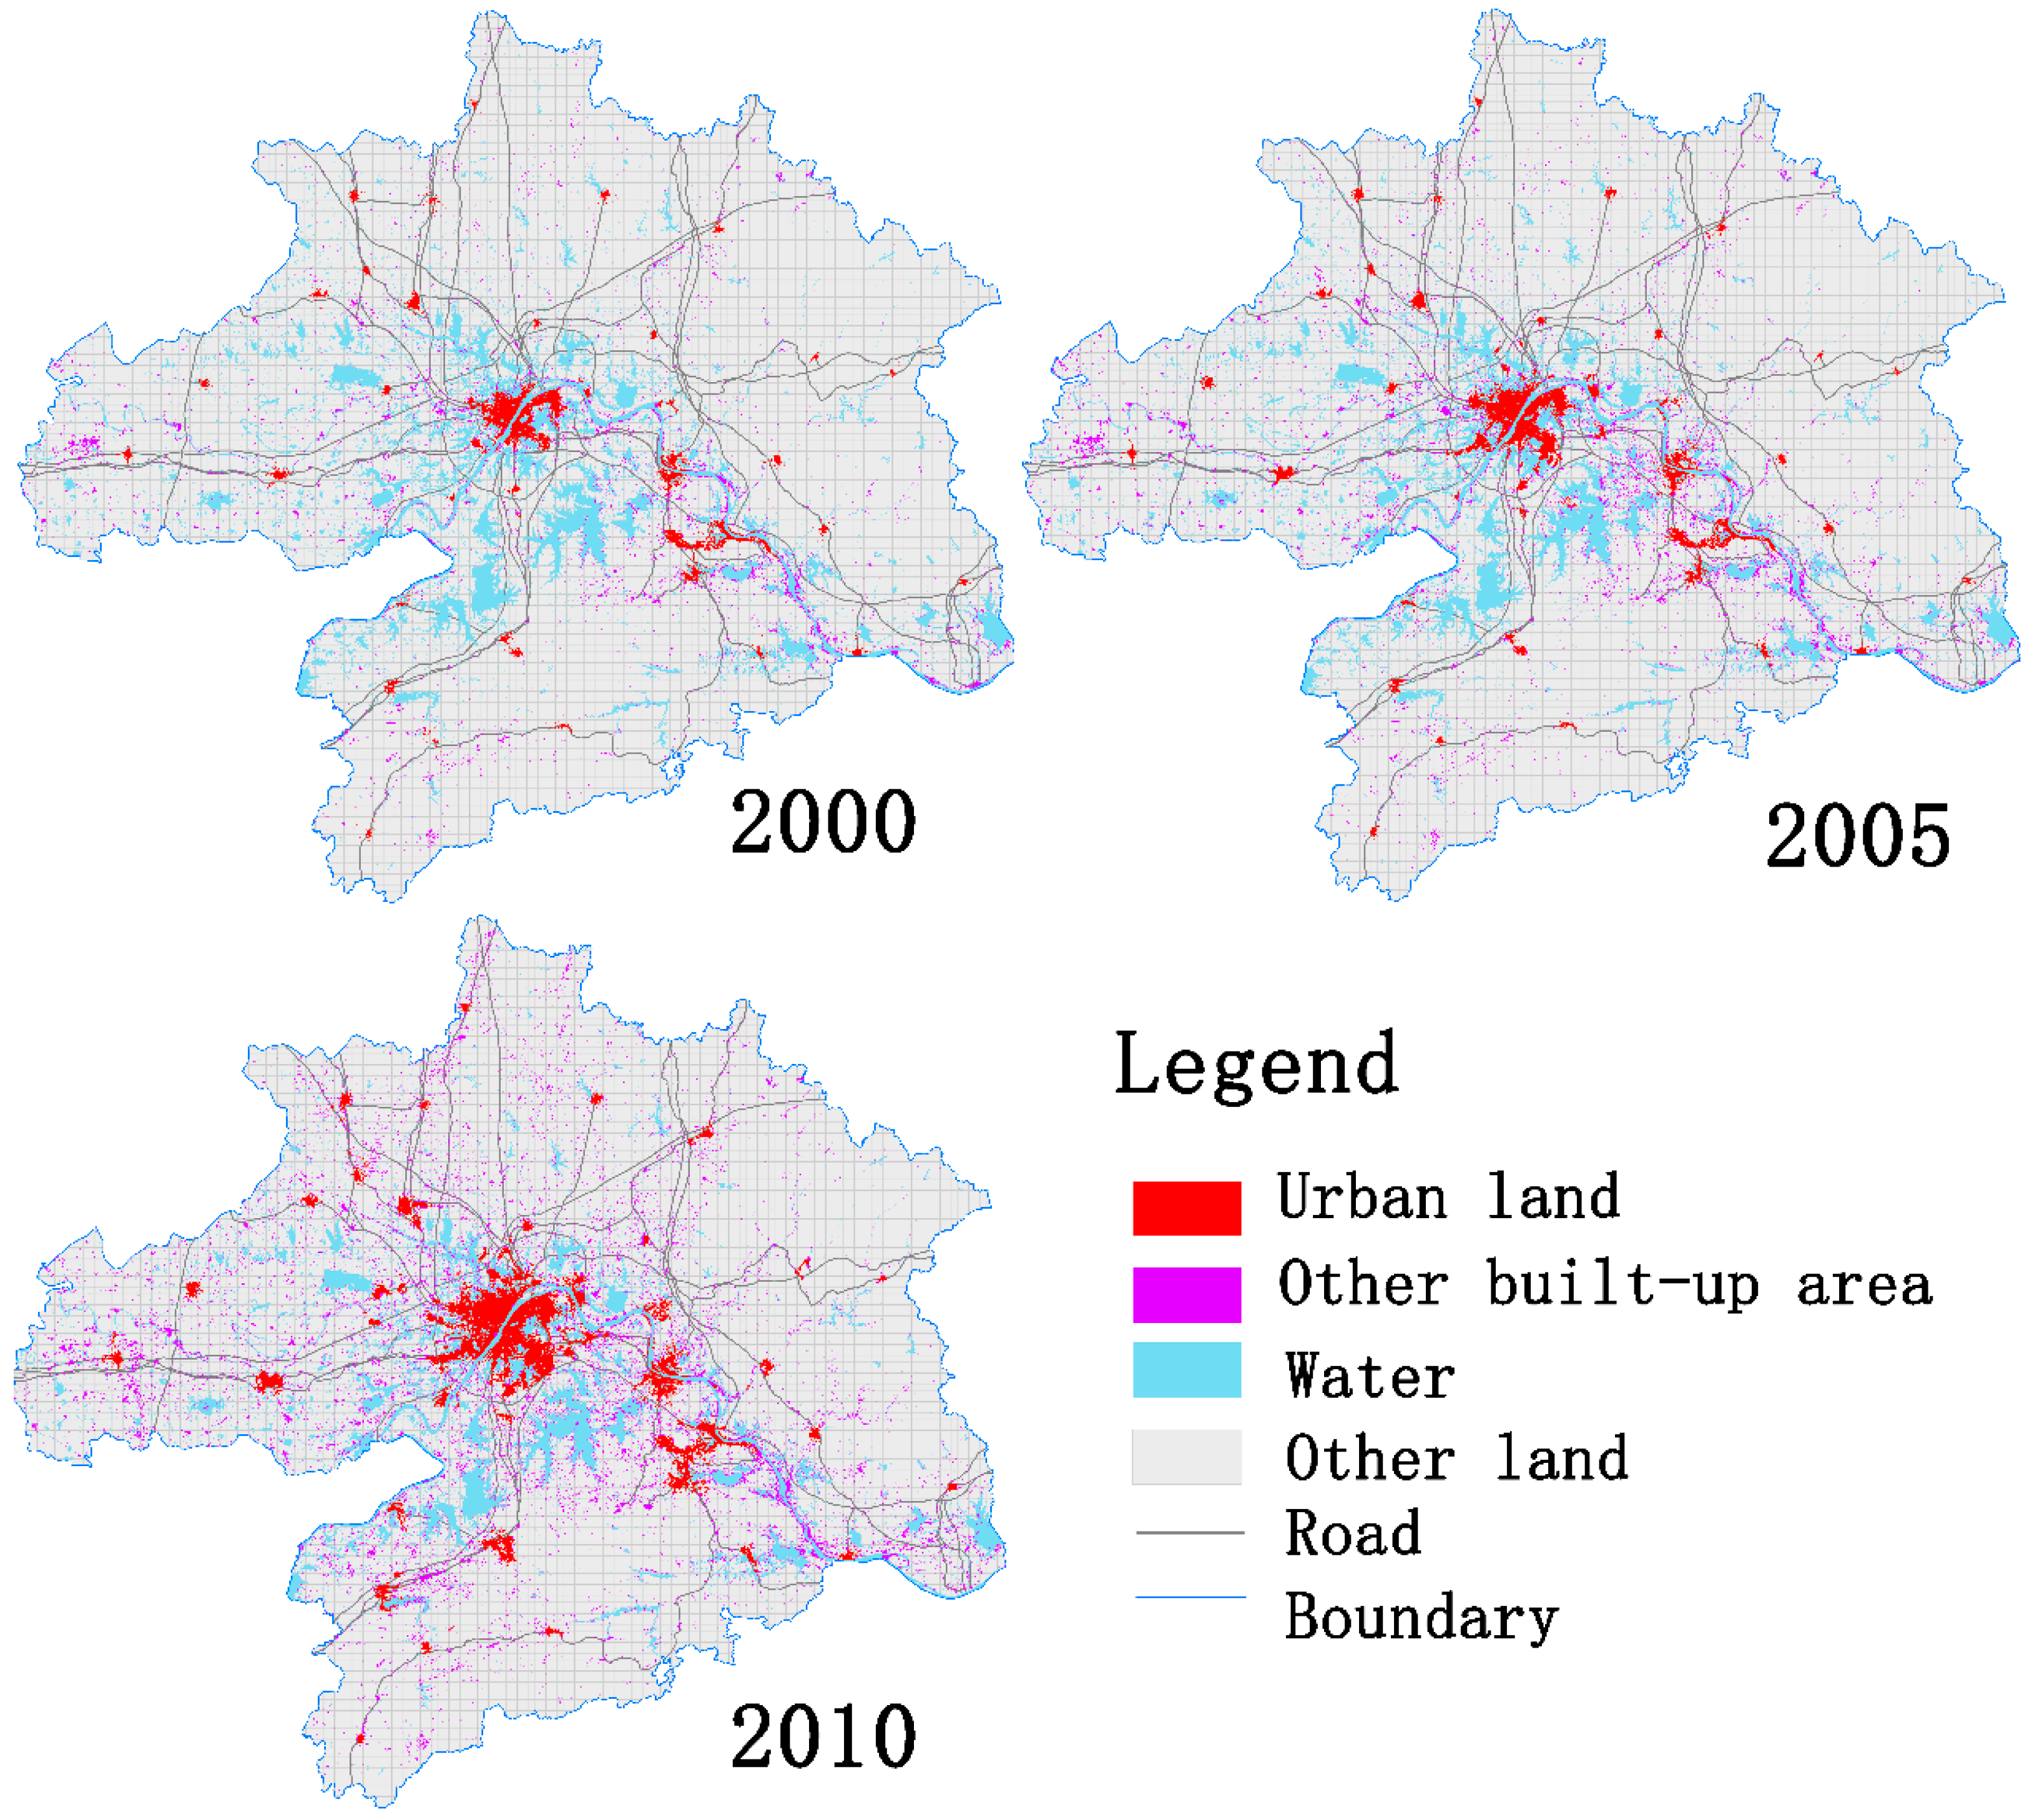
2.3. Identifying the Scope of City Region from Remote Sensing Images
2.4. Gravity Model Specification for Measuring Spatial Interaction
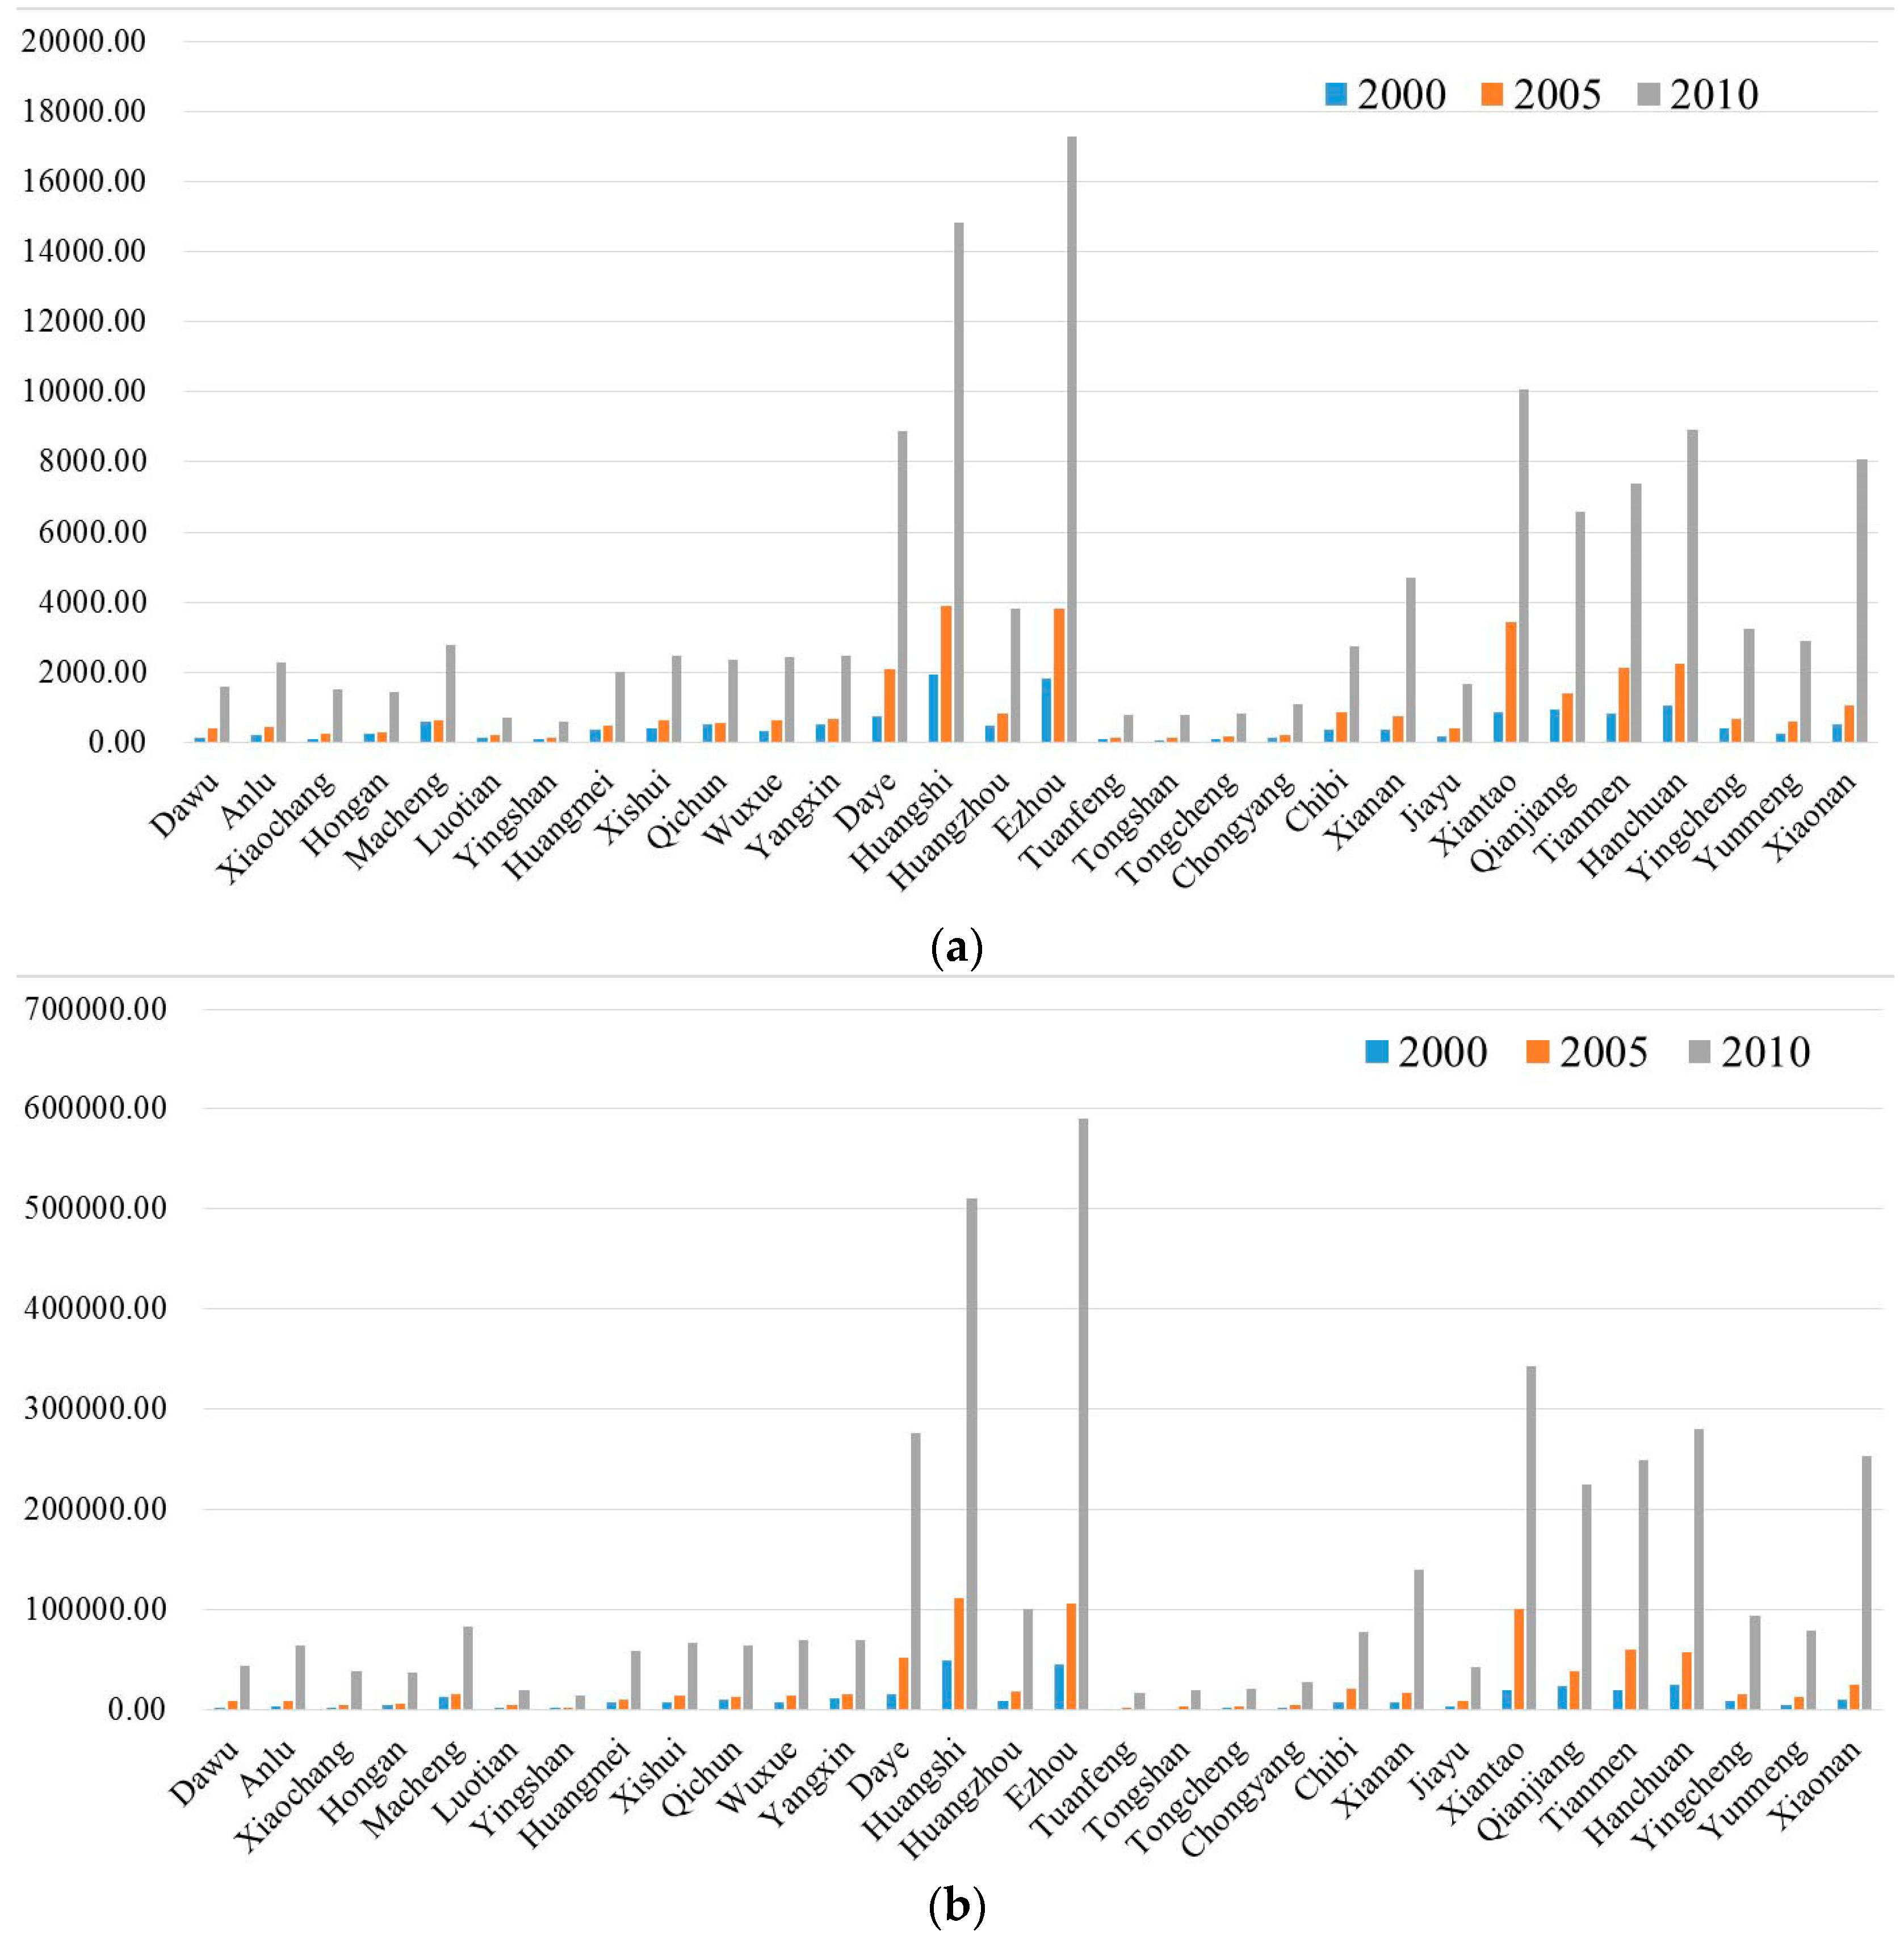
3. Results
4. Discussion
5. Conclusions
Acknowledgments
Author Contributions
Conflicts of Interest
References
- Fang, C.; Song, J.; Zhang, Q.; Ming, L.I. The formation, development and spatial heterogeneity patterns for the structures system of urban agglomerations in China. Acta Geogr. Sin. 2005, 60, 827–840. [Google Scholar]
- Haase, D.; Haase, A.; Kabisch, N.; Kabisch, S.; Rink, D. Actors and factors in land-use simulation: The challenge of urban shrinkage. Environ. Model. Softw. 2012, 35, 92–103. [Google Scholar] [CrossRef]
- Bhatta, B.; Saraswati, S.; Bandyopadhyay, D. Quantifying the degree-of-freedom, degree-of-sprawl, and degree-of-goodness of urban growth from remote sensing data. Appl. Geogr. 2010, 30, 96–111. [Google Scholar] [CrossRef]
- Fang, C.L. New structure and new trend of formation and development of urban agglomerations in China. Sci. Geogr. Sin. 2011, 31, 1025–1034. [Google Scholar]
- Ma, Y.; Xu, R. Remote sensing monitoring and driving force analysis of urban expansion in Guangzhou City, China. Habitat Int. 2010, 34, 228–235. [Google Scholar] [CrossRef]
- Dewan, A.M.; Yamaguchi, Y. Land use and land cover change in Greater Dhaka, Bangladesh: Using remote sensing to promote sustainable urbanization. Appl. Geogr. 2009, 29, 390–401. [Google Scholar] [CrossRef]
- Li, X.; Zhou, W.; Ouyang, Z. Forty years of urban expansion in Beijing: What is the relative importance of physical, socioeconomic, and neighborhood factors? Appl. Geogr. 2013, 38, 1–10. [Google Scholar] [CrossRef]
- Deng, X.; Huang, J.; Rozelle, S.; Uchida, E. Economic growth and the expansion of urban land in China. Urban Stud. 2010, 47, 813–843. [Google Scholar] [CrossRef]
- Lu, C.; Wu, Y.; Shen, Q.; Wang, H. Driving force of urban growth and regional planning: A case study of China’s Guangdong Province. Habitat Int. 2013, 40, 35–41. [Google Scholar] [CrossRef]
- Wu, K.Y.; Zhang, H. Land use dynamics, built-up land expansion patterns, and driving forces analysis of the fast-growing Hangzhou metropolitan area, eastern China. Appl. Geogr. 2012, 34, 137–145. [Google Scholar] [CrossRef]
- Zhao, K.; Zhang, A.; Li, P. Driving forces of urban construction land expansion: An empirical analysis based on panel data of provinces. J. Nat. Resour. 2011, 26, 1323–1332. [Google Scholar]
- Liao, H.; Peng, Z.; Hong, H.; Cheng, X. Research on dynamic mechanism and model of urban spatial expansion since the establishment of Chongqing Municipality. Geogr. Res. 2007, 26, 1137–1146. [Google Scholar]
- Yue, W.; Liu, Y.; Fan, P. Measuring urban sprawl and its drivers in large Chinese cities: The case of Hangzhou. Land Use Policy 2013, 31, 358–370. [Google Scholar] [CrossRef]
- Wu, H.; Jiang, J.; Zhou, J.; Zhang, H.; Zhang, L.; Ai, L. Dynamics of urban expansion in Xi’an city using Landsat TM/ETM+ data. Acta Geogr. Sin. 2005, 60, 143–150. [Google Scholar]
- Han, S. Urban expansion in contemporary China: What can we learn from a small town? Land Use Policy 2010, 27, 780–787. [Google Scholar] [CrossRef]
- Cao, Y.; Wang, J.; Ning, X. Path analyses of driving forces of urban constructive land in three gorges. China Popul. Resour. Environ. 2007, 16, 66–69. [Google Scholar]
- Luo, J.; Wei, Y.H.D. Modeling spatial variations of urban growth patterns in Chinese cities: The case of Nanjing. Landsc. Urban Plan. 2009, 91, 51–64. [Google Scholar] [CrossRef]
- Poelmans, L.; Rompaey, A.V. Detecting and modelling spatial patterns of urban sprawl in highly fragmented areas: A case study in the Flanders-Brussels region. Landsc. Urban Plan. 2009, 93, 10–19. [Google Scholar] [CrossRef]
- Tan, R.; Liu, Y.; Liu, Y.; He, Q.; Ming, L.; Tang, S. Urban growth and its determinants across the Wuhan urban agglomeration, central China. Habitat Int. 2014, 44, 268–281. [Google Scholar] [CrossRef]
- Vermeiren, K.; Rompaey, A.V.; Loopmans, M.; Serwajja, E.; Mukwaya, P. Urban growth of Kampala, Uganda: Pattern analysis and scenario development. Landsc. Urban Plan. 2012, 106, 199–206. [Google Scholar] [CrossRef]
- Zhang, Z.; Su, S.; Xiao, R.; Jiang, D.; Wu, J. Identifying determinants of urban growth from a multi-scale perspective: A case study of the urban agglomeration around Hangzhou Bay, China. Appl. Geogr. 2013, 45, 193–202. [Google Scholar] [CrossRef]
- Cheng, J.; Masser, I. Urban growth pattern modeling: A case study of Wuhan city, PR China. Landsc. Urban Plan. 2003, 62, 199–217. [Google Scholar] [CrossRef]
- Limtanakool, N.; Schwanen, T.; Dijst, M. Ranking functional urban regions: A comparison of interaction and node attribute data. Cities 2007, 24, 26–42. [Google Scholar] [CrossRef]
- Carrothers, G.A.P. An historical bedew of the gravity and potential concepts of human interaction. J. Am. Inst. Plan. 1956, 22, 94–102. [Google Scholar] [CrossRef]
- Dock, J.P.; Song, W.; Lu, J. Evaluation of dine-in restaurant location and competitiveness: Applications of gravity modeling in Jefferson County, Kentucky. Appl. Geogr. 2014, 60, 204–209. [Google Scholar] [CrossRef]
- Schuurman, N.; Berube, M.; Crooks, V.A. Measuring potential spatial access to primary health care physicians using a modified gravity model. Can. Geogr. 2010, 54, 29–45. [Google Scholar] [CrossRef]
- Wan, N.; Zhan, F.B.; Zou, B.; Chow, E. A relative spatial access assessment approach for analyzing potential spatial access to colorectal cancer services in Texas. Appl. Geogr. 2012, 32, 291–299. [Google Scholar] [CrossRef]
- He, C.; Zhao, Y.; Tian, J.; Shi, P. Modeling the urban landscape dynamics in a megalopolitan cluster area by incorporating a gravitational field model with cellular automata. Landsc. Urban Plan. 2013, 113, 78–89. [Google Scholar] [CrossRef]
- Natale, F.; Borrello, A.; Motova, A. Analysis of the determinants of international seafood trade using a gravity model. Mar. Policy 2015, 60, 98–106. [Google Scholar] [CrossRef]
- Du, N.; Ottens, H.; Sliuzas, R. Spatial impact of urban expansion on surface water bodies—A case study of Wuhan, China. Landsc. Urban Plan. 2010, 94, 175–185. [Google Scholar] [CrossRef]
- Zhou, K.; Liu, Y.; Tan, R.; Song, Y. Urban dynamics, landscape ecological security, and policy implications: A case study from the Wuhan area of central China. Cities 2014, 41, 141–153. [Google Scholar] [CrossRef]
- Hubei Statistics Bureau. Hubei Statistical Yearbook. 2015. Available online: http://www.stats-hb.gov.cn/tjgb/ndtjgb/hbs/112361.htm (accessed on 20/03/2016). (In Chinese) [Google Scholar]
- Bhatta, B.; Saraswati, S.; Bandyopadhyay, D. Urban sprawl measurement from remote sensing data. Appl. Geogr. 2010, 30, 731–740. [Google Scholar] [CrossRef]
- Hu, Y.; Wu, Z.; Xiong, W.; Pan, C. The research on the method of city proper boundary identifying—A case study of Wuhan city. City Plan. Rev. 2008, 32, 88–92. [Google Scholar]
- Xu, Q.; Hua, C. Establishing a uniform standard for calculation of urban builtup area: With Hangzhou central city zone as an example. Planners 2005, 21, 88–91. [Google Scholar]
- Congalton, R.G.; Green, K. Assessing the Accuracy of Remotely Sensed Data: Principles and Practices; CRC Press: Boca Raton, FL, USA, 2008. [Google Scholar]
- Roy, J. Spatial Interaction Modelling: A Regional Science Context, Advances in Spatial Science; Springer-Verlag: Berlin, Germany, 2004. [Google Scholar]
- Anderson, T.R. Intermetropolitan migration: A comparison of the hypotheses of Zipf and Stouffer. Am. Sociol. Rev. 1955, 20, 287–291. [Google Scholar] [CrossRef]
- Dai, T.; Li, Y. Temporal variations in parameter s of gravity model: An analysis on china’s inter-city railway passenger flows. Progr. Geogr. 2008, 27, 110–116. [Google Scholar]
- Li, S.; Wang, Z.; Zhong, Z. Gravity model for tourism spatial interaction: Basic form, parameter estimation, and applications. Acta Geogr. Sin. 2012, 67, 526–544. [Google Scholar]
- Luo, W.; Wang, F. Measures of spatial accessibility to health care in a GIS environment: Synthesis and a case study in the Chicago region. Environ. Plan. B Plan. Des. 2003, 30, 865–884. [Google Scholar] [CrossRef]
- Zheng, Q.; Dai, T.; Tao, Z.; Zhang, M. Spatial heterogeneity of gravity model parameters: A case study of inter-city railway passenger flow in China. Progr. Geogr. 2014, 33, 1659–1665. [Google Scholar]
- Shu, B.; Zhang, H.; Li, Y.; Qu, Y.; Chen, L. Spatiotemporal variation analysis of driving forces of urban land spatial expansion using logistic regression: A case study of port towns in Taicang City, China. Habitat Int. 2014, 43, 181–190. [Google Scholar] [CrossRef]
- Seto, K.C.; Kaufmann, R.K. Modeling the drivers of urban land use change in the Pearl River Delta, China: Integrating remote sensing with socioeconomic data. Land Econ. 2003, 79, 106–121. [Google Scholar] [CrossRef]
- Fragkias, M.; Seto, K.C. Evolving rank-size distributions of intra-metropolitan urban clusters in South China. Comput. Environ. Urban Syst. 2009, 33, 189–199. [Google Scholar] [CrossRef]
- Liu, X.; Wang, M. How polycentric is urban China and why? A case study of 318 cities. Landsc. Urban Plan. 2016, 151, 10–20. [Google Scholar] [CrossRef]
- Qin, B.; Han, S.S. Emerging polycentricity in Beijing: Evidence from housing price variations, 2001–2005. Urban Stud. 2013, 50, 2006–2023. [Google Scholar] [CrossRef]
- Wu, F. Polycentric urban development and land-use change in a transitional economy: The case of Guangzhou. Environ. Plan. A 1998, 30, 1077–1100. [Google Scholar] [CrossRef]
- Wen, H.; Tao, Y. Polycentric urban structure and housing price in the transitional China: Evidence from Hangzhou. Habitat Int. 2015, 46, 138–146. [Google Scholar] [CrossRef]


| Variables | Unstandardized Coefficients | Standardized Coefficients | t | Sig. | Collinearity Statistics | ||
|---|---|---|---|---|---|---|---|
| B | Std. Error | Beta | Tolerance | VIF | |||
| (Constant) | 0.128 | 0.037 | 3.408 | 0.002 | |||
| UP | −0.099 | 0.045 | −0.119 | −2.196 | 0.038 | 0.342 | 2.924 |
| PCDI | −0.035 | 0.029 | −0.048 | −1.212 | 0.237 | 0.643 | 1.555 |
| ESI | −0.107 | 0.033 | −0.138 | −3.216 | 0.004 | 0.549 | 1.822 |
| ETI | −0.139 | 0.065 | −0.134 | −2.129 | 0.043 | 0.255 | 3.920 |
| SI | 1.131 | 0.077 | 1.158 | 14.689 | 0.000 | 0.162 | 6.165 |
| Variables | Unstandardized Coefficients | Standardized Coefficients | t | Sig. | Collinearity Statistics | ||
|---|---|---|---|---|---|---|---|
| B | Std. Error | Beta | Tolerance | VIF | |||
| (Constant) | 0.000 | 0.058 | −0.007 | 0.994 | |||
| UP | −0.060 | 0.080 | −0.061 | −0.752 | 0.459 | 0.482 | 2.075 |
| PCDI | 0.090 | 0.076 | 0.094 | 1.190 | 0.246 | 0.507 | 1.974 |
| ESI | 0.147 | 0.119 | 0.131 | 1.235 | 0.229 | 0.282 | 3.540 |
| ETI | 0.014 | 0.074 | 0.016 | 0.193 | 0.848 | 0.463 | 2.161 |
| PTSR | −0.060 | 0.059 | −0.059 | −1.008 | 0.324 | 0.926 | 1.080 |
| SI | 0.848 | 0.167 | 0.822 | 5.066 | 0.000 | 0.121 | 8.273 |
| Variables | Unstandardized Coefficients | Standardized Coefficients | t | Sig. | Collinearity Statistics | ||
|---|---|---|---|---|---|---|---|
| B | Std. Error | Beta | Tolerance | VIF | |||
| (Constant) | 0.131 | 0.038 | 3.433 | 0.002 | |||
| UP | −0.086 | 0.045 | −0.103 | −1.908 | 0.068 | 0.351 | 2.847 |
| PCDI | −0.031 | 0.029 | −0.042 | −1.048 | 0.305 | 0.649 | 1.540 |
| ESI | −0.113 | 0.034 | −0.146 | −3.355 | 0.003 | 0.545 | 1.835 |
| ETI | −0.142 | 0.066 | −0.136 | −2.133 | 0.043 | 0.254 | 3.936 |
| SI | 1.114 | 0.077 | 1.143 | 14.498 | 0.000 | 0.166 | 6.020 |
| Variables | Unstandardized Coefficients | Standardized Coefficients | t | Sig. | Collinearity Statistics | ||
|---|---|---|---|---|---|---|---|
| B | Std. Error | Beta | Tolerance | VIF | |||
| (Constant) | −0.009 | 0.058 | −0.155 | 0.878 | |||
| UP | −0.049 | 0.081 | −0.050 | −0.606 | 0.550 | 0.491 | 2.038 |
| PCDI | 0.100 | 0.077 | 0.105 | 1.310 | 0.203 | 0.514 | 1.945 |
| ESI | 0.160 | 0.120 | 0.143 | 1.331 | 0.196 | 0.286 | 3.494 |
| ETI | 0.023 | 0.075 | 0.025 | 0.301 | 0.766 | 0.469 | 2.133 |
| PTSR | −0.060 | 0.060 | −0.060 | −1.002 | 0.326 | 0.923 | 1.083 |
| SI | 0.812 | 0.167 | 0.789 | 4.874 | 0.000 | 0.126 | 7.924 |
| α = β = 0.7, λ = 0.71 | α = β = 0.8, λ = 0.61 | |||
|---|---|---|---|---|
| 2000–2005 | 2005–2010 | 2000–2005 | 2005–2010 | |
| Without SI | −142.42 | −151.26 | −142.42 | −151.26 |
| With SI | −210.07 | −171.94 | −210.07 | −170.75 |
© 2016 by the authors; licensee MDPI, Basel, Switzerland. This article is an open access article distributed under the terms and conditions of the Creative Commons Attribution (CC-BY) license (http://creativecommons.org/licenses/by/4.0/).
Share and Cite
Tan, R.; Zhou, K.; He, Q.; Xu, H. Analyzing the Effects of Spatial Interaction among City Clusters on Urban Growth—Case of Wuhan Urban Agglomeration. Sustainability 2016, 8, 759. https://doi.org/10.3390/su8080759
Tan R, Zhou K, He Q, Xu H. Analyzing the Effects of Spatial Interaction among City Clusters on Urban Growth—Case of Wuhan Urban Agglomeration. Sustainability. 2016; 8(8):759. https://doi.org/10.3390/su8080759
Chicago/Turabian StyleTan, Ronghui, Kehao Zhou, Qingsong He, and Hengzhou Xu. 2016. "Analyzing the Effects of Spatial Interaction among City Clusters on Urban Growth—Case of Wuhan Urban Agglomeration" Sustainability 8, no. 8: 759. https://doi.org/10.3390/su8080759
APA StyleTan, R., Zhou, K., He, Q., & Xu, H. (2016). Analyzing the Effects of Spatial Interaction among City Clusters on Urban Growth—Case of Wuhan Urban Agglomeration. Sustainability, 8(8), 759. https://doi.org/10.3390/su8080759