
Conceptual Framework for the Development of an Indicator System for the Assessment of Regional Land Subsidence Disaster Vulnerability


Abstract
:1. Introduction
2. Land Subsidence Vulnerability
2.1. The Concept of Vulnerability
2.2. The Concept of Disaster Vulnerability
- (1)
- The possible loss or loss degree of an element at risk is stressed without considering the capacity of disaster prevention and alleviation. The correlation between disaster vulnerability and the physical exposure of the element at risk is investigated in this category. It indicates that the vulnerability will be influenced by outside activities–especially human interactions.
- (2)
- The essential characteristics, status or sensitivity of being vulnerable to disaster for elements at risk are emphasized. In this category, disaster vulnerability is considered a systematic dynamic property. It changes with the natural environment and social-economic conditions.
2.3. The Concept of Land Subsidence Disaster Vulnerability
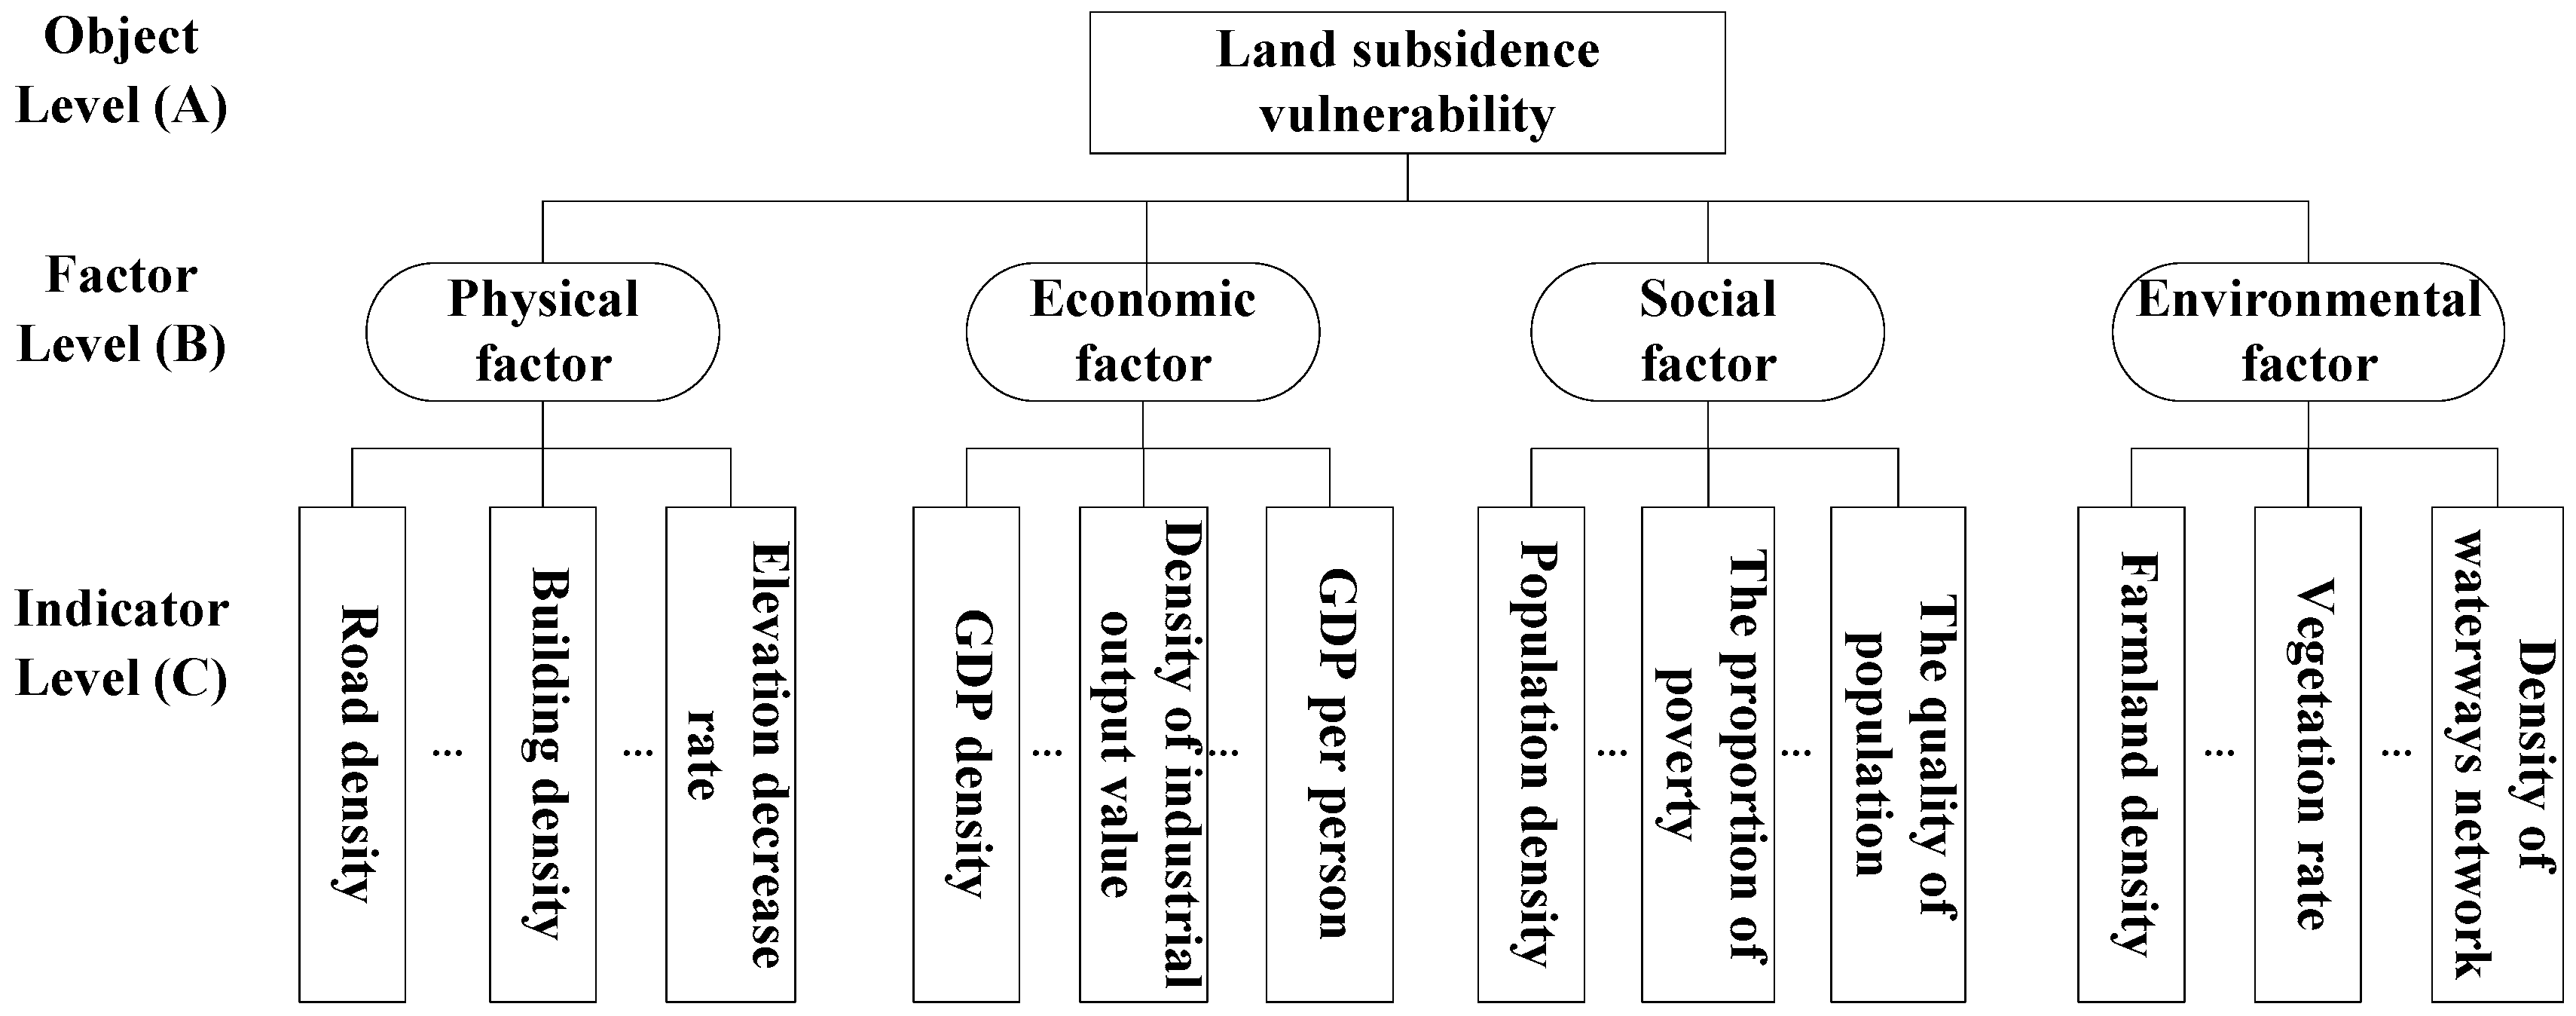
3. Analytical Framework
3.1. Factor Identification
- (1)
- Physical factor: mainly assesses the sensitivity of architecture, infrastructure, and lifeline projects.
- (2)
- Social factor: emphasizes the effect of land subsidence disaster on human life and production or the response capacity of human power to land subsidence disaster. This factor generally assesses population density, population composition, poverty degree, and the situation of education.
- (3)
- Economic factor: mainly indicates the sensitivity of the economic system to land subsidence disaster and refers to the production link, distribution link, and consumption link. Generally, this factor can be characterized by the gross domestic product (GDP).
- (4)
- Environmental factor: describes the sensitivity of the eco-environment to land subsidence disaster, where land resources are deemed as the main indicator type in most research.
3.2. Indicator Selection
3.2.1. The Criteria of Indicator Selection
- (1)
- The principle of operability: The selected indicators should be the most sensitive and easily expressed. They should represent the main idea of coordinating the development of physical, human, social, economic, and eco-environmental systems. Furthermore, the connotation, dimension, and transformation of each indicator should be clear, all of the indicator data should be easily accessible and comparable, and the dimensions of all the normalized indicators should be accordant.
- (2)
- The principle of measurability: As mentioned above, the land subsidence disaster vulnerability is defined as a composite system of physics, society, economy, and environment. Compared to qualitative analysis, quantitative analysis is more intuitive. It can reflect the regional land subsidence disaster vulnerability situations. It also can describe the physical, social, economic, and environmental sub-systems in a certain area at risk. Based on the quantitative analysis results, the early warning can be made and preventive measures can be taken. Therefore, the metrizability of selected indicators is an important criterion.
- (3)
- The principle of completeness: The indicator system created should systematically and completely express the complex land subsidence disaster vulnerability system. It should also demonstrate the regional land subsidence disaster vulnerability situation hierarchically.
- (4)
- The principle of validity: Each selected indicator should be independent. In the screening process, if two or more indicators refer to similar or overlapping aspects of the regional land subsidence disaster vulnerability system, only one indicator can be selected.
3.2.2. The Framework of the Indicator System
- (1)
- Evaluation: the system can be used to reasonably and comprehensively assess the land subsidence disaster vulnerability in the area at risk by combining the processes of weight and aggregation.
- (2)
- Verification and prediction: based on the spatial and temporal flexibility of the proposed indicator system, the past, current or future land subsidence disaster vulnerability level in a certain area at risk can be assessed by aggregating the determined indicator system. The assessed level can be used to review, scan, or forecast the regional land subsidence disaster vulnerability situation.
- (3)
- Comparability: it is feasible to compare the land subsidence disaster vulnerability levels for different areas at risk or for different time intervals. The comparison results can reveal the spatial distribution and time-variation of land subsidence disaster vulnerability levels.
- (4)
- Decision support: comparing the land subsidence disaster vulnerability levels in different areas at risk or in different time intervals has contributed to the land subsidence disaster risk zoning, further layout, and risk prevention, and alleviation plan-making. An integrated assessment result, in terms of vulnerability level, is obtained by determining the indicator system, then collecting and analyzing the indicator data, and finally by weighing and aggregating all indicators and factors in the indicator system on a level-by-level evidence. The results can be used by decision-makers and risk managers to formulate corresponding programs, both short and long-term, for land subsidence disaster risk prevention and alleviation. As the results can also be used to arrange the sustainable development of nature, economy, society and environment.
- (1)
- possible causal chains and how to recognize them;
- (2)
- assessment of uncertainties;
- (3)
- how to address eventual data inhomogeneity; and
- (4)
- list of indicators of the same type.
3.2.3. The Analysis of Indicator Data
4. Case Study
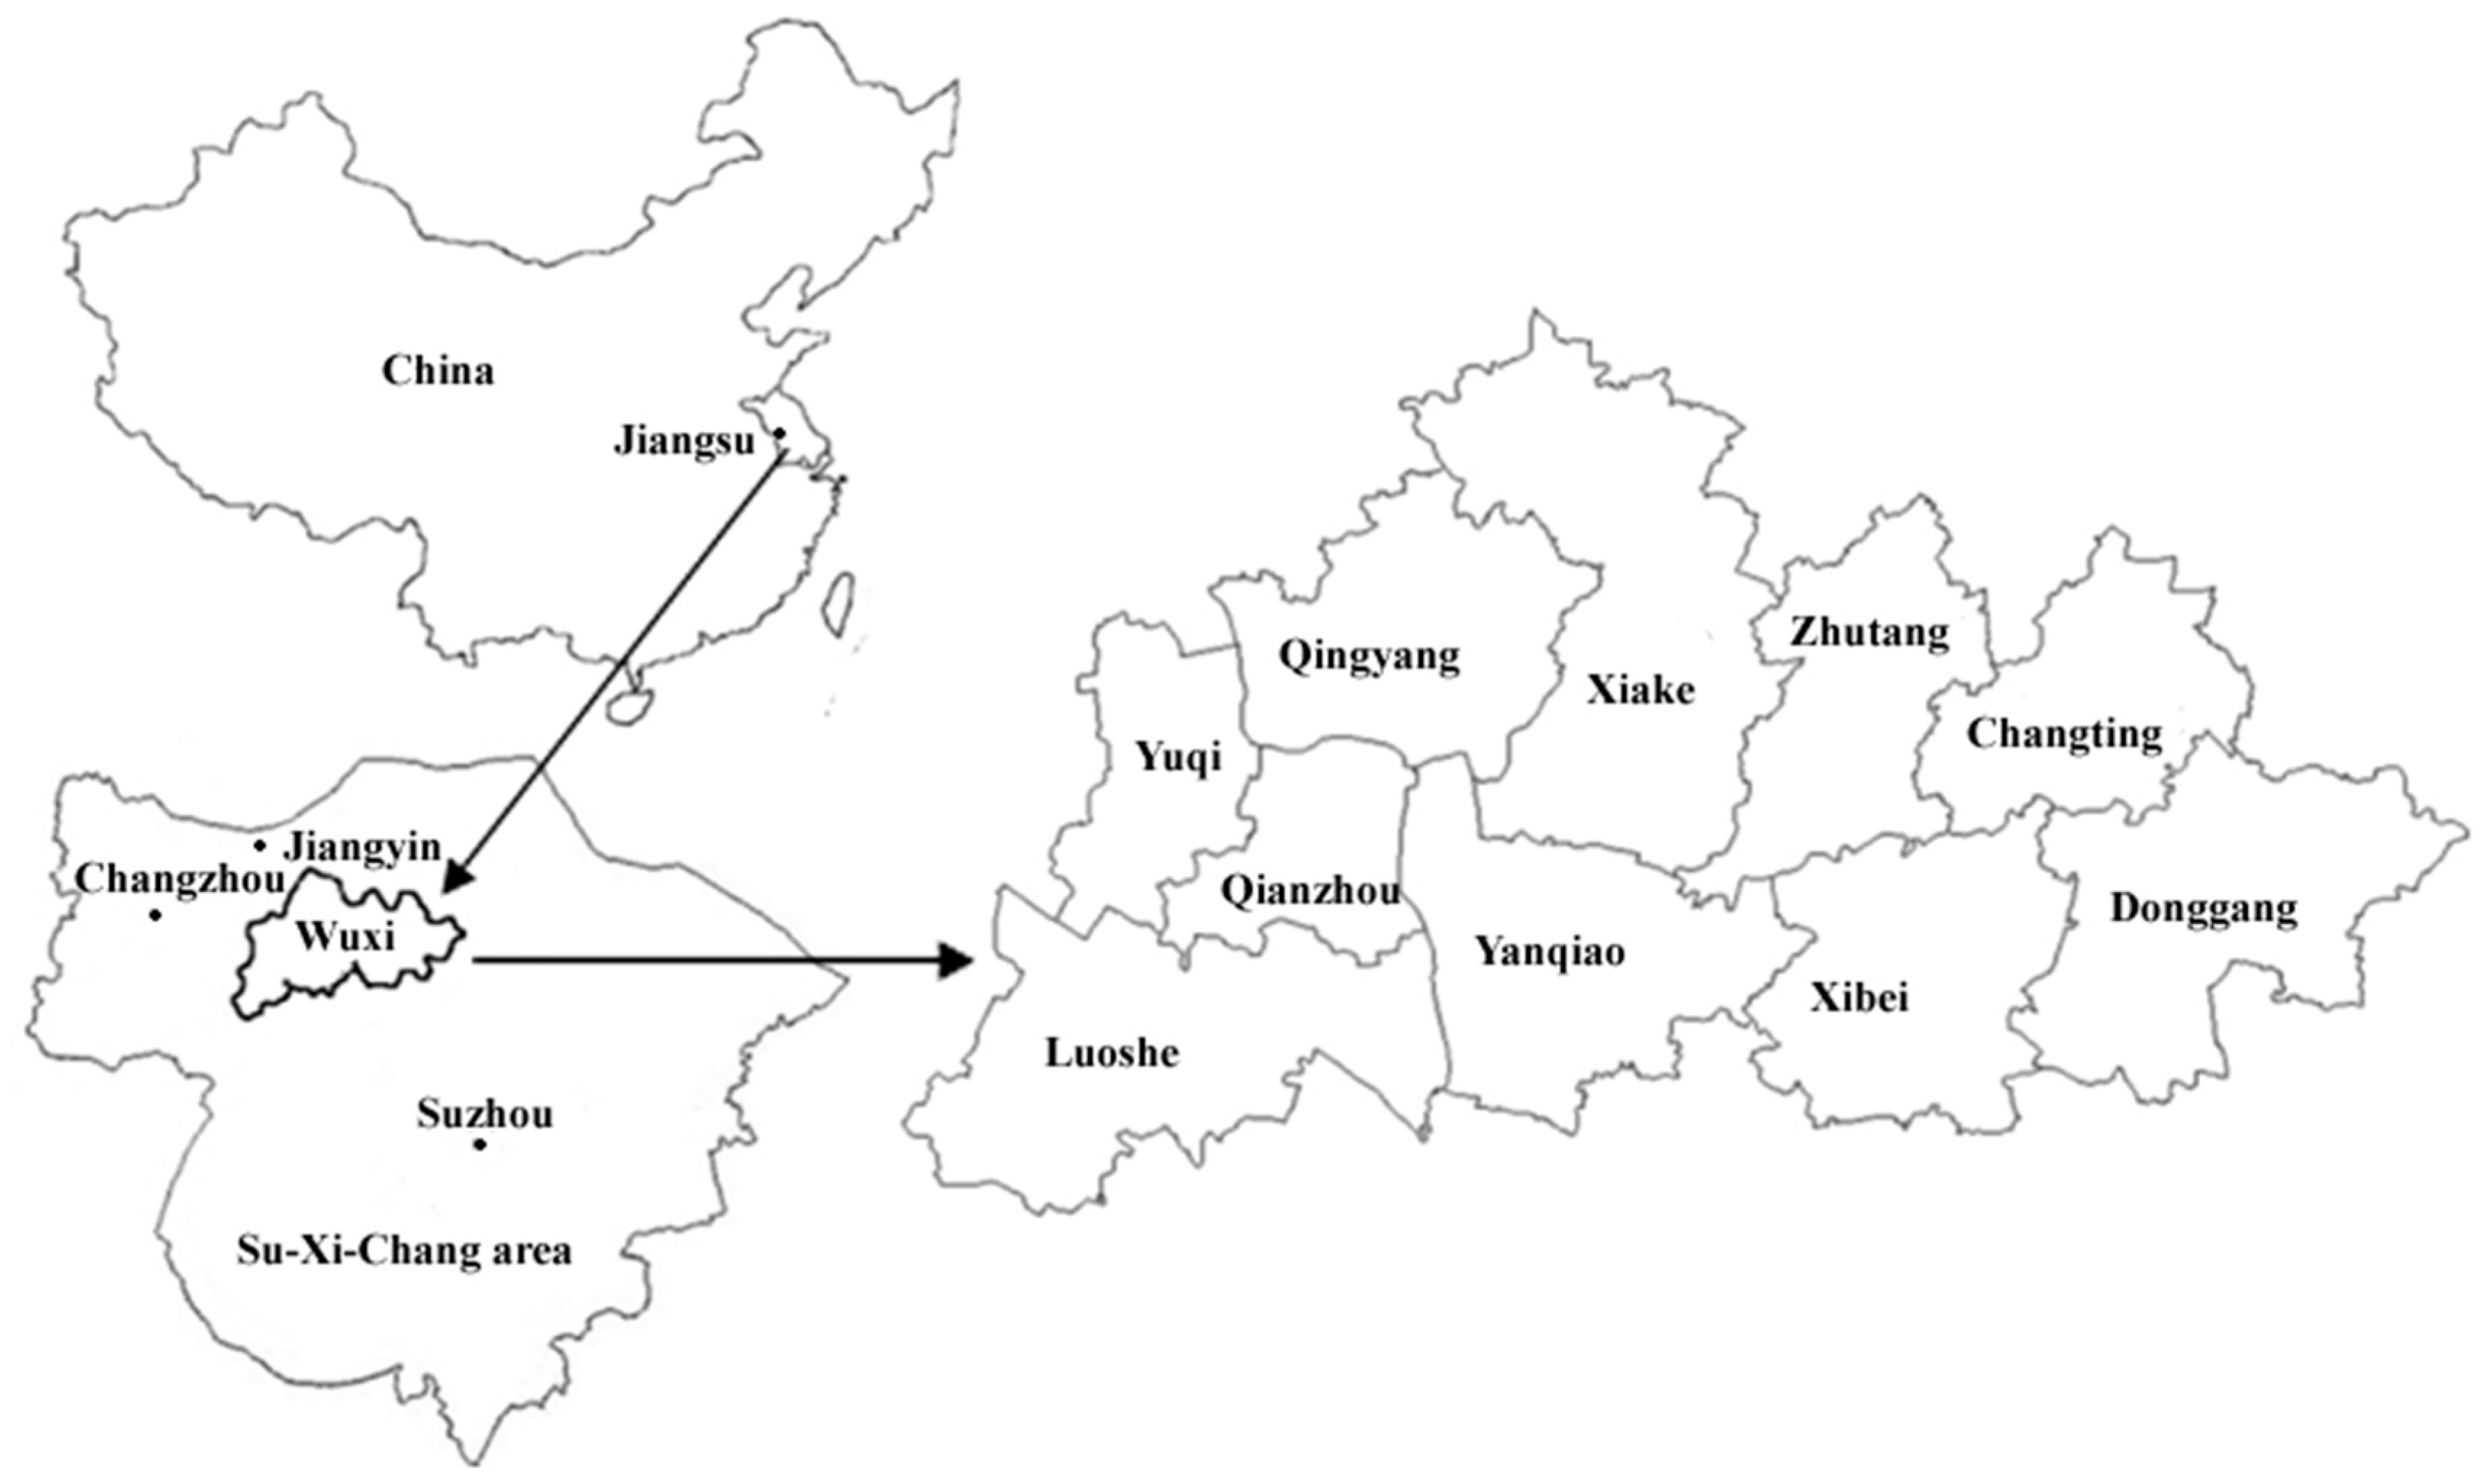
4.1. The Study Area
4.2. The Indicator Selection
- (1)
- Causal relationship: A causal relationship appears in terms of different causal forms, such as one result-multiple causes, one cause-multiple results, and multiple causes-multiple results. The causal relationship between indicators can be identified in terms of the mechanism of interaction between indicators and the chronological order of the compared indicators. For example, there is a certain causal relationship between the density of industrial production, the density of agricultural production, and GDP density: the greater the densities of industrial production and agricultural production, the greater the GDP density. There is also a causal relationship between the proportion of non-agricultural population, the proportion of poverty, and population quality: the larger the agricultural population and poverty population, the lower the population quality.
- (2)
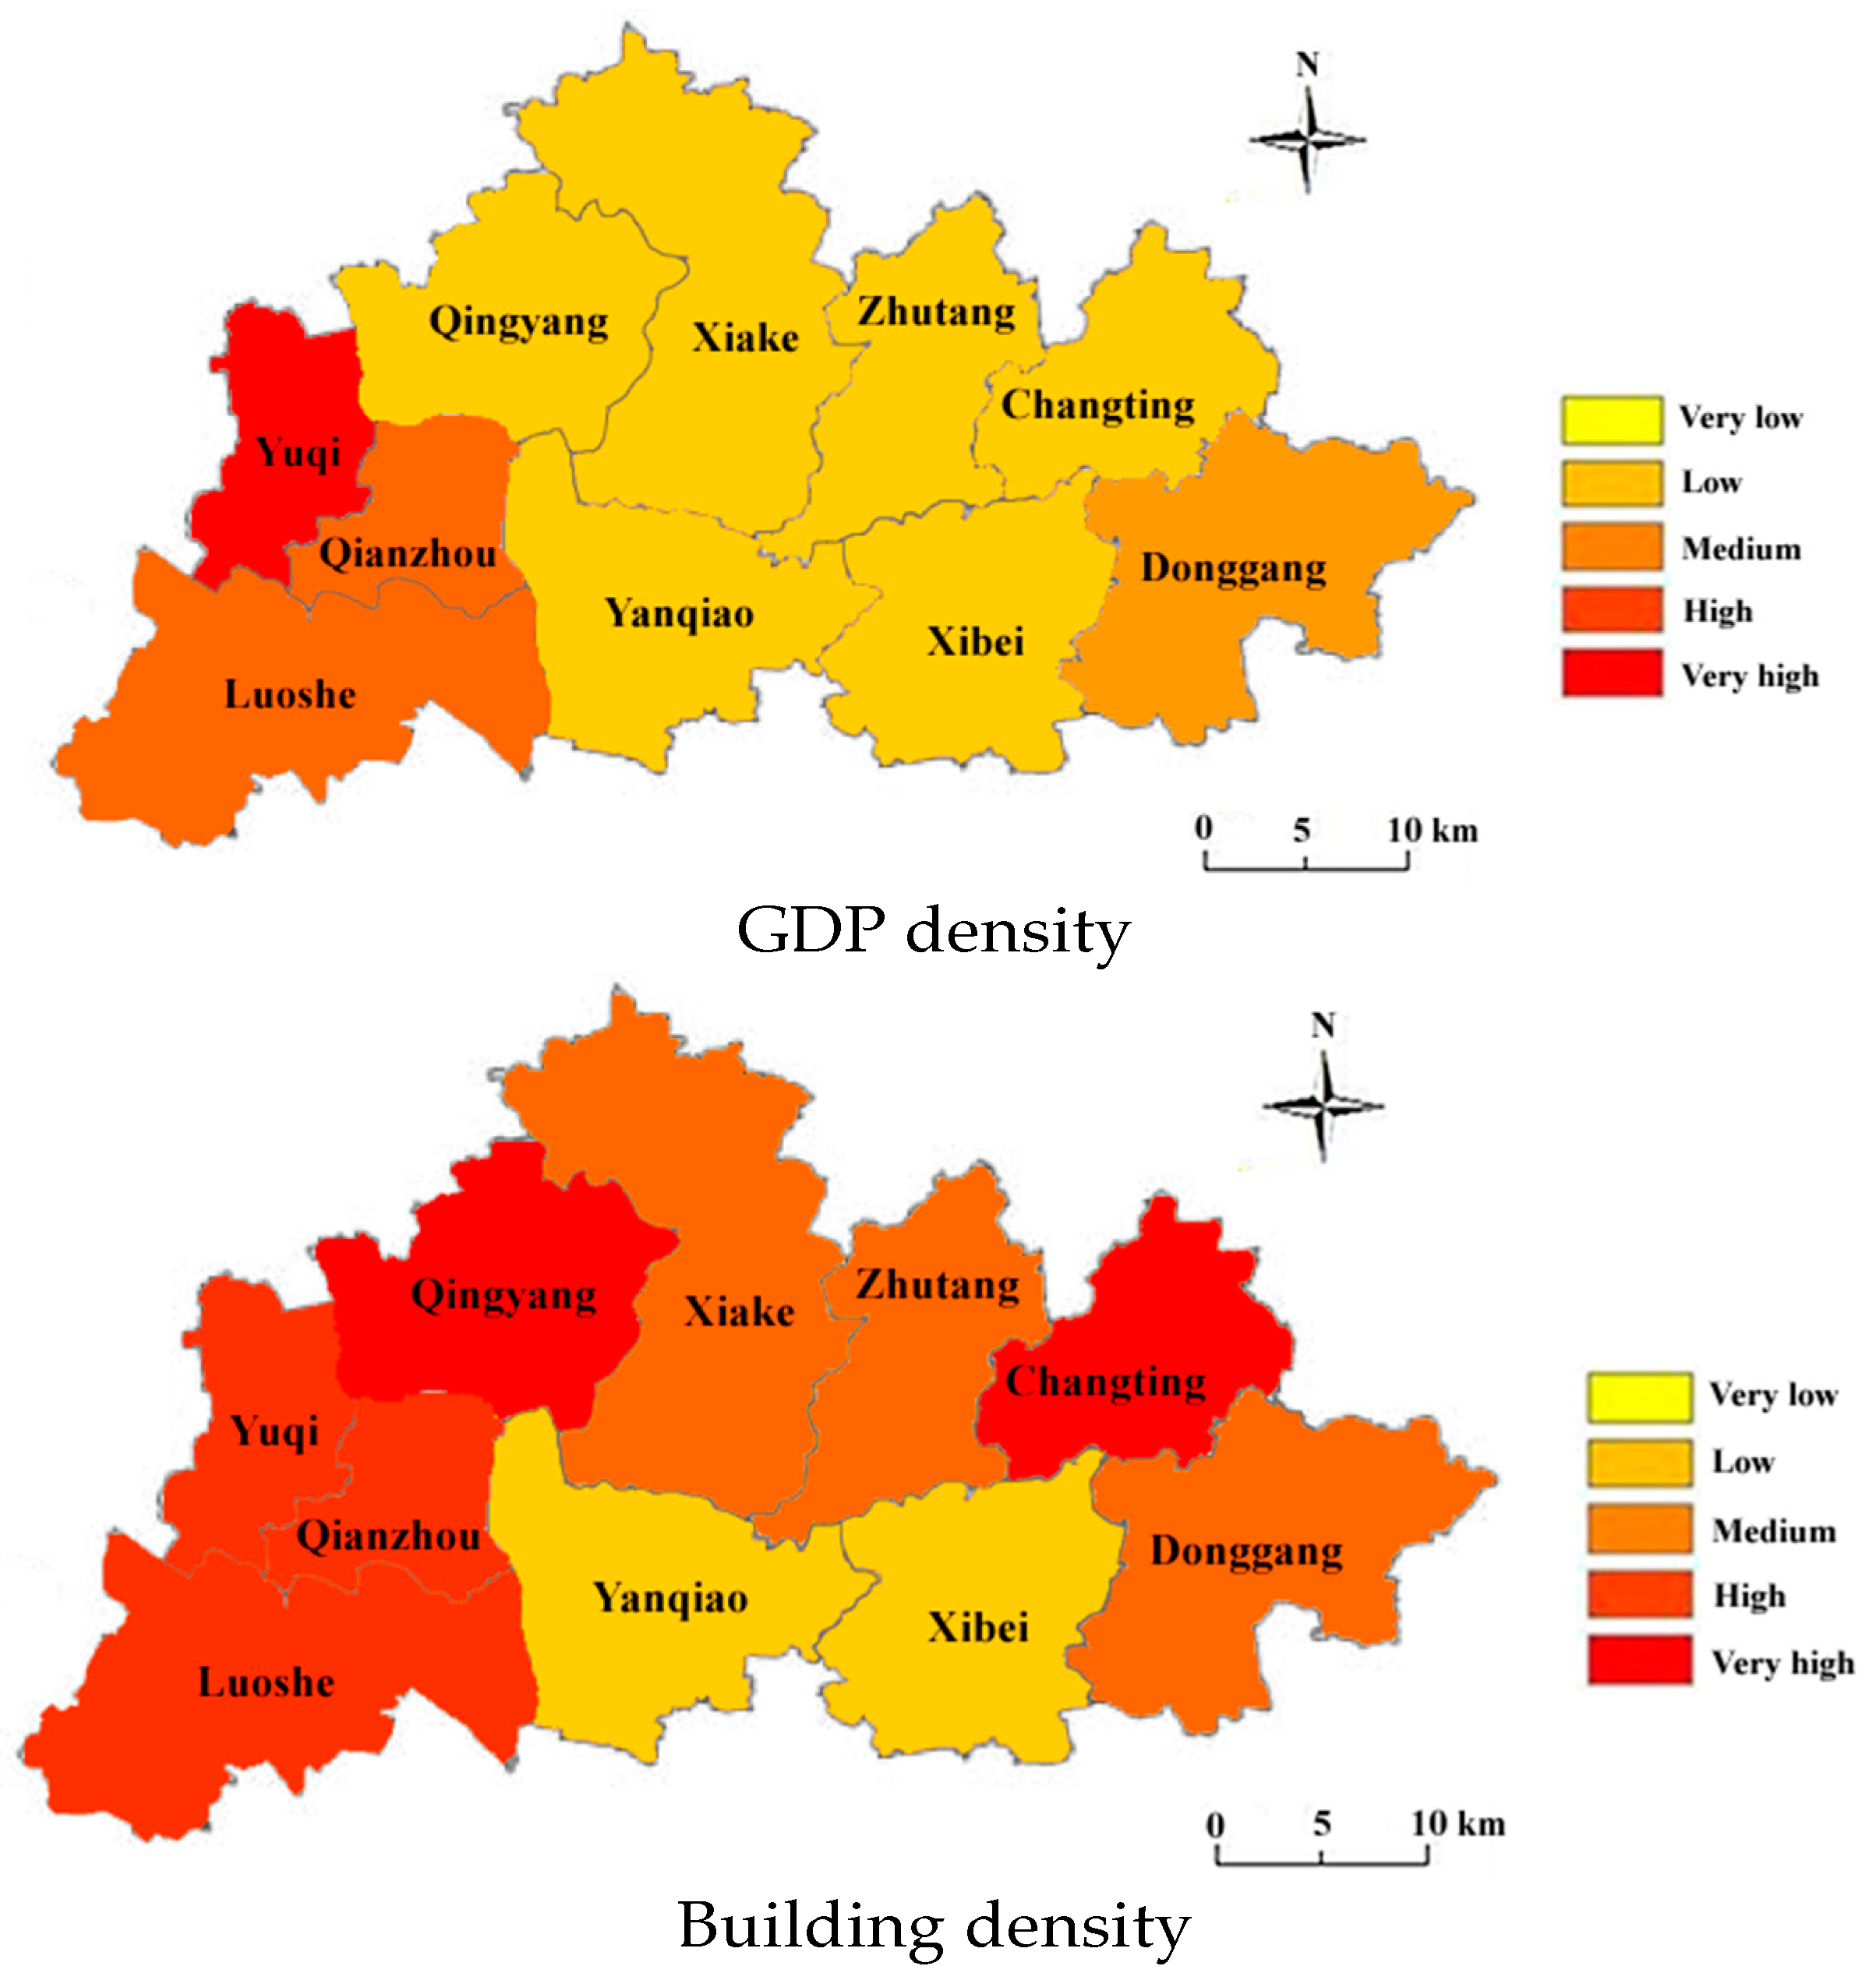
- Equivalent relationship: The relationships between indicators of the same type are basically or completely equivalent. For these indicators with equivalent relationships, only one indicator needs to be chosen. For instance, the development level of a regional macro-economy is affected by many fields with various development trends, whereas GDP is the most cognizable indicator for measuring and comparing regional economic development levels. Specifically, GDP density, GDP per person, and the annual growth rate of GDP are all key indicators for measuring the level of economic sustainable development of the same kind. Thus, it is sufficient to choose only one of these three indicators. For different study areas, the selected indicators based on indicator selection criteria are different due to various reasons, including the availability of statistical information and the specificity of the studied area at risk. GDP per person is usually used to measure a region's standard of living and the situation of economic development. It can be used as a fundamental indicator of economic factor because it is an effective tool in understanding and controlling the macroeconomic situation in a certain region. Compared to GDP per person, GDP density can reflect the regional development degree and economic concentration degree. GDP density is a measure of economic activity by area. It can be used as a fundamental indicator of economic factor by demonstrating the effects of geography on economy. The GDP annual growth rate is driven by the four components of GDP: (1) personal consumption; (2) business investment; (3) government spending; and (4) exports and imports. These components do many things: measure how quickly the economy is growing, reflect the change in degree on economic development levels within a specific period, show the required time period of improving levels of living, and reflect the increase in productivity arising from technological innovation and the accumulation of human and physical capital. This study chose GDP density as the fundamental indicator of economic factor, which mainly depends on the idea that all indicators (besides subsidence rate) are expressed in terms of density.
- (3)
- Progressive relationship: Regarding the indicators in the same causal chain, each one has an identical influence on the indicator located at the beginning. For instance, GDP per person, which is the middle indicator in the causal chain, can be calculated via GDP density and population density. The original cause indicators should therefore replace GDP per person.
4.3. Data Sources and Data Extraction
5. Conclusions
Acknowledgments
Conflicts of Interest
References
- Muller, A.; Reiter, J.; Weiland, U. Assessment of urban vulnerability towards floods using an indicator-based approach—A case study for Santiago de Chile. Nat. Hazards Earth Syst. Sci. 2011, 11, 2107–2123. [Google Scholar] [CrossRef]
- Grace, K.L.L.; Edwin, H.W.C. Indicators for evaluating environmental performance of the Hong Kong urban renewal projects. Facilities 2009, 27, 515–530. [Google Scholar]
- Simpson, D.; Katirai, M. Indicator Issues and Proposed Framework for a Disaster Preparedness Index (DPI); University of Louisville: Louisville, KY, USA, 2006. [Google Scholar]
- Ghadeer, J.; Ziad, M. Governance and climate vulnerability index. Water Resour. Manag. 2012, 26, 41–47. [Google Scholar]
- Wei, F. Researches on Geological Hazard and Risk Zonation in Tangshan Hebei; China University of Geosciences: Beijing, China, 2006. [Google Scholar]
- Wang, G. Preliminary studies on dangerous grading standard of land subsidence. Shanghai Geol. 2006, 4, 39–43. (In Chinese) [Google Scholar]
- Yu, J.; Wu, J. Preliminary research on risk evaluation management model of land subsidence in Su-Xi-Chang region. Jiangsu Geol. 2008, 32, 113–117. (In Chinese) [Google Scholar]
- Zhang, L.; Zhang, J. The theory and method of risk zonation of geo-hazard. J. Geol. Hazards Environ. Preserv. 2000, 11, 323–328. [Google Scholar]
- Birkmann, J. Measuring Vulnerability to Natural Hazards: Towards Disaster Resilient Societies, 2nd ed.; United Nations University Press: Tokyo, Japan, 2013. [Google Scholar]
- Armas, I.; Gavris, A. Social vulnerability assessment using spatial multi-criteria analysis (SEVI model) and the Social Vulnerability Index (SoVI model)—A case study for Bucharest, Romania. Nat. Hazards Earth Syst. Sci. 2013, 13, 1481–1499. [Google Scholar] [CrossRef]
- Diener, E.; Suh, E. Measuring quality of life: Economic, social, and subjective indicators. Soc. Indic. Res. 1997, 40, 189–216. [Google Scholar] [CrossRef]
- Birkmann, J. Danger Need Not Spell Disaster but How Vulnerable Are We? Res. Brief. 2005, 1, 1–7. [Google Scholar]
- Cutter, S.L. Vulnerability to environmental hazards. Prog. Hum. Geogr. 1996, 20, 529–539. [Google Scholar] [CrossRef]
- Zou, L.; Thomalla, F. The Causes of Social Vulnerability to Coastal Hazards in Southeast Asia; Stockholm Environment Institute: Stockholm, Sweden, 2008. [Google Scholar]
- Cutter, S.L.; Boruff, B.J.; Shirley, W.L. Social vulnerability to environmental hazards. Soc. Sci. Q. 2003, 84, 242–261. [Google Scholar] [CrossRef]
- Adger, N.; Arnell, N.; Tompkins, E. Successful adaptation to climate change across scales. Glob. Environ. Chang. 2005, 15, 77–86. [Google Scholar] [CrossRef]
- Eakin, H.; Luers, A. Assessing the vulnerability of social environmental systems. Annu. Rev. Environ. Resour. 2006, 31, 365–394. [Google Scholar] [CrossRef]
- Füssel, H.M. Vulnerability: A generally applicable conceptual framework for climate change research. Glob. Environ. Chang. 2007, 17, 155–167. [Google Scholar] [CrossRef]
- Petak, W.; Atkisson, A. Natural Hazard Risk Assessment and Public Policy: Anticipating the Unexpected; Springer-Verlag: New York, NY, USA, 1982. [Google Scholar]
- Susman, P.; O’Keefe, P.; Wisner, B. Global disasters, a radical interpretation. In Interpretations of Calamity from the Viewpoint of Human Ecology; Hewitt, K., Ed.; Allen & Unwin: Winchester, MA, USA, 1983. [Google Scholar]
- Mitchell, J. What’s in a name? Issues of terminology and language in hazards research. Glob. Environ. Chang. 2000, 2, 87–88. [Google Scholar] [CrossRef]
- Thywissen, K. Core terminology of disaster reduction: A comparative glossary. In Measuring Vulnerability to Natural Hazards: Towards Disaster Resilient Societies; Birkmann, J., Ed.; United Nations University Press: New York, NY, USA; Tokyo, Japan, 2006. [Google Scholar]
- Cutter, S.L.; Mitchell, J.; Scott, M. Revealing the vulnerability of people and places: A case study of Georgetown County, South Carolina. Ann. Assoc. Am. Geogr. 2000, 90, 713–737. [Google Scholar] [CrossRef]
- Adger, N. Vulnerability. In Tyndall Centre for Climate Change Research; School of Environmental Sciences, University of East Anglia: Norwich, UK, 2006. [Google Scholar]
- Nicholls, J.; Hoozemans, J.; Marchand, M. Increasing flood risk and wetland losses due to global sea-level rise: Regional and global analyses. Glob. Environ. Chang. 1999, 9, S69–S87. [Google Scholar] [CrossRef]
- Allen, K. Vulnerability Reduction and the Community-based approach. In Natural Disasters and Development in a Globalizing World; Pelling, M., Ed.; Routledge: London, UK, 2003. [Google Scholar]
- Maskrey, A. Disaster Mitigation: A Community-Based Approach; Oxfam: Oxford, UK, 1989. [Google Scholar]
- Panizza, M. Environmental Geomorphology; Elsevier: Amsterdam, The Netherlands, 1996. [Google Scholar]
- Tobin, G.; Montz, B.E. Natural Hazards: Explanation and Integration; The Guilford Press: New York, NY, USA, 1997. [Google Scholar]
- Deyle, R.E.; French, S.P.; Olshansky, R.B.; Paterson, R.G. Hazard assessment: The factual basis for planning and mitigation. In Cooperating with Nature: Confronting Natural Hazards with Land-Use Planning for Sustainable Communities; Burbey, R.J., Ed.; Joseph Henry Press: Washington, CA, USA, 1998. [Google Scholar]
- Liu, X.; Mo, D.; Wang, X. Regional vulnerability assessment of debris flows. Chin. J. Geol. Hazard Control 2011, 12, 7–12. [Google Scholar]
- Luers, A.L.; Lobell, D.B.; Sklar, L.S.; Addams, C.L.; Matson, P.A. A method for quantifying vulnerability, applied to the agricultural system of the Yaqui Valley, Mexico. Glob. Environ. Chang. 2003, 13, 255–267. [Google Scholar] [CrossRef]
- Turner, B.L.; Kasperson, R.E.; Matson, P.A.; Mccarthy, J.; Corell, R.W.; Christensen, L. Science and technology for sustainable development special feature: A framework for vulnerability analysis in sustainability science. Proc. Natl. Acad. Sci. USA 2003, 100, 8074–8079. [Google Scholar] [CrossRef] [PubMed]
- Schröter, D.; Polsky, C.; Patt, A.G. Assessing vulnerabilities to the effects of global environmental change: An eight step approach. Mitig. Adapt. Strateg. Glob. Chang. 2005, 10, 573–596. [Google Scholar] [CrossRef]
- Füssel, H.M. Vulnerability in climate change research: A comprehensive conceptual framework. In International and Area Studies—Breslauer Symposium Report; University of California: Oakland, CA, USA, 2005. [Google Scholar]
- Polsky, C.; Neff, R.; Yarnal, B. Building comparable global change vulnerability assessments: The vulnerability scoping diagram. Glob. Environ. Chang. 2007, 17, 472–485. [Google Scholar] [CrossRef]
- Tang, C.; Zhang, J.; Zhou, C.; Tie, Y. Vulnerability assessment of urban debris flow hazard. J. Catastrophol. 2005, 20, 11–17. [Google Scholar]
- Luo, Y.; Zhang, L.; Zhang, Y. Geologic Hazard Risk Assessment Method; Geology Press: Beijing, China, 1998. [Google Scholar]
- Jiang, T.; Xu, P. Community vulnerability assessment—A new approach for natural disaster studies. J. Catastrophol. 1996, 15, 45–50. [Google Scholar]
- Zhao, W.; Guo, Y. Analysis of hazard’s social vulnerability in Chongqing based on the principle component analysis method and GIS technology. Res. Soil Water Conserv. 2007, 14, 319–325. [Google Scholar]
- Li, H.; Chen, G. Application of extension method in regional vulnerability evaluation and zoning. Sci. Geogr. Sin. 2003, 23, 79–85. [Google Scholar]
- Shi, L.; Qiao, J. Vulnerability evaluation on regional landslides based on GIS and contribution weight superposition approach. J. Catastrophol. 2009, 24, 46–50. [Google Scholar]
- Chen, Y.; Shu, L.; Burbey, J.T. Composite Subsidence Vulnerability Assessment Based on an Index Model and Index Decomposition Method. Hum. Ecol. Risk Assess. 2013, 19, 674–698. [Google Scholar] [CrossRef]
- Shan, Y. Empirical analysis of rank correlation coefficient. Res. Financ. Econ. Iss. 1999, 3, 68–69. [Google Scholar]
- Yang, F. Study on the Early-Warning Index Screening and Index System Construction for Sudden Water Pollution Accidents; Beijing Forestry University: Beijing, China, 2009. [Google Scholar]


| Object Level (A) | Factor Level (B) | Indicator Level (C) | |
|---|---|---|---|
| Factor and Code Name | Indicator and Code Name | Note | |
| Land Subsidence Disaster vulnerability | Physical factor (B1) | road density (C1) | the ratio of road mileage to area |
| bridge density (C2) | the ratio of bridge number to area | ||
| underground pipeline density (C3) | the ratio of underground pipeline length to area | ||
| building density (C4) | the ratio of building area to area | ||
| density of flood control facilities (C5) | the ratio of flood control facility number to area | ||
| subsidence rate (C6) | the ratio of accumulative subsidence to corresponding subsidence years | ||
| Economic factor (B2) | GDP density (C7) | the ratio of GDP to area | |
| density of industrial production (C8) | the ratio of industrial production to area | ||
| density of agricultural production (C9) | the ratio of agricultural production to area | ||
| investment density of fixed assets (C10) | the ratio of fixed asset investment to area | ||
| GDP per person (C11) | the ratio of GDP to regional population | ||
| annual growth rate of GDP (C12) | the ratio of GDP variation to GDP of last year | ||
| Social factor (B3) | population density (C13) | the ratio of regional population to area | |
| the proportion of non-agricultural population (C14) | the ratio of non-agricultural population to total population | ||
| the proportion of poverty (C15) | the ration of population living at or below the poverty line to total population | ||
| the proportion of floating population (C16) | the ration of floating population to total population | ||
| the quality of population (C17) | ① | ||
| Environmental factor (B4) | farming density (C18) | the ratio of farming area to area | |
| vegetation rate (C19) | the ratio of vegetation vertical projection area to area | ||
| drainage network density (C20) | the ratio of the total river length to unit river basin area | ||
| Code | Indicator | Unit | Operational Definition |
|---|---|---|---|
| C1 | GDP density | 10,000 Yuan/km2 | regional GDP/the regional area |
| C2 | Population density | people/km2 | regional population/the regional area |
| C3 | Farmland density | m2/km2 | regional farmland area/the regional area |
| C4 | Building density | m2/km2 | regional industrial and civil architecture area/the regional area |
| C5 | Subsidence rate * | mm/a | accumulative subsidence/corresponding subsidence years |
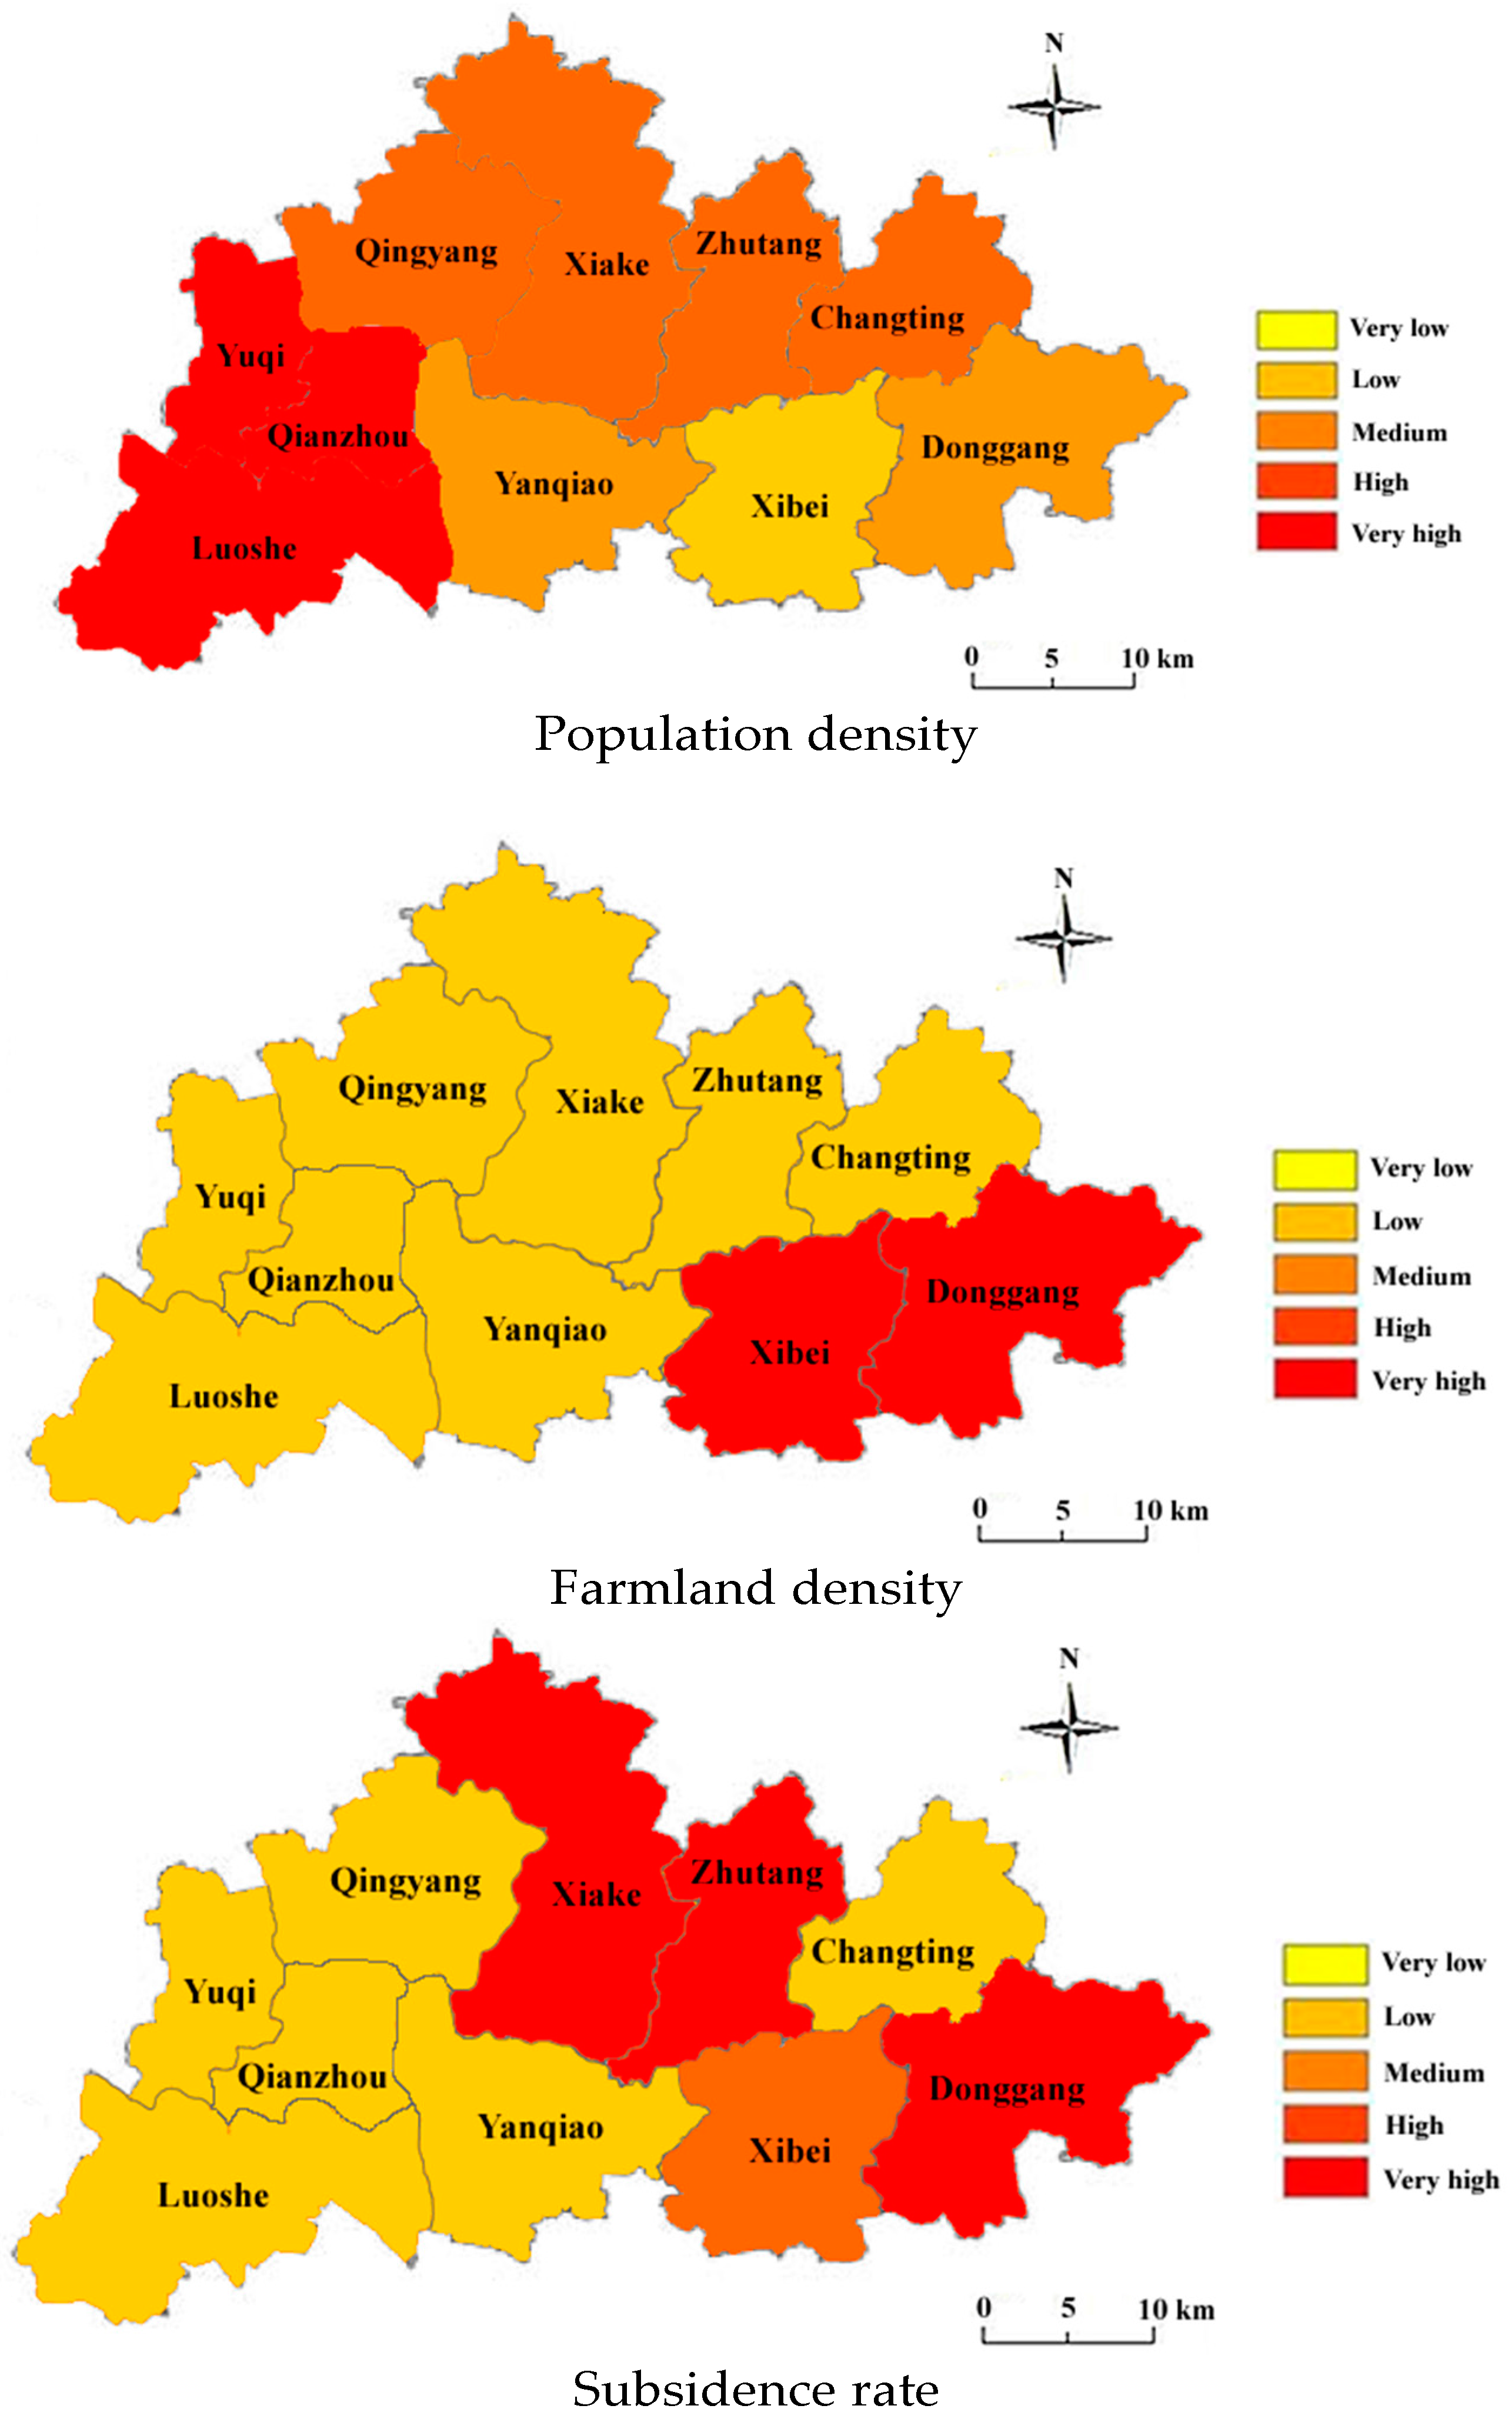
| Township | GDP Density | Building Density | Population Density | Farmland Density | Subsidence Rate |
|---|---|---|---|---|---|
| Yanqiao | 0.104 | 0.000 | 0.290 | 0.000 | 0.000 |
| Qianzhou | 0.533 | 0.754 | 0.920 | 0.191 | 0.000 |
| Yuqi | 1.000 | 0.685 | 0.905 | 0.154 | 0.000 |
| Luoshe | 0.434 | 0.738 | 1.000 | 0.143 | 0.000 |
| Xibei | 0.000 | 0.176 | 0.000 | 1.000 | 0.500 |
| Donggang | 0.205 | 0.562 | 0.291 | 0.879 | 1.000 |
| Changting | 0.059 | 1.000 | 0.645 | 0.107 | 0.000 |
| Zhutang | 0.178 | 0.677 | 0.549 | 0.004 | 1.000 |
| Xiake | 0.087 | 0.737 | 0.496 | 0.044 | 1.000 |
| Qingyang | 0.116 | 0.821 | 0.574 | 0.055 | 0.000 |
| Grading | Very Low | Low | Medium | High | Very High |
|---|---|---|---|---|---|
| Normalization | <0.2 | 0.2–0.4 | 0.4–0.6 | 0.6–0.8 | >0.8 |
| Indicator Vulnerability Grade | GDP Density | Building Density | Population Density | Farmland Density | Subsidence Rate |
|---|---|---|---|---|---|
| GDP density | 1.000 | 0.276 | 0.679 | −0.049 | −0.326 |
| Building density | 1.000 | 0.659 | −0.494 | −0.555 | |
| Population density | 1.000 | −0.685 | −0.469 | ||
| Farmland density | 1.000 | 0.498 | |||
| Subsidence rate | 1.000 |
© 2016 by the author; licensee MDPI, Basel, Switzerland. This article is an open access article distributed under the terms and conditions of the Creative Commons Attribution (CC-BY) license (http://creativecommons.org/licenses/by/4.0/).
Share and Cite
Chen, Y. Conceptual Framework for the Development of an Indicator System for the Assessment of Regional Land Subsidence Disaster Vulnerability. Sustainability 2016, 8, 757. https://doi.org/10.3390/su8080757
Chen Y. Conceptual Framework for the Development of an Indicator System for the Assessment of Regional Land Subsidence Disaster Vulnerability. Sustainability. 2016; 8(8):757. https://doi.org/10.3390/su8080757
Chicago/Turabian StyleChen, Yu. 2016. "Conceptual Framework for the Development of an Indicator System for the Assessment of Regional Land Subsidence Disaster Vulnerability" Sustainability 8, no. 8: 757. https://doi.org/10.3390/su8080757
APA StyleChen, Y. (2016). Conceptual Framework for the Development of an Indicator System for the Assessment of Regional Land Subsidence Disaster Vulnerability. Sustainability, 8(8), 757. https://doi.org/10.3390/su8080757