1. Introduction
The history of carsharing is much longer than most people realize. According to Shaheen et al., the earliest carsharing service was recorded in Europe in 1948 [
1]. Since the late 1990s and early 2000s, carsharing has been mainstreamed in American cities and was recently introduced to major Asian cities including Seoul, Korea. Technological innovation in internet, mobile, and social media has opened up new opportunities for a more sharing economy, which has facilitated successful startups, such as Airbnb and Uber that emerged after the 2008 global economic crisis. The city of Seoul has started paying attention to the economic and environmental benefits that a sharing economy can bring to the future society. As an alternative to private mobility, carsharing has been promoted by the city since the late 2000s. In transportation, carsharing has long been viewed as a sustainable mode. Existing literature shows that carsharing can reduce car ownership, vehicle miles traveled (VMT), and even help improve air quality [
2,
3]. As carsharing can contribute to sustainable transportation and urban planning, and eventually help a city to consume less energy and resources, the success of carsharing in Seoul and other major Asian cities is important.
2. Literature Review
Since the inception of carsharing programs in American cities, carsharing has become one of the most popular research topics in transportation. Since the seminal studies published in the early 2000 [
1,
4], more than a hundred carsharing studies have been published. Existing carsharing research can be categorized into multiple subgroups including the followings: (1) user characteristics and behaviors; (2) environmental impact of carsharing; (3) demand analyses; and (4) service optimization. The first group focuses on the current carsharing users and their socio-economic profiles, especially on the reasons for choosing carsharing (e.g., environmental attitude). The second group of carsharing studies deals with the changes in the travel behaviors of carsharing users, such as car ownership, modal shift, and VMT or with the environmental impact of carsharing, such as greenhouse gas emissions. Demand analyses can be carried out with either current users or potential users. The current carsharing usage can be used as a proxy for demand under the assumption of supply-demand equilibrium, while potential demand can be estimated by various methods including stated preference surveys. With an emergence of one-way/free-floating services, with which a user can return the vehicle to another pod or any designated on-street parking spot within an operation area, optimization studies are recently gaining popularity [
5,
6]. The goal of these optimization studies is to find the optimal fleet size or to optimize the distribution of carsharing pods. Developing a vehicle relocation algorithm to solve supply and demand imbalance is the main focus in these studies.
However, a comprehensive demand analysis based on real carsharing usage data is identified here as a gap in the literature. An analysis revealing the spatially contextual urban and transportation factors that influence carsharing usage is particularly rare. Relatively little such research has been performed, mainly because of the lack of carsharing activity and user data available for researchers. For privacy protection, carsharing operators are reluctant to provide any personal information related to their users [
7]. Because of this data deficiency, Celsor et al. used an alternative approach of utilizing the carsharing level of service (LOS) (the number of vehicles provided by carsharing operators) as a proxy for carsharing demand [
8]. As a first meaningful study to test the impact of both built environment and socio-economic factors, Celsor et al. suggests the threshold values for minimum carsharing LOS in terms of demographics, commute mode share, vehicle ownership, and housing density. The method developed by Celsor et al. was further upgraded by Stillwater et al. [
9]. With raw carsharing activity data acquired directly from an unidentified large operator in America, they analyzed the actual number of user hours at each carsharing pod as a proxy for carsharing demand and built the first meaningful regression model to test the effect of socio-economic characteristics, neighborhood built-environment, and transit accessibility [
9].
For the comprehensive analyses including all three types of variables, location information associated with carsharing usage data is critical. For example, Morency et al. analyzed carsharing transaction data without a location identifier and thus could not test neighborhood socio-economic and built environment variables [
10]. With the data from the carsharing operator of Montreal, De Lorimier and El-Geneidy estimated a model that predicts the number of monthly hours-reserved per vehicle [
11]. Along with vehicle- and operation-related variables, a relatively small number of socio-economic and built-environment factors are tested for their research. Three of the four such variables, average income, density of big box stores, and jobs measured within the station’s spatial buffers, were actually significant. Instead of using the total hours of usage in each station, they denominated the variables by the number of carsharing vehicles. While this will improve the applicability of the modeling result for the operator’s profit maximization, it might limit the ability to test the effect of neighborhood factors [
11]. In a similar vein, Kim uses a usage rate, which is “calculated as the number of vehicles rented divided by the total number of vehicles in service” [
7]. Instead of acquiring a raw usage log directly from the carsharing operators in New York City, Kim manually collected the vehicle information available for its members through the reservation platform. This study shows that it can be an effective alternative method for collecting carsharing usage data that is difficult to obtain.
For the GIS analyses of all the aforementioned studies, the location identifier is a pod location. However, Schmoller et al. shows that spatial analyses that test socio-economic, built-environment, and transit accessibility would become more difficult with the booking data from new free-floating services [
12]. Their research was performed based on carsharing booking data from Munich and Berlin, which have the GPS coordinates of trip start and end points instead of the traditional pod locations. This poses a dilemma for researchers who then need to choose either a trip starting or ending point, or to utilize an alternative point as a spatial identifier for extracting socio-economic, built-environment, and transit accessibility variables. In this case, information related to carsharing users’ residential location can be a more effective spatial identifier, if available for researchers. According to a recent German study on free-floating services, more than 60% of transactions have either trip origin or end point within a half kilometer from the users’ home addresses [
13].
3. Carsharing in Seoul
Motivated by the increasing global sharing economy, as well as the increasing usage of smartphones, the first grass-roots carsharing program was started in 2009 in Gunpo, a small edge city of the Seoul metropolitan area [
7]. In 2011, a profit-based carsharing service was initiated in Seoul by a private carsharing operator named GreenCar. Soon after, SoCar and other several startups launched carsharing services in Seoul. As smartphones are widely used in Korea, the penetration rate reached 83.9% overall and 99% for those in their twenties as of August 2015 [
14]. While its well-connected mobile network is good for carsharing, Seoul may not be a favorable place for carsharing, mainly for the following two reasons. First, it has a good public transportation system well-known for the web of BRT lines and the nine subway lines with more than 300 stations [
15]. In 2013, the bus and subway systems together comprise 65.9% of the mode share in Seoul, while the mode share of privately owned vehicles is only 22.9%. New carsharing startups need to compete with strong public transit systems, as well as the city’s easily accessed affordable taxi service, which comprises 7% of the total mode share [
16]. Ironically, to the supporters of sustainable transportation, the existing sustainable modes work against the inception of the new sustainable mode, as this well-developed transit system becomes a major threat to incubating carsharing startups.
The second disadvantage for carsharing in Seoul is the lack of parking space. In Seoul, one of the oldest and densest major cities, finding spaces desirable for carsharing pods is very difficult for small carsharing startups. Unlike in American cities where carsharing is often provided jointly with transit-oriented developments (TOD), most subway stations in Seoul do not have parking lots, as the majority (about 80%) of subway users walk for their access trips to the station [
17]. At the beginning, multiple carsharing startups exploited the opportunity and then later struggled, and the Seoul Metropolitan Government intervened to help. In February 2013, the government launched a new carsharing service called “Nanum Car” [
18]. Nanum refers to the concept of “dividing equally and sharing” in Korean. As a first public-private partnership (PPP) carsharing program in Korea, the major role of the government is to provide parking spaces for the carsharing startups by using the public parking facilities operated by the city. It is one of the most frequently used public intervention tools to incubate a new carsharing program. In Sydney, for example, the city allocated on-street parking spaces exclusively for carsharing vehicles [
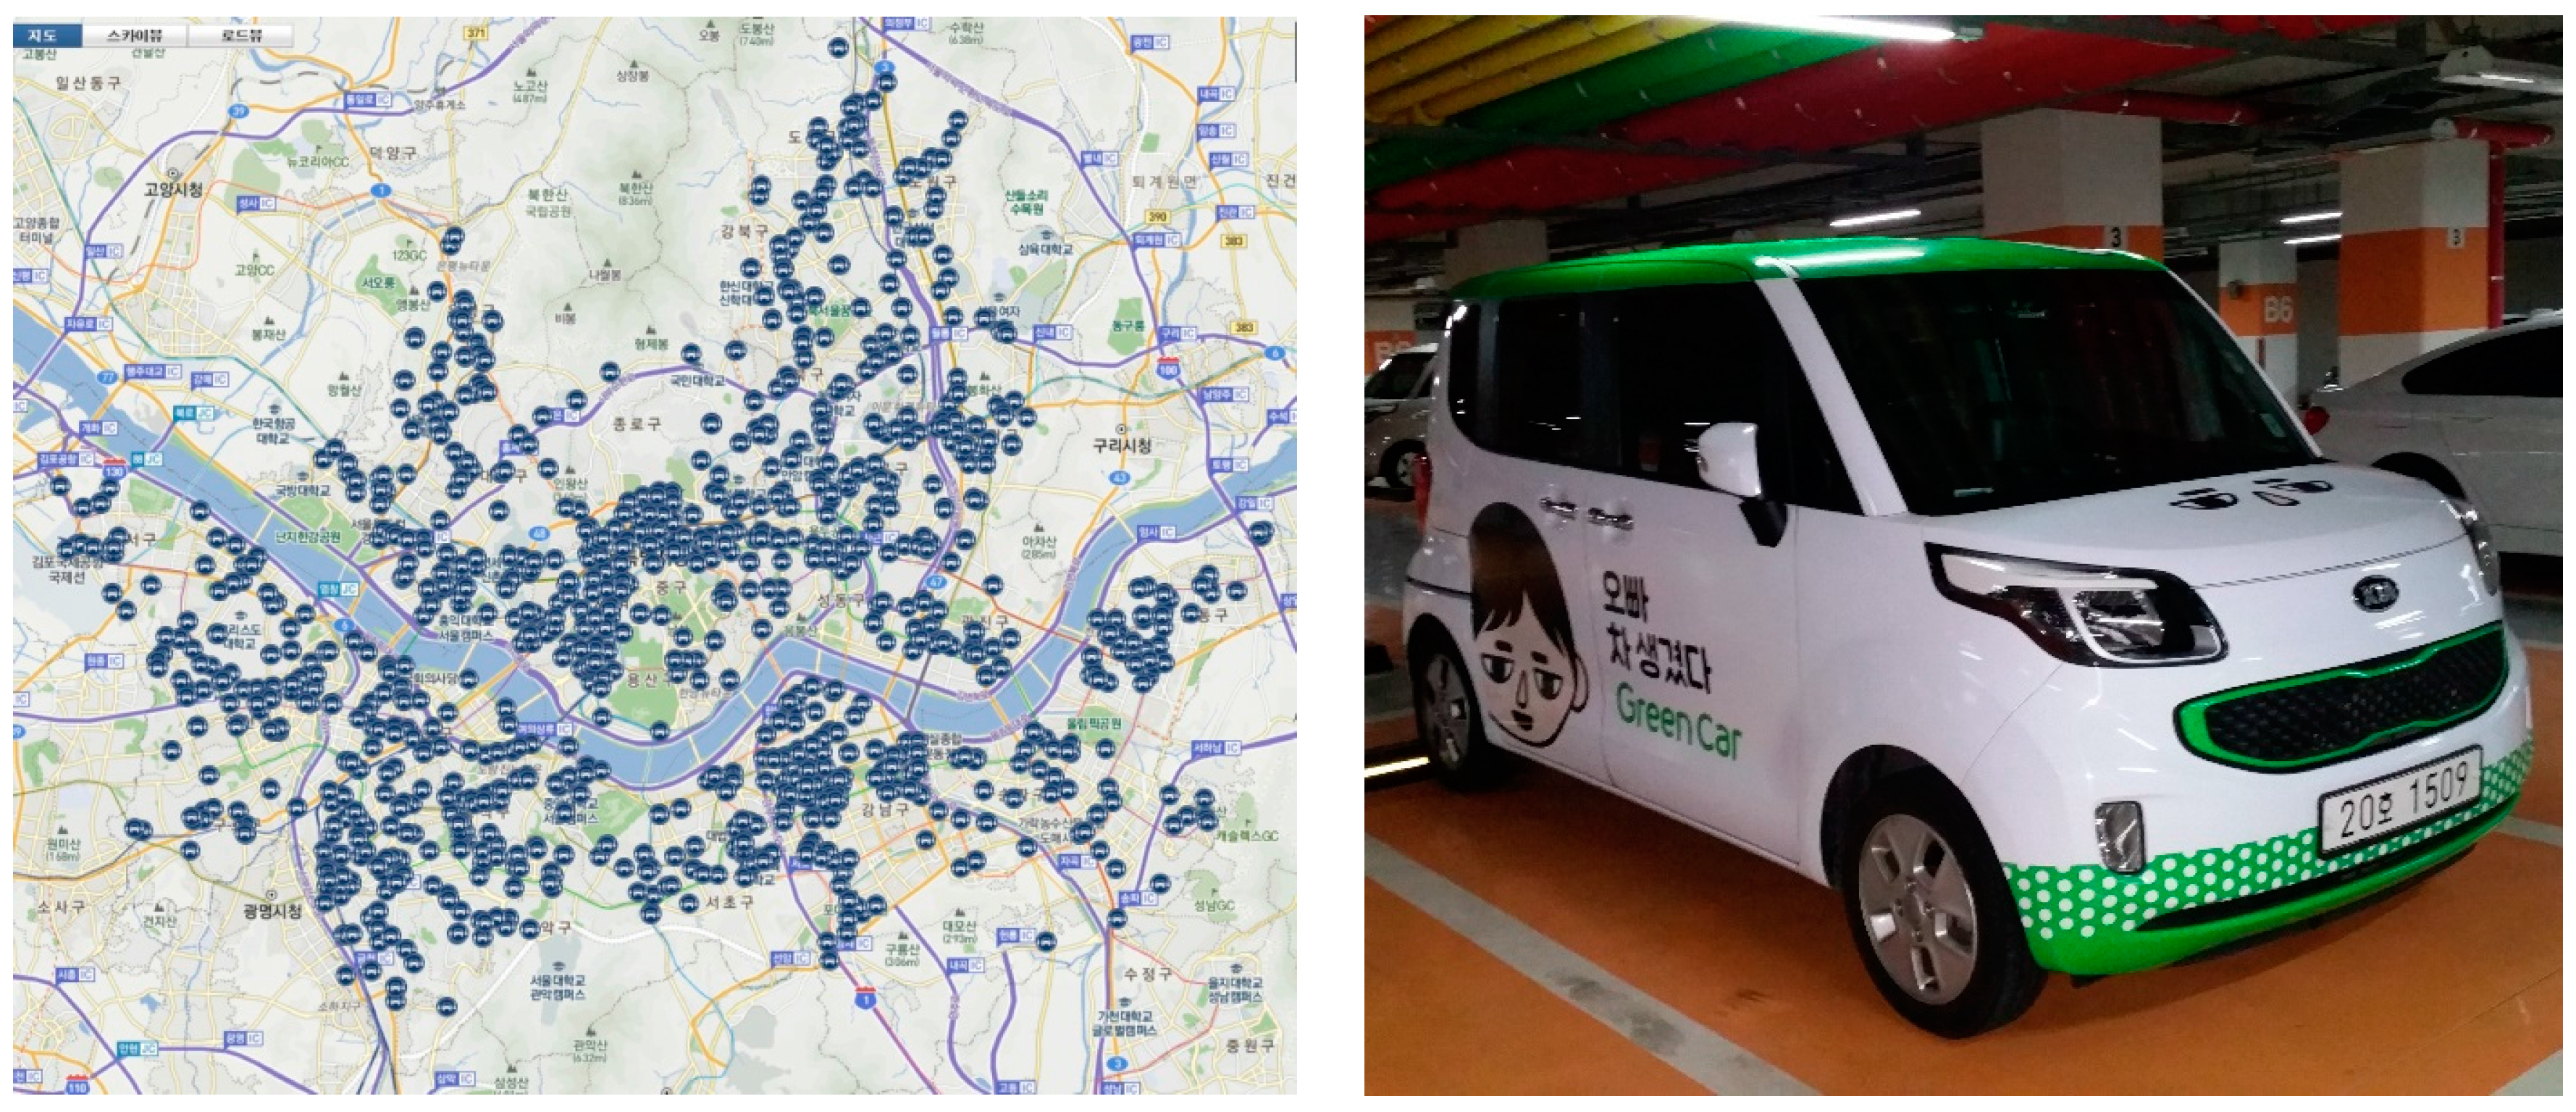
19]. Through a public tendering process, the city of Seoul invited carsharing companies to commission the new program, in which two private carsharing operators, GreenCar and SoCar, were selected as the operators and four smaller startups were selected as electric vehicle-based carsharing operators. The commissioned private operators are allowed to use the city’s public parking facilities and in return, they are obligated to station their vehicles to fill the designated lots assigned for the program by the city.
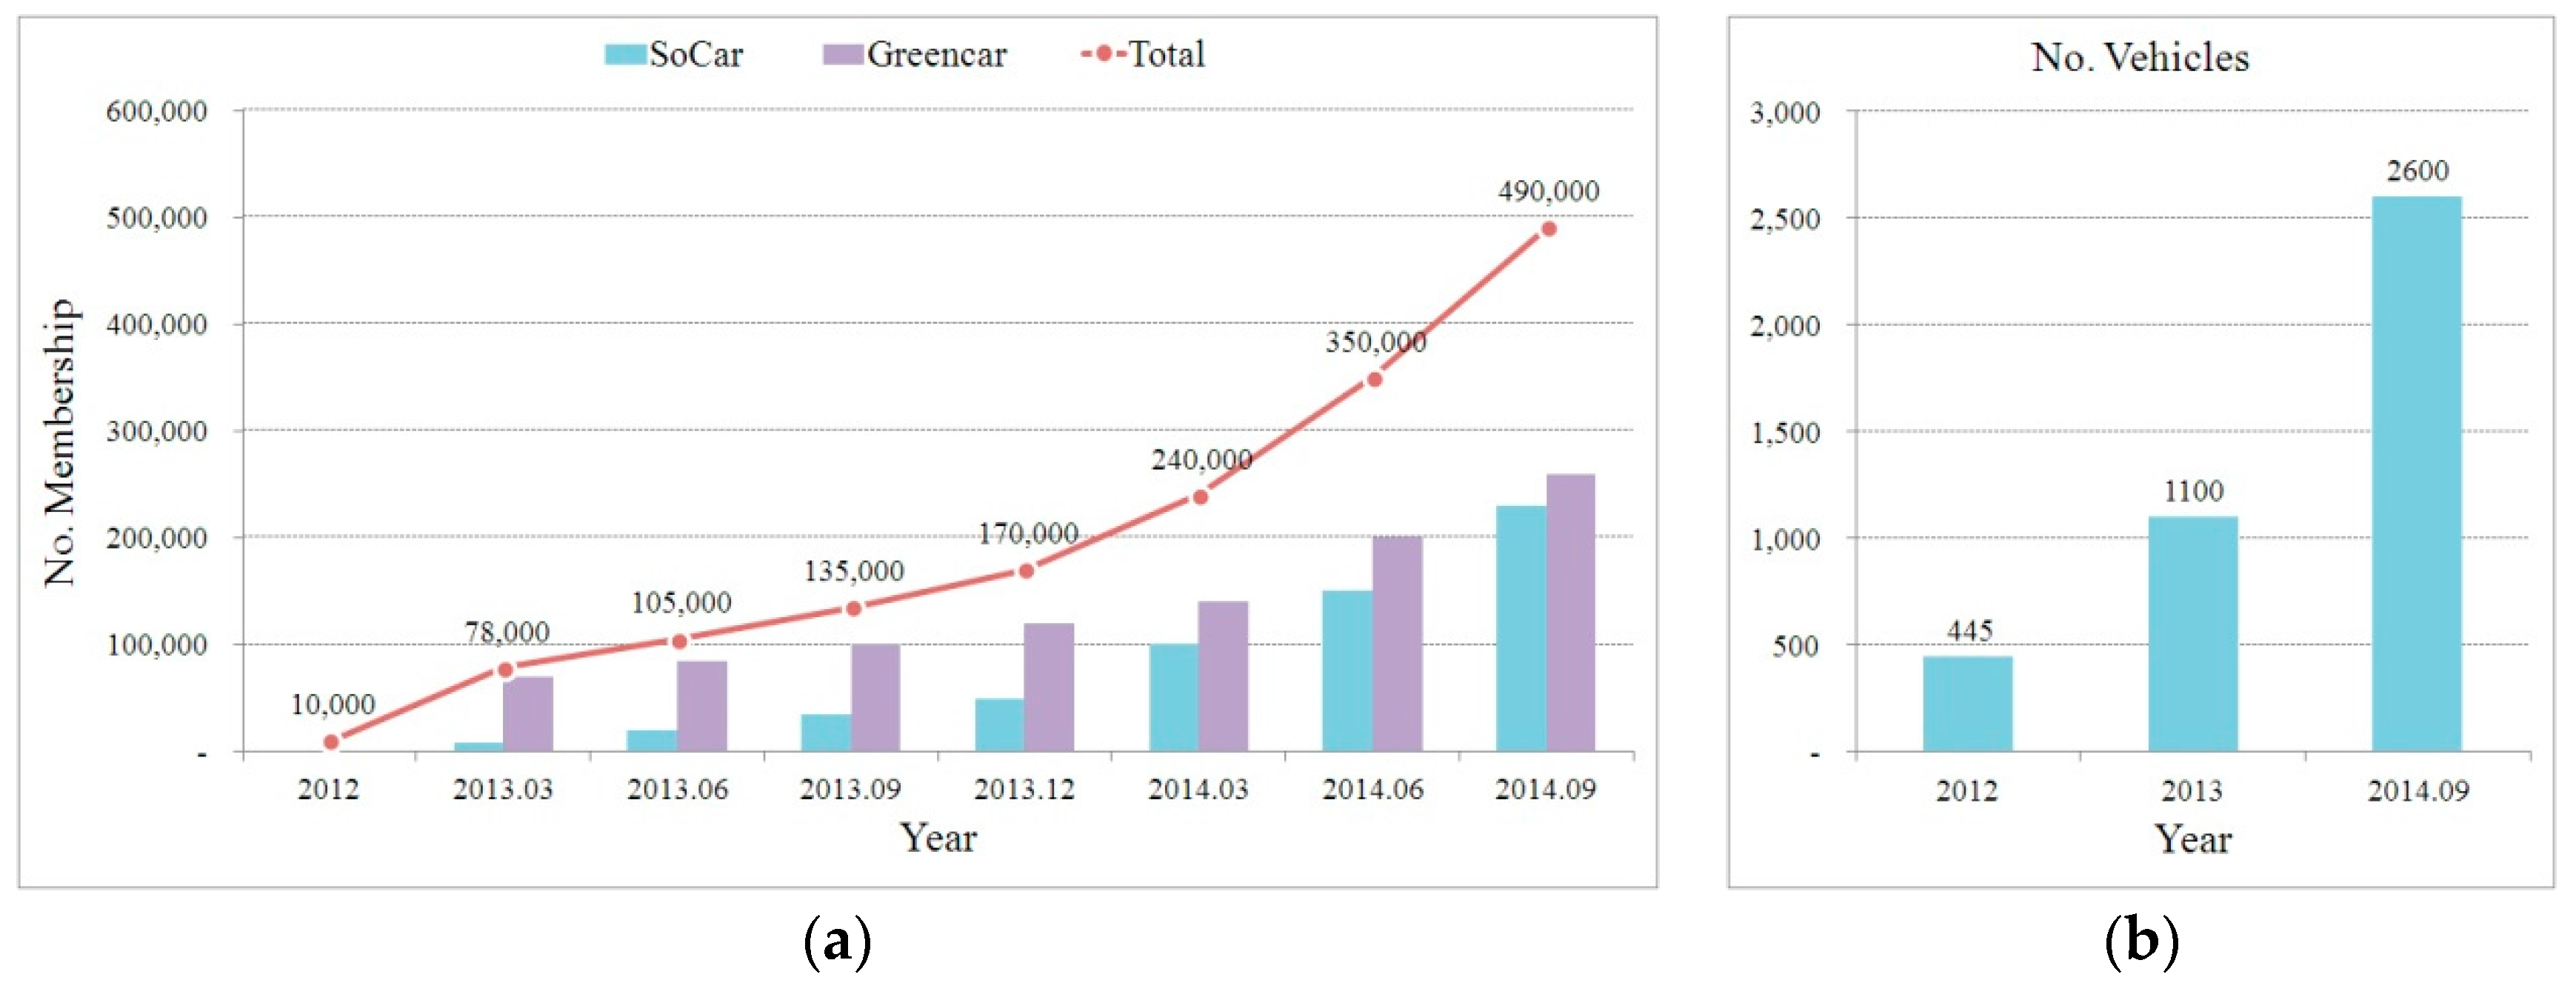
The basic fare initially set for the carsharing program is 3300 KRW (approximately 3 US dollars) for 30 min (the price of a Big Mac in Korea was 3700 KRW in 2012). Initially, it was a station-based two-way service with designated pods (with extra fees, one-way and free-floating options became available beginning November 2015). After the new program was launched, the number of pods, vehicles, and memberships grew rapidly. When the program was launched in February 2013, the total number of pods and vehicles was 292 and 492, respectively. By November 2014, the total membership of the Nanum carsharing service had grown rapidly to 350,000 and the total number of pods and vehicles had increased to 850 and 1816, respectively [
20]. A national trend shows a similar rapid growth as shown in
Figure 1. According to a Korean report, however, if a 300-m circular buffer from each pod is applied as a threshold for easy access, only 45% of the urbanized area of Seoul has good accessibility to the carsharing service, and the majority of the pods have only one or two carsharing vehicles [
17].
5. Analysis Result and Discussion
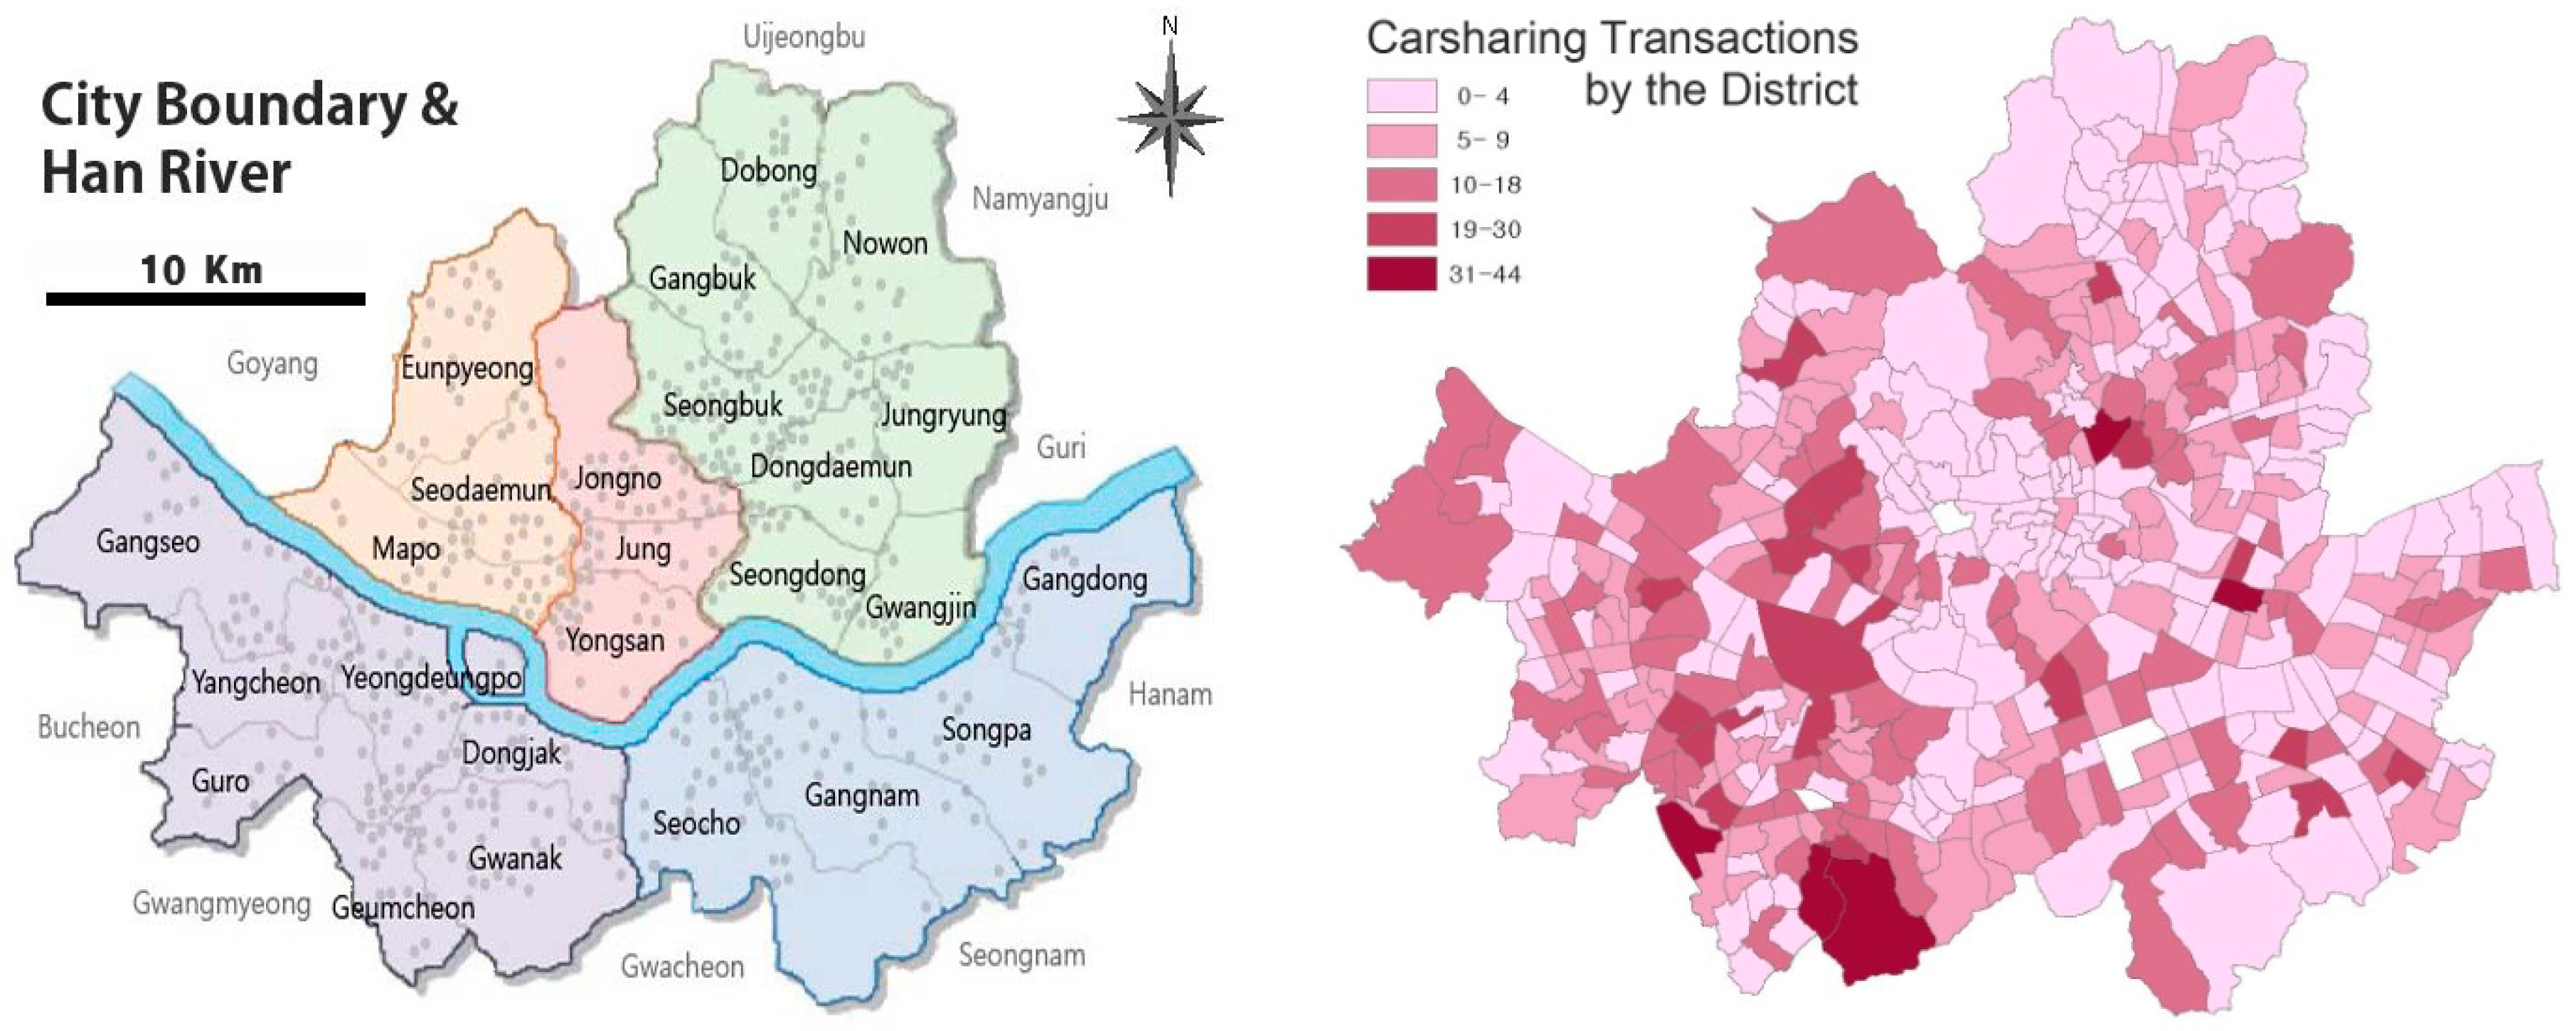
In order to identify the factors that affect carsharing usage, linear regression modeling was performed with the number of carsharing transactions occurred in the district as a dependent variable and with the three groups of independent variables: built environment, demographic, and transportation variables. We analyze 420 districts and the final result shows that six variables enter the best-fitting model at the 0.05 alpha level (
Table 2). The R-squared value is 0.4839, meaning that the six independent variables collectively account for 48.39% of the variance observed in the carsharing usage data.
Among the built environment variables, the ratio of total floor area for business use exerts a statistically significant influence on carsharing usage. With a positive sign of its coefficient, this can be inferred that building floors used for businesses help promote the carsharing usage within the district. Unlike the initial expectation, we cannot find such effect from the floor area used for commercial uses. The usage (per vehicle) model estimated based on the carsharing program in Montreal includes variables that represent both business and commercial uses: the number of jobs and big box stores within 30 min by car [
9]. However, our result is consistent with the finding by Schmoller et al. on free-floating services in Munich and Berlin, for which the number of companies (per square km) has a positive impact [
12].
For the present research, the population density is not included, which is different from American carsharing literature which emphasizes that population density high enough to support both public transit and carsharing is essential for the success of carsharing startups. Density may not be as critical in a high-density city, such as Seoul, as it is in low-density American cities. Seoul’s population density is approximately 17,200 inhabitants per square kilometer, which is almost 4.5 times higher than the minimum density threshold of 10,000 people per square mile (equivalent to 3861 per km
2) used by Zipcar [
8]. Celsor and Millard-Ball used housing density as one of the six criteria for carsharing level of service and suggested five housing units per acre as a threshold density; however, they also mentioned, “density may not be as dominant in explaining carsharing market settings as it is in the case of transit” [
8]. The household density was tested by Stillwater et al., but not included in their final model [
9].
Only one demographic variable, the percentage of population between 20 and 39 year old, enters our model at the statistically significant level. This result directly supports the notion that carsharing demand is higher in the internet- and mobile-savvy young generation. Stillwater et al. tested three age variables (population between the ages of 22 and 24, between 25 and 29, and between 30 and 34), but none was statistically significant [
9]. The difference may be explained by the fact that privately owning a car is relatively more expensive for young Koreans than for young Americans. Contrary to the literature on American carsharing experience, the influences of household size and gender on carsharing usage are not significant in Seoul.
Fifty percent of the transportation-related variables tested were statistically significant, including the number of registered cars, the number of subway entrances, the number of carsharing pods in the district, and the existence of the PPP pods. The fact that the total number of cars measured for each district is included for the final model indirectly demonstrates that in Seoul, the carsharing demand is higher in a more auto-dependent area in contrast to the situation of American cities where carsharing demand seems higher in more transit-oriented areas. On the other hand, no significant influence from the average number of cars owned by a household is found, unlike some previous studies performed based on American cities. The average vehicle per household within a 0.5-mile radius is included for Celsor and Millard-Ball and the household with one vehicle is significant for the model estimated by Stillwater et al. [
8,
9]. This result might be the most distinctive difference between the present and previous research and might result from the fact that the present research uses residential locations for spatial referencing, while the previous research uses pod locations; alternatively it can be explained by the difference between Asian and North American cities. Further research needs to be performed to verify the reasons for the difference observed.
The impact of the total number of subway entrances within the district is significant, but unexpectedly with a negative sign, meaning that the area with fewer entrances shows a higher level of carsharing usage. This finding is opposite to the previous studies done in the U.S. Stillwater et al. found that light-rail availability has a positive relationship with carsharing demand and the percent of public transportation commute is significant for a carsharing study performed in New York [
7,
9]. But the evidence drawn from American cities could be complicated by the fact that many rail transit stations have their own parking facilities available for carsharing pods and thus more carsharing happen to be provided near stations than in other areas. Unlike American cities, most subway stations in Seoul do not have parking facilities that could be utilized for carsharing. That may be one reason for this study yielding the opposite result in relation to transit accessibility. In general, the opposite result can be explained by the different relationship between carsharing business and public transit. In American cities, their relationship is a mutually beneficial partnership. In Seoul, however, its relationship to public transit is similar to its relationship to the rental car business in America. The immediate goal of carsharing in Seoul is to secure a bridgehead by surviving from an uphill battle up against existing public transit systems, which are already well-established and highly accessible. In this context, our finding that carsharing usage tends to be higher in an area where public transit accessibility is relatively low sounds reasonable.
Unlike the access to the subway entrances, the variables that represent bus service availability are not significant. It is consistent with Stillwater et al., in which two variables related to bus service frequency were tested, but no significant relationship with carsharing usage could be found [
9]. Additionally included in our model are the total number of carsharing pods and the existence of the PPP pods within the district. The variable related to the number of carsharing pods was tested in previous studies, but no significant effect was found [
7,
9]. The present result can be interpreted in two ways: the existence of the carsharing pods within the city-operating parking facilities through the PPP intervention positively influences the carsharing usage, or the locations of those facilities and the public support through PPP encourage carsharing operators to increase the number of vehicles for their service.
6. Conclusions and Future Direction
The final model is quite different from what has been estimated based on American cities. This research establishes a basis for future research efforts to forecast carsharing demand and find areas with high potential, especially in major Asian cities with urban conditions similar to Seoul. The analysis result shows that carsharing demand is high in an area where a higher proportion of building floor area is used for business, and which has a higher proportion of young residents in their 20s and 30s. It can also be predicted that the area with more registered cars and less subway entrances will show higher carsharing demand. These findings can be utilized for carsharing startups to assess the market potential in Asian cities. While it might be almost impossible (or unjustifiable) to change the first four aforementioned attributes—the ratio of total floor area for business use, percentage of population in their 20s and 30s, and total number of registered cars and subway entrances—only for promoting carsharing, the analysis result also suggests that providing additional carsharing pods, especially pods that utilize city owned public parking facilities, will help promote carsharing usage. It can be inferred that in densely developed Asian cities, the success of carsharing could depend on securing convenient, easily accessible locations for pods, while the government support for desirable pod locations through a public-private partnership could also be important. The one important future policy implication that is opposite to the finding from previous American studies is that carsharing businesses in Seoul should strategically target the areas with relatively low level of transit accessibility. In the cities with existing dominant public transit systems, carsharing can play a different but still important role, which is to help those who cannot afford to own a car but have to live with limited transit accessibility. Public support can also be justified if carsharing can contribute to transportation equity, which is as important as environmentally beneficial transportation. Unlike previous analyses based on pod locations, we use the residential location of carsharing users for spatial referencing; some of the research outcomes can therefore also be utilized for a free-floating service, which is gaining popularity and will be a norm with automated vehicle technologies in the future.
This study has several limits. Although the authors are grateful for the opportunity to analyze real carsharing transaction data, due to the privacy regulation, no detailed location information of carsharing users can be obtained, and therefore the administrative district is the smallest spatial unit available for this analysis. The district is still too large for small-scale built environment measurement such as micro walkability [
31,
32]. With location and other socio-economic information measured at the finer resolution, a multi-level regression analysis can be performed at micro- and meso-levels [
33]. If carried out successfully, such analysis will provide a clearer understanding on how carsharing is performed differently, according to its location and built environment characteristics. In addition, the transaction data used for this research is acquired from only one of the two major carsharing operators in Seoul. The present analysis is also based on the data from the period of just one week. A more complete result might be obtained if data representing the entire industry and covering the entire year are available.


