1. Introduction
Nowadays, competition between companies mostly focuses on activities associated with supply chain (SC) operations, such as the transportation of raw materials and finished products. However, these activities do not usually add any value to products, so they are an area of significant opportunities to reduce costs. Companies are currently looking for innovative business strategies that enable them to approach their target markets while reducing distances, which in turn will allow them to decrease production costs, deliver quality products in a timely manner, reduce cycle times, and thus improve the overall product quality [
1]. Companies often respond to these globalization processes by establishing subsidiaries, especially manufacturing plants, in other countries as a means to obtain a better geographical position to reach their markets. Benefits from this trend include appropriate infrastructure, local skilled workforce, and low production costs, among others [
2].
Subsidiaries established in Mexico are traditionally called maquiladoras [
3]. The maquiladora industry is made up of companies that depend on a parent corporation that has its headquarters in a foreign country. The parent company identifies customer needs and market strategies, defines the product to be manufactured, and assembles it at the maquiladoras’ plants [
4]. This means that maquiladoras have no direct contact with the final customer or end user. Their direct customer is the parent company itself [
5].
Consequently, based on the needs of parent companies, maquiladoras are provided with a certain amount of production capacity and with machinery and equipment for their production processes. Likewise, they establish an organizational structure that meets the product requirements. These organizational structures and production processes are highly specialized and can quickly respond to changes in demand, thanks to the high training of employees and the technology installed.
In the case of Mexico, which is a facilitator or host country, maquiladoras offer competitiveness and proximity to markets for the United States of America (USA) and Canada, which are two of the most important worldwide [
6,
7]. Additionally, Mexico offers infrastructure, a trained workforce, efficiency, education and job training, and the ability to use existing technology and high experience in import and export processes [
8].
Since Mexico signed the North American Free Trade Agreement (NAFTA) with the USA and Canada, many companies have been established in Mexico’s northern region in an attempt to introduce their products into these markets at preferential tax rates [
3,
9,
10]. AMAC (Maquiladora Association, A.C.) reported that, in 2013, Mexico catered for 5024 maquiladoras, 477 of which were located in the state of Chihuahua, providing 373,794 direct jobs. More specifically, Ciudad Juárez now caters for 327 maquiladoras that generate 245,000 direct jobs, and 87.8% (287 factories) of them are foreign investment-based or really maquiladoras [
11].
Unfortunately, the main markets of maquiladoras have been decreasing due to financial crises. As a result, these companies face temporary shutdowns or technical stoppages, since the number of working days is reduced to enable workers to keep their jobs and companies to hold on to skilled human resources. Thus, although maquiladoras maintain their human resources, their financial income is substantially reduced, and sometimes they stop working. This problem has forced top managers to come up with new alternatives to develop new products that could be manufactured with the available infrastructure, modern production systems, robust organizational structure, and skilled human resources. This trend enables companies to increase their income, become more competitive, and avoid the frequent loss of highly skilled workers, stopping the knowledge transfer.
Amid such a challenging context, maquiladoras often develop innovations and new products in a way that is opposite to the traditional innovation process: they identify the customers’ needs and requirements that can be met with the production process capacity and the organizational structure that they have already installed, because they cannot make drastic changes to their production processes and must be ready and attentive to the requirements of their parent companies.
1.1. The Importance of Innovation in the Maquiladora Industry
Most definitions of
innovation are based on the adoption of an idea or behaviour [
12], on the development of new products [
13], or on making changes in something established [
14] using the right technology [
15]. Nowadays, the innovation process is key to differentiate countries and companies. Schumpeter may have been the first economist who understood the importance of innovation and development for any country [
16]. Moreover, a recent overview of the economic importance of innovation has found that there is a close relationship between these two variables for a country [
17] and innovation is considered as a strategy for small- and medium-sized companies that must adhere to long-term plans [
18], especially in a capitalist environment, where production and consumerism are vital [
19].
Innovation and usual innovative practices are processes that can help maquiladora and other industries whose traditional markets are saturated with traditional products. Maquiladoras usually know what customers need and when due to long term forecasting process, but little modification to products can be proposed using the structural organization and production processes. In spite of this, thanks to their technical capabilities, maquiladoras can propose products with the right characteristics in a fast way, and that is a great advantage, because unfortunately the time required for the whole new product development (NPD) process is too long in a traditional company, but currently these maquiladoras have a lot experience in product changes and always must be ready to quickly switch back to their parent companies’ requirements at any time.
Fortunately, many Mexican maquiladoras now have a product department or a product development department that seeks to improve product characteristics through innovation practices and some companies have even established technical development centres that provide technical support to others in NPD. These companies seek to take advantage of their geographical location, which is a strategy for success [
9], but also a way to compete with Chinese products in the US and Canadian markets [
3]. Nevertheless, one of the most important issues concerning innovation in these maquiladoras is the way in which different critical factors are associated with the success of NPD [
20]. Therefore, this is an area that should be given special and consistent attention.
1.2. CSFs in Innovation and NPD
Because innovation and NPD for companies are a matter of strategic advantage [
21], related processes are necessary to identify their critical success factors (CSFs) or activities [
22]. Several authors have focused their attention on these CSFs. A literature review shows, for instance, that management commitment is crucial for NPD [
23,
24], since managers are highly committed to their companies’ success and survival. Other widely studied CSFs are team development skills [
23] and the internal processes that companies use to hold on to highly trained people. Likewise, authors have addressed the processes for identifying market needs [
25,
26,
27], the ability to translate those needs into a workable design to be manufactured [
26,
28], and the cultural adaptations that must be made as companies introduce the structural changes required to keep people up-to-date in a smooth development process [
25,
28].
In the context of maquiladoras in Ciudad Juárez, Hernández-Hernández, et al. [
29] recently validated three dimensions addressed in Evanschitzky, et al. [
26] as CSFs. These dimensions are product characteristics (ProdChar), market characteristics, and process characteristics (PPChar). Moreover, Martínez-Baeza, et al. [
30] validated organizational characteristics (OrgChar) and marketing characteristics, indicating that these CSFs are considered in NPD.
Finally, benefits gained from NPD for both customers and companies around the world have also been identified, and several authors have presented and discussed their evidence. The most important of these benefits are shown in
Table 1. However, the question here is whether they have been obtained by Mexican maquiladoras after innovation practices and processes.
1.3. Research Problem and Objective
According to the previous literature review, it is observed that the CSF associated with NPD have been widely studied and some authors have reported research related to any specific process during the NPD process; for example, CSF for NPD have been identified in the toy industry in Hong Kong [
38], the NPD process in Latin American countries is reported with some interactions among factors [
39], and others. There is also some research focused on establishing relationships of some CSF with some benefits in particular, such as the impact of ICT in the introduction rate of new products [
40], the effect of human resources integration and managers in the performance of new products in market [
41], the impact of learning processes about NPD and the use of new technologies in the performance of the company [
42], and the speed of NPD in the novelty of innovation [
43], among others.
However, no research has found that relates to the whole CSF in NPD process with the profits made by companies and customers. Specifically, maquiladora companies in Mexico have their own innovation and NPD practices and there is not any study associated to this matter, and research focused to this interesting area is required, due to their economic and social importance. Particularly, this research is aimed to maquiladora companies that have saturated their own markets and need to innovate with new product variants using the operational and administrative infrastructure already installed to avoid technical stoppages or dismissing skilled personnel.
This paper is aimed to report a structural equation model that integrates three latent variables identified as CSF in NPD reported by Evanschitzky, et al. [
26] and denoted as organizational characteristics, process characteristics, and product characteristics (independent latent variables) that are associated with the benefits obtained by both Mexican maquiladoras and their customers (dependent variables). The main contribution of this paper is therefore a quantitative measure of direct, indirect, and total effects indicating the dependence between the CSFs for NPD identified by Evanschitzky, et al. [
26] and the benefits gained by companies and customers. Such results will allow managers to focus on the NPD activities that are essential to ensure their success and exclude those that are trivial and, surely these findings can be applied to other countries that have important manufacturing clusters, like China, India, Malaysia, Turkey, and Brazil, among others.
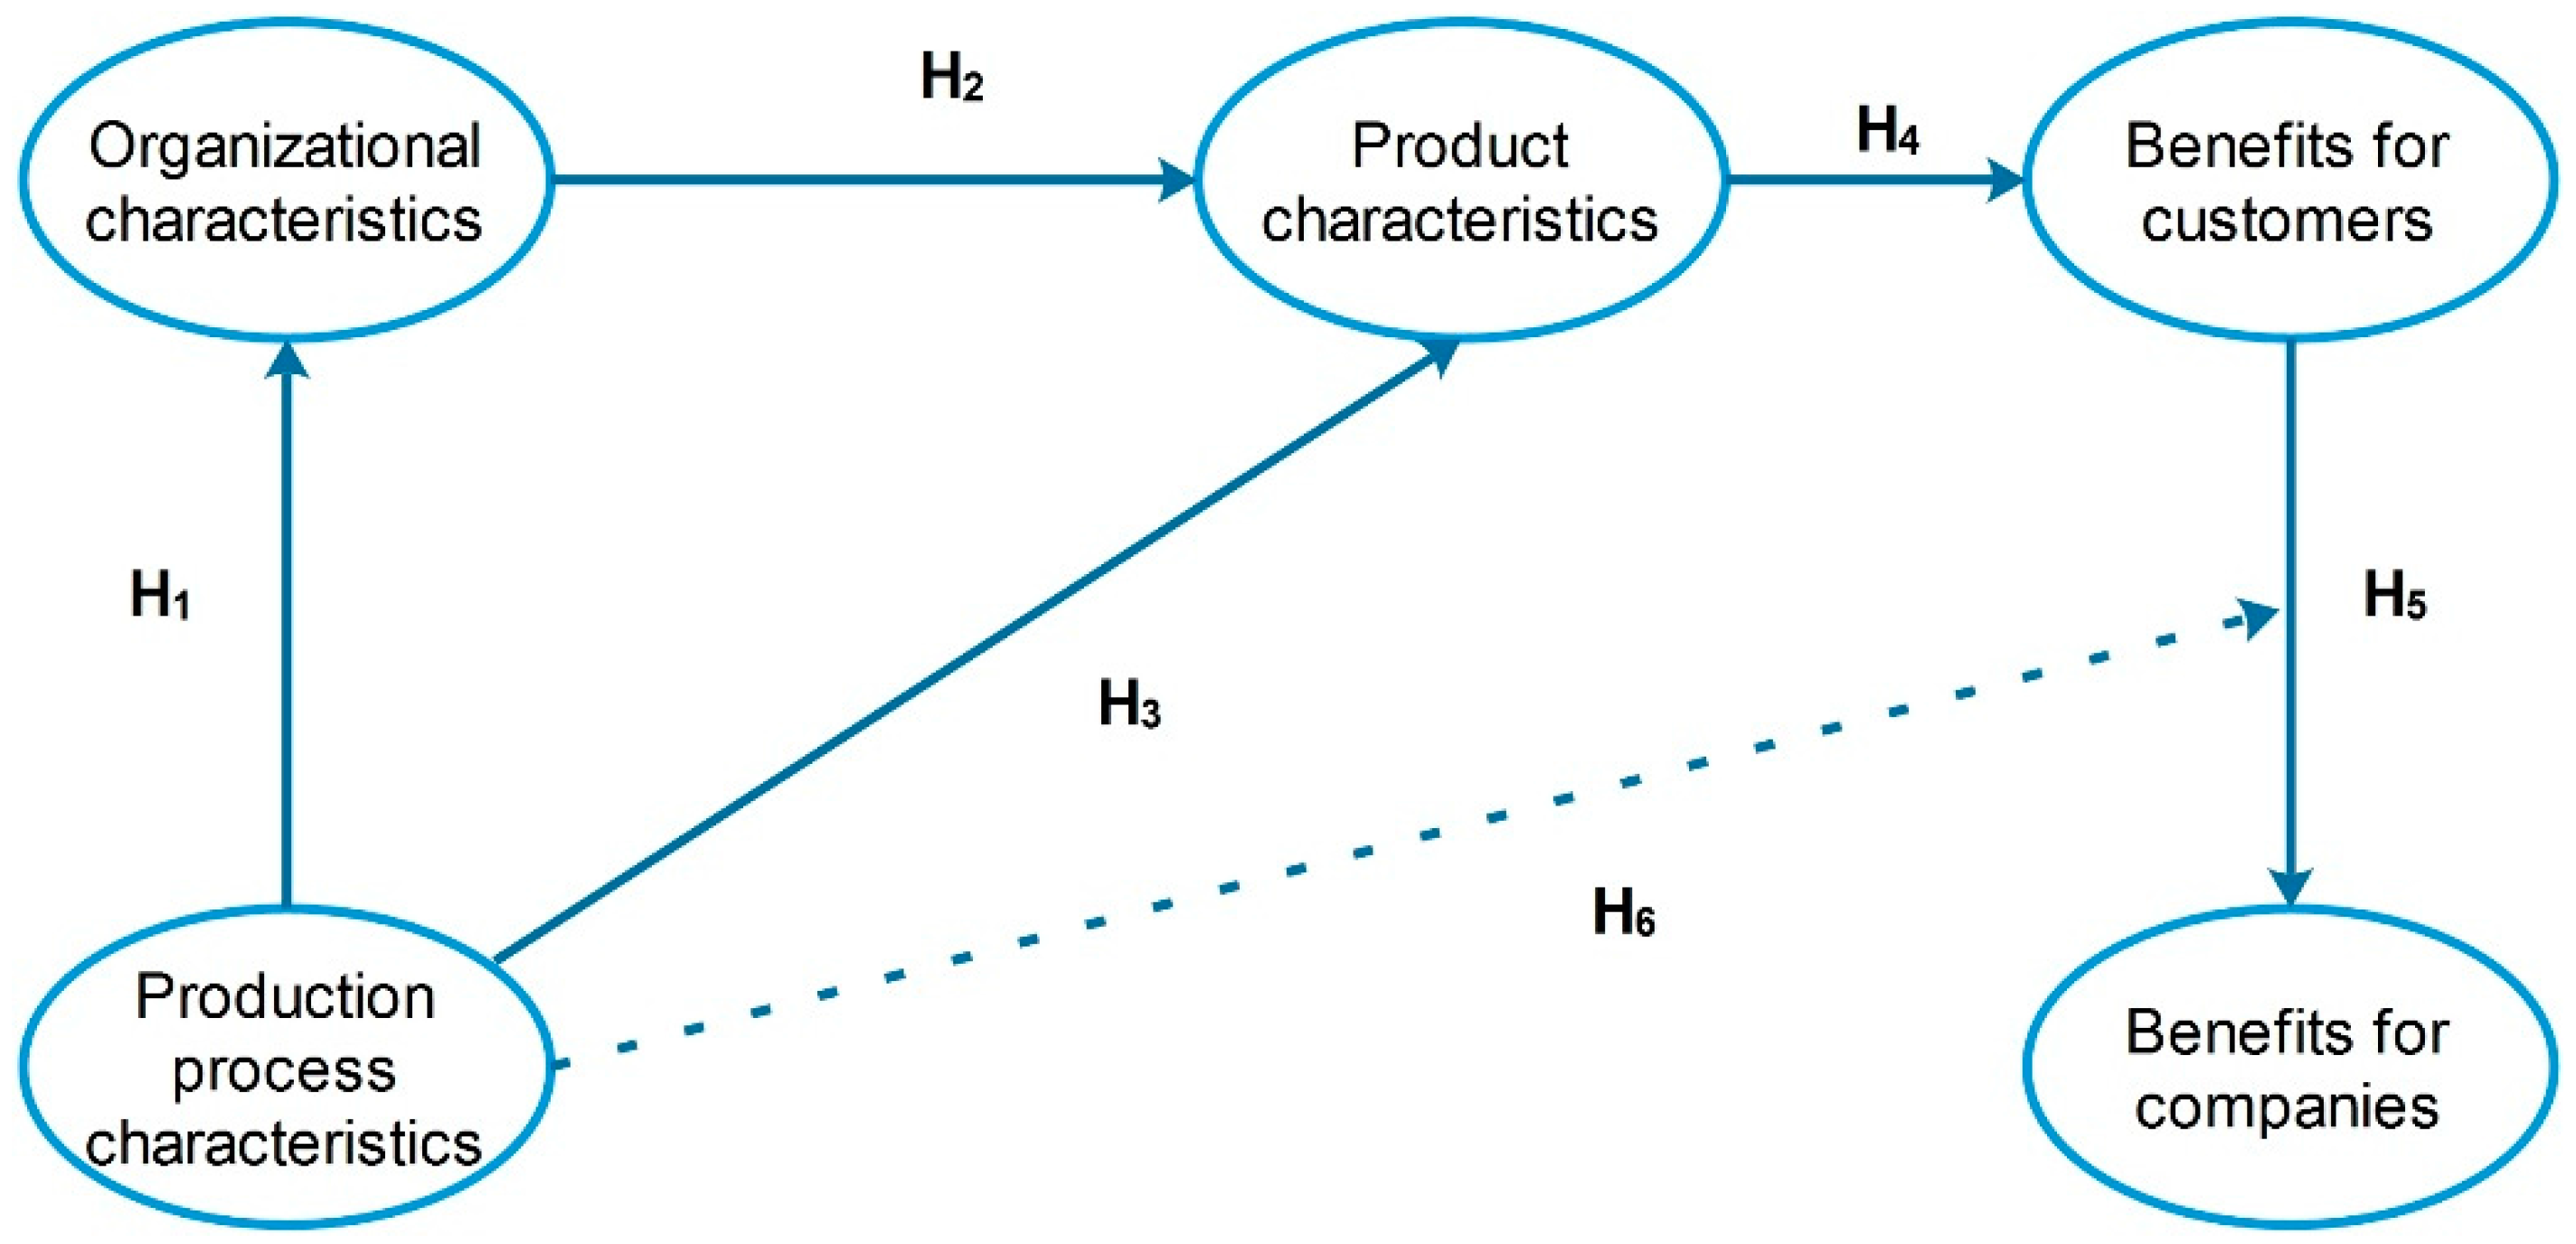
1.4. Working Hypotheses
Almost 20 years ago, Vargas and Johnson [
44] assured that maquiladoras and their production processes in Mexico offered a competitive opportunity and, possibly, an opportunity for the American market to access low price products. This is why the Mexican government nowadays provides subsidies to foreign companies, so they can acquire modern machinery [
45], and thus develop a competitive production process with advantages over other countries, such as China. However, production processes in maquiladoras are provided by the parent company and can change little in technological terms, though they can have many uses. Depending on their capabilities, maquiladoras must rapidly adapt their organizational structure in order to make fast deliveries to customers while meeting production process requirements [
46]. Thus, we propose the following hypothesis:
H1.
In the Mexican maquiladora industry production process characteristics have a direct and positive effect on organizational characteristics in the NPD process.
Maertz, et al. [
47] described the process of Mexican maquiladoras and reported that they frequently had organizational structures and production processes defined by other foreign and parent companies. These characteristics are attractive because maquiladoras are specialized in certain products [
9], so the cost of the production process is low due to large-scale orders, which is an advantage for this kind of industry [
9]. However, these companies are limited to new products that can be manufactured with the technical and organizational resources already in place. Thus, in the event of a financial crisis, if maquiladoras need to find new markets for innovative products and survive, their product characteristics will depend on the organizational characteristics and technological capabilities already installed in their production processes. This leads to the following hypotheses:
H2.
For the Mexican maquiladora industry, organizational characteristics have a direct and positive effect on product characteristics in the NPD process.
H3.
For the Mexican maquiladora industry, production process characteristics have a direct and positive effect on product characteristics in the NPD process.
Identifying CSFs for innovation is crucial for companies [
48], as they can guarantee survival. Nevertheless, any company willing to take advantage of NPD must also consider location factors [
49], build needs as features into a new product [
50], minimize customer risks [
51], and avoid all hindrances to the integration of customers into NPD [
52]. Similarly, effective communication channels between customers and the NPD team are the only way to correctly integrate customers’ opinions [
53]. Also, companies must continually assess how fast they generate these characteristics, since fast NPD may exclude features that are essential in a final product [
28,
43].
As can be seen, product characteristics are the only way to make customers buy a product and, consequently, generate benefits for the company. Moreover, customers always assess product characteristics when deciding on a purchase. From this perspective, the following hypothesis is constructed:
H4.
For the maquiladora industry, product characteristics have a direct and positive effect on benefits for customers in the NPD process.
Companies make financial profits only when customers buy their products, but customers buy a product only if they are satisfied or feel that they gain any benefit from it [
54]. This is why companies constantly make efforts to provide significant product advantages for their customers. Moreover, companies try to understand them, so they can be integrated into products [
55,
56]. Benefits for companies can then be expressed in terms of better knowledge performance [
57], technological advantage [
42], financial profits [
58], and improved risk management [
59]. Consequently, the following working hypotheses can be proposed:
H5.
For the Mexican maquiladora industry, benefits for customers have a direct and positive effect on benefits for companies in a NPD process.
H6.
For the Mexican maquiladora industry, the relationship between benefits for customers and benefits for companies in a NPD process can be moderated by production process characteristics.
The six hypotheses before described appear graphically in
Figure 1 for a better understanding.
2. Methodology
The research methodology comprises different stages, depending on the activities or tasks carried out.
2.1. Stage 1: Survey Development
The questionnaire is designed based on the literature review on CSFs for product innovation. The questionnaire contains three main sections. The first section deals with the three NPD success factors identified in Evanschitzky, et al. [
26] (independent latent variables). These factors are: production process characteristics, product characteristics, and organizational characteristics. The second section addresses the benefits obtained by customers and companies from NPD (dependent latent variables). Finally, the third section elicits demographic data from respondents.
As previously mentioned, the first section of the questionnaire contains items related to the factors reported in Evanschitzky, et al. [
26]. The section is divided into three subsections.
Product characteristics (ProdChar). Items included are: product advantage, product meets customer needs, product price, product technological sophistication, and product innovativeness.
Production process characteristics (PPChar). Items included are: structured approach, predevelopment task proficiency, marketing task proficiency, technological proficiency, launch proficiency, reduced cycle time, market orientation, customer input, cross-functional integration, cross-functional communication, and senior management support.
Organizational characteristics (OrgChar): Items included are: organizational climate, project/organization size, organizational design, external relationships, degree of centralization, and degree of formalization.
Section two of the questionnaire is divided into two subsections: Benefits for companies (
BenComp), with a total of 12 items, and benefits for customers (
BenCust), with seven items.
Table 1 shows these items.
To ensure the proper understanding of items, the questionnaire is validated by a panel of judges, including 21 NPD industrial managers and academics from the state of Chihuahua, Mexico. During this validation process, the questionnaire contains blank spaces, so that experts can suggest other activities or benefits to be included. Similarly, the survey must be answered with a Likert scale for subjective assessments. In this scale, the lowest value (1) implies that an activity is never executed in the NPD process or a benefit is never obtained, while the highest value (5) indicates that an activity is always executed during the NPD process or a benefit is always obtained.
2.2. Stage 2: Data Collection
The sample is stratified and includes only industries established in Ciudad Juárez with an NPD department. Note that the name of the NPD department varies from one company to another, although the function remains the same. The questionnaire is administered to every NPD manager as a personal interview. Three visits are made to each manager to carry out the interview. However, if these three attempts are unsuccessful, the case is discarded.
2.3. Stage 3: Information Capturing and Questionnaire Validation
Information is captured and analyzed using SPSS 21
® software [
60]. Internal consistency and reliability of each latent variable of the questionnaire are determined with the Cronbach’s alpha coefficient and a composite reliability index [
61]. For both indices, the cut-off value is 0.7 [
62]. Additional tests are conducted to improve reliability in each dimension, since when certain items are removed, reliability of a latent variable can increase [
62]. This procedure has been used in previous NPD research [
33].
At this stage, data are also screened to detect missing and extreme values in items. As regards missing values, they are replaced by the medians of items [
63], since data are obtained with an ordinal scale. However, if a survey contains more than 10% of missing values, it is discarded [
64]. As for extreme values, a standardization process is conducted for every item, considering a standardized value as an outlier if the absolute value is higher than 4 [
64].
Similarly, discriminant validity in latent variables is measured with the average variance extracted (AVE) [
65], whereas collinearity is found using the variance inflation factor (VIF). The maximum value for both indices is 3.3 [
66]. Finally, as for predictive validity, the R-squared and adjusted R-squared are used as parametric measurements, while the Q-squared is used as a non-parametric measurement [
65]. Note that Q-squared values should be similar to R-Squared values.
2.4. Stage 4: Descriptive Analysis
A univariate analysis is carried out to identify the central tendency and deviation measures in data for every item of the questionnaire. On one hand, the median or 50th percentile is obtained as a tendency measure. Thus, a high median value in an item implies that an activity is always carried out during an NPD process or a benefit is always obtained. Similarly, a low median value indicates that an activity is never carried out during an NPD process or a benefit is never obtained.
On the other hand, the interquartile range (IQR, difference between 75th and 25th percentiles) is estimated as a deviation measure. Therefore, a high IQR value reveals little consensus among respondents regarding the assessment of an activity or benefit, while a low IQR value implies low levels of data dispersion [
67], and thus greater consensus among respondents.
2.5. Stage 5: Structural Equation Model
Hypotheses are evaluated using the Structural Equation Modelling (SEM) technique. The model is run with WarpPLS 5.0
® software [
68], since its main algorithms are based on Partial Least Squares (PLS), widely recommended for small sample sizes, non-normal data, and ordinal data [
64]. Additionally, four model fit indexes are analyzed: average path coefficient (APC), average R-squared (ARS), average variance inflation factor (AVIF), and average full collinearity VIF (AFVIF). All of them have been used in previous NPD research [
69,
70]. For APC and ARS, the
p-values are analyzed to determine the model’s efficiency. In both cases the maximum
p-value must be 0.05, which means that inferences are made with a 95% confidence level. Finally, as regards AVIF and AFVIF, values lower than 3.3 are desirable.
Also, three different effects are measured in the model: direct effects, indirect effects, and total effects. Direct effects are shown in
Figure 1 as arrows connecting one latent variable to another. Indirect effects between two latent variables can be seen as paths with two or more segments. Finally, total effects are the sum of direct and indirect effects. Also, to determine their significance, all the effects include a
p-value and a β-value, considering the null hypothesis, β
i = 0, versus the alternative hypothesis, where β
i ≠ 0. Likewise, hypotheses are tested with a 95% confidence level.
Finally, the effect size is reported in each dependent latent variable. An effect size is defined as the percentage of variance in a dependent latent variable that is explained by an independent latent variable. This is very important when two or more latent variables have a direct effect on a third one [
71].
3. Results
To ensure its proper understanding, this section is divided into four subsections.
3.1. Sample Description
After three months of survey application, 197 valid questionnaires are analyzed.
Table 2 illustrates the surveyed industries and their size in terms of employees (direct and indirect jobs). Note that 118 companies have more than 1000 employees, and the automotive sector is the most prominent, with 120 participants. Finally,
Table 3 introduces the work positions and years of work experience of participants.
3.2. Survey Validation
Table 4 shows the indices used to validate the survey. For every latent variable, the table indicates the initial (II) and the final (FI) number of items, since some of them were removed to improve reliability of latent variables, or because they reported low loadings. That said, initial items were not submitted to the validation process, while the final items were reported after the validation process.
As regards composite reliability of latent variables, all values are higher than 0.7, the minimum acceptable value. Similarly, in the case of discriminant and convergent reliability, the AVE value is higher than 0.5 for each latent variable, while the collinearity test shows that VIF values are below 3.3. Likewise, R-squared, adjusted R-squared (parametric predictive test), and Q-squared (nonparametric predictive test) values are similar and higher than 0.2. This shows predictive validity in the four dependent latent variables. Finally, note that the moderated effect associated with H6 appears as PPChar*ProdChar.
Table 5 shows the correlations between the latent variables. As can be seen, the measurement instruments used far exceed the level required for discriminant validity. In every latent variable, values in parentheses representing square roots of AVEs are higher than any of the correlations involving that same latent variable, checked by column and row.
3.3. Descriptive Analysis
The descriptive analysis of the final items is organized in descending order, according to the median values, in
Table 6 for independent latent variables (characteristics), and in
Table 7 for dependent latent variables (benefits). For
Product characteristics the most important item is
Product meets customer needs, which reports the highest median (4.865), while its IQR has the lowest value for that latent variable (0.598). This shows consensus among respondents regarding the importance of the item.
Similarly, the second place is occupied by Product advantage with a median value of 4.591 and an IQR value of 0.88. This indicates that managers believe their products have notable advantages. As regards Product price, it surprisingly holds the third place, which demonstrates that managers in the Mexican maquiladora sector focus on customers when implementing a NPD project. Finally, note that all items in this latent variable have median values higher than 4, which shows that managers generally consider Product characteristics as highly important elements in a NPD process.
As for Process characteristics, the most important items are Technological proficiency and Market orientation, according to their median values. Moreover, these items also have IQRs below the unit, although Market orientation has the lowest value. This shows consensus among managers regarding its importance in a NPD project. As in the previous dimension, all items in this latent variable have median values higher than 4. This shows their crucial role in NPD.
Finally, Organizational characteristics is the only latent variable that has two variables with median values lower than 4. Also, all IQR values are higher than one, indicating that this dimension constitutes a univariate point of view of lesser importance. Based on the median values, the most important items are External relationships and Degree of formalization. This can be explained because companies must develop new products with a high sense of responsibility, considering both social and environmental impacts.
Table 7 shows the benefits obtained from a successful NPD process. Items are classified in descending order according to their median values. As regards
Benefits for companies, note that the first three places are held by market-oriented items (
Market share,
Product acceptance in the market, and
Adaptation to customer demands), while, contrary to expectations,
Generating profits is ranked fourth (even though the main reason for NPD should be to generate financial profits). Finally, it is important to observe that all items in this dimension have IQR values above one, showing moderated consensus among respondents.
All items in Benefits for customers have median values above four and IQR values above the unit. Item Product functionality is the most important with a median value of 4.37 and the lowest IQR. This demonstrates consensus among respondents regarding its median value. Similarly, Reliability holds the second place, while the third place is occupied by Product quality. Finally, Price holds the last place, which indicates that Mexican maquiladoras seek to provide functional and reliable high-quality products.
3.4. Structural Equation Model
This section is divided into different subsections. However, note that some indices and values are reported only for the final model.
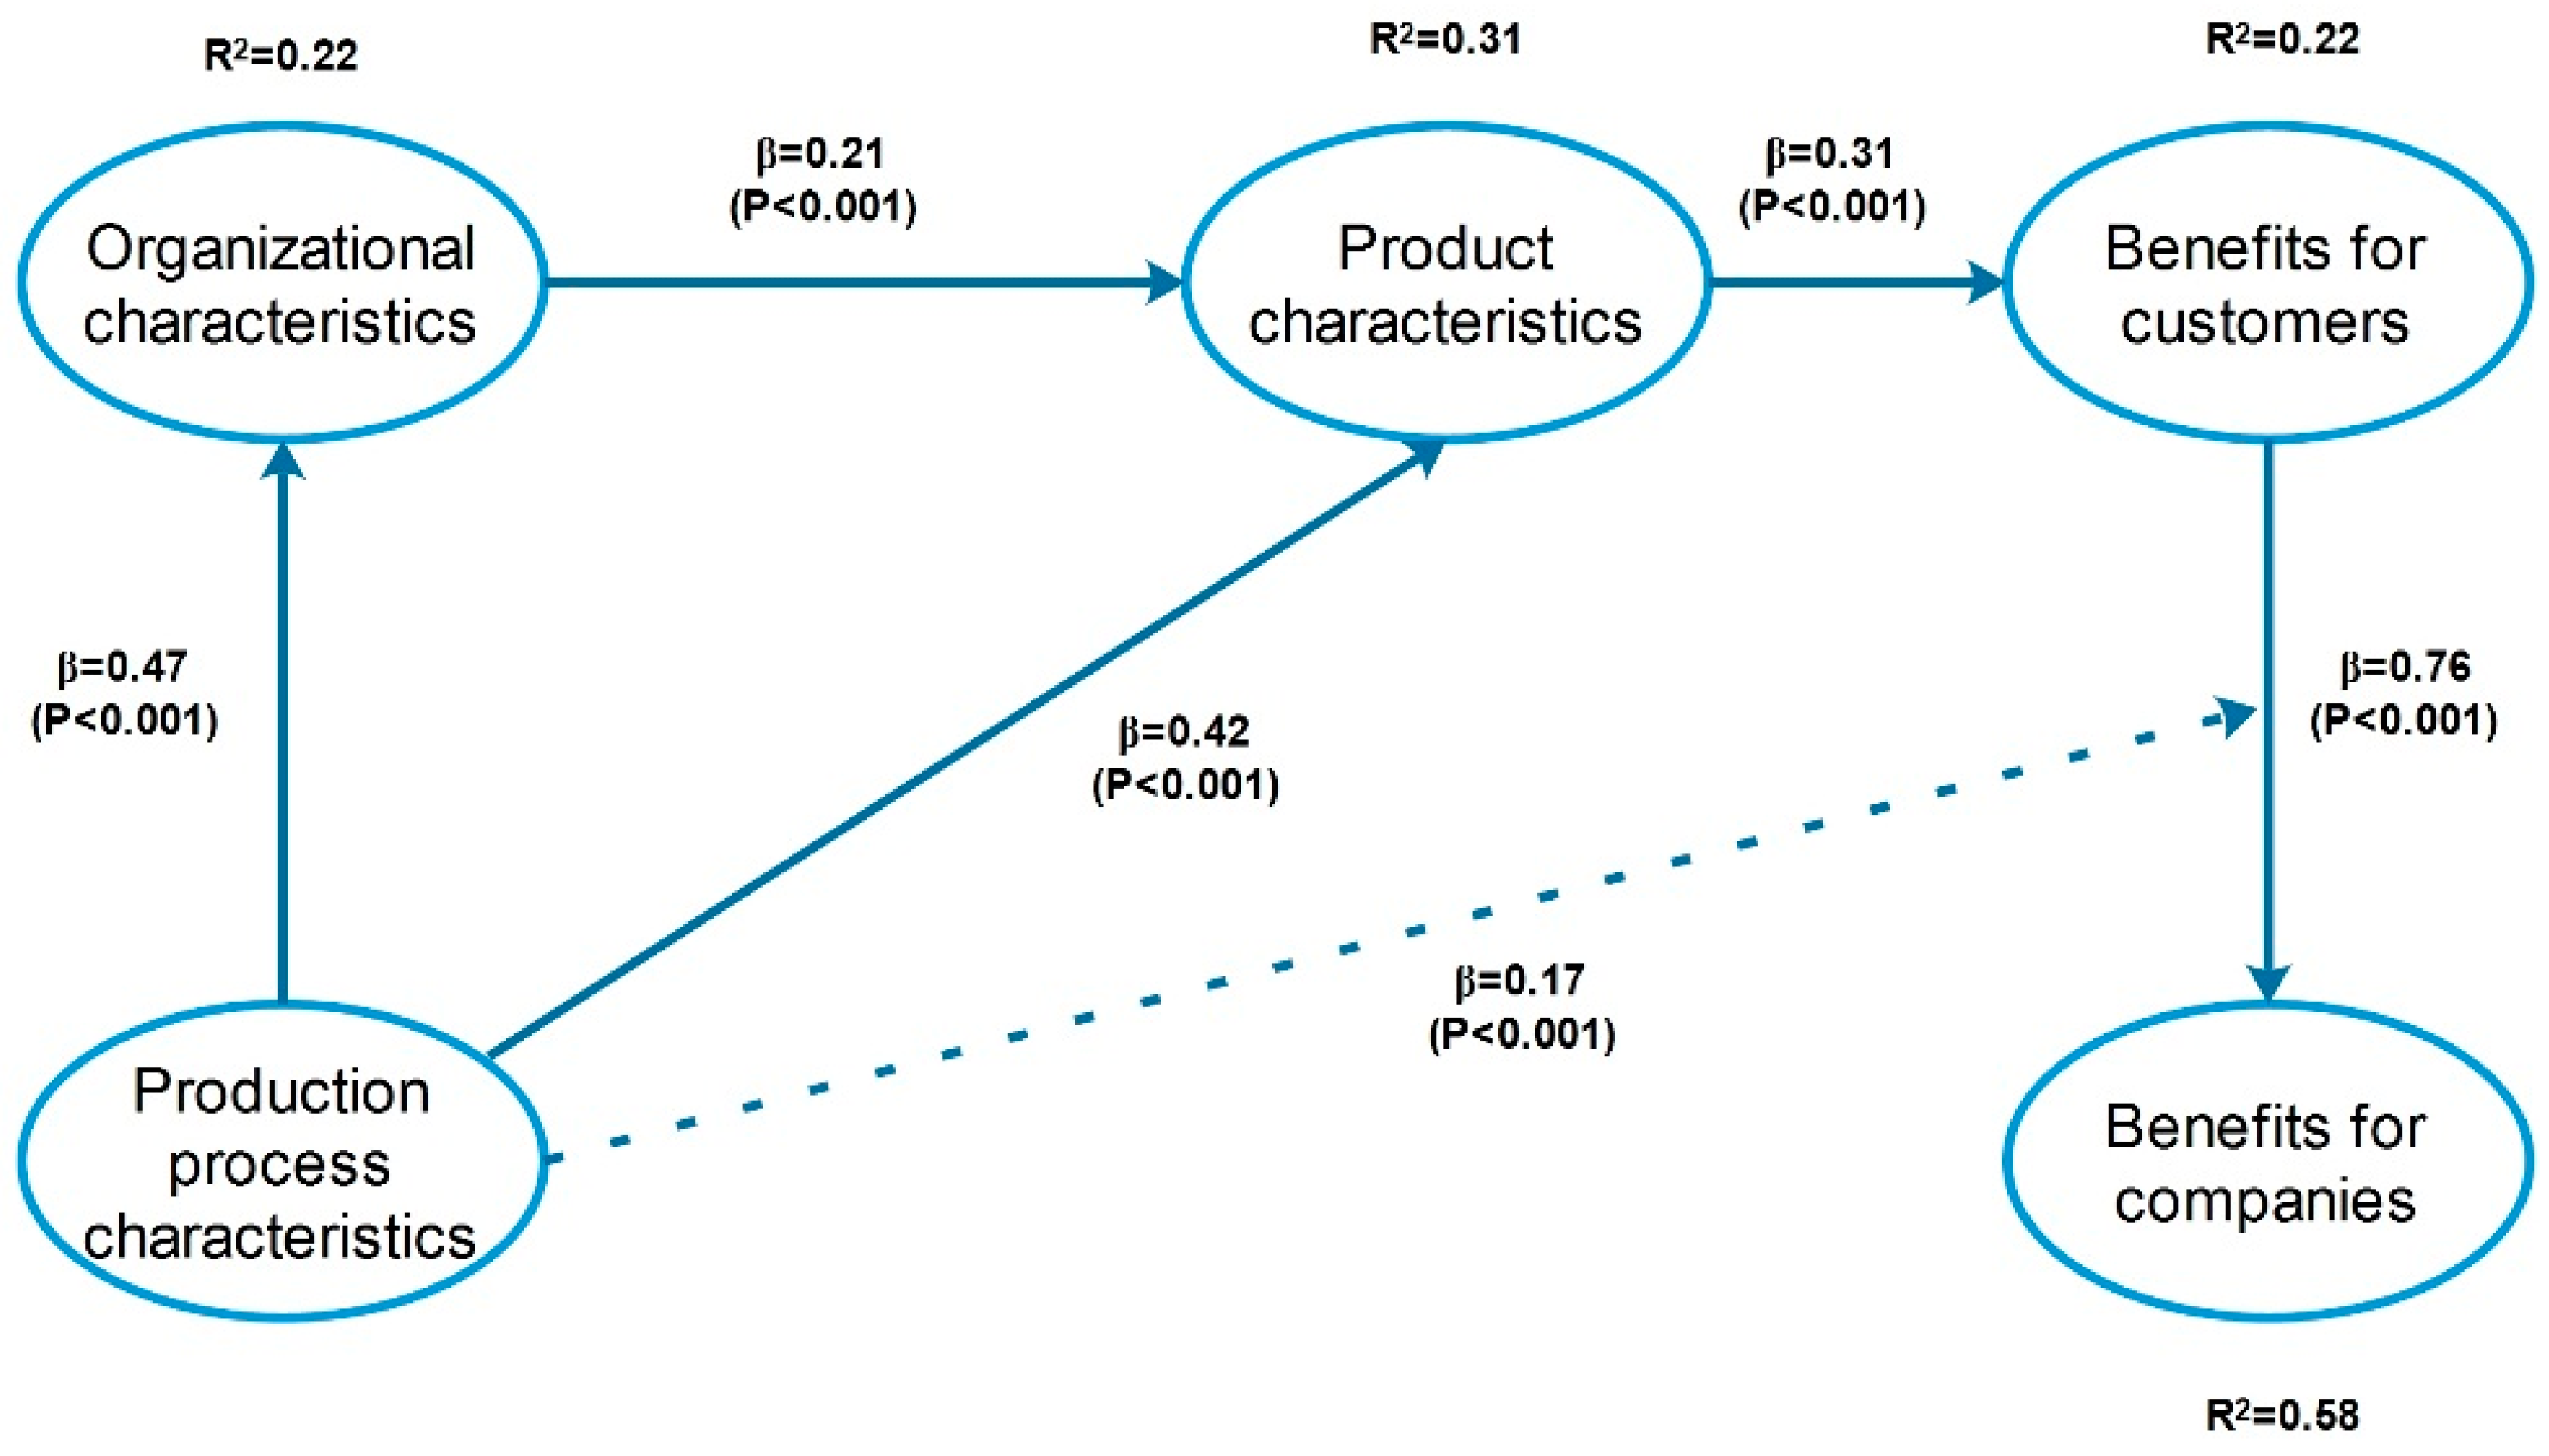
3.4.1. Direct Effects, Hypotheses Testing
The initial model in
Figure 1 was executed using WarpPLS 5
® [
68] with the methodology described in
Section 2. Each latent variable contains only the items that satisfy the validity test, which are reported in the descriptive analyses of
Table 6 and
Table 7. Results obtained for this initial model appear in
Figure 2. Every relationship between two latent variables is represented with an arrow. All relationships include a β-value and the
p-value for the statistical validation (with a 95% confidence level). Therefore, as can be observed from
Figure 2, all relationships and the moderator effect are statistically significant, since all
p-values are lower than 0.05.
Additionally, each dependent latent variable has the R-squared value to show its variance, which is explained by independent latent variables. For instance, 22% of Product characteristics is explained by Production process characteristics, while Product characteristics explains 22% of Benefits for customers, and it explains 58% of Benefits for companies.
Similarly, note that 31% of Product characteristics is explained by two latent variables: Organizational characteristics and Production process characteristics. In this case the R-squared value is decomposed into two. Thus, Organizational characteristics explains 22% of the variability, while Production processes explains 8.8%. Similarly, 22% of Benefits for customers is explained by Product characteristics and by the moderator effect. The former accounts for 14.3%, whereas the moderator effect is responsible for 7.7%.
Finally, according to the
p-values obtained, conclusions on the hypotheses stated in
Figure 1 are as it follows:
H1.
There is enough statistical evidence to confirm that Production process characteristics have a direct and positive effect on Organizational characteristics in a NPD process in the Mexican maquiladora industry, because when the first latent variable increases its standard deviation by one unit, the standard deviation of second latent variable goes up by 0.47 units.
H2.
There is enough statistical evidence to confirm that Organizational characteristics have a direct and positive effect on Product characteristics in a NPD process in the Mexican maquiladora industry, because when the former increases its standard deviation by one unit, the standard deviation of the latter also increases by 0.21 units.
H3.
There is enough statistical evidence to confirm that Production process characteristics have a direct and positive effect on Product characteristics in a NPD process in the Mexican maquiladora industry, since when the first latent variable increases its standard deviation by one unit, the standard deviation of the second latent variable goes up by 0.42 units.
H4.
There is enough statistical evidence to confirm that Product characteristics have a direct and positive effect on Benefits for customers in a NPD process in the Mexican maquiladora industry, because when the first latent variable increases its standard deviation by one unit, the standard deviation of the second latent variable goes up by 0.31 units.
H5.
There is enough statistical evidence to confirm that Benefits for customers have a direct and positive effect on Benefits for companies in a NPD process in the Mexican maquiladora industry, because when the first latent variable increases its standard deviation by one unit, the standard deviation of the second latent variable goes up by 0.76 units.
H6.
There is enough statistical evidence to confirm that the relationship between Benefits for customers and Benefits for companies in a NPD process in the Mexican maquiladora industry is moderated by Production process characteristics, because when the first latent variable increases its standard deviation by one unit, the standard deviation of the second latent variable also increases by 0.17 units.
3.4.2. Indirect Effects and Their Effect Size
Two or more segments show the indirect effects between two latent variables. Therefore, the same independent latent variable may have several indirect effects on many dependent latent variables across different segments. For the final model,
Table 8 shows the sum of indirect effects, the
p-values, and the effect size.
As can be observed in the
Table 8, five indirect effects are statistically significant, since all
p-values are lower than 0.05, the maximum value allowed, but two indirect effects are not statistically significant, since the
p-values are bigger than 0.05. Also, as regards
Product characteristics, it has an indirect effect of 0.348 units on
Benefits for companies. This implies that when the former latent variable increases its standard deviation by one unit, the latter increases by 0.348 units. Another important effect occurs between
Production process characteristics and
Benefits for companies. In this case, if the first latent variable increases its standard deviation by one unit, the standard deviation of the second latent variable increases by 0.236 units. All latent variables have an indirect effect on
Benefits for companies, except for
Benefits for customers, whose effect is direct. All indirect effects between latent variables can be similarly interpreted.
3.4.3. Total Effects
Direct and indirect effects between latent variables result in total effects.
Table 9 illustrates these total effects, their
p-values, and the effect size (ES). If there is no indirect effect, the total effect equals the direct effect. Also, if there is not direct effect, the total effect equals the indirect effect.
Based on the p-values, 11 from 12 total effects are statistically significant. The largest total effect occurs between Benefits for customers and Benefits for companies; it has a value of 0.762 units. Therefore, when the first latent variable increases its standard deviation by one unit, the standard deviation of the second latent variable also increases by 0.762 units, and it accounts for 58.1% of the total variance (ES = 0.581). This indicates that companies can obtain benefits only if they make an effort to deliver benefits to customers through well-developed products.
Another strong relationship, according to the beta values, occurs between Production process characteristics and Product characteristics, with a total effect of 0.524 units and can explain 27.3% of the total variance (ES = 0.273). This is not surprising, since Mexican maquiladora companies design their products according to their processes’ capabilities. Also, note that the relationship between Production process characteristics and Organizational characteristics has a total effect of 0.471 units and can explain 22.2% of its total variance (ES = 0.222). This proves that Mexican maquiladora companies largely depend on their production process abilities and capacities in production lines and their technological status. Finally, here is important to mention that Production process characteristics has a total effect on all the other latent variables, since it is assumed that Mexican maquiladoras begin innovation processes in accordance with their technical capabilities and the already-installed infrastructure and that is why that variable is located to the left in the proposed model and is considered the main independent variable.
4. Conclusions
Mexican maquiladora companies are characterized by sophisticated and complex production processes, which make them specialists in manufacturing certain products. However, when they are required to use these established production capabilities to generate new products, their main problem is that they do not have enough knowledge of the market for these new products, since the parent company traditionally establishes the production orders and is their main customer having a deep dependence. However, currently a lot maquiladora companies have their own NPD, engineering, or product departments that always is looking to get advantages from their modern and high technology capabilities in production process and human resources abilities or skills, and a continuous innovation process is critical to making the best use of their production lines in place when there is low demand from parent companies and effort can be focused on NPD variants.
However, there are other aspects that maquiladoras should consider when defining their new
Product characteristics. According to the structural equation model results here presented, they must not rely solely on their
Organizational characteristics and
Production process characteristics, as these two variables explain only 31% of the variability (R
2 = 0.31). Instead, they should integrate other aspects, such as the ability and skills of human resources, leadership and teamwork for NPD. Employees are in fact the main factor in the innovation process, since they are completely familiar with the capability of their machinery for converting a design into a finished product. These findings are according to reports from Hadjimarcou, et al. [
9], indicating that product characteristic identification is vital and a strategy for maquiladoras in the 21st century for breaking their dependence from parent companies. Also, that own innovation process in Mexican maquiladoras can be used for face the employment falls in that sector, due to the introduction of Chinese products [
3,
72].
Also, it is important to mention that the strongest effect between the analyzed latent variables in the model here presented occurs between
Benefits for customers and
Benefits for companies (0.76), and the independent latent variable can explain 58% of the variability, which is the largest value in the model (R
2 = 0.58). This indicates that if customers are not satisfied with the benefits gained from a new product from maquiladora industries, these companies will not be favored. This usually occurs when companies lack sophisticated marketing departments that successfully understand the need from customers or the NPD teamwork does not integrate an essential product characteristic due to any misunderstanding. Therefore, companies should strive to develop an appropriate working group and leadership for NPD process, as this deficiency can mean the difference between success and failure of these new products and specifically, thus can affect financially the maquiladora company, which uses these innovation strategies in cases of financial crisis or low demand from parent companies, and an error can worsen their financial situation [
73]. This is why the team leader has an important role [
74]. These findings indicate that product must be faster, better and cheaper for customers and this is accord to results from Swink, et al. [
75].
However, companies should not base the design of new products only on Product characteristics that salesmen have identified, since the latent variable can only explain 22% of the variability contained in Customer benefits, so it is a duty for the groups associated with NPD adding other qualities that consumers do not expect, but are valued by them.
Note that the moderator effect described in H6 shows high statistical significance, which means that the benefits for companies resulting from benefits for customers greatly depend on production process characteristics. Therefore, companies and especially Mexican maquiladora companies need to clearly define their operating capabilities in production lines, since the income from market share depends on it; moreover, it will guarantee that products are accepted in the market by customers. Finally, this research demonstrates that production process characteristics visibly affect product characteristics, since the product design must be in line with the operating capabilities already installed, but this is due to the specific case of Mexican maquiladoras. Usually, the product characteristics are identified according to demands from customers and then the production process characteristics capacities are defined for a traditional company, but maquiladoras cannot make drastic changes in their production lines because they need to be attentive to orders from parent companies.


 ,
, 


