
A Performance Evaluation of the BIM-Based Object-Oriented Physical Modeling Technique for Building Thermal Simulations: A Comparative Case Study


Abstract
:1. Introduction
2. Background and Problems
2.1. Existing Building Performance Analysis Tools
2.2. Building Information Modeling for Building Performance Analysis
2.3. Object-Oriented Physical Modeling
2.3.1. The Adaption Trend of the Modelica-Based OOPM Method in Non-Architectural Domains
- Equation-based modeling: Modelica-based OOPM models use equations instead of assigning statements. This feature enables Modelica-based OOPM to create a causal model that includes an undefined data flow direction, and therefore facilitates the reuse of created classes.
- Multi-domain modeling: Modelica-based multi-domain modeling represents and connects various physical objects from multiple domains.
- Object-oriented language: Modelica-based modeling provides an easy-to-use modeling method for developing prototypes by reusing created components.
- Software component model: Such constructs in a software component model allow for the creation and connection of components to facilitate the description of complex physical systems.
- IDEAS [42]: The IDEAS Modelica library supports the simultaneous transient simulation of electrical and thermal systems at the building and feeder levels.
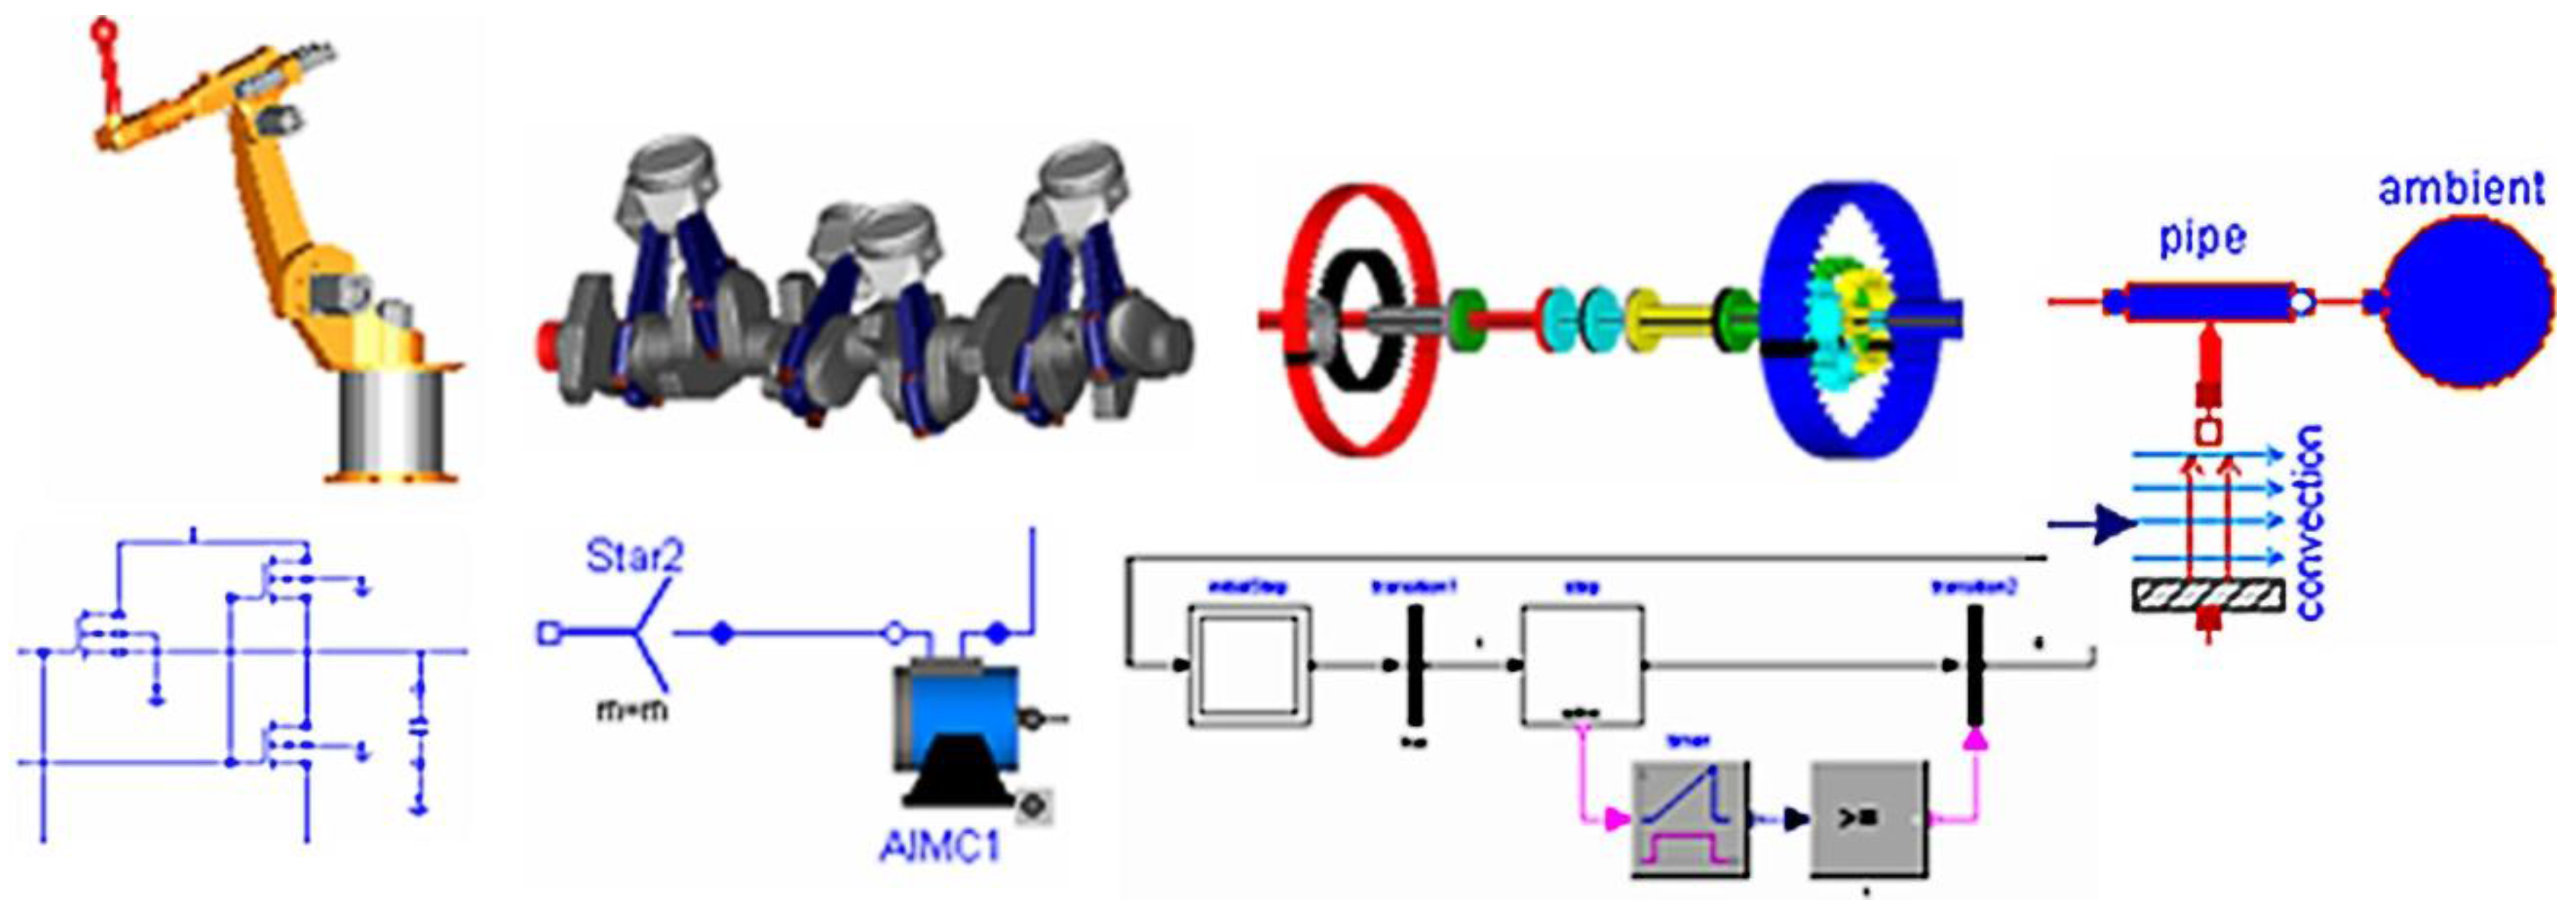
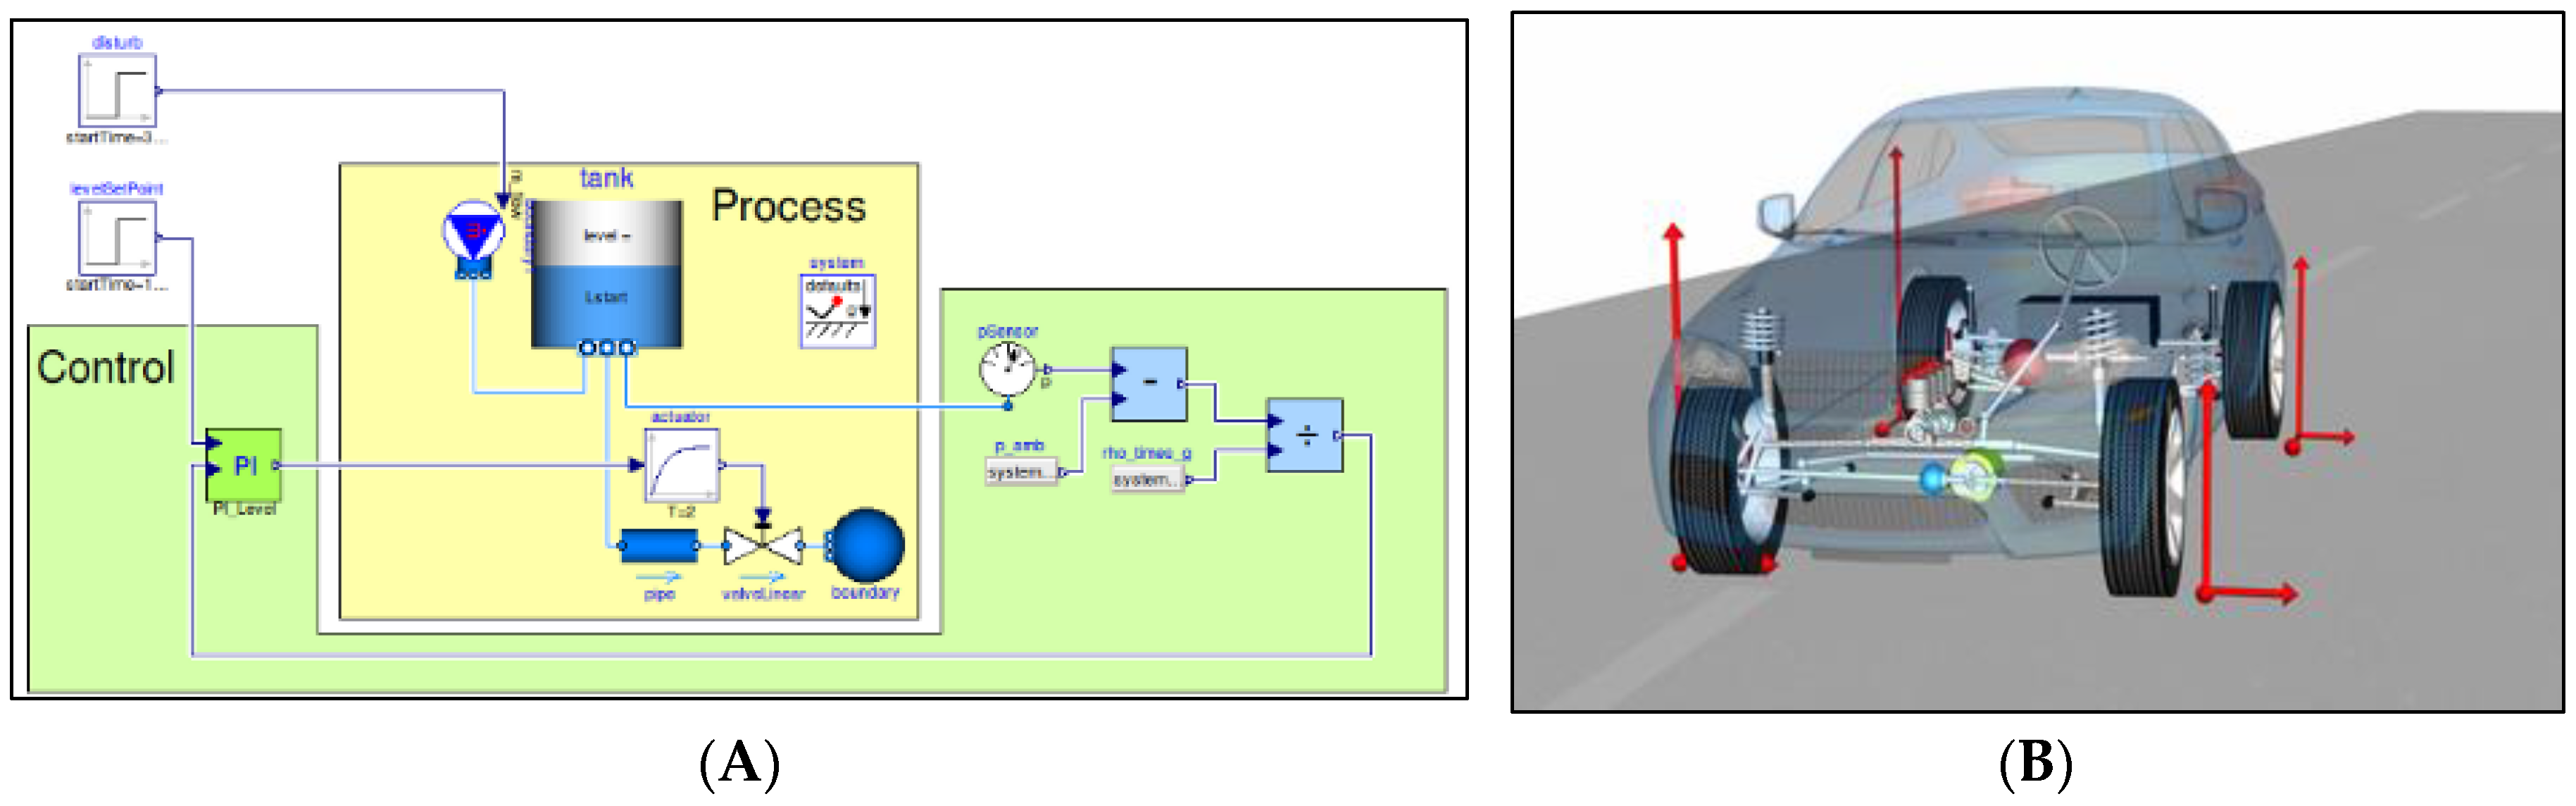
- Vehicle Dynamic Library [44]: The Modelon provides the Vehicle Dynamic Library as a commercial library that allows for the verification and optimization of vehicle systems designs at the early design stage. The library uses an implementation system and control design (see Figure 2B), and provides a multi-domain and entire multi-body simulation with real-time performance.
2.3.2. Object-Oriented Physical Modeling for Building Performance Analysis
- BuildingSystems [46,48,49]: Udk Berlin developed the BuildingSystems library as an open source for development. The library enables a modeler to model and simulate buildings and complex energy supply systems, and facilitates the transient calculations for transportation, transformation, and storage of thermal energy. The designed components and their connections in the library allow for the topological representation of simulation models.
- Modelica Buildings Library [47]: This library was developed at Lawrence Berkeley National Laboratory to support rapid prototyping and the design of building energy and control systems. The library allows modelers to conduct building performance analyses in areas such as air conditioning systems, heating and ventilation, multi-zone air flow, heat transfer between multiple zones, and contaminant transport.
2.4. Challenges in Data Translation between BIM and Modelica-Based OOPM
2.4.1. Mismatched Object Relationships and Semantics
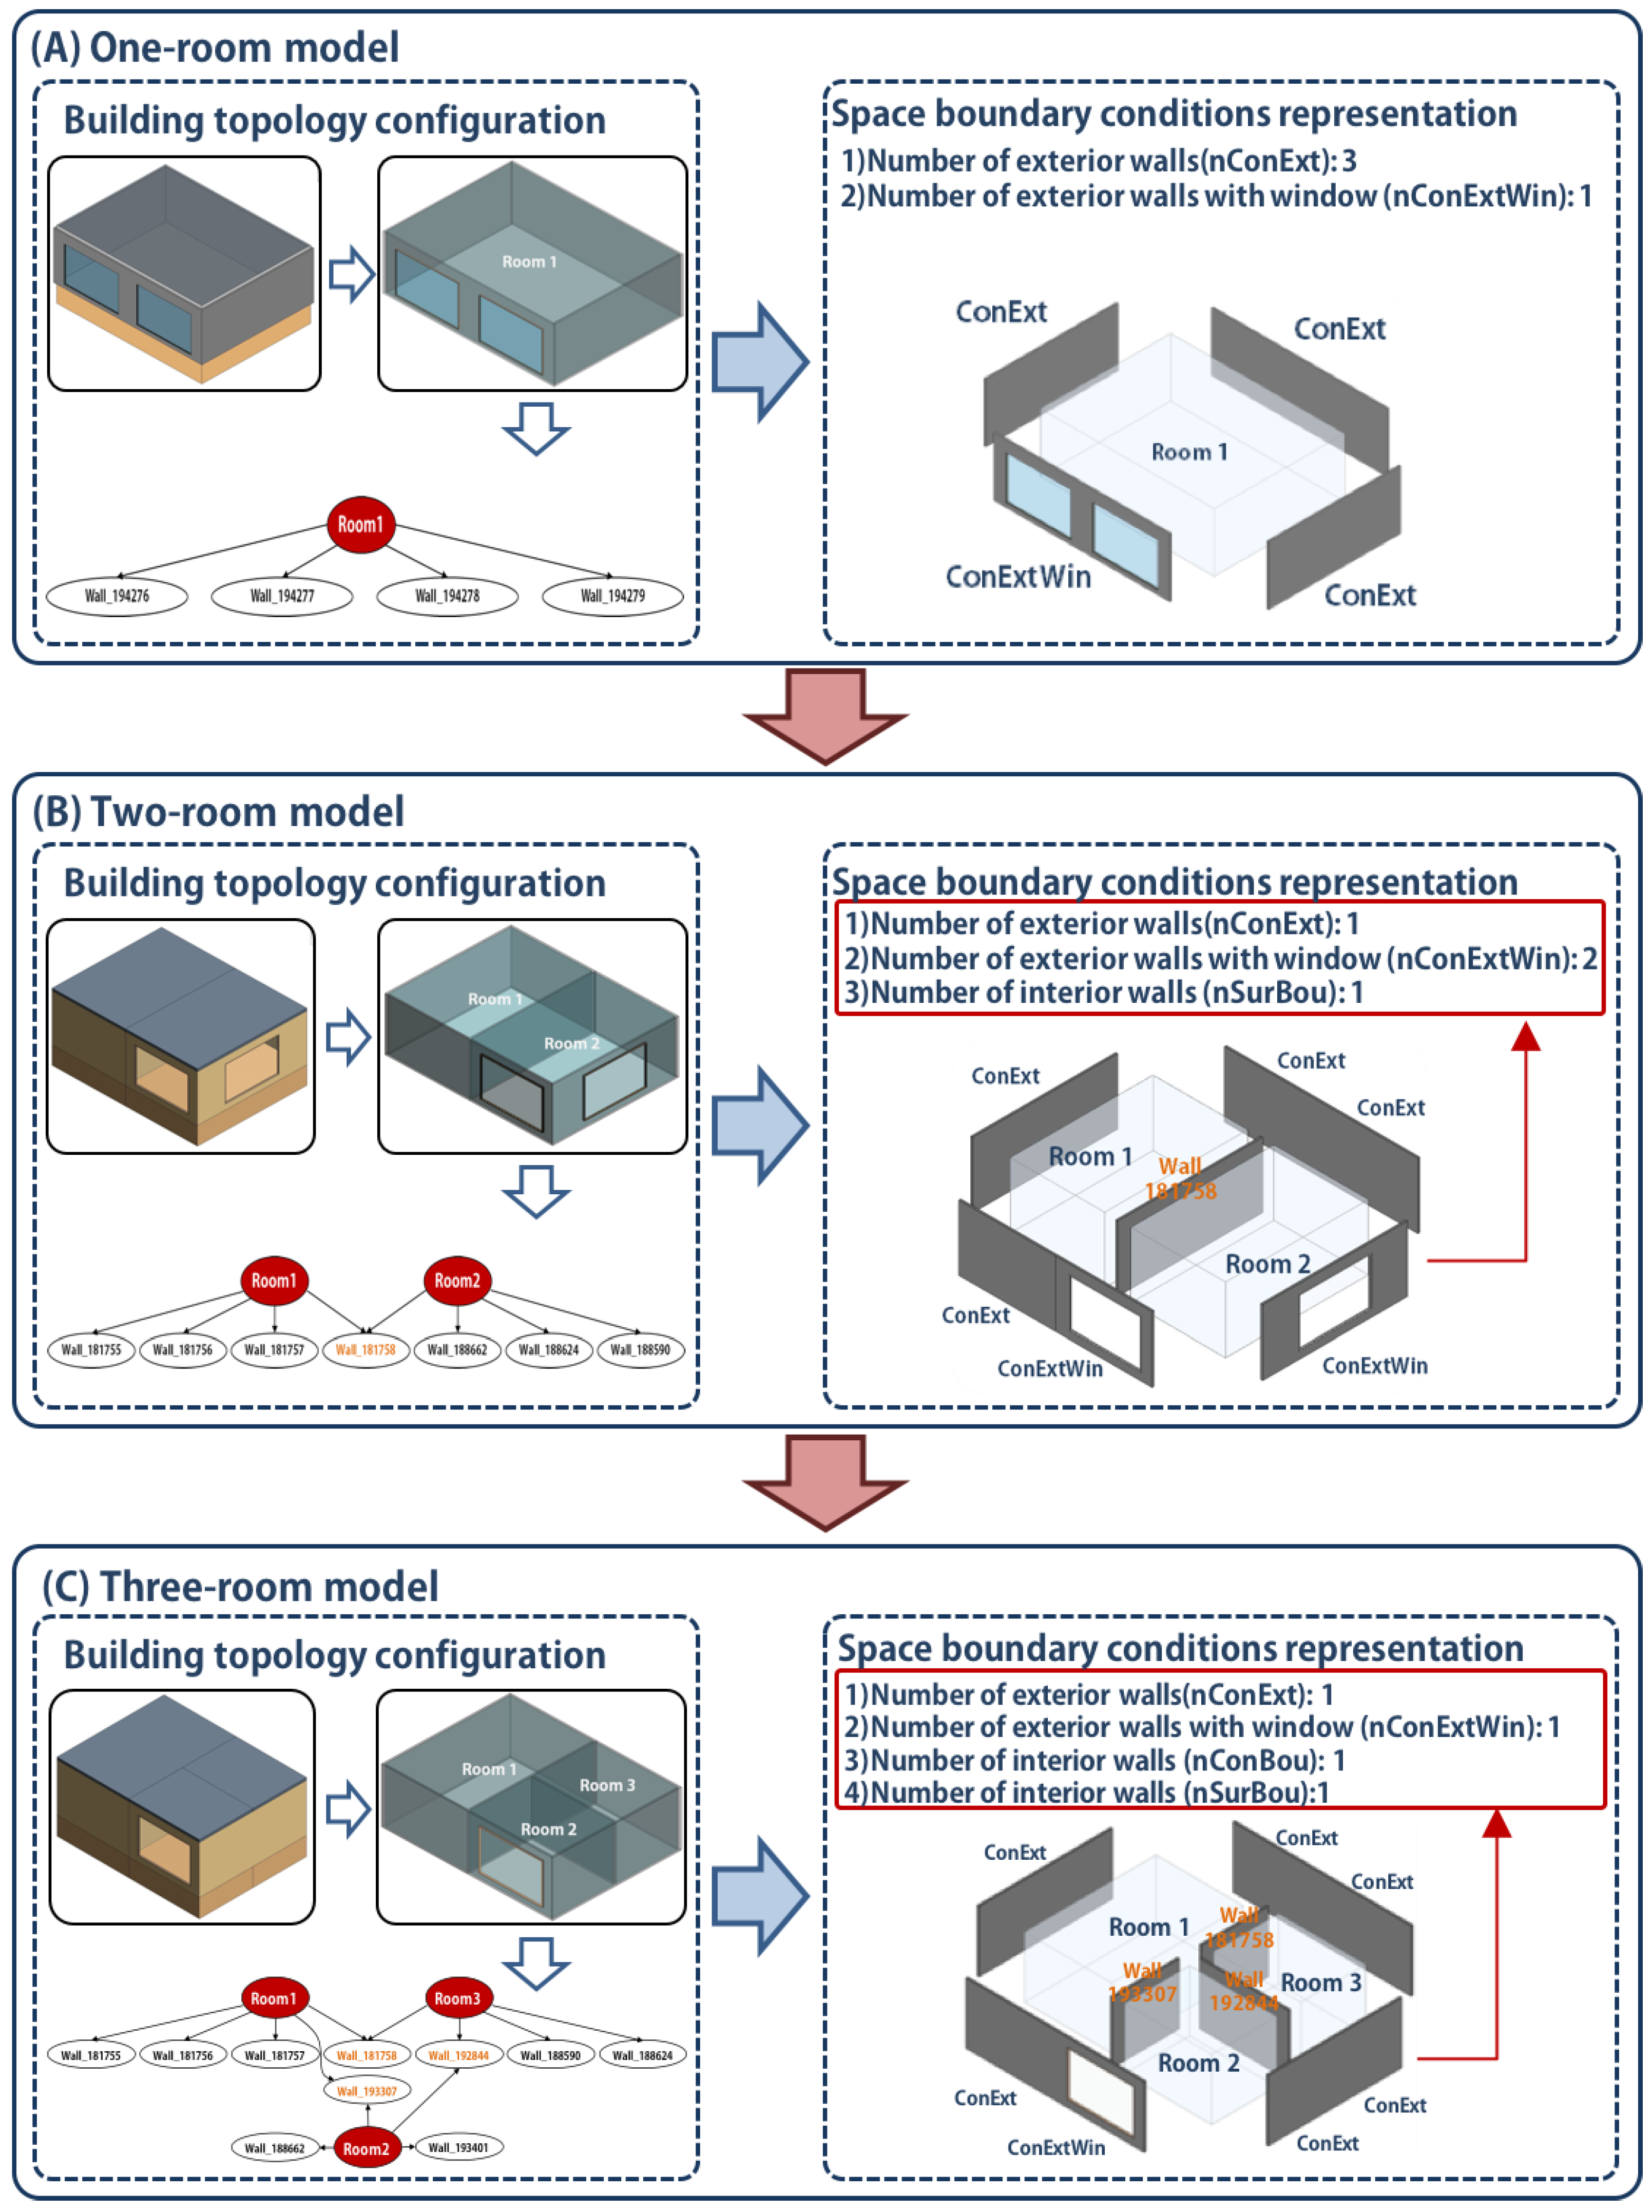
2.4.2. Building Topology Translation
3. Methodology
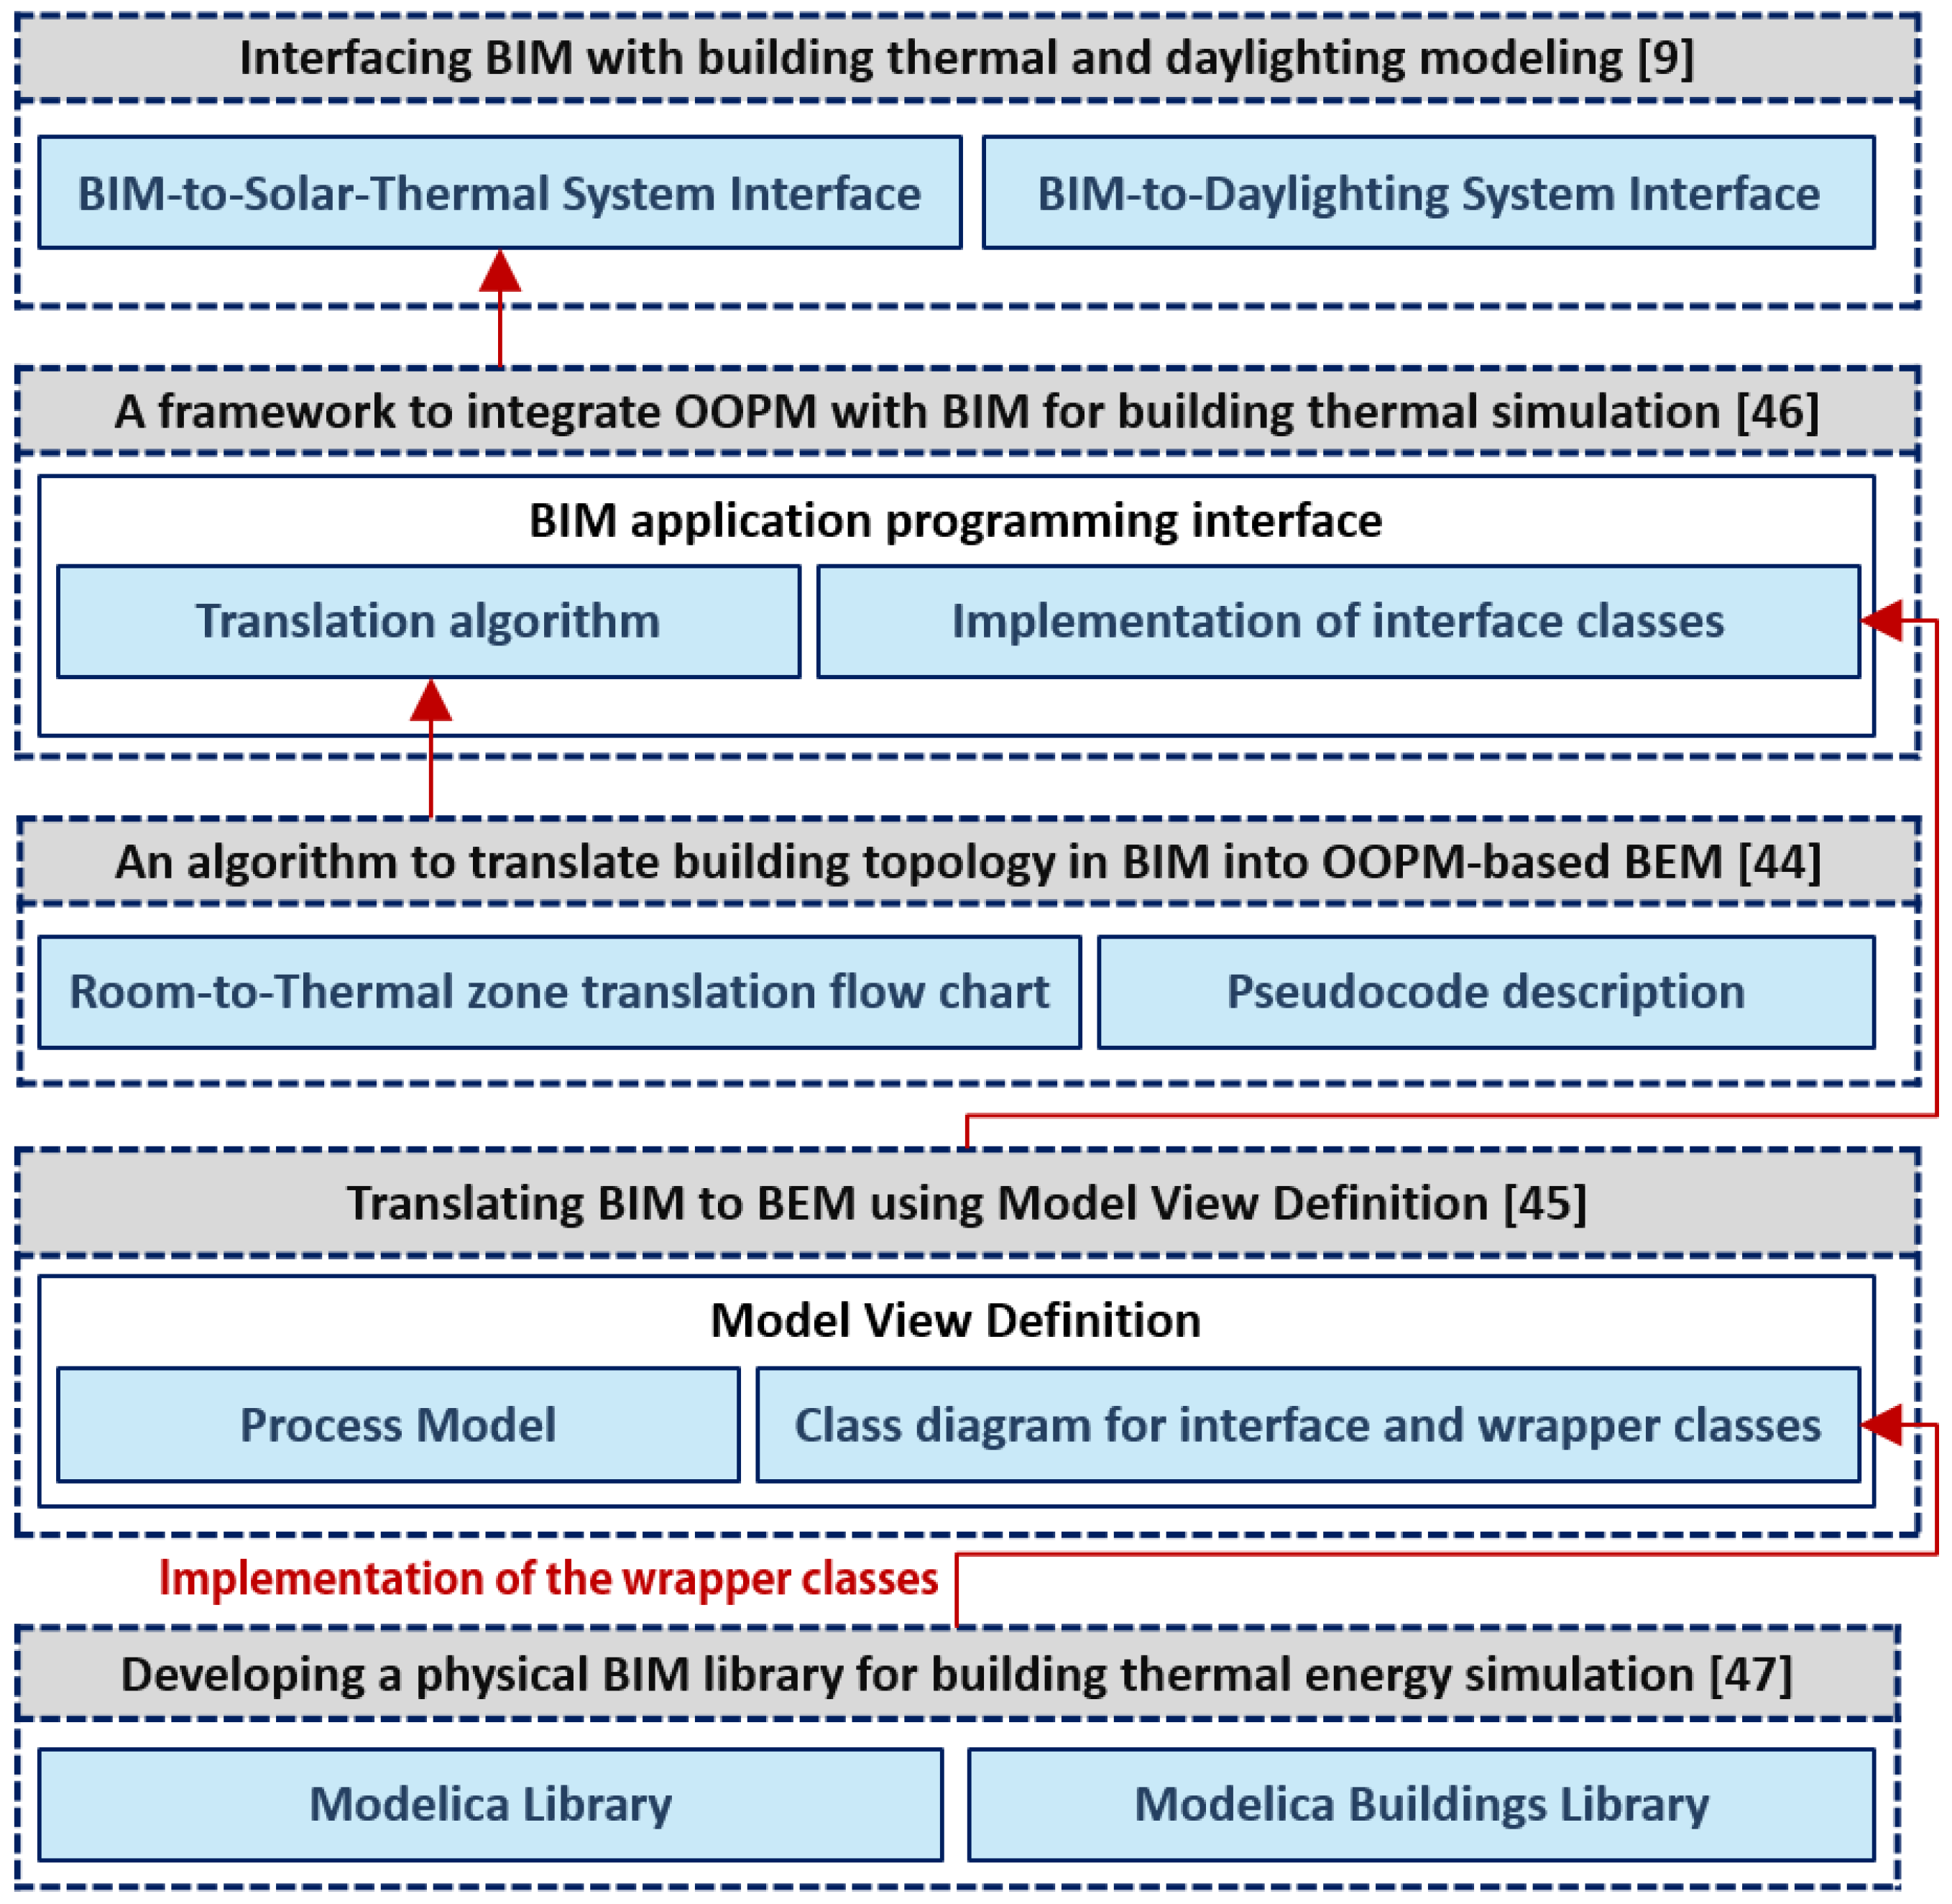
- Interfacing BIM with building thermal and daylighting modelingYan, et al. [9] developed system interfaces for supporting integrated BIM and BEM building thermal and daylighting simulations using a BIM application’s programming interface (API).
- Translating BIM to BEM using Model View DefinitionJeong, et al. [52] developed a data model using a Model View Definition to support the model translation between BIM and Modelica-based BEM; they defined object mapping and the information required in the translation.
- Developing a physical BIM library for building thermal energy simulation
- A framework to integrate OOPM with BIM for building thermal simulationJeong, et al. [53] demonstrated an automated framework for integrating BIM and Modelica-based BEM using BIM API and the Modelica library [54]; it simulates building energy performance and visualizes energy analysis results back into Revit, the BIM authoring tool, to provide immediate feedback to designers.
- An algorithm to translate building topology in BIM into OOPM-based BEMJeong, et al. [51] created an algorithm to translate building topology in BIM into OOPM-based BEM using an object-oriented programming approach; it supports efficient object mapping of building objects in BIM into space boundary conditions in OOPM-based BEM. The implementation of the algorithm allows building topology to be translated into space boundary conditions to create an OOPM model.
4. Case Study
4.1. Building Topology Translation into Space Boundary Conditions
4.1.1. Reference Model Creation for the Test Cases: Creation of the Basic Building Models
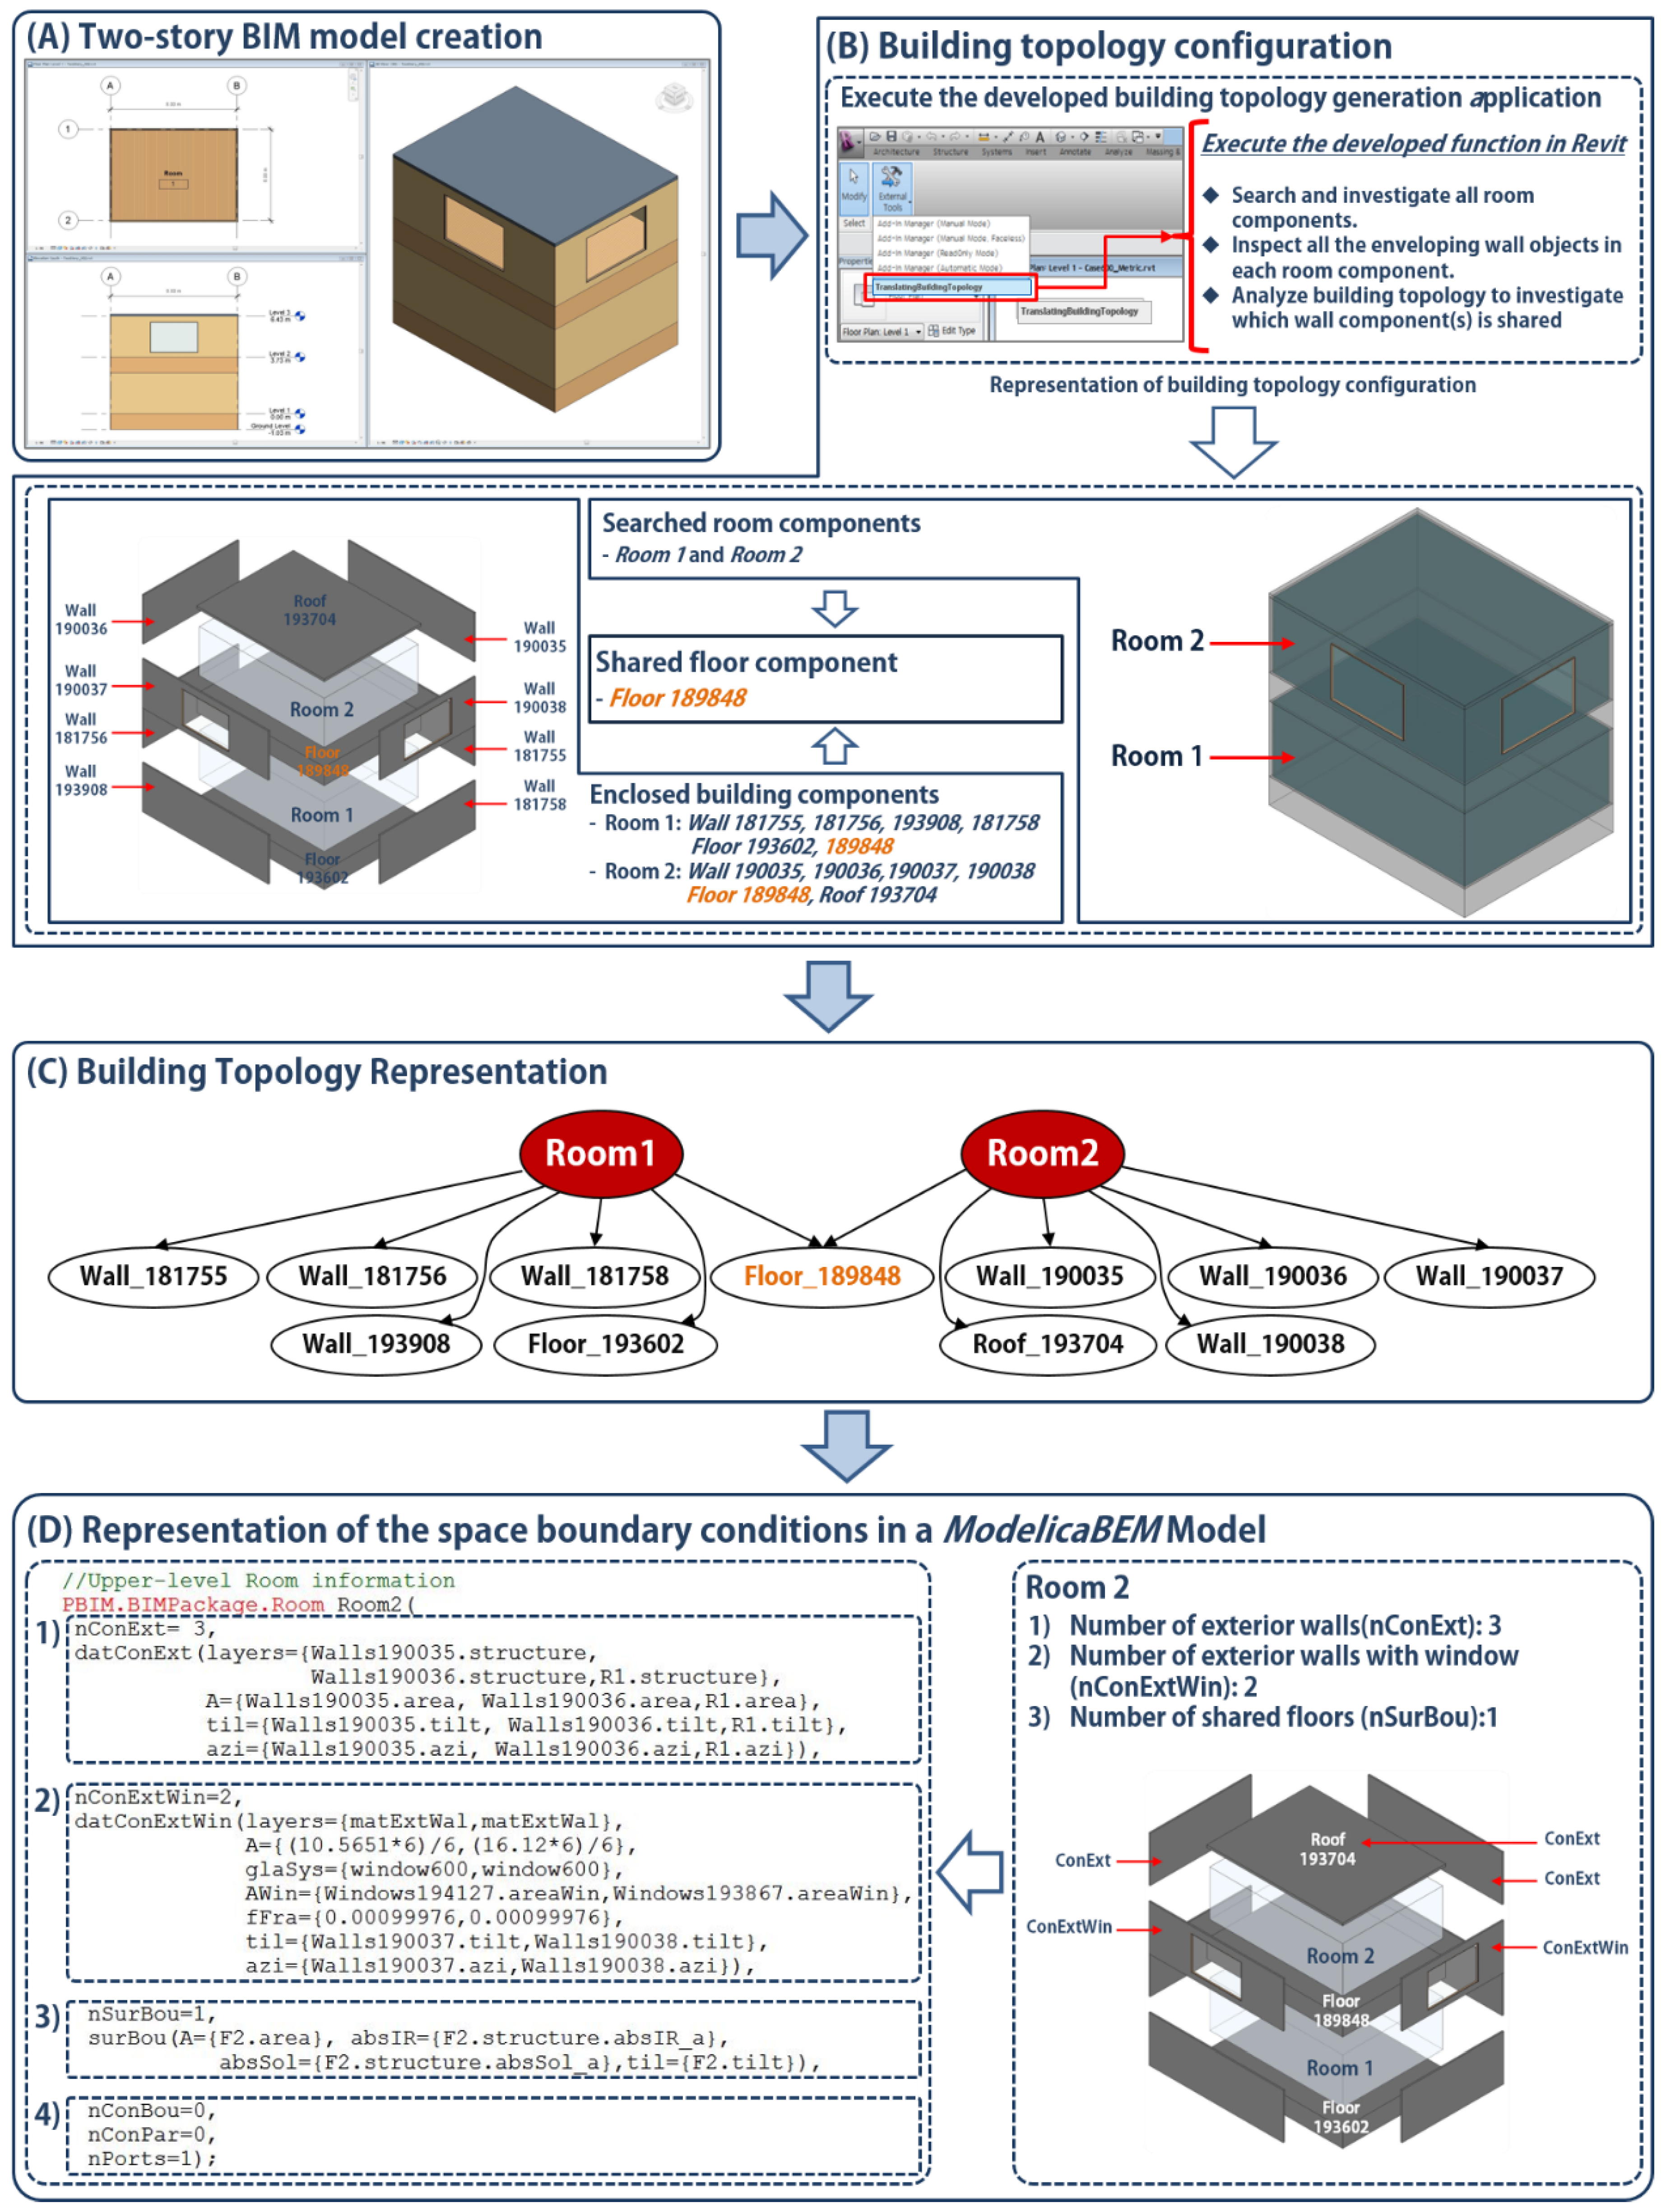
4.1.2. Test Case 1: Two-Story Building Model with Two Windows
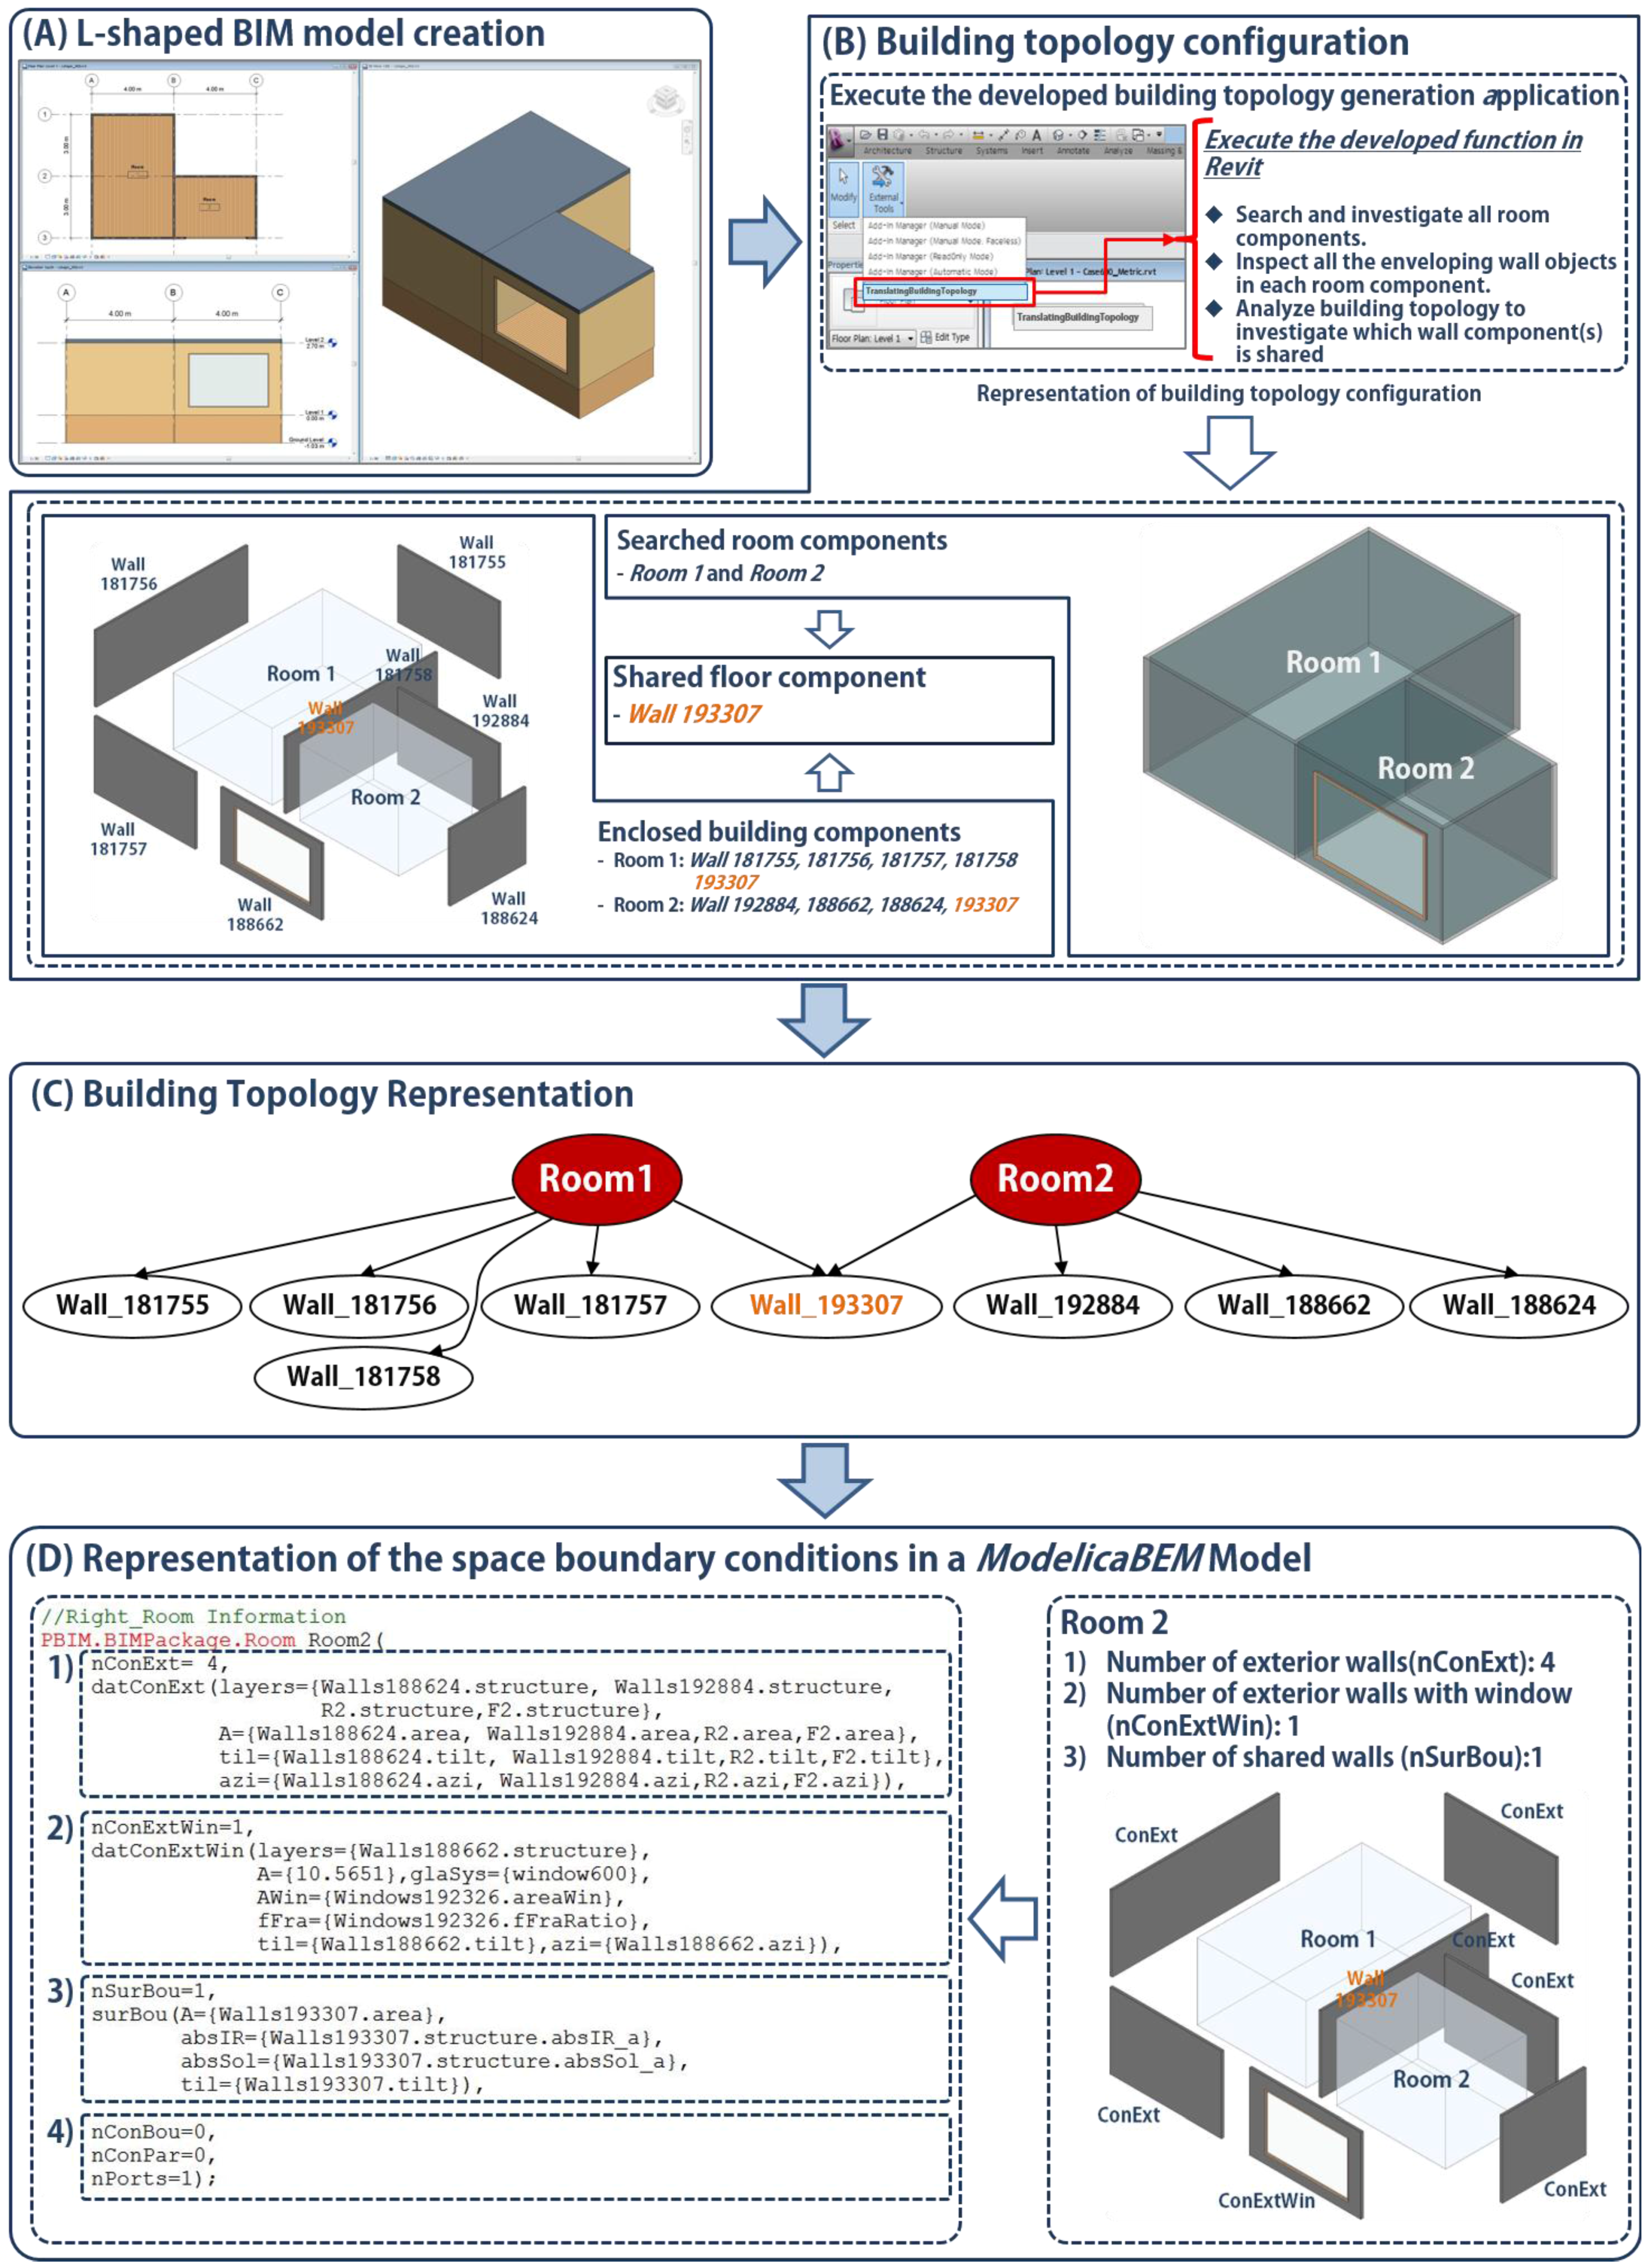
4.1.3. Test Case 2: L-Shaped Building Model with a Window
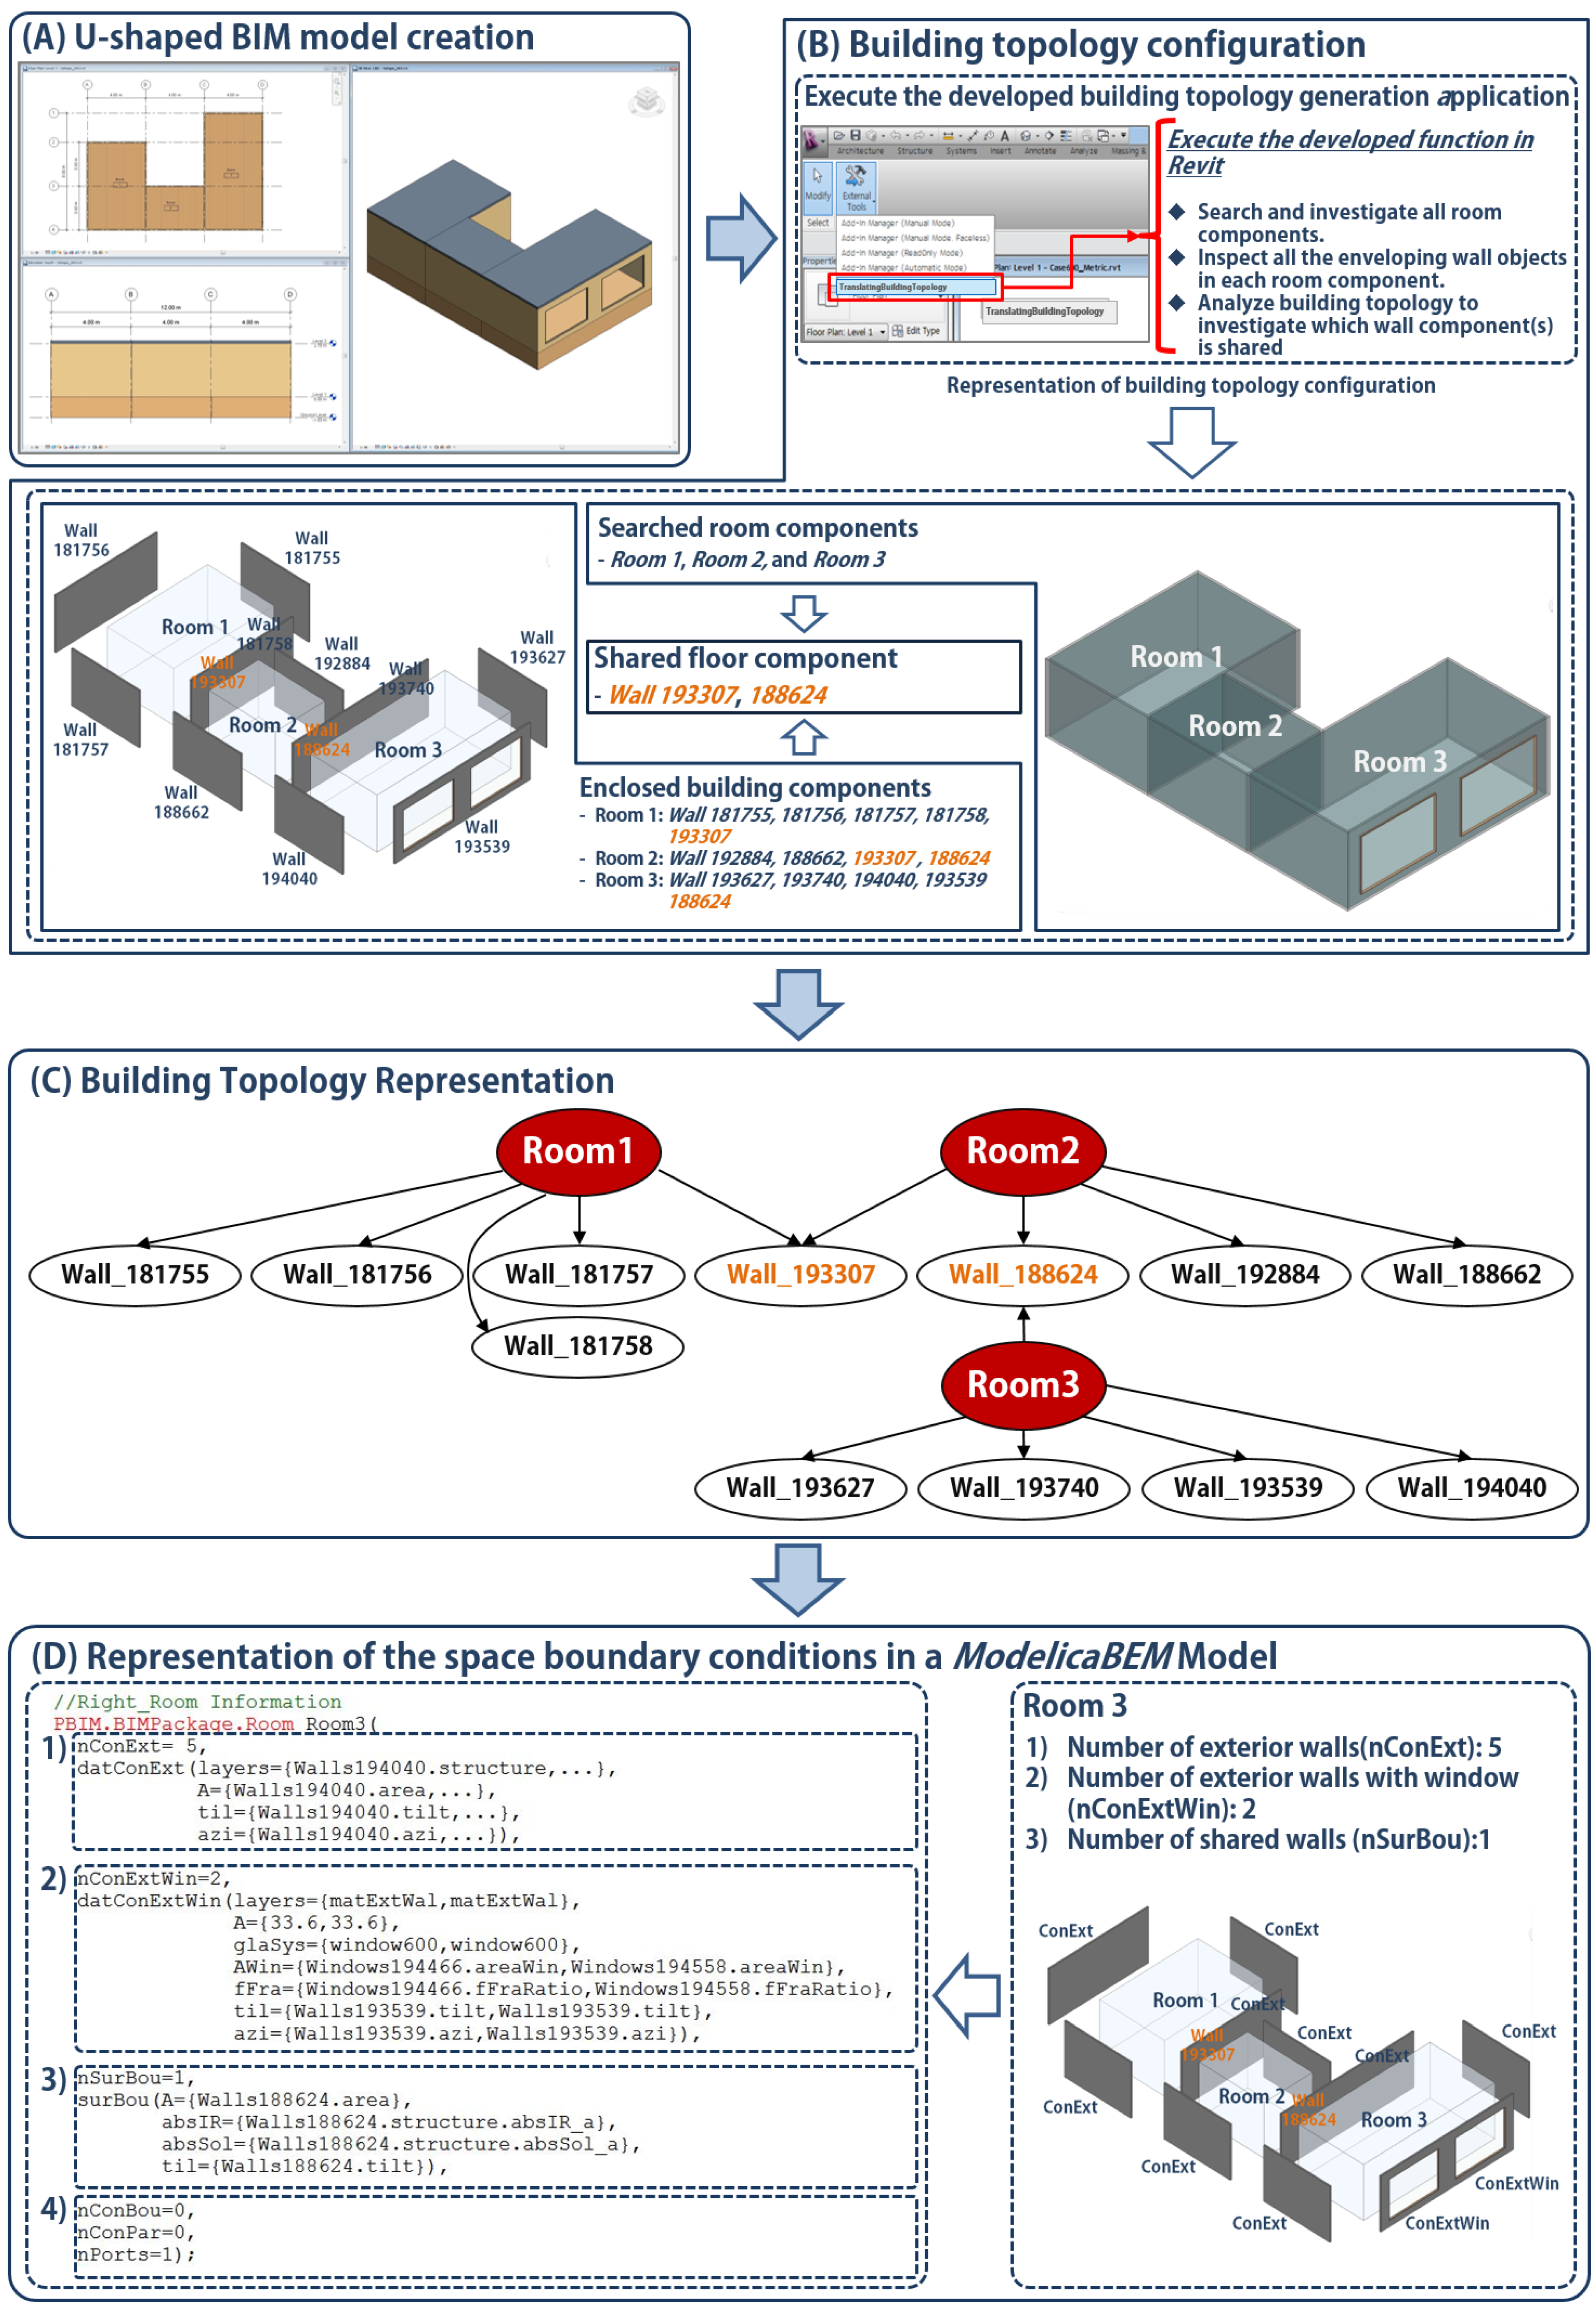
4.1.4. Test Case 3: U-Shaped Building Model with Two Windows
4.2. Simulation Results Comparisons for Each Case
- The building models had no doors and consisted of building components such as exterior walls, a roof, and windows that were 6 m2.
- No internal heat gain from equipment or occupants was included in the model.
- The building had no shade and was light in weight.
- The first floor of the building model was above ground and detached from soil.
- The simulation location of the building model was Denver, Colorado, US.
- No HVAC system was installed.
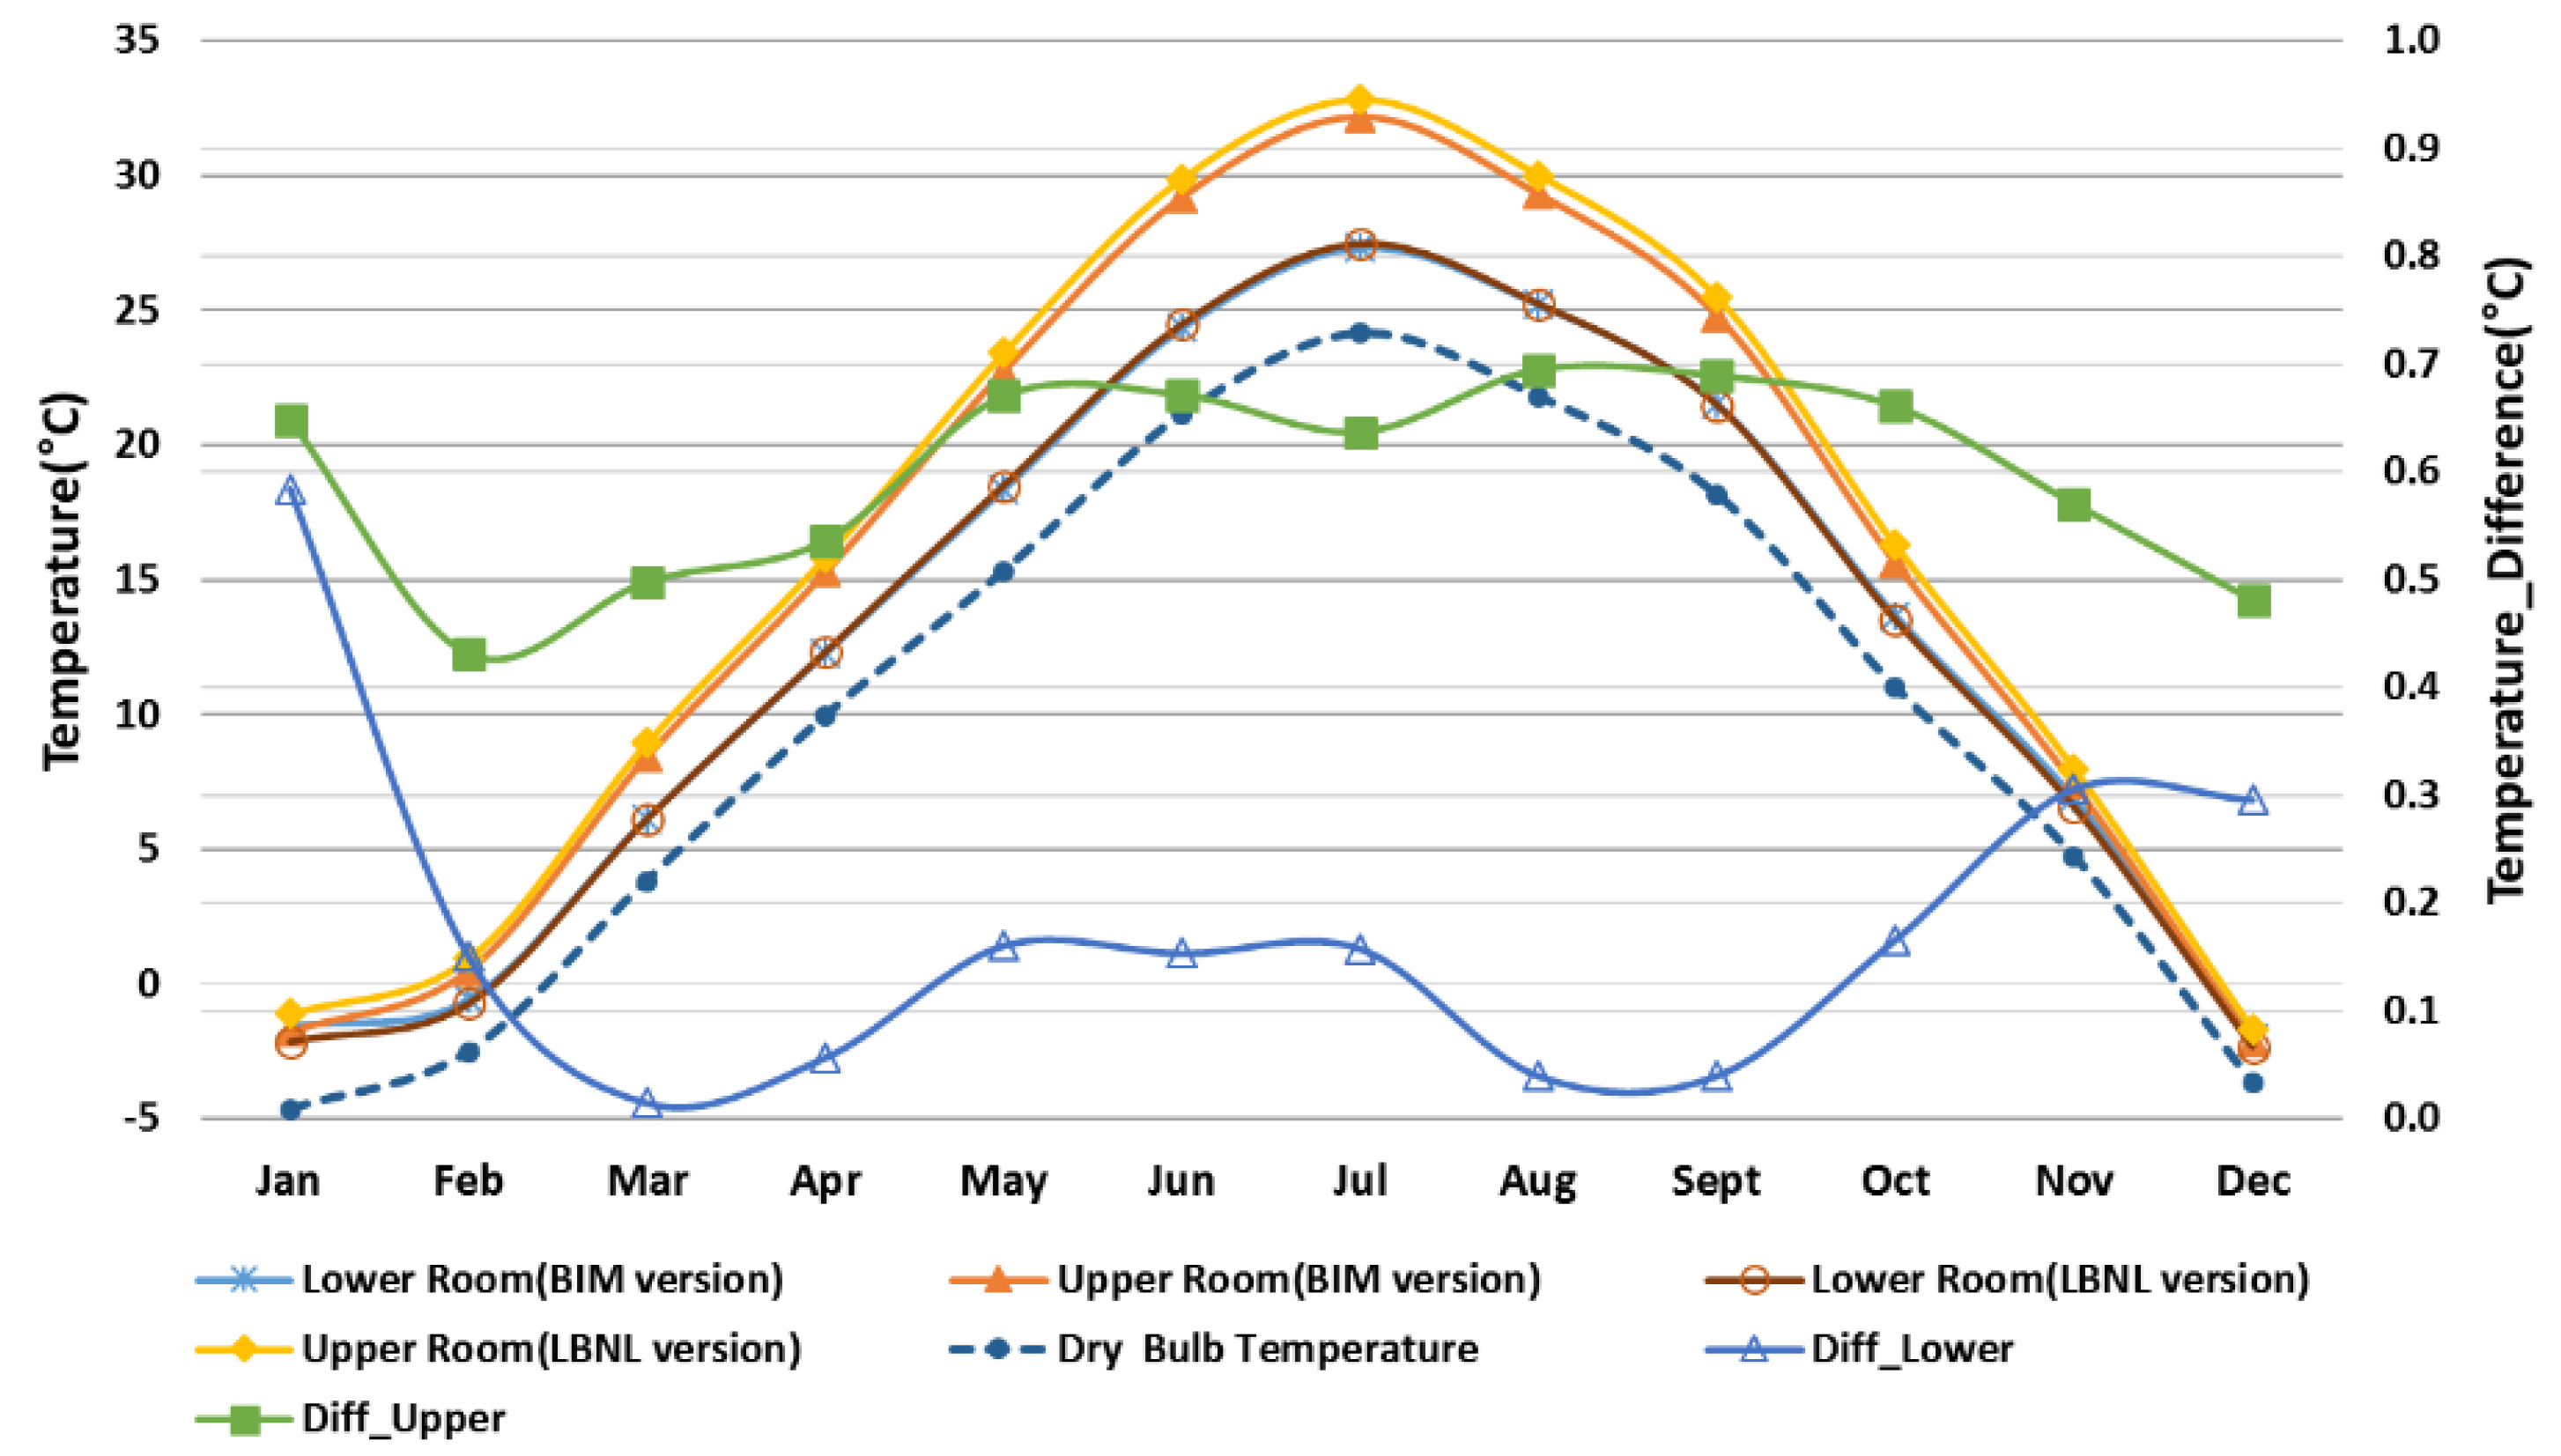
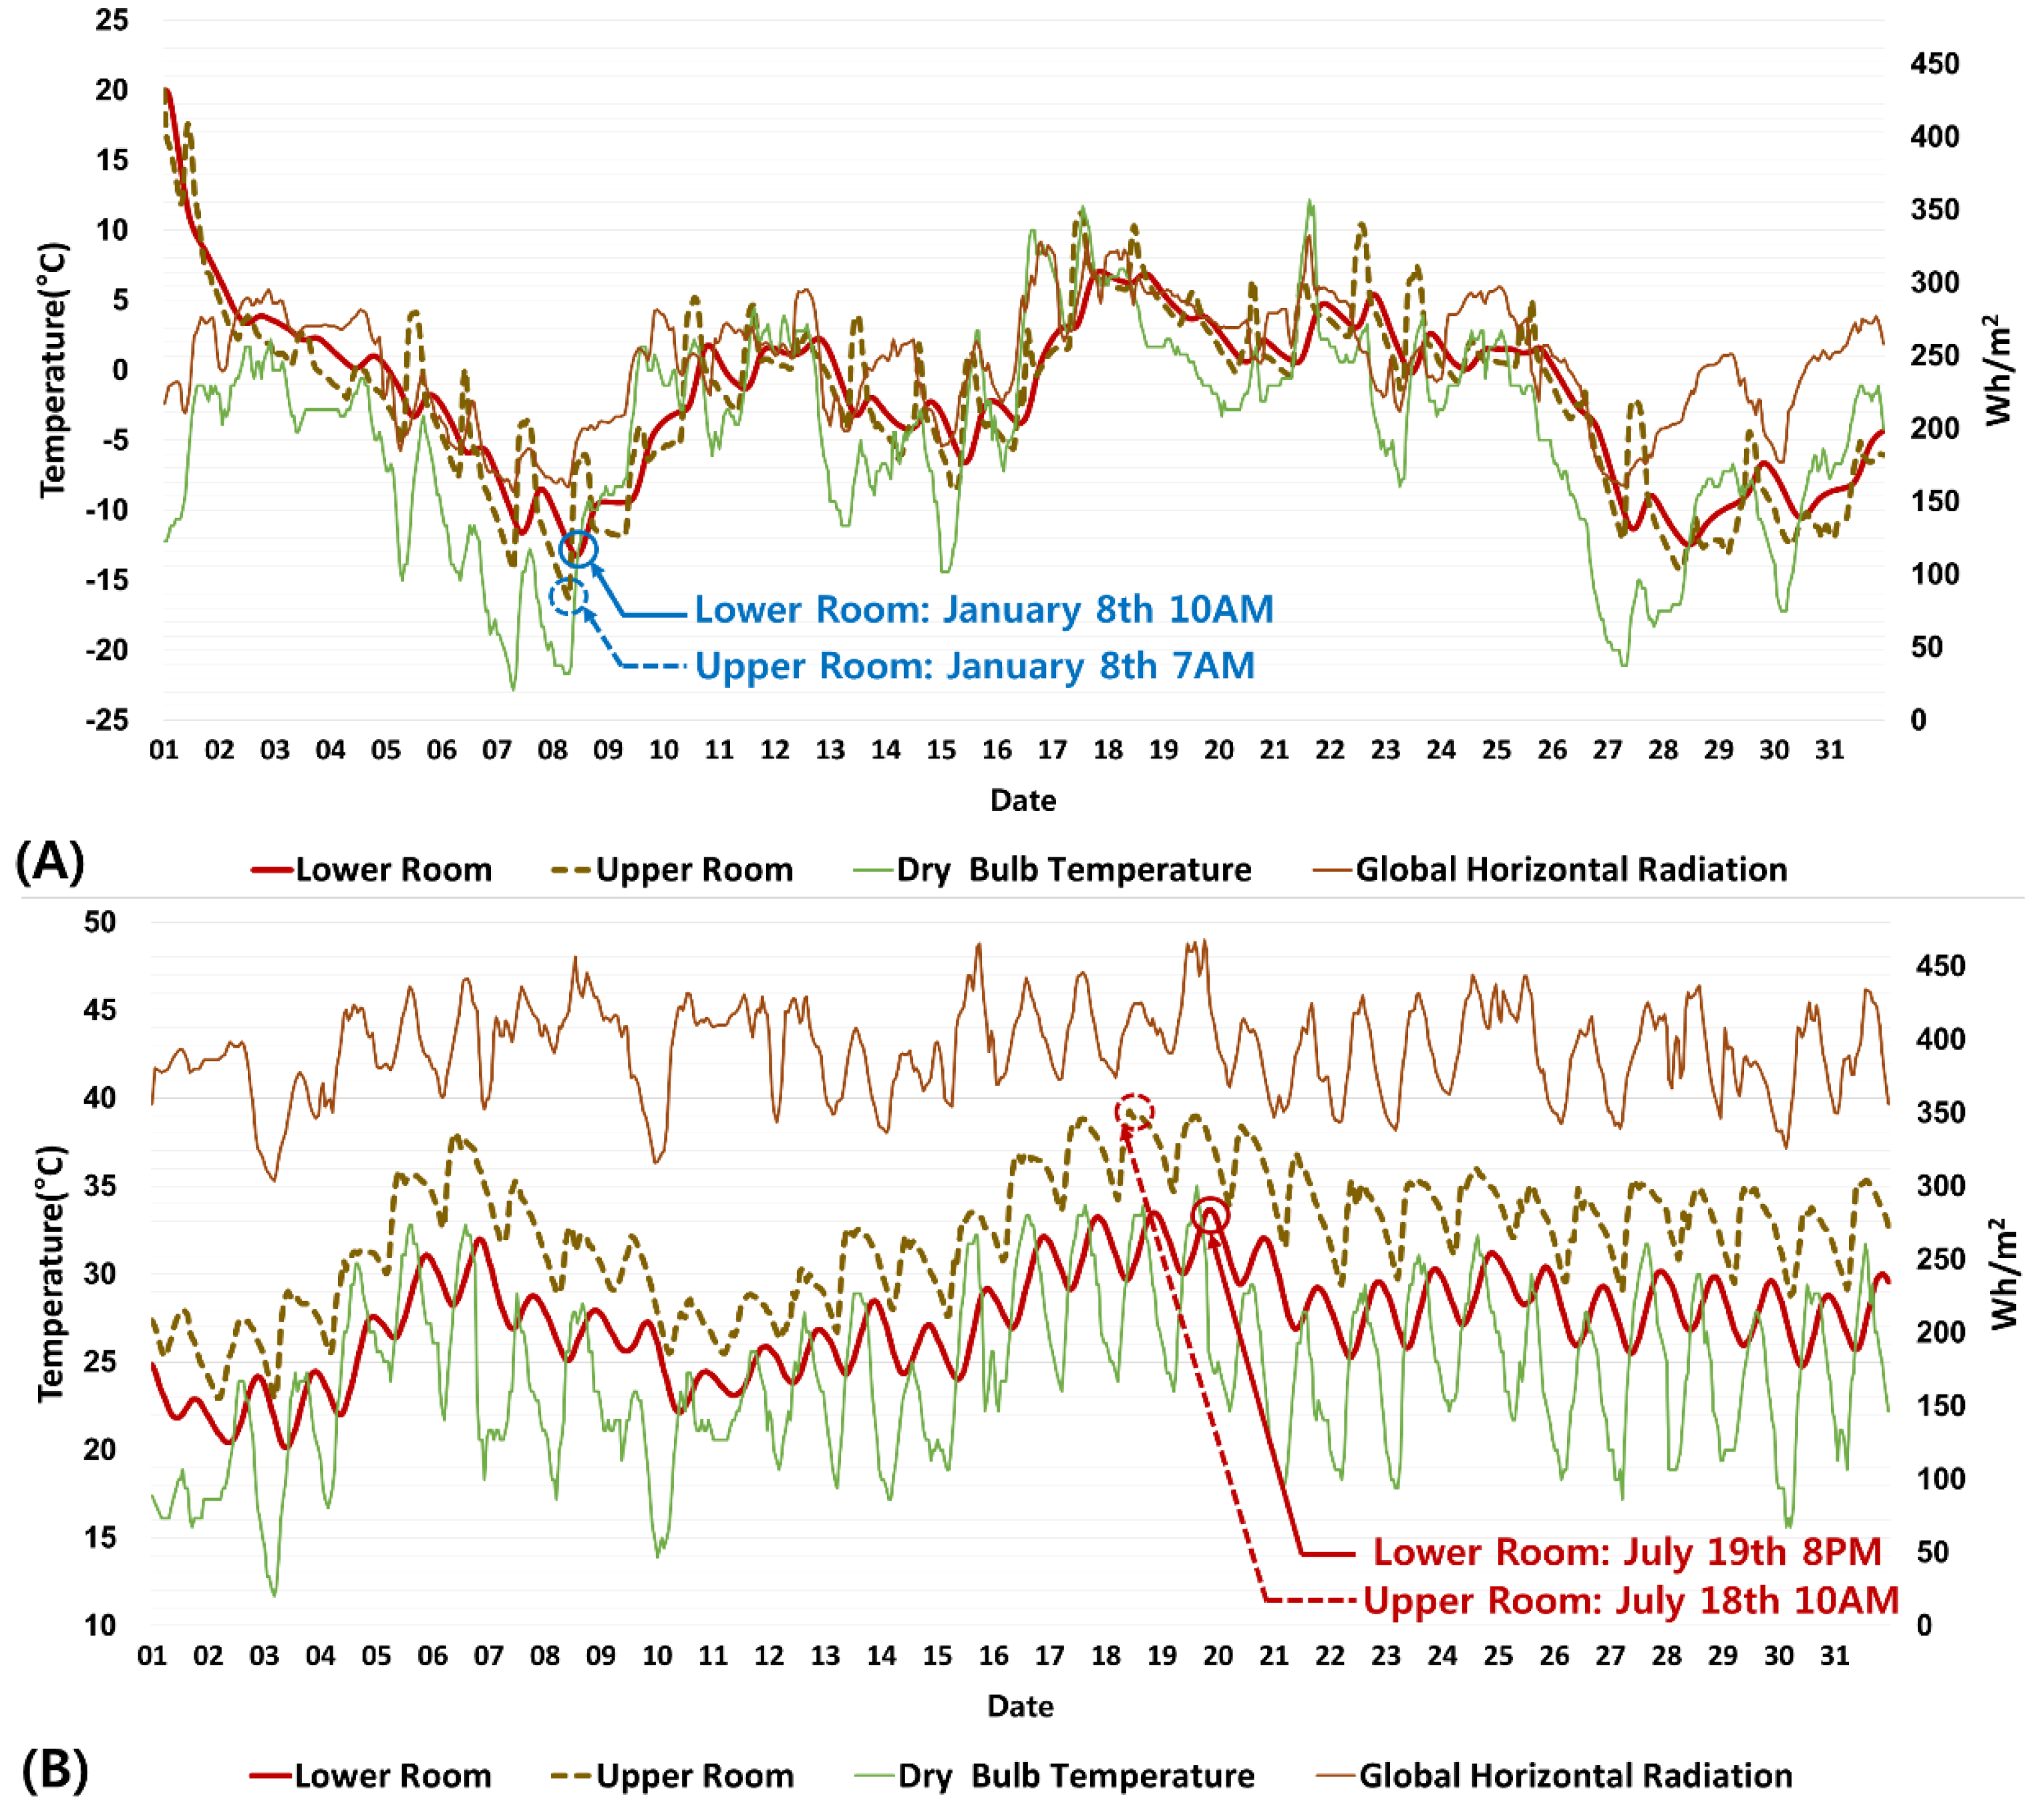
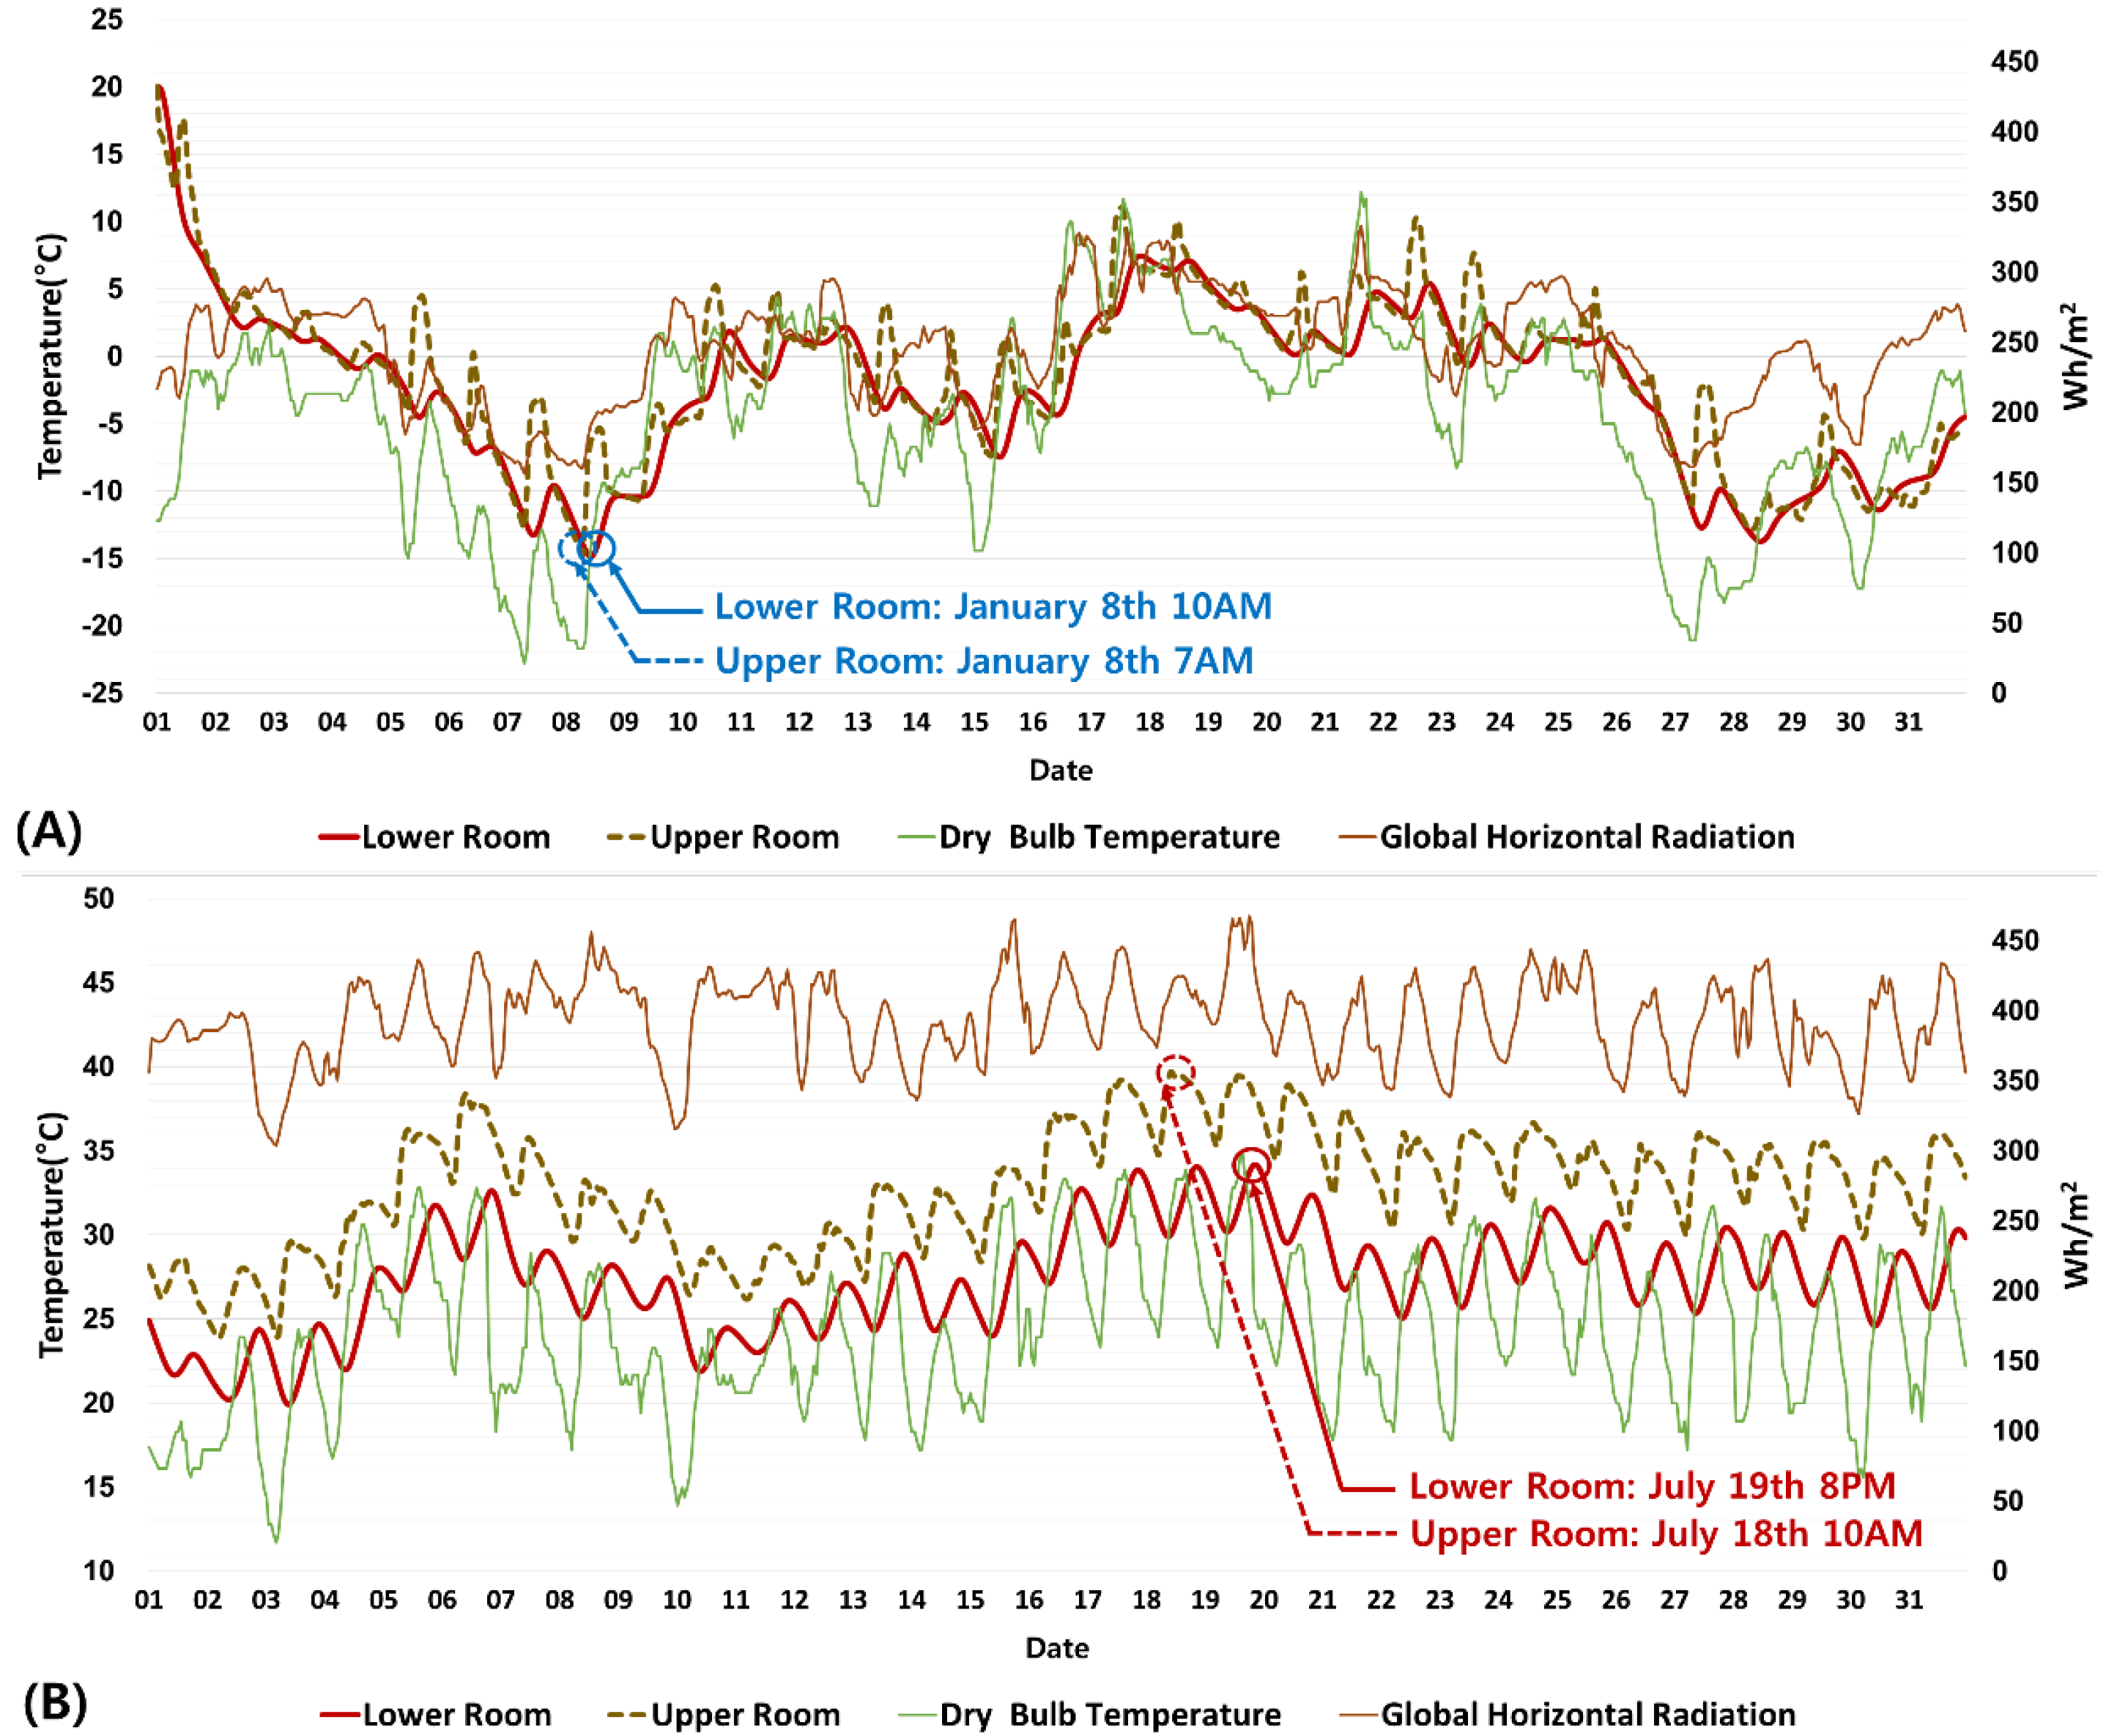
4.2.1. Test Case 1: A Two Thermal Zone ModelicaBEM Model Translated from the Two-Story Building Model
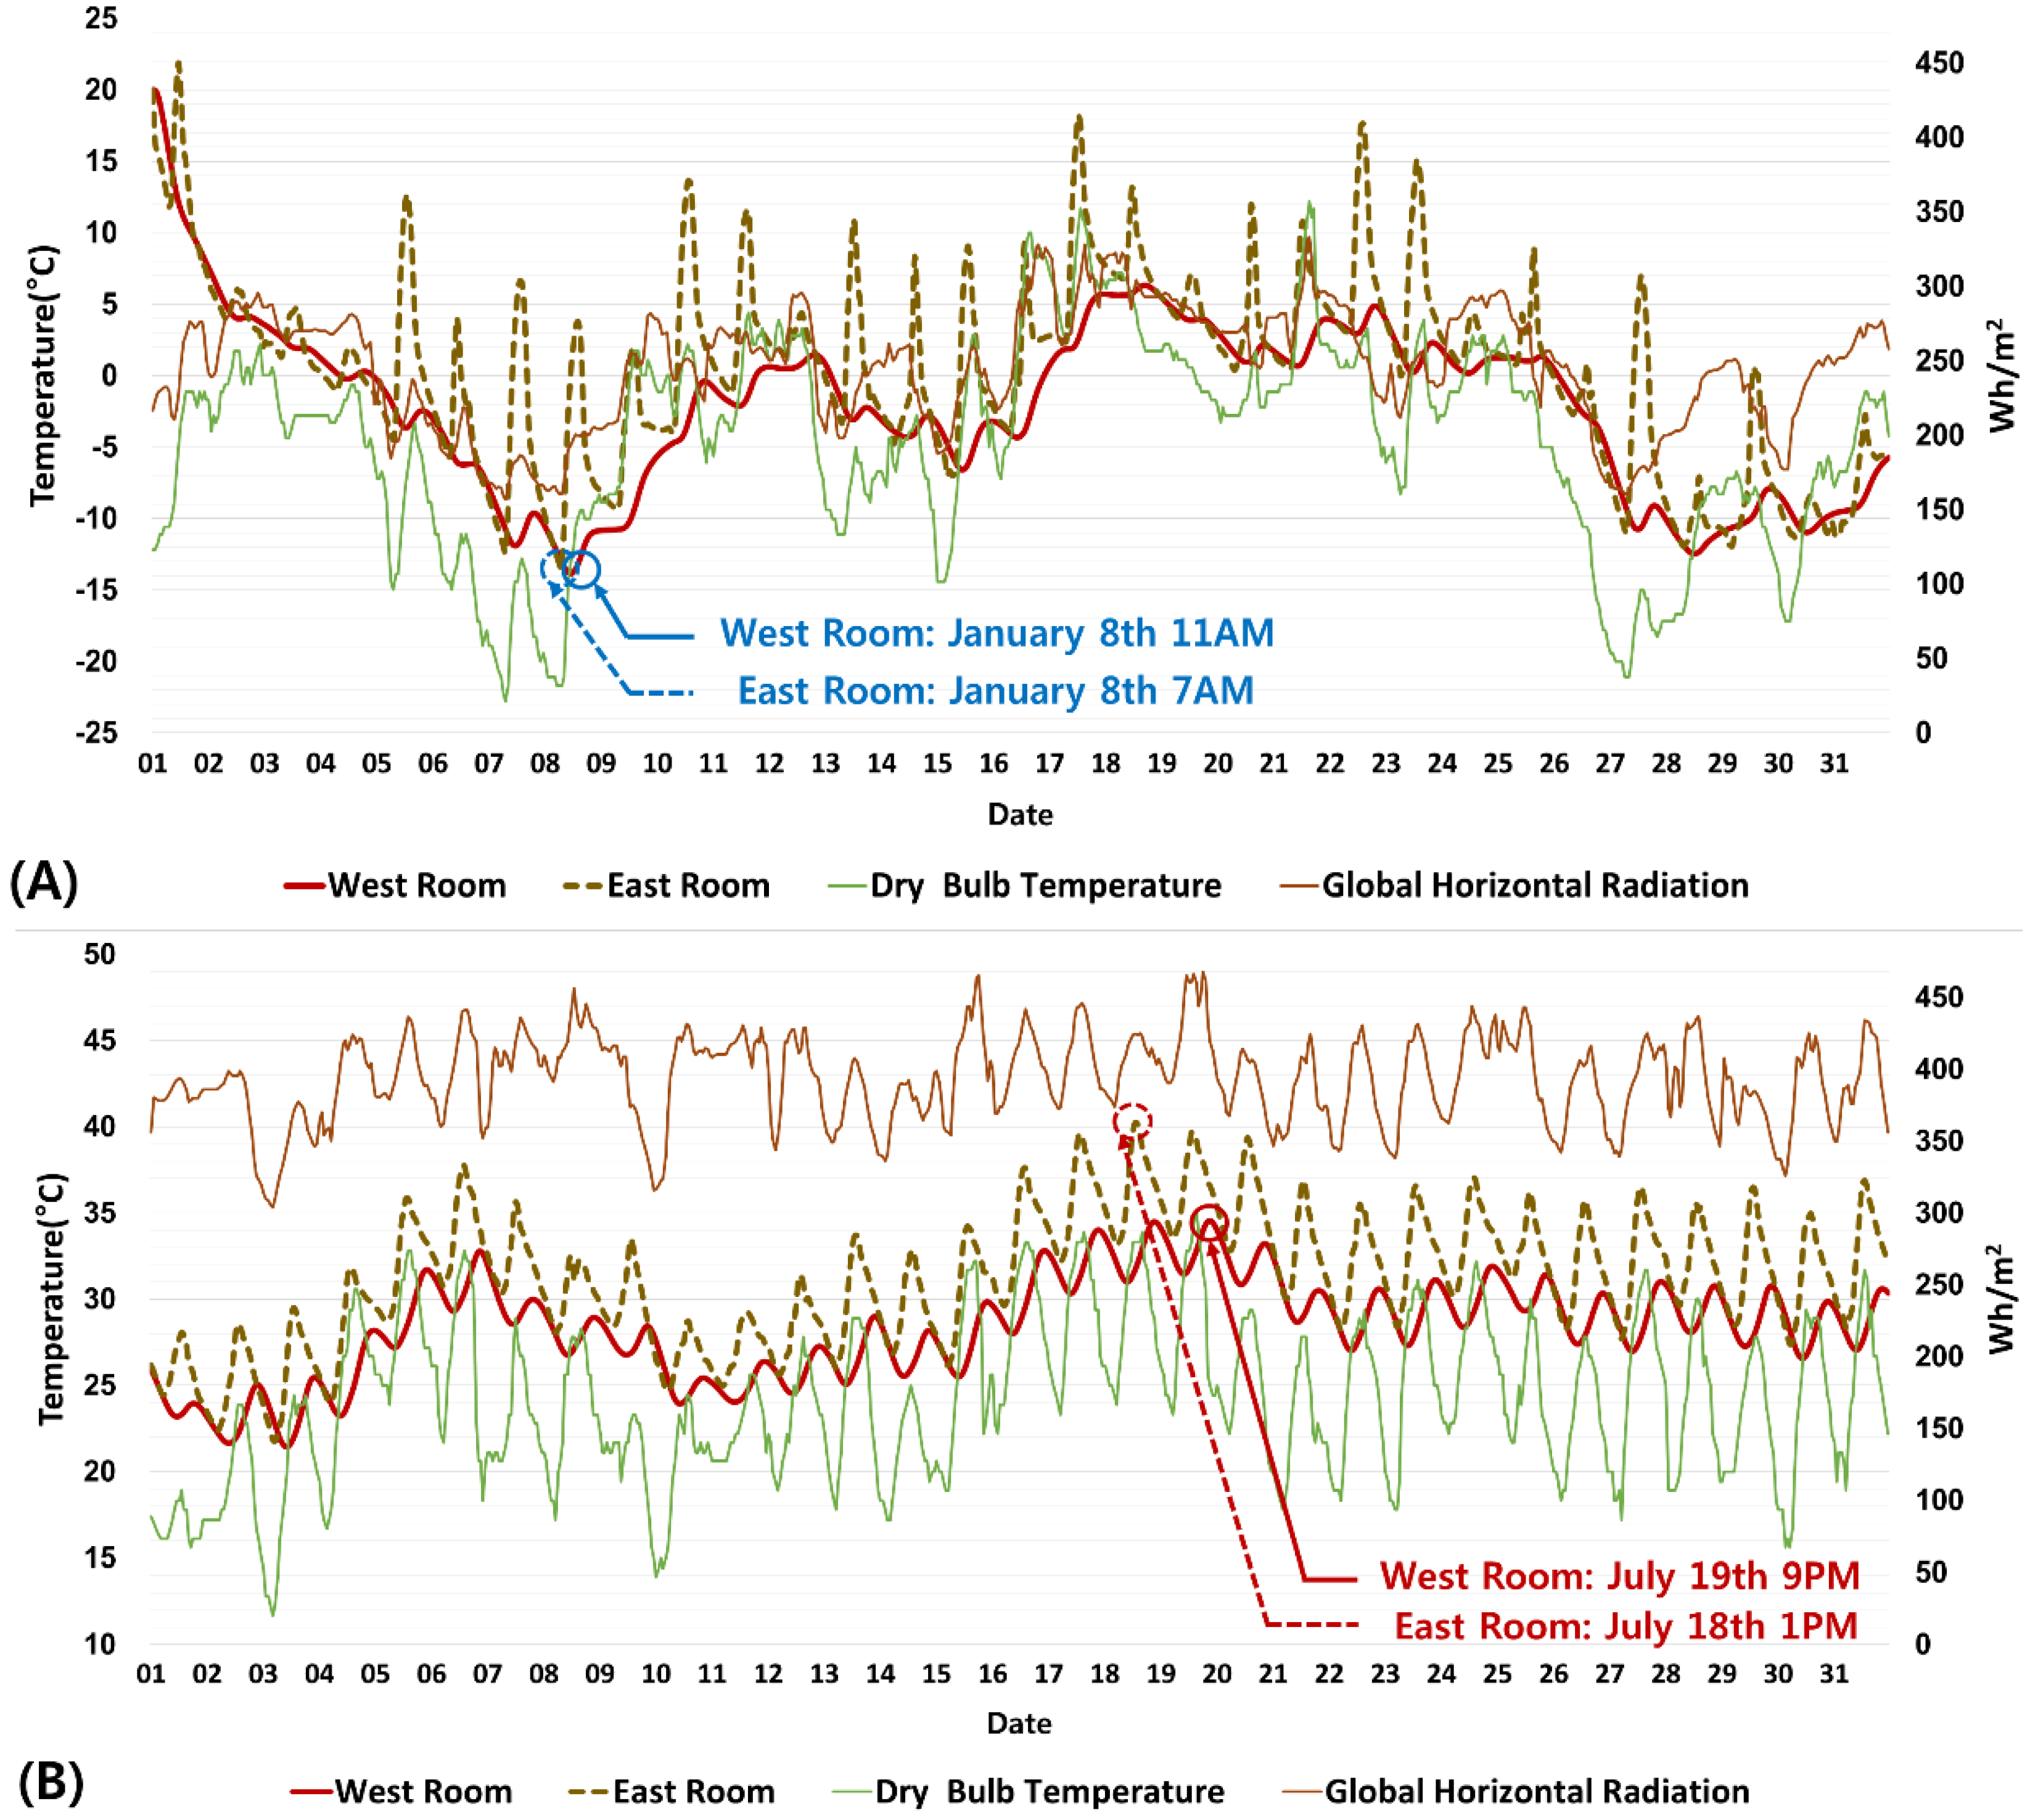
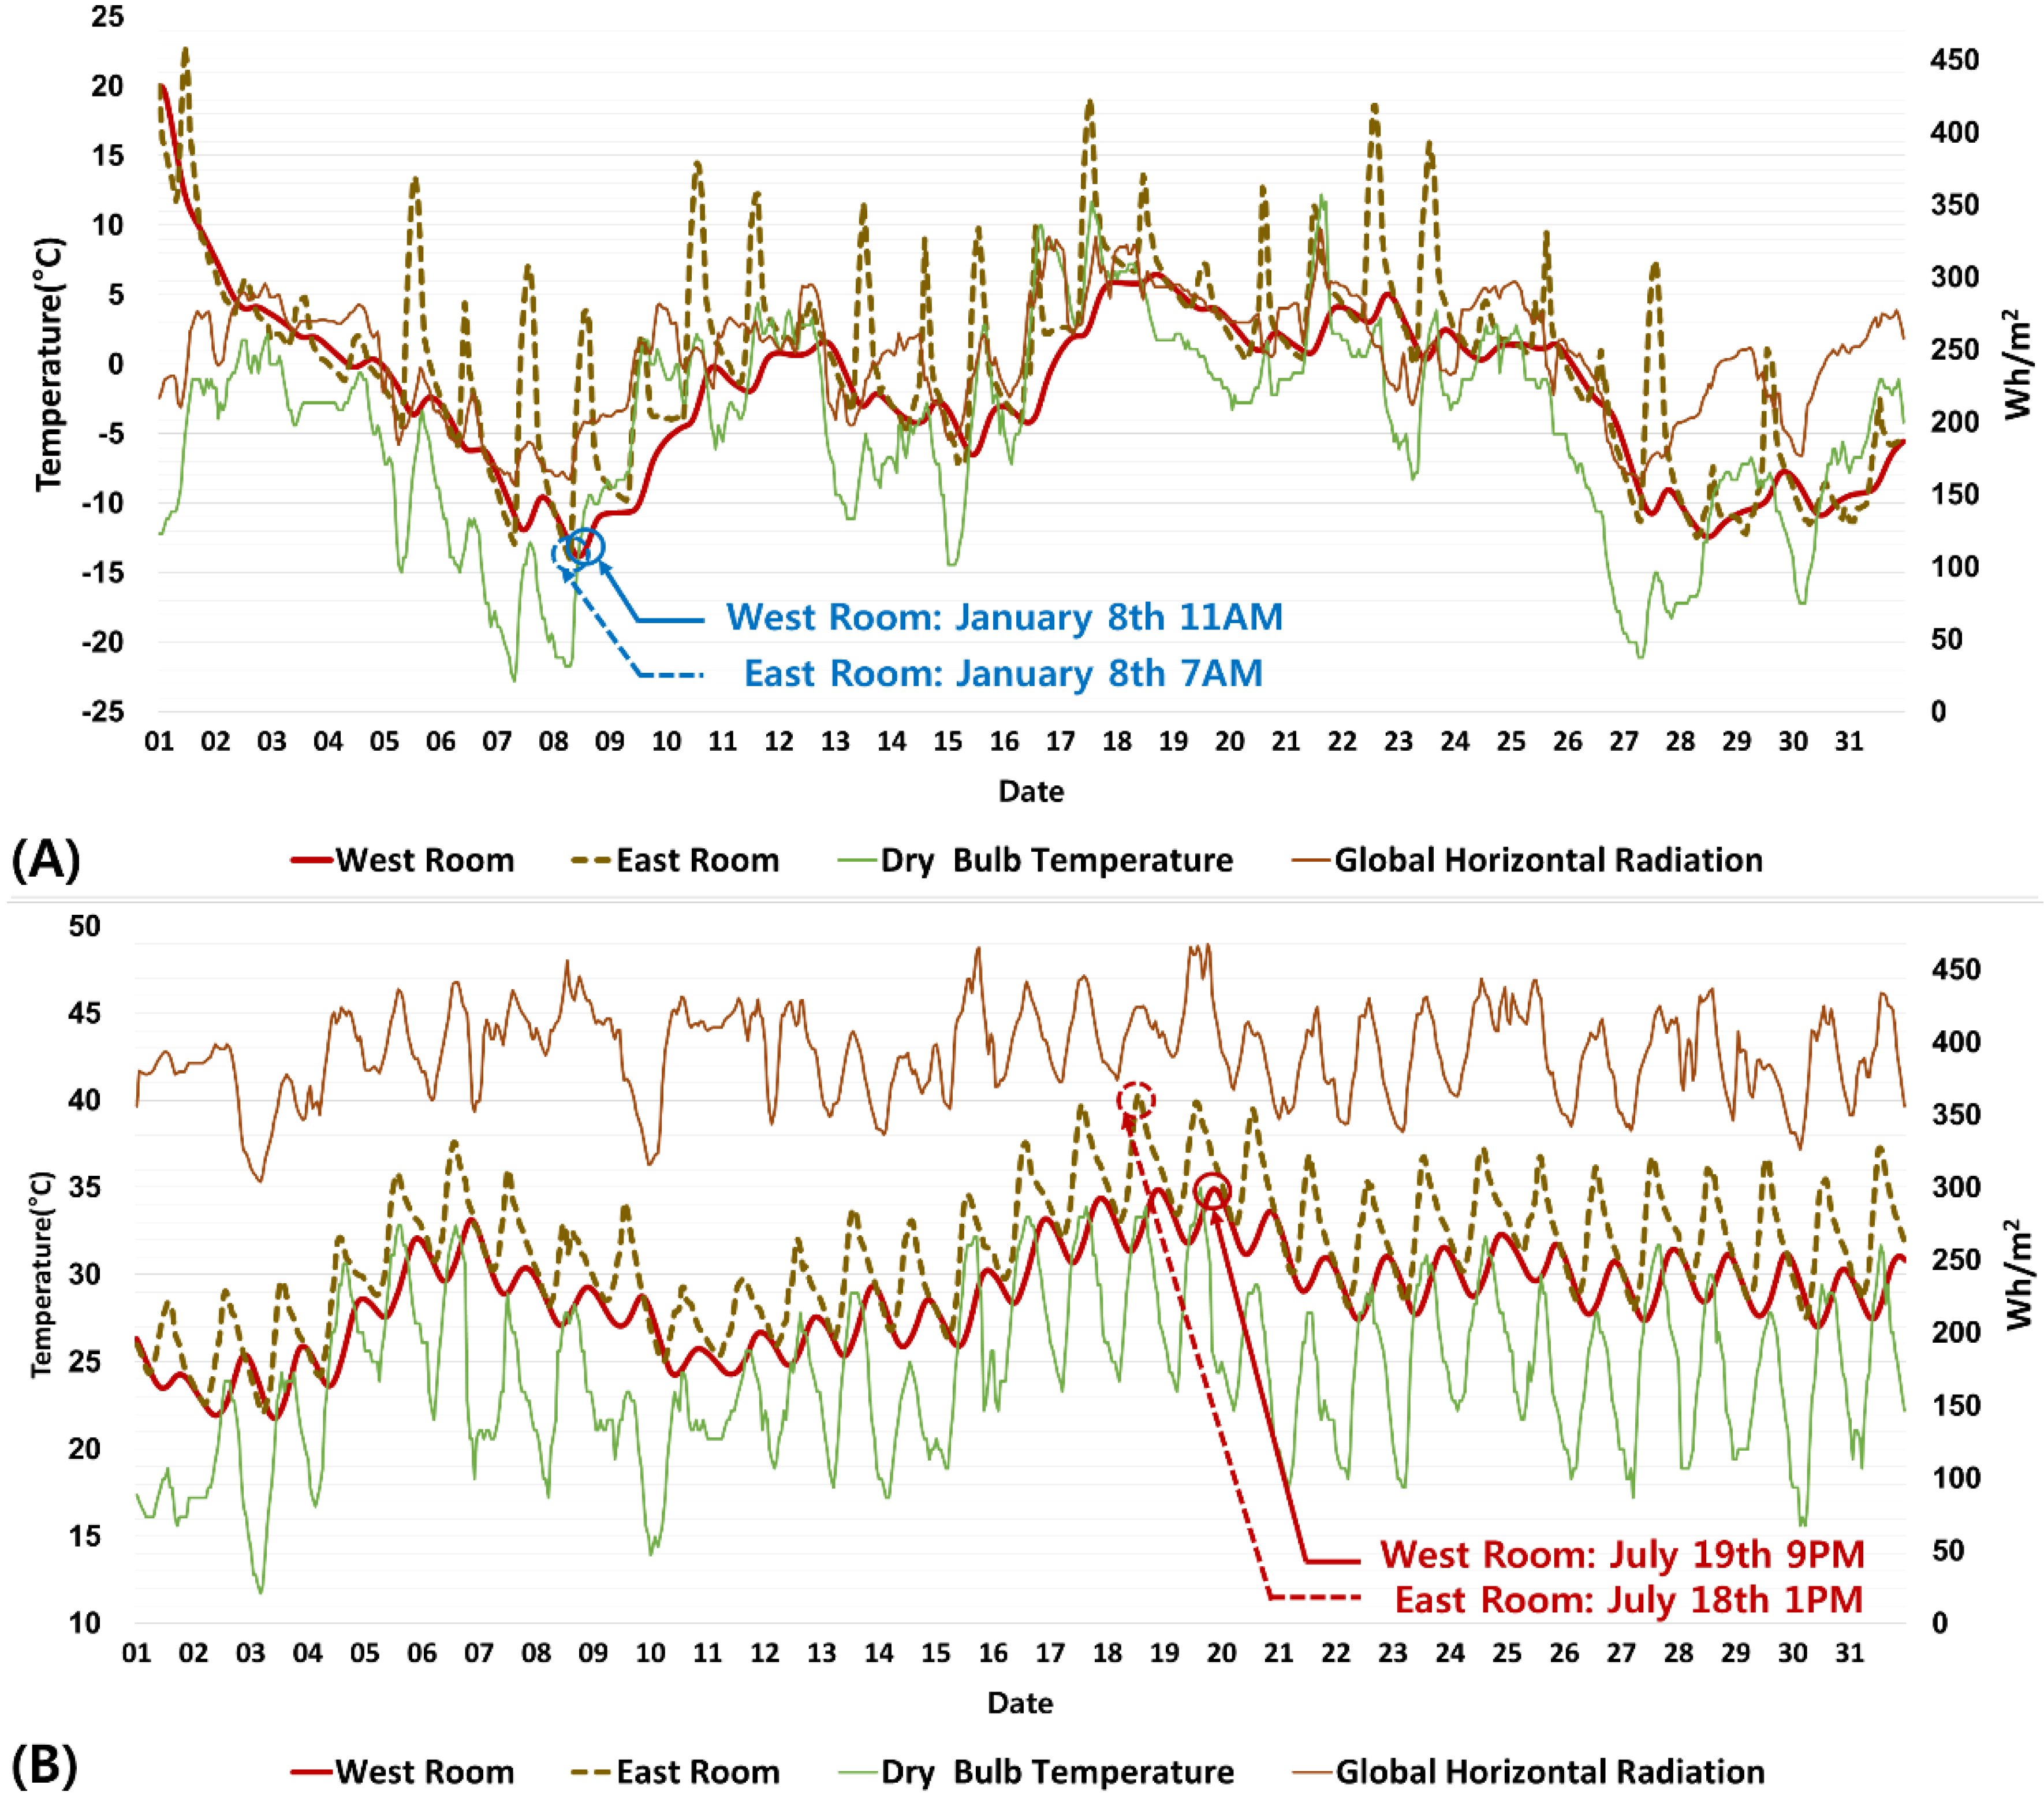
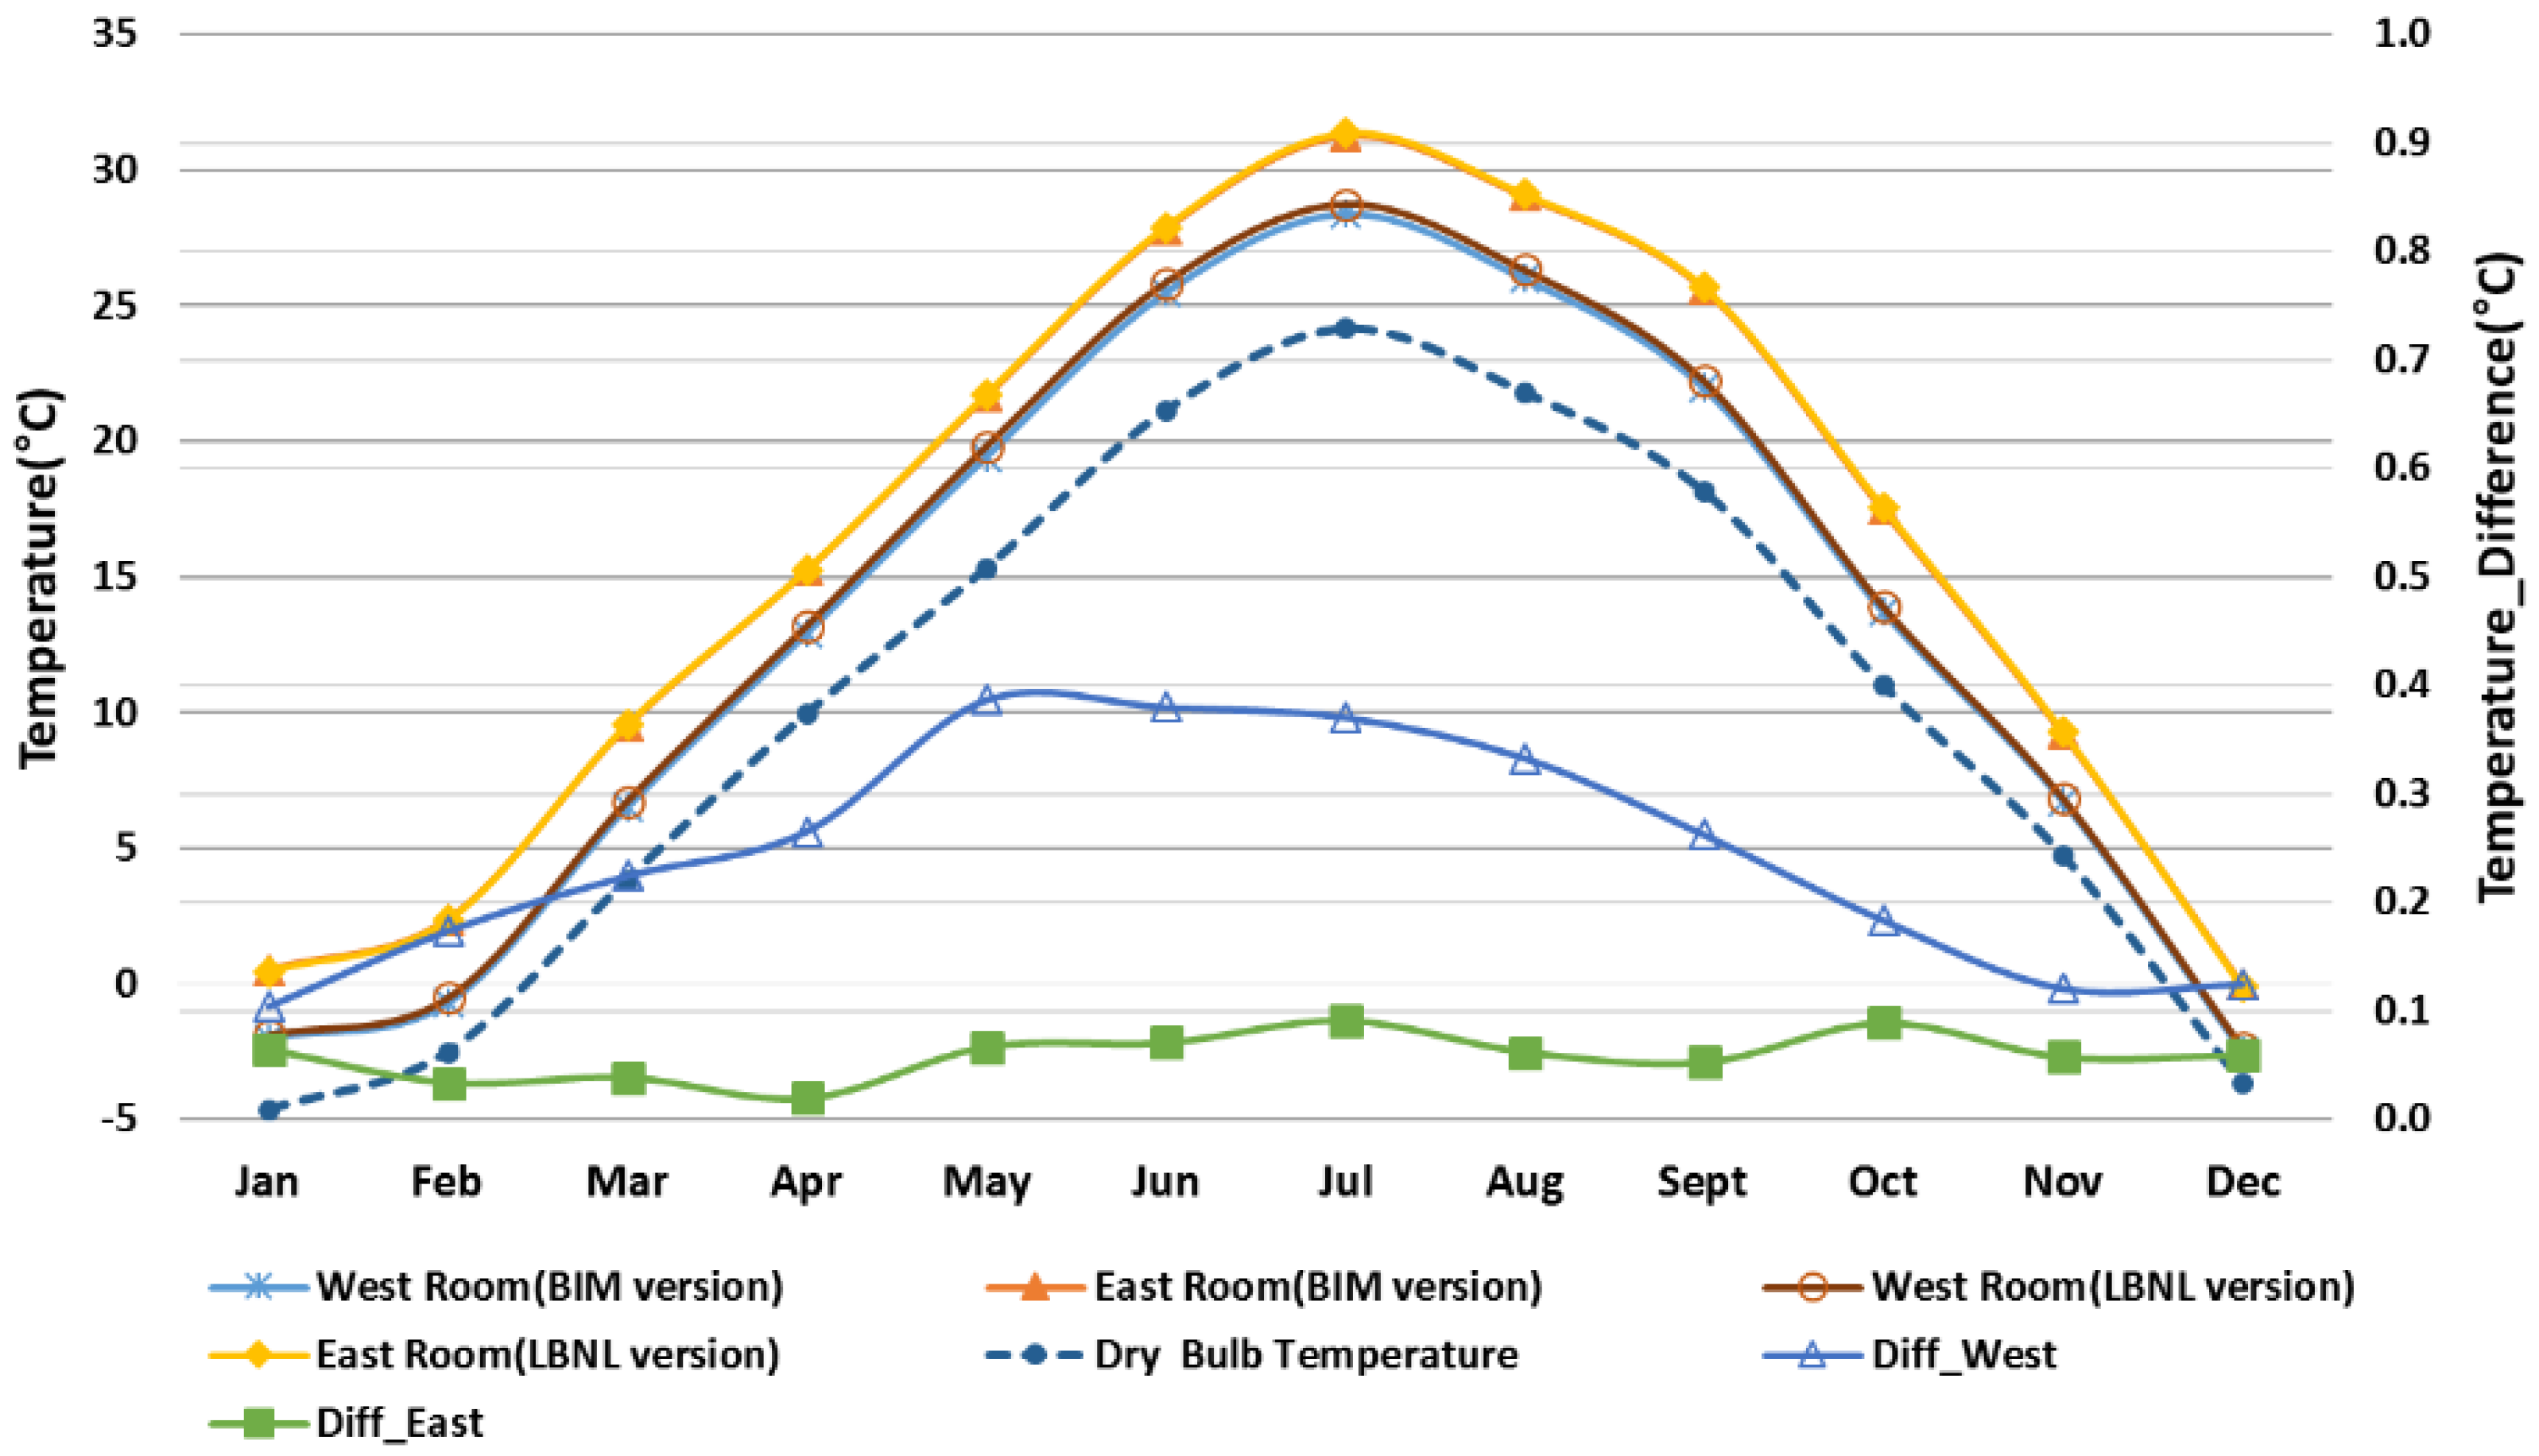
4.2.2. Test Case 2: Two Thermal Zone ModelicaBEM Model Translated from the L-Shaped Building Model
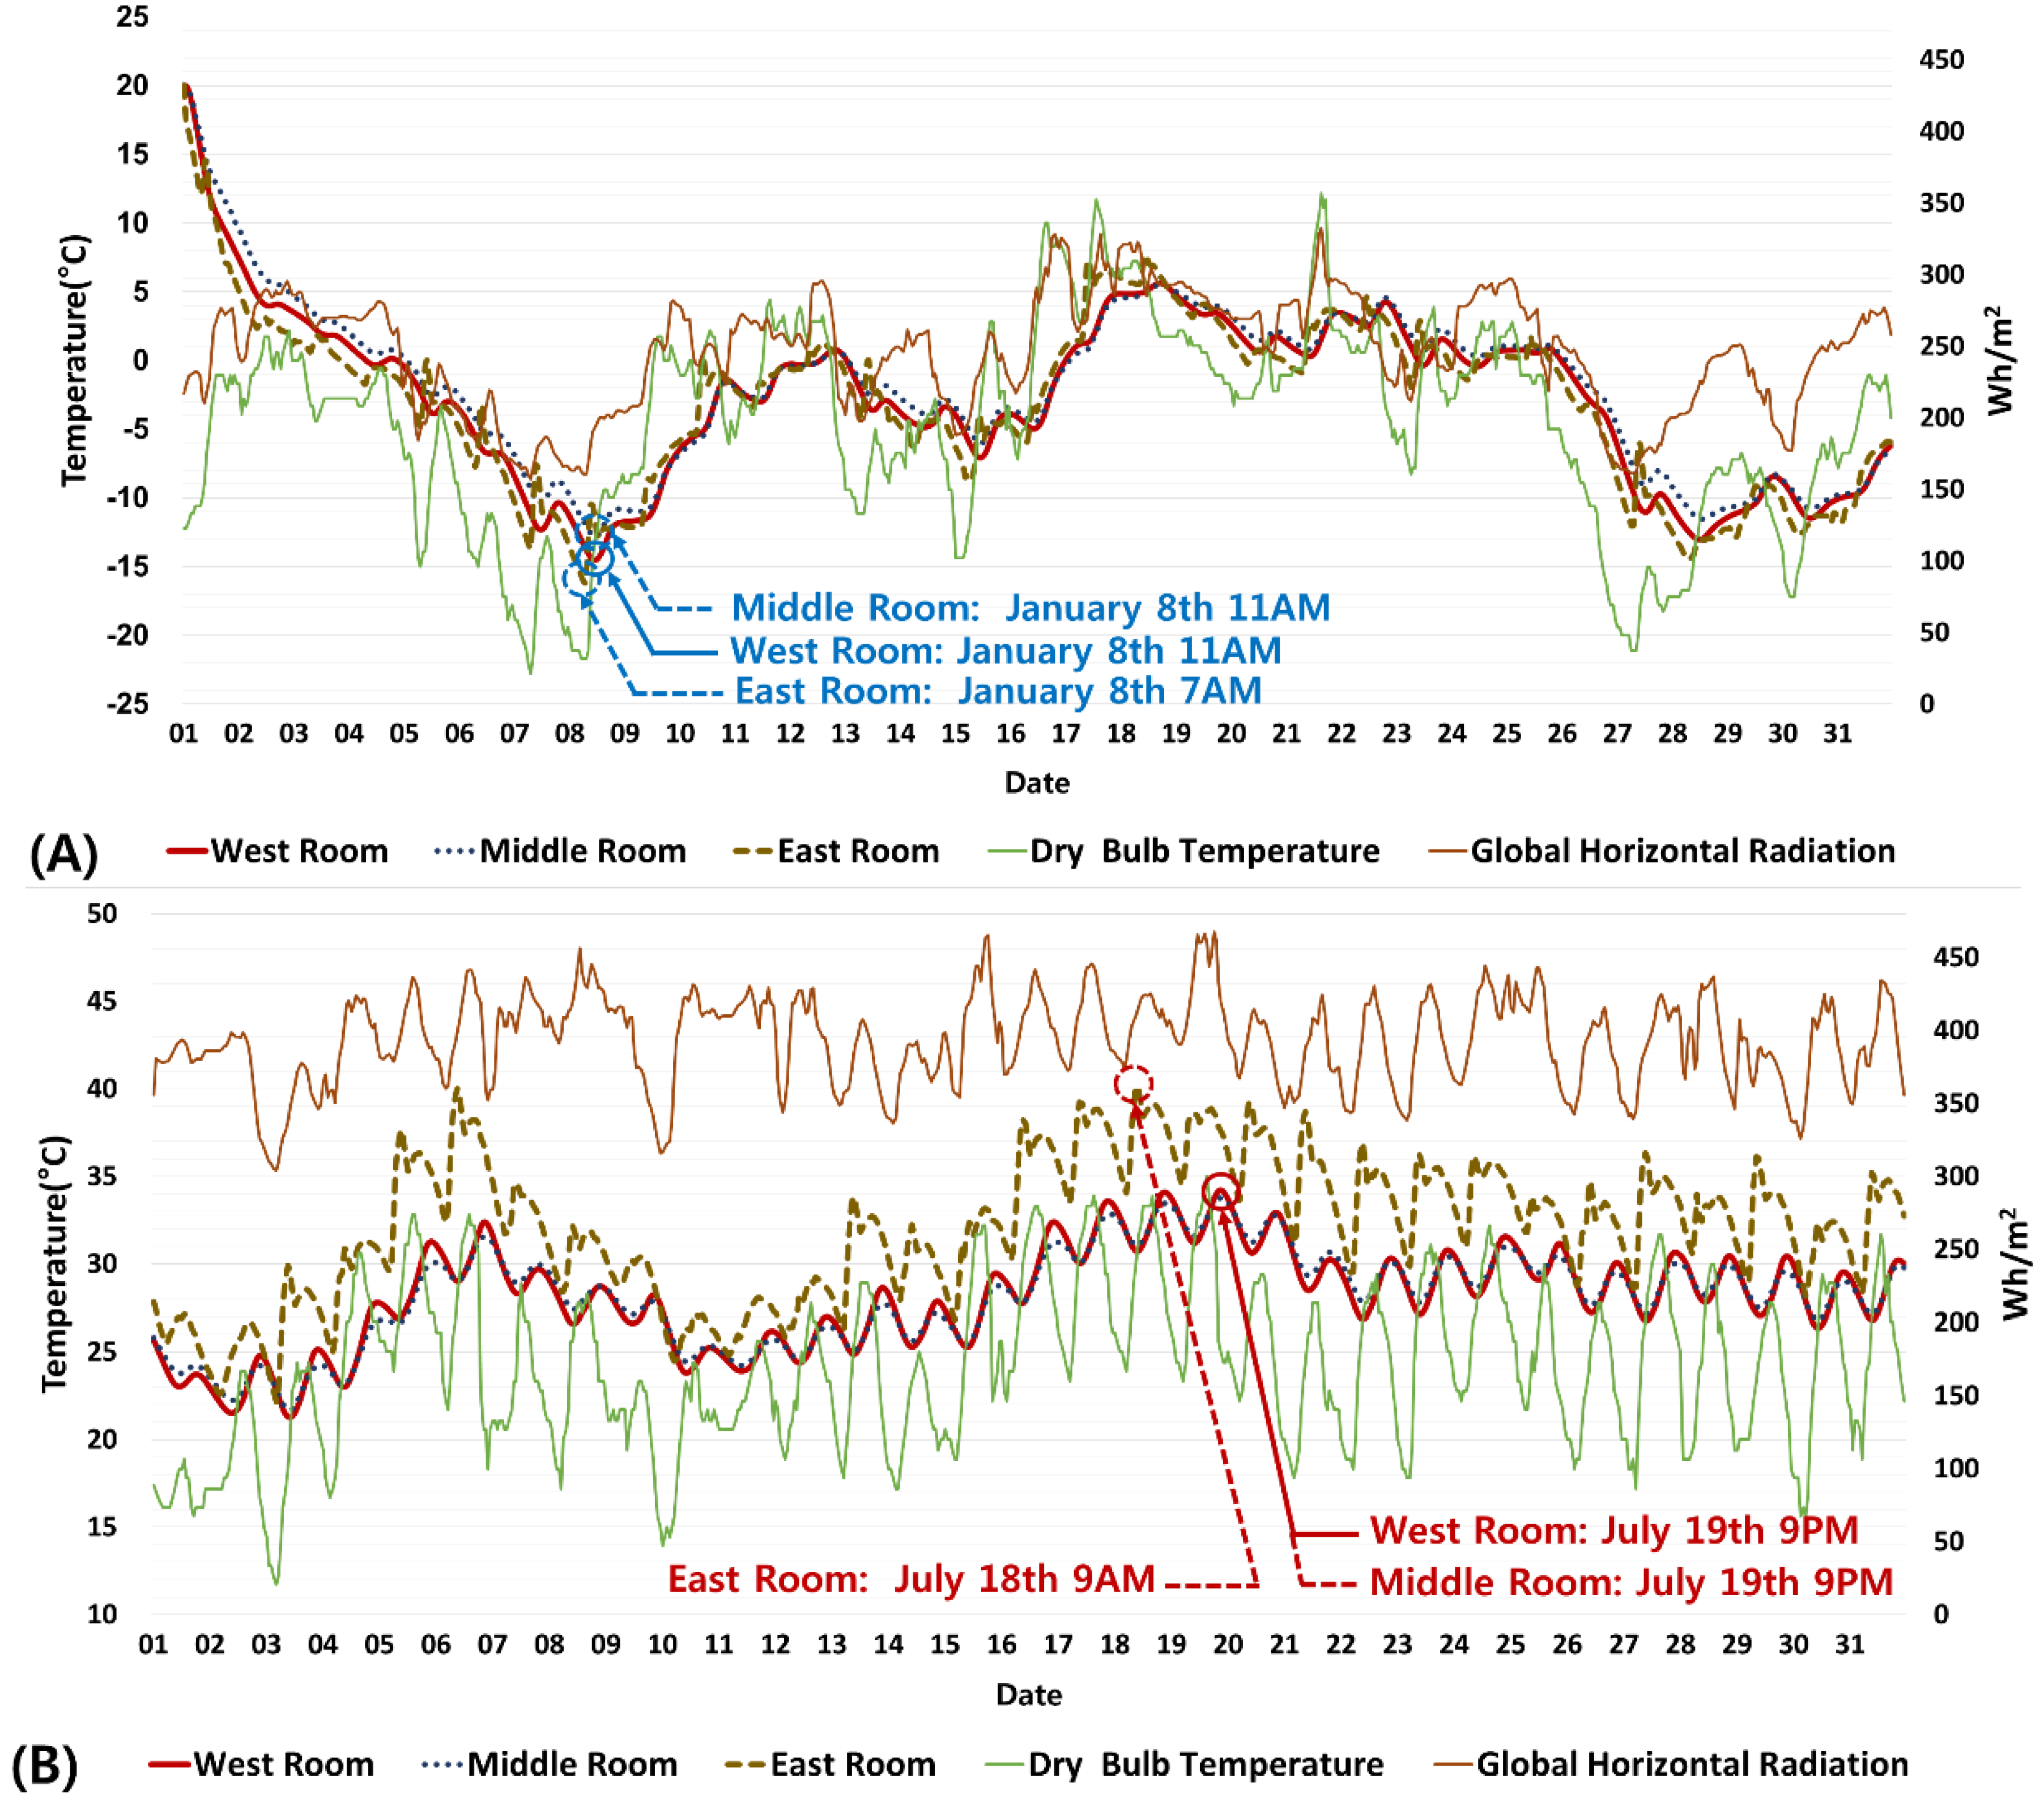
4.2.3. Test Case 3: Three Thermal Zone ModelicaBEM Model Translated from the U-shaped Building Model
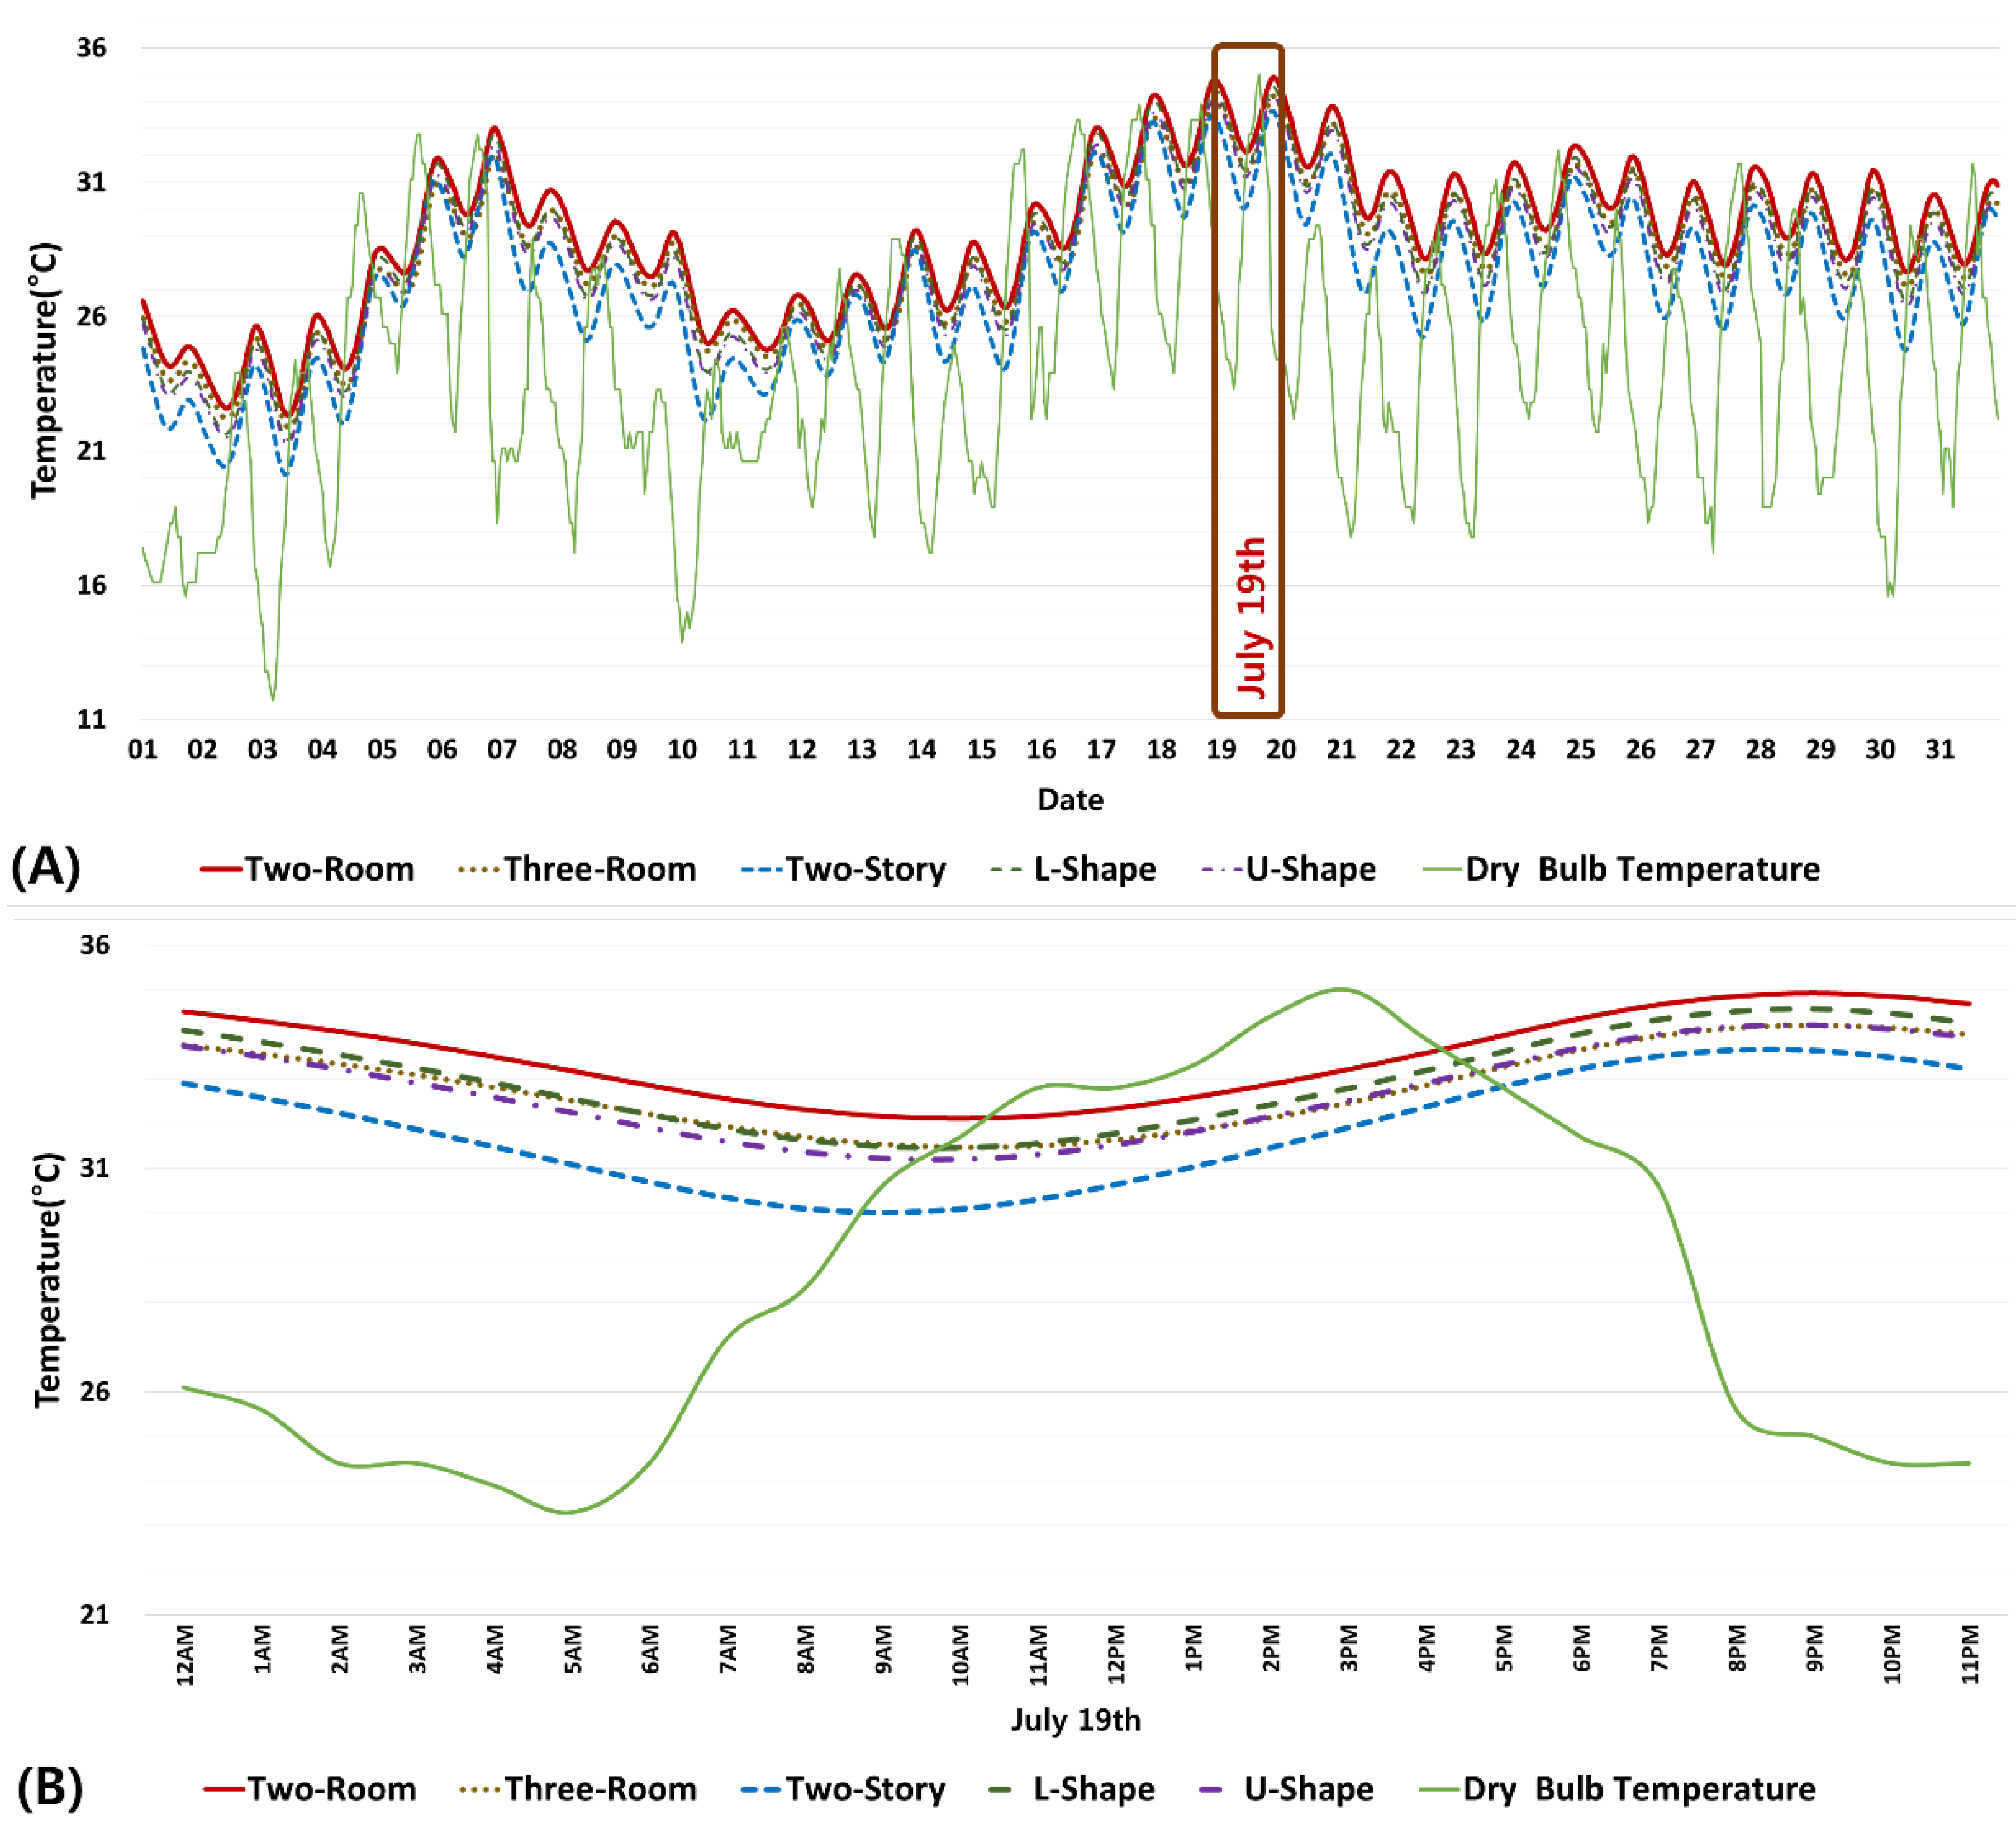
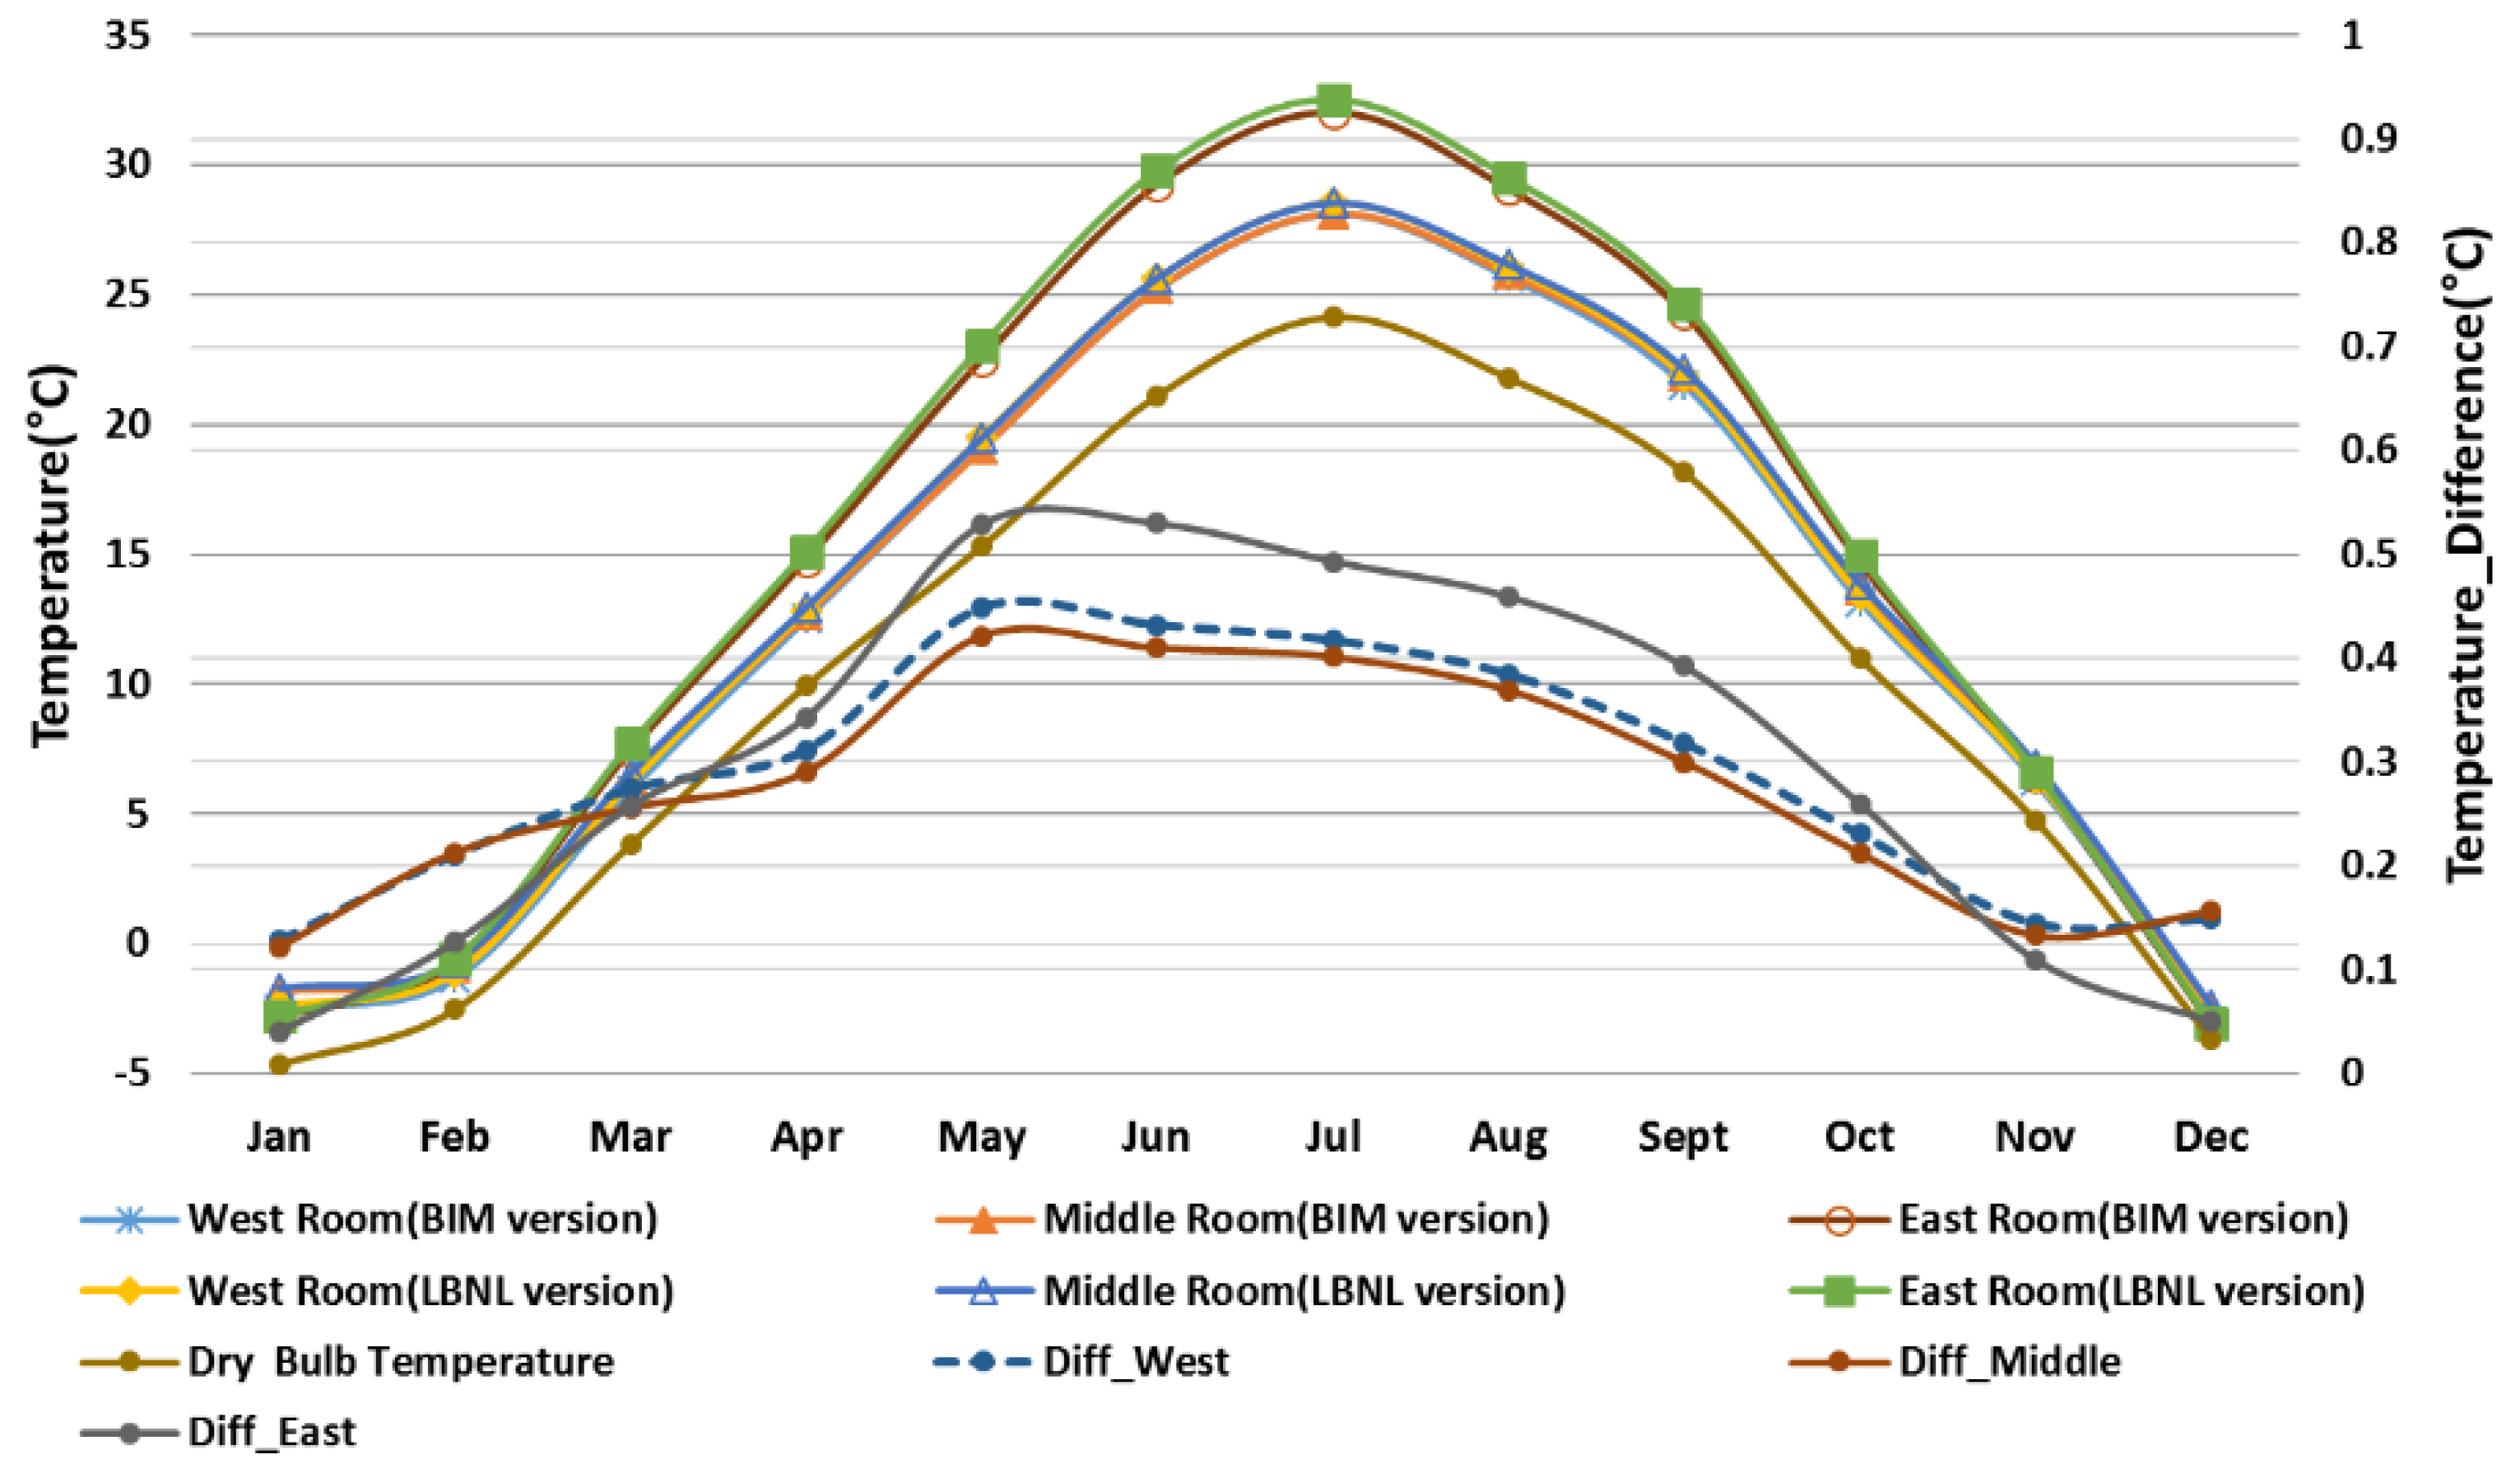
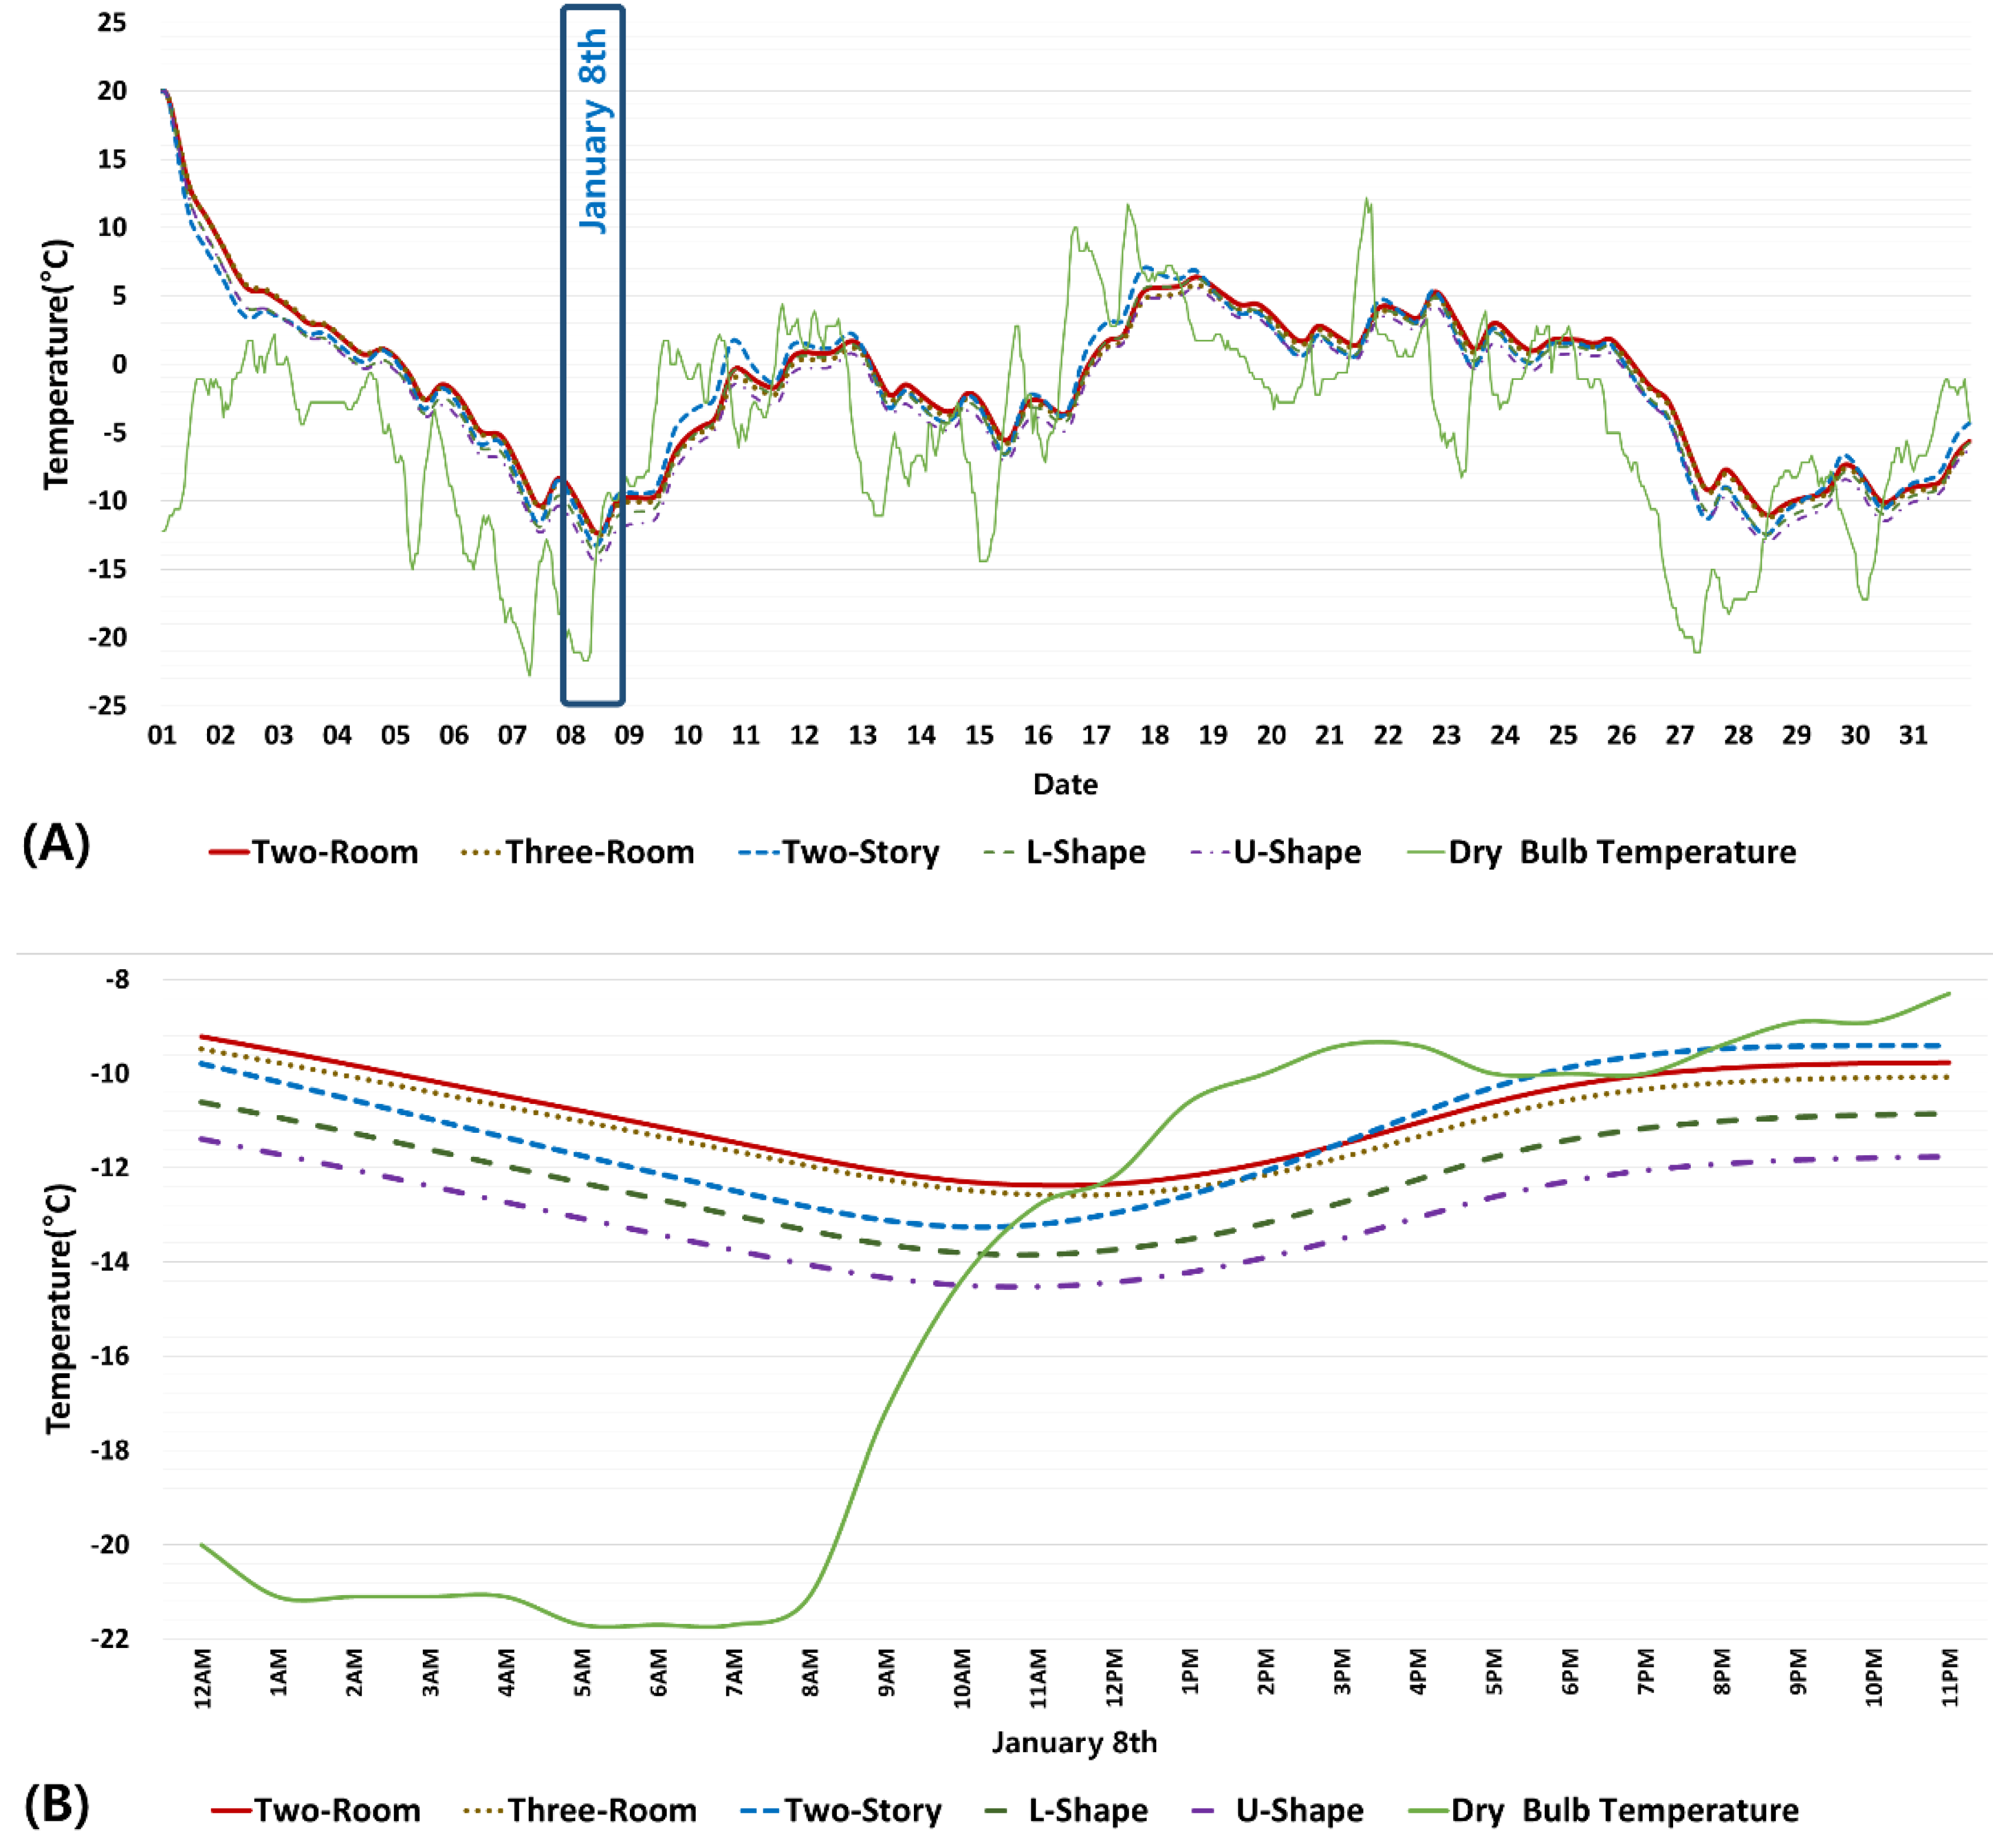
4.3 Temperature Comparisons
5. Conclusions and Future Work
Acknowledgments
Author Contributions
Conflicts of Interest
Abbreviations
| BIM | Building Information Modeling |
| BEM | Building Energy Modeling |
| OOPM | Object-Oriented Physical Modeling |
References
- National Science and Technology Council (NSTC). Federal Research and Development Agenda for Net-Zero Energy, High-Performance Green Buildings. Available online: http://www.bfrl.nist.gov/buildingtechnology/documents/FederalRDAgendaforNetZeroEnergyHighPerformanceGreenBuildings.pdf (accessed on 15 May 2016).
- U.S. Energy Information Administration (EIA). Annual Energy Review—Energy Information Administration. Available online: http://www.eia.gov/totalenergy/data/annual/index.cfm#summary (accessed on 15 May 2016).
- European Commission. Buildings. Available online: https://ec.europa.eu/energy/en/topics/energy-efficiency/buildings (accessed on 15 May 2016).
- National Science Foundation (NSF). The Challenge of Sustainable Energy. Available online: http://www.nsf.gov/nsb/publications/2009/comments_se_report.pdf (accessed on 15 May 2016).
- U.S. Energy Information Administration (EIA). Commercial Buildings Energy Consumption Survey. Available online: http://www.eia.gov/consumption/commercial (accessed on 15 May 2016).
- Yudelson, J. Greening Existing Buildings; McGraw-Hill: New York, NY, USA, 2010. [Google Scholar]
- Kanters, J.; Dubois, M.C.; Wall, M. Architects’ design process in solar-integrated architecture in Sweden. Architect. Sci. Rev. 2013, 56, 141–151. [Google Scholar] [CrossRef]
- Prasad, D.K.; Snow, M. Designing with Solar Power: a Source Book for Building Integrated Photovoltaics (BiPV); Images Publishing: Victoria, Australia, 2005. [Google Scholar]
- Yan, W.; Clayton, M.; Haberl, J.; Jeong, W.; Kim, J.; Kota, S.; Bermudez Alcocer, J.; Dixit, M. Interfacing BIM with building thermal and daylighting modeling. In Proceedings of the 13th International Conference of the International Building Performance Simulation Association, Chambery, France, 25–30 August 2013; pp. 3521–3528.
- Hestnes, A.G.; Hastings, R.; Saxhof, B. Solar Energy Houses: Strategies, Technologies, Examples; James & James: London, UK, 2003. [Google Scholar]
- Aksamija, A. Analysis and computation: sustainable design in practice. Des. Princ. Pract. Int. J. 2010, 4, 291–314. [Google Scholar]
- O’Donnell, J.T.; Maile, T.; Rose, C.; Mrazović, N.; Morrissey, E.; Regnier, C.; Parrish, K.; Bazjanac, V. Transforming BIM to BEM: Generation of Building Geometry for the NASA Ames Sustainability Base BIM; Lawrence Berkeley National Laboratory: Berkeley, CA, USA, 2013; pp. 1–26. [Google Scholar]
- Wetter, M. Modelica-based modeling and simulation to support research and development in building energy and control systems. J. Build. Perform. Simulat. 2009, 2, 143–161. [Google Scholar] [CrossRef]
- Fritzson, P. Principles of Object-oriented Modeling and Simulation with Modelica 2.1; John Wiley and Sons: New York, NY, USA, 2010. [Google Scholar]
- Attia, S.; Hensen, J.L.; Beltrán, L.; de Herde, A. Selection criteria for building performance simulation tools: Contrasting architects’ and engineers’ needs. J. Build. Perform. Simulat. 2012, 5, 155–169. [Google Scholar] [CrossRef]
- Attia, S. State of the Art of Existing Early Design Simulation Tools for Net Zero Energy Buildings: A Comparison of Ten Tools; Université catholique de Louvain: Louvain La Neuve, Belgium, 2011. [Google Scholar]
- Aksamija, A. BIM–based building performance analysis: Evaluation and simulation of design decisions. In Proceedings of the 2012 ACEEE Summer Study on Energy Efficiency in Buildings, Pacific Grove, CA, USA, 12–17 August 2012.
- Crawley, D.B.; Lawrie, L.K.; Winkelmann, F.C.; Buhl, W.F.; Huang, Y.J.; Pedersen, C.O.; Strand, R.K.; Liesen, R.J.; Fisher, D.E.; Witte, M.J.; Glazer, J. EnergyPlus: Creating a new-generation building energy simulation program. Energ. Build. 2001, 33, 319–331. [Google Scholar] [CrossRef]
- Maile, T.; Fischer, M.; Bazjanac, V. Building Energy Performance Simulation Tools—A Life-cycle and Interoperable Perspective; Center for Integrated Facility Engineering (CIFE): Stanford, CA, USA, 2007. [Google Scholar]
- eQUEST. Available online: http://www.doe2.com/equest (accessed on 5 July 2016).
- Energy10. Available online: http://arizonaenergy.org/Analysis/Builders/energy10.htm (accessed on 5 July 2016).
- CONTAM Description. Available online: http://www.bfrl.nist.gov/IAQanalysis/CONTAM (accessed on 5 July 2016).
- EnergyPlus. Available online: https://energyplus.net (accessed on 5 July 2016).
- HEED: Home Energy Efficient Design. Available online: http://www.energy-design-tools.aud.ucla.edu/heed (accessed on 5 July 2016).
- Integrated Environmental Solutions. Available online: https://www.iesve.com (accessed on 5 July 2016).
- Haberl, J.S. SIMBUILD survey: Academic use of simulation software. In Proceedings of the SimBuild 2008 Conference, Berkeley, CA, USA, 30 July–1 August 2008.
- Clarke, J. Energy Simulation in Building Design, 2nd ed.; Routledge: Abingdon, UK, 2001. [Google Scholar]
- Crawley, D.B.; Hand, J.W.; Kummert, M.; Griffith, B.T. Contrasting the capabilities of building energy performance simulation programs. Build. Environ. 2008, 43, 661–673. [Google Scholar] [CrossRef]
- Building Energy Software Tools. Available online: http://www.buildingenergysoftwaretools.com (accessed on 15 May 2016).
- DOE2.com Home Page. Available online: http://www.doe2.com (accessed on 5 July 2016).
- ESP-r. Available online: http://www.esru.strath.ac.uk/Programs/ESP-r.htm (accessed on 5 July 2016).
- Good, J.; Frisque, A.; Phillips, D. The role of wind in natural ventilation simulations using airflow network models. In Proceedings of the SimBuild 2008 Conference, Berkeley, CA, USA, 30 July–1 August 2008; pp. 140–147.
- DesignBuilder—Building Design. Available online: http://www.designbuilder.co.uk (accessed on 15 May 2016).
- Gratia, E.; Herde, A. A simple design tool for the thermal study of an office building. Energ. Build. 2002, 34, 279–289. [Google Scholar] [CrossRef]
- Azhar, S.; Brown, J.; Sattineni, A. A case study of building performance analyses using building information modeling. In Proceedings of the 27th International Symposium on Automation and Robotics in Construction (ISARC–27), Bratislava, Slovakia, 25–27 June 2010; pp. 25–27.
- Sanguinetti, P.; Abdelmohsen, S.; Lee, J.M.; Lee, J.K.; Sheward, H.; Eastman, C. General system architecture for BIM: An integrated approach for design and analysis. Adv. Eng. Informat. 2012, 26, 317–333. [Google Scholar] [CrossRef]
- Tummescheit, H. Design and Implementation of Object-oriented Model Libraries Using Modelica. Ph.D. Thesis, Lund University, Lund, Sweden, 2002. [Google Scholar]
- Fritzson, P.; Bunus, P. Modelica–a general object-oriented language for continuous and discrete-event system modeling and simulation. In Proceedings of the 35th Annual Symposium, San Diego, CA, USA, 14–18 April 2002; pp. 365–380.
- CATIA Systems Engineering—Dymola. Available online: http://www.3ds.com/products-services/catia/portfolio/dymola/overview (accessed on 15 May 2016).
- Modelica and the Modelica Association. Available online: https://www.modelica.org (accessed on 15 May 2016).
- Modelica Libraries. Available online: https://www.modelica.org/libraries (accessed on 15 May 2016).
- 3E. Modelica Library Allowing Simultaneous Transient Simulation of Thermal and Electrical Systems at both Building and Feeder Level. Available online: https://github.com/open-ideas/IDEAS (accessed on 15 May 2016).
- Modelica Industrial Control Systems Library by Politecnico di Milano. Available online: https://github.com/mbonvini/IndustrialControlSystems (accessed on 15 May 2016).
- Modelon Vehicle Dynamics Library. Available online: http://www.modelon.com/products/modelica-libraries/vehicle-dynamics-library (accessed on 15 May 2016).
- OpenModelica. Available online: https://openmodelica.org (accessed on 15 May 2016).
- Nytsch-Geusen, C.; Huber, J.; Ljubijankic, M.; Raedler, J. The Modelica Library BuildingSystems for object-oriented modelling and simulation of complex energetic building systems. Bauphysik. 2013, 35, 21–29. [Google Scholar] [CrossRef]
- Wetter, M.; Zuo, W.; Nouidui, T.S.; Pang, X. Modelica Buildings library. J. Build. Perform. Simula. 2014, 7, 253–270. [Google Scholar] [CrossRef]
- BuildingSystems. Available online: http://modelica-buildingsystems.de/index.html (accessed on 15 May 2016).
- Höger, C.; Nytsch-Geusen, C. 3D Visualization in Building Simulation, Based on Modelica. Available online: http://www.modprod.liu.se/modprod2012/1.322792/modprod2012-day1-talk07b-Christoph-Hger-Nytsch-Geusen-BuildigSimulationModelica3D.pdf (accessed on 15 May 2016).
- Bazjanac, V.; Kiviniemi, A. Reduction, simplification, translation and interpretation in the exchange of model data. CIB W. 2007, 78, 163–168. [Google Scholar]
- Jeong, W.; Son, J. An algorithm to translate building topology in building information modeling into Object-Oriented physical modeling-based building energy modeling. Energies. 2016, 9, 50. [Google Scholar] [CrossRef]
- Jeong, W.; Kim, J.B.; Clayton, M.J.; Haberl, J.S.; Yan, W. Translating building information modeling to building energy modeling using model view definition. Sci. World J. 2014, 2014, 1–21. [Google Scholar] [CrossRef] [PubMed]
- Jeong, W.; Kim, J.B.; Clayton, M.J.; Haberl, J.S.; Yan, W. A framework to integrate object-oriented physical modelling with building information modelling for building thermal simulation. J. Build. Perform. Simula. 2016, 9, 50–69. [Google Scholar] [CrossRef]
- Kim, J.B.; Jeong, W.; Clayton, M.J.; Haberl, J.S.; Yan, W. Developing a physical BIM library for building thermal energy simulation. Autom. Construct. 2015, 50, 16–28. [Google Scholar] [CrossRef]
- Eisenhart, K. Building Theories from Case Study Research. Acad. Manag. Rev. 1989, 14, 532–550. [Google Scholar]
- Yin, R.K. Case Study Research: Design and Methods, 2nd ed.; Sage: Newbury Park, CA, USA, 1994. [Google Scholar]
- Nouidui, T.S.; Phalak, K.; Zuo, W.; Wetter, M. Validation and Application of the Room Model of the Modelica Buildings Library. In Proceedings of the 9th International Modelica Conference, Munich, Germany, 3–5 September 2012; pp. 727–736.
- Judkoff, R.; Neymark, J. International Energy Agency Building Energy Simulation Test (BESTEST) and Diagnostic Method; National Renewable Energy Lab: Golden, CO, USA, 1995. [Google Scholar]
- Pedersen, C.O.; Liesen, R.J.; Strand, R.K.; Fisher, D.E. A Toolkit for Building Load Calculations; American Society of Heating, Refrigerating and Air-Conditioning Engineers: New York, NY, USA, 2001. [Google Scholar]
- American Society of Heating, Refrigerating, and Air-Conditioning Engineers. ANSI/ASHRAE Standard 140–2007 Standard Method of Test for the Evaluation of Building Energy Analysis Computer Programs; America Society of Heating, Refrigerating and Air-Conditioning Engineers: New York, NY, USA, 2010. [Google Scholar]
- Modelica Buildings Library 1.3_build1. Available online: http://simulationresearch.lbl.gov/modelica/Download#Python_BuildingsPy_Library_1.3.0_.282013-10-28.29 (accessed on 5 July 2016).


| Room Name | Highest Temperature (°C)/ Date, Time | Lowest Temperature (°C)/ Date, Time |
|---|---|---|
| Lower Room | BIM version: 33.6 °C/19 July, 8 p.m. | BIM version: −13.2/8 January 10 a.m. |
| LBNL version: 34.1 °C/19 July, 8 p.m. | LBNL version: −13.7/8 January, 10 a.m. | |
| Upper Room | BIM version: 39.2 °C/18 July, 10 a.m. | BIM version: −16.2/8 January, 7 a.m. |
| LBNL version: 39.7 °C/18 July, 10 a.m. | LBNL version: −15.6/8 January, 7 a.m. |
| Room Name | Highest Temperature (°C)/ Date, Time | Lowest Temperature (°C)/ Date, Time |
|---|---|---|
| West Room | BIM version: 34.5 °C/19 July, 9 p.m. | BIM version: −13.8/8 January, 11 a.m. |
| LBNL version: 34.8 °C/19 July, 9 p.m. | LBNL version: −13.8/8 January, 11 a.m. | |
| East Room | BIM version: 40.2 °C/18 July, 1 p.m. | BIM version: −13.5/8 January, 7 a.m. |
| LBNL version: 40.3 °C/18 July, 1 p.m. | LBNL version: −13.6/8 January, 7 a.m. |
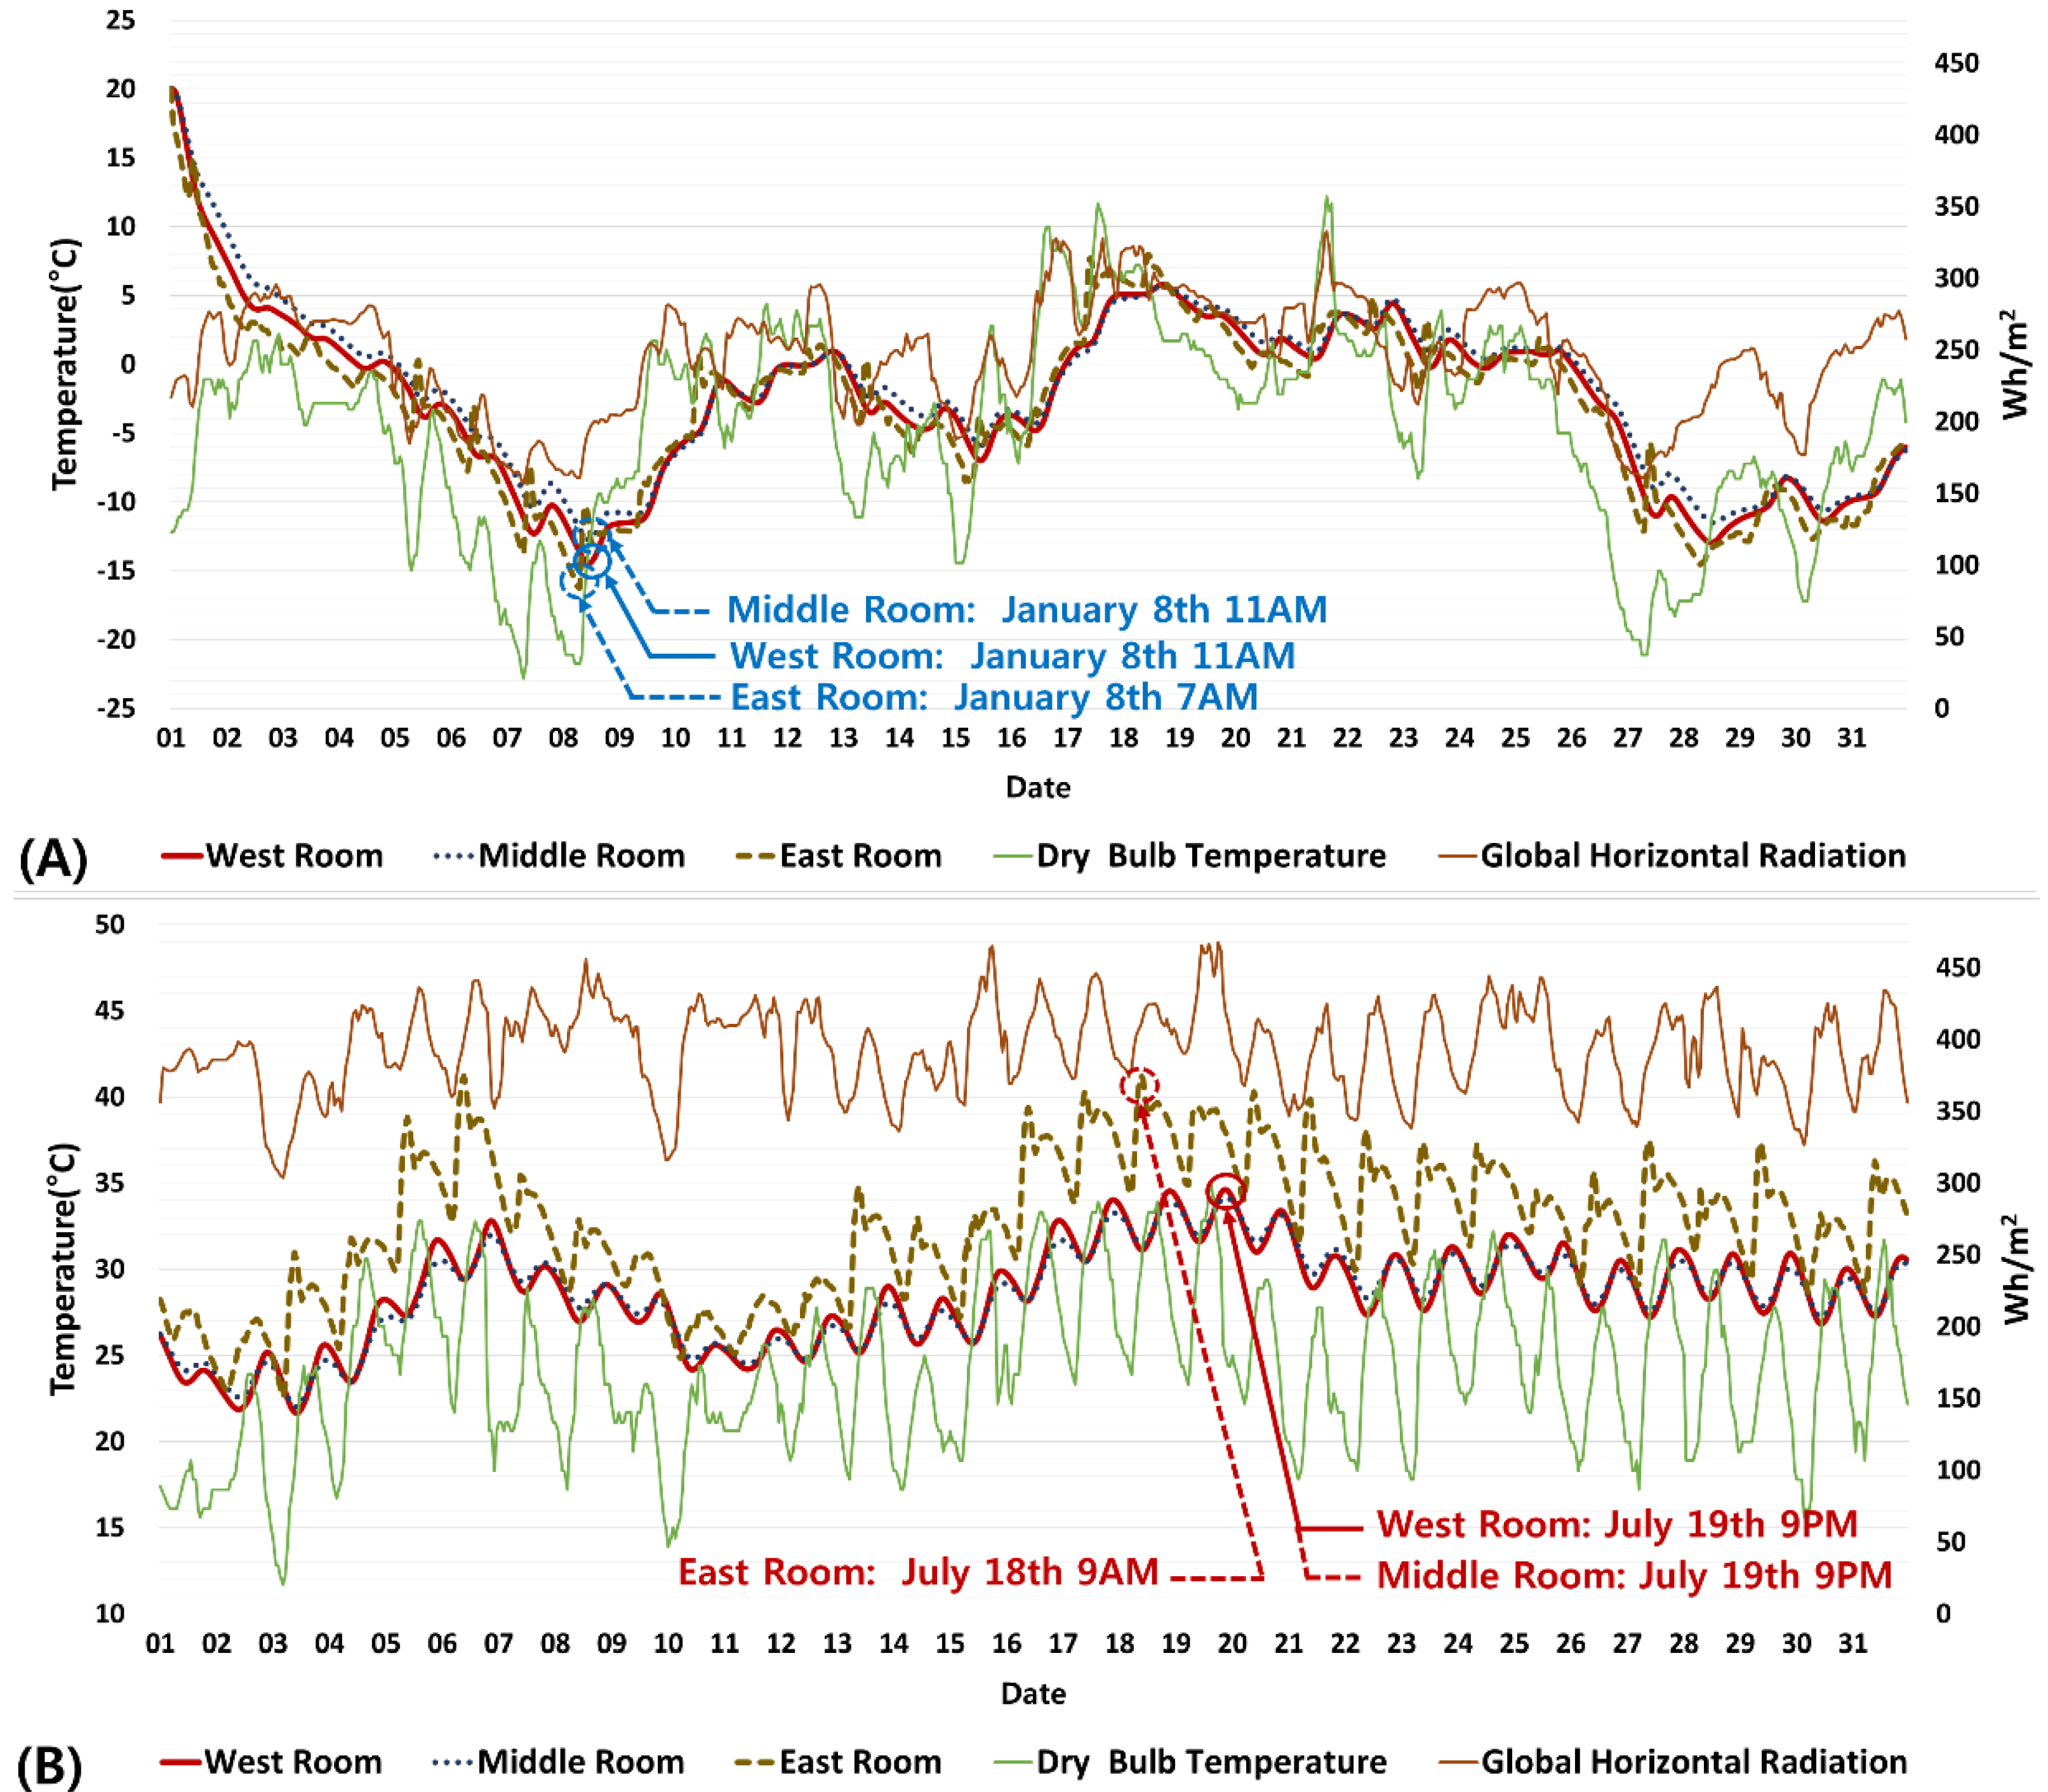
| Room Name | Highest Temperature (°C)/ Date, Time | Lowest Temperature (°C)/ Date, Time |
|---|---|---|
| West Room | BIM version: 34.2 °C/19 July, 9 p.m. | BIM version: −14.5 °C/8 January, 11 a.m. |
| LBNL version: 34.6 °C/19 July, 9 p.m. | LBNL version: −14.4 °C/8 January, 11 a.m. | |
| Middle Room | BIM version: 33.7 °C/19 July, 9 p.m. | BIM version: −12.8 °C/8 January, 11 a.m. |
| LBNL version: 34.1 °C/19 July, 9 p.m. | LBNL version: −12.7 °C/8 January, 11 a.m. | |
| East Room | BIM version: 40.7 °C/18 July, 9 a.m. | BIM version: −16.1 °C/8 January, 7 a.m. |
| LBNL version: 41.2 °C/18 July, 9 a.m. | LBNL version: −16.2 °C/8 January, 7 a.m. |
© 2016 by the authors; licensee MDPI, Basel, Switzerland. This article is an open access article distributed under the terms and conditions of the Creative Commons Attribution (CC-BY) license (http://creativecommons.org/licenses/by/4.0/).
Share and Cite
Jeong, W.; Kim, K.H. A Performance Evaluation of the BIM-Based Object-Oriented Physical Modeling Technique for Building Thermal Simulations: A Comparative Case Study. Sustainability 2016, 8, 648. https://doi.org/10.3390/su8070648
Jeong W, Kim KH. A Performance Evaluation of the BIM-Based Object-Oriented Physical Modeling Technique for Building Thermal Simulations: A Comparative Case Study. Sustainability. 2016; 8(7):648. https://doi.org/10.3390/su8070648
Chicago/Turabian StyleJeong, WoonSeong, and Kee Han Kim. 2016. "A Performance Evaluation of the BIM-Based Object-Oriented Physical Modeling Technique for Building Thermal Simulations: A Comparative Case Study" Sustainability 8, no. 7: 648. https://doi.org/10.3390/su8070648
APA StyleJeong, W., & Kim, K. H. (2016). A Performance Evaluation of the BIM-Based Object-Oriented Physical Modeling Technique for Building Thermal Simulations: A Comparative Case Study. Sustainability, 8(7), 648. https://doi.org/10.3390/su8070648