Article

Cultural Attitudes as WTP Determinants: A Revised Cultural Worldview Scale

1
National Institute of Ecology, Seocheon, Choongnam 325-813, Korea
2
Institute for Social Science Research, University of Queensland, Brisbane QLD 4072, Australia
*
Author to whom correspondence should be addressed.
Sustainability 2016, 8(6), 570; https://doi.org/10.3390/su8060570
Submission received: 8 March 2016 / Revised: 4 May 2016 / Accepted: 7 June 2016 / Published: 17 June 2016
(This article belongs to the Special Issue Sustainability of Cultural and Natural Heritage)

Abstract

:
There has been little attention paid to the systematic measurement issue of general attitudes toward human-culture relationships. This paper applied the Cultural Worldview (CW) scale that was developed by Choi et al. in 2007 (published in the Journal of Cultural Economics), and investigated its dimensionality and relationship with willingness to pay (WTP) for cultural heritage protection through a sequential integration between latent variables and valuation models. A case study of 997 Korean respondents was employed to examine conservation values of cultural heritage sites using discrete choice models. Confirmatory factor analyses demonstrated that this scale can be used either as a single second-order factor or four correlated factors. A more parsimonious version of the CW scale with twelve items is endorsed in this paper and the results also confirm that it is valid for use with non-Western nations. The findings support a significant attitude–WTP relationship; there was a significant role of the CW scale that reveals unobserved factors in valuation models.

1. Introduction

The issue of population heterogeneity plays a critical role in explaining stated preferences in nonmarket valuation studies. Value estimates might not be reliable or valid if this issue is not properly treated [1,2]. One way to address population heterogeneity is to incorporate attitudinal characteristics of respondents as a part of standard economic models [3,4,5,6,7,8]. This incorporation is necessary, as researchers are eager to gain more insights into how respondents engage in the choice processes and to improve the explanatory power of choice models [7,9,10,11]. In environmental studies, the New Ecological Paradigm (NEP) scale of Dunlap et al. [12] has been widely applied [13], linking environmental attitudes to stated preferences or environmentally motivated behavior. However, there has been limited research in the literature of environmental economics and cultural economics dealing with systematic measures of cultural attitudes or general beliefs that assess the cultural concern of respondents. In a wider context, cultural aspects of ecosystem services and how people consider their significance might also be important in understanding human-nature relationships [14].
Systematic measures of attitudes are different from other ad hoc indicators such as memberships and institutional trust [4], by employing scales as measurement instruments. A scale consists of a set of selected statements or manifest items that are expected to assess or reflect theoretical latent variables, constructs, or factors [15]. Systematic measures of cultural attitudes are useful, and in many cases necessary, to investigate the multidimensional nature of cultural preferences [16,17] and to reveal how respondents can vary in their cultural attitudes.
To address this research gap, Choi et al. [18] developed a Cultural Worldview (CW) scale that aimed to measure procultural attitudes (i.e., perceived human-culture relationships) in terms of general beliefs and perceptions (i.e., general attitudes). Attitudes are broadly defined as a mental state in which a favorable or unfavorable evaluation toward an object is processed [19]. Building on the multidimensional nature of cultural values [16,17], the CW scale addresses the heterogeneity issue of cultural nonmarket valuation by providing additional information about latent constructs of people’s cultural concern and about individual positions in the constructs. Choi et al. [18] defined cultural value as the perceived economic significance of cultural goods and services in an effort to explain why some people attach more value (significance or importance) to the same degree of conservation activities involving cultural heritage than others. Alternative definitions are also available in the literature where cultural values can also refer to various social cognitions about culture, which might be of a different entity from economic values of cultural goods and services. Some researchers argue that neoclassical economic models might be unable to reflect cultural values in an appropriate and adequate way [20]. On the other hand, neoclassical economists might argue that anthropocentric values of cultural goods and services can be transformed into a one-dimensional utility space that can be subsequently delivered as economic values [21]. It might be possible that “socio-cognitive” cultural values define cultural goods and services, while “economic” cultural values provide their approximate quantity in monetary terms. There is an increasing interest in the literature on measuring cultural attitudes and including them in nonmarket valuation studies [22,23].
In effect, both the CW scale and the NEP scale measure attitudinal dispositions that are general and relatively stable in time and context. According to the literature of behavioural psychology, value orientations and beliefs determine specific attitudes and norms that subsequently influence behavioral intentions and actual behaviors [24,25,26]. This suggests that cultural attitudes should be related to outcomes such as cultural heritage protection via intentions to protect cultural heritage sites. As stated preferences in the form of willingness to pay (WTP) are expressions of behavioral intention [27], we would expect to see a positive relationship between CW scores and WTP estimates [11]. Systematic and effective measures of general cultural attitudes are important in addressing the heterogeneity issue of nonmarket valuation by revealing unobserved factors of economic models [28]. Thus, cultural attitudes measured by the CW scale can be considered as motives for stated preferences involving cultural goods and services.
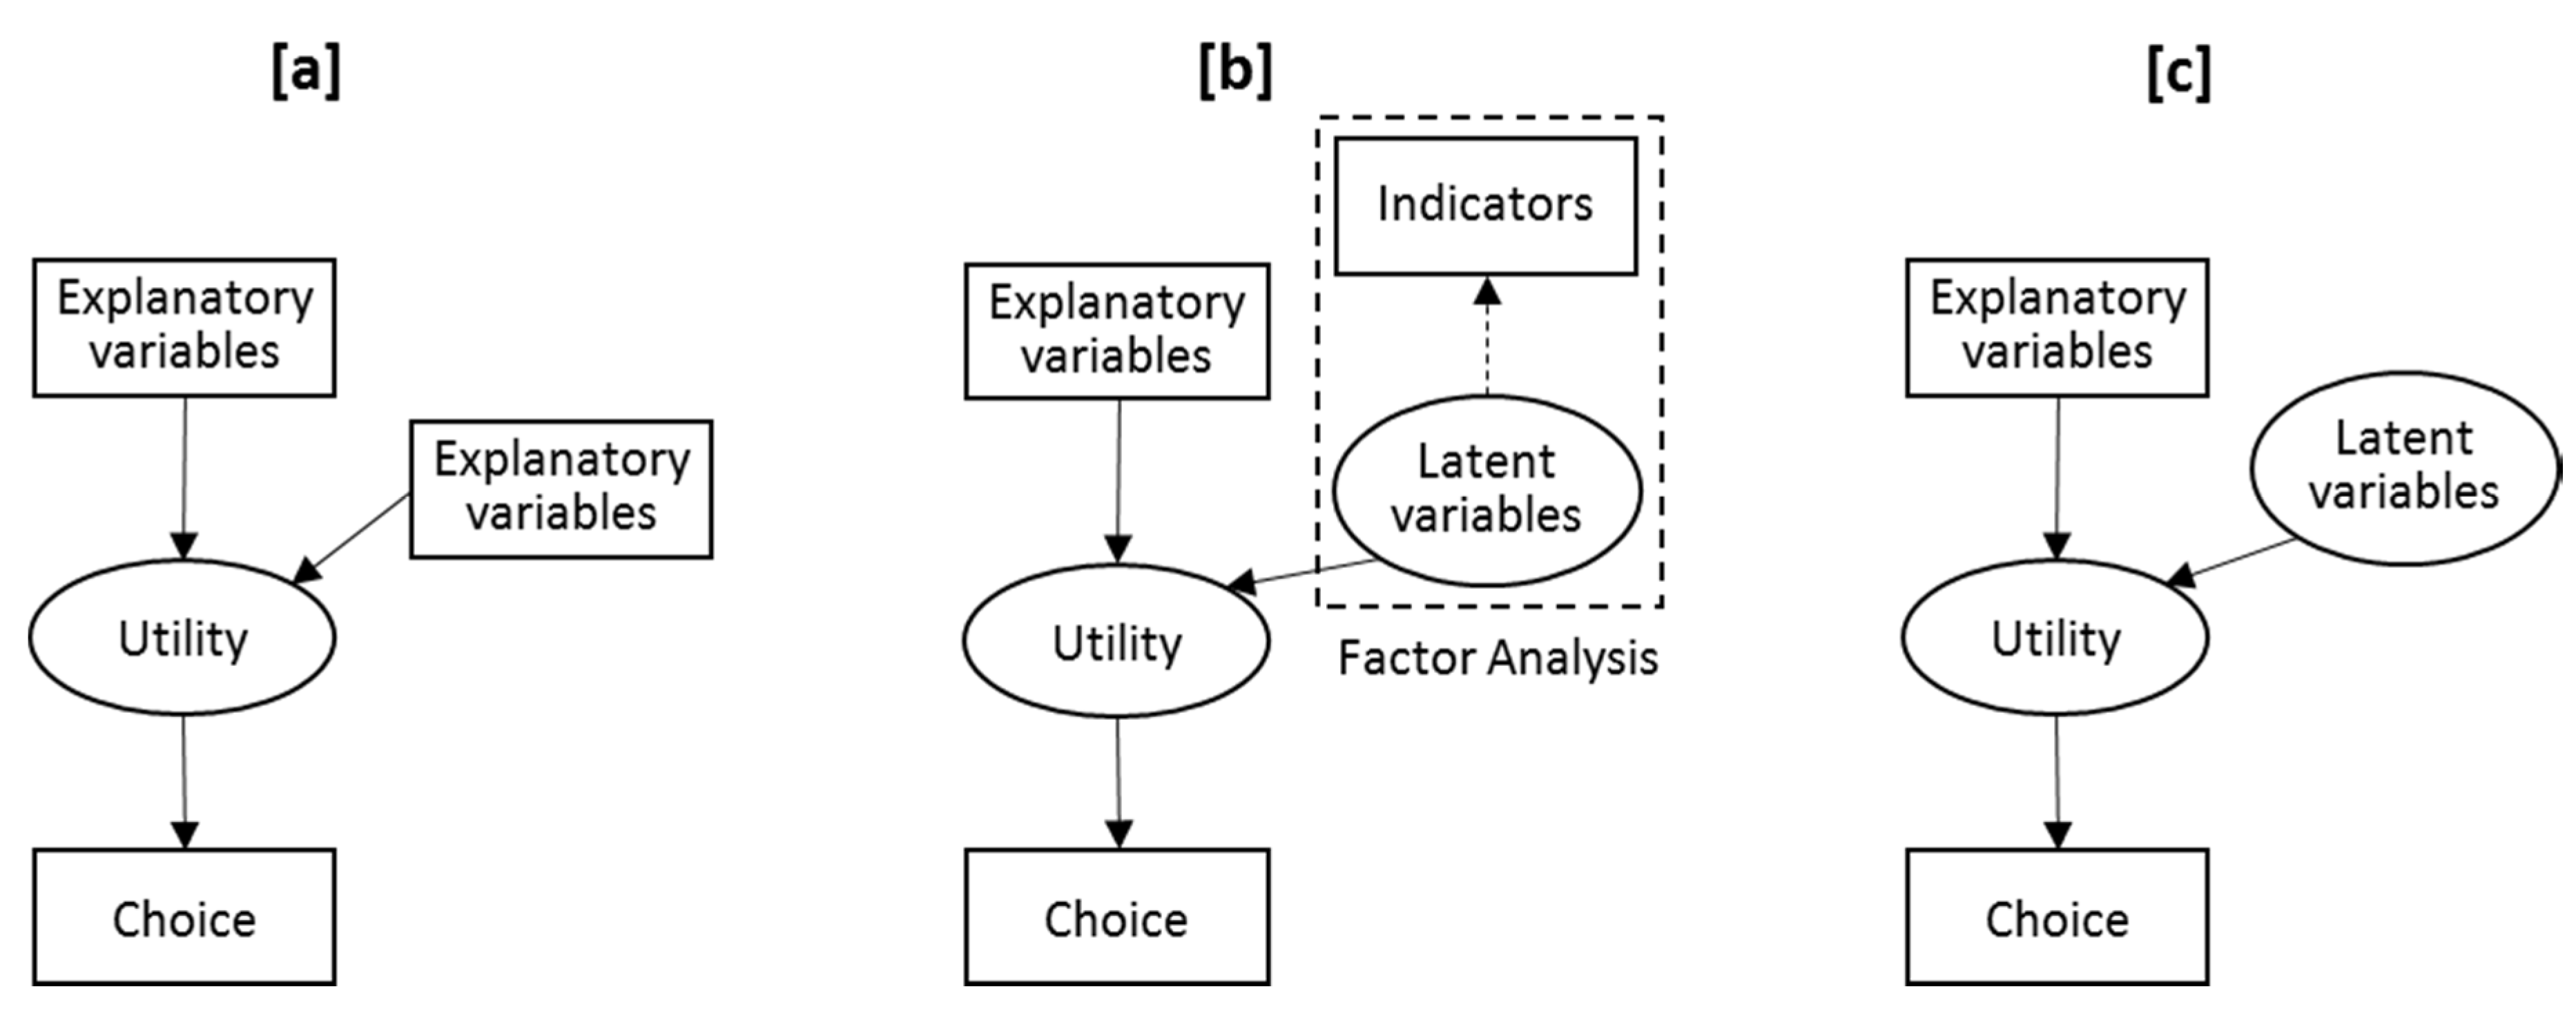
When attitudinal characteristics of respondents are incorporated into economic models as unobserved factors they are normally employed as explanatory variables [5,8,29] or as segmentation criteria for cluster analysis [30,31,32]. Some studies that have applied systematic measurement scales have shown mixed empirical findings for the attitude–WTP association [3,4,6,33]. The findings of Cooper et al. [3] contradicted the significant NEP–WTP relationship that was reported by Kotchen and Reiling [4], while Choi and Fielding [6] offered a new insight into a more complex nature of this relationship in the context of discrete choice models. In relation to cultural attitudes specifically, Choi [33] found that attitudinal traits that were measured using the CW scale might not have significant explanatory power for some cultural WTP estimates. Nonetheless, considering that both stated preferences and attitude–WTP relationships are sensitive to specific contexts [21], more empirical studies are needed prior to any generalization [33]. In addition to the need for further research to test the CW–WTP association, the factor structure of the CW scale and its applicability to non-Western contexts also need to be confirmed before its wide use as a measurement scale [34,35].
This paper aims to investigate the latent dimensionality underlying the CW scale and to examine attitude–WTP relationships in the context of discrete choice models involving cultural heritage sites. In so doing, it also aims to develop a more parsimonious CW scale that may be more effective and useful for its wide use. Although multiple dimensions are commonly assumed and designed during the development process of measurement scales (e.g., the NEP scale), past research does not always find support for the originally intended structure of scales. For example, the NEP was conceptualized as having five underlying factors, but most research using the scale treats it as one general factor. In addition, the reliability of scales may vary substantially between Western and non-Western populations [13]. This study offers evidence that the CW scale might provide a reliable multifactor structure across Western and non-Western applications. Confirmatory factor analyses confirm that the scale can be used either as a single second-order factor or four correlated factors. Further, a significant CW–WTP association demonstrates a significant role of the CW scale that reveals unobserved heterogeneity in the economic models, offering future research opportunities for this scale.
In developing and testing a measure of cultural attitudes, this paper makes an important contribution to the literature on cultural sustainability. There is great benefit to researchers, and to the literature more generally, in developing a reliable and parsimonious measure of cultural attitudes that can be used across different cultures. A standard measure allows for comparison of results across studies and for cultural attitudes to be easily measured and incorporated into a range of research settings, including nonmarket valuation studies. This has certainly been the case for the NEP, which is a widely used measure of environmental attitudes that has been used in relation to a range of research topics and, because of its standardization, has allowed for comparisons across those studies [13].
In terms of paper organization, the following two section introduce major issues of attitudinal scales and theoretical models, and describe the data collection, respectively. Section 4 reports results from confirmatory factor analyses and the test of attitude–WTP relationships. Section 5 provides a brief summary of the findings and discussion.

2. Latent Attitudinal Variables and Valuation Models

2.1. Major Issues of Attitudinal Scales

Measurement instrument scales need a collection of statement items that are carefully devised by researchers to empirically represent latent and theoretical variables that are not directly observed in the real world [15]. These variables are also known as latent constructs, facets, and factors. Of the existing scales to measure environmental attitudes, the NEP scale is the most widely used [13] and some critical issues raised for the NEP scale are also relevant to the CW scale as they both measure general attitudes rather than behavior-specific attitudes. The first issue relates to the dimensional structure of a scale. Although the NEP scale was developed based on multiple factors, empirical studies using the NEP have rarely found evidence of these. The five theorized factors are the reality to limits of growth (Items 1, 6, 11), anti-anthropocentrism (Items 2, 7, 12), the fragility of nature’s balance (Items 3, 8, 13), rejection of exemptionalism (Items 4, 9, 14), and the possibility of an ecocrisis (Items 5, 10, 15). Instead, most studies create a summed index by adding up all item scores thereby treating the scale as one factor [13]. In the development and application of the CW scale, it will be important to clarify its expected dimensional structure and how different structures perform in empirical models.
The second point of concern comes from the use of modified versions of measurement scales. As the NEP scale became widely used, shorter versions with differing formats (e.g., six items) have been used by various researchers [13]. The use of different versions of the NEP in research could undermine the potential for systematic comparisons across studies, although shorter versions might be useful in saving questionnaire space and reducing respondent burden. Clearly, there is great benefit in establishing an agreed version of a scale to allow for greater comparability across studies. This issue emphasizes the importance of developing a CW scale that includes only essential items for each factor and is therefore parsimonious. This will place less burden on respondents and make the scale more likely to be used by researchers.
The final issue that needs to be addressed is the applicability of scales to Western and non-Western samples. This is a critical issue for a CW scale that needs to be relevant to people regardless of their ethno-cultural backgrounds. In this regard, characterization of cross-cultural differences in a multidimensional context (e.g., five dimensions of Hofstede and McCrae [36]) is fundamentally different from the attitudinal characteristics of cultural concern. Recent studies that have employed the NEP with non-Western samples have demonstrated low reliability of the scale, with Cronbach’s alphas between 0.53 and 0.66 [37,38,39]. These empirical results raise questions about the applicability of the NEP scale outside Western nations [40]. Thus, empirical confirmation is necessary to ensure that the CW scale can be effectively employed across Western and non-Western countries.

2.2. Attitudinal Variables and Choice Models

As to the structure of the CW scale, Choi et al. [18] identified nineteen items that showed four underlying factors: perceived connectedness between people of different generations and different cultural backgrounds (F1; LINKAGES), recognition of diverse cultural values (F2; RECOGNITION), awareness of cultural loss (F3; LOSS), and preservation of traditions and customs (F4; TRADITIONS). When Choi et al. [18] tested this scale with two Australian samples with partially different items, the four-dimensional structure was reasonably stable and reliable, with Cronbach’s alpha (showing internal consistency) values ranging between 0.69 and 0.83 for the four sub-scales. Research has also demonstrated the content validity, predictive validity, and construct validity of the CW scale, although, there is some suggestion that the cultural loss sub-scale (F3) may not contribute to the overall explanatory power of the scale as much as the other factors [18]. Choi et al. [18] proposed a combined version, which has not been empirically tested as a single scale, with the nineteen items slightly modified from those used in the two case studies (see Table 3). Consequently, further research is needed to confirm whether the four dimensions of the CW scale persist in other contexts, particularly involving non-Western samples, and whether this four-factor structure is empirically meaningful.
Once latent variables reflecting cultural predispositions are measured using factor analysis or structural equation models they need to be incorporated into discrete choice models. Daly et al. [7] and Kim et al.’s [41] review of previous research suggests three main approaches for integrating latent variables info choice models: manifest indicators, sequential integration, and simultaneous integration. Studies using manifest indicators include incorporating responses to attitudinal questions directly into choice models (see Figure 1a). Although straightforward and widely used, this approach is subject to inconsistent estimates and endogeneity bias (i.e., correlated errors between responses to indicator items and choices) [7]. Another approach is “sequential” estimation (see Figure 1b). With this approach measurement models are developed to identify factors (i.e., latent variables) and the factor scores that emerge from the measurement model are subsequently incorporated into choice analysis [29,42]. The third approach involves a simultaneous estimation of latent variables and discrete choices (see Figure 1c). For this approach, latent variables are either segment-specific constants (i.e., without indicators) [43] or indicator-specific (i.e., to be estimated based on the indicators) [7,44]. We made a general statement here for this approach by emphasizing the simultaneous estimation aspect, where inclusion of indicators for latent variables in the estimation models can be optional. Segment-specific latent attributes do not vary among individuals within each market segment, working as alternative specific constants, while indicator-specific latent attributes are estimated based on responses on the given indicator items (for more details, see Daly et al. [7]).
The present study applied the sequential integration approach. This requires factor scores to be estimated prior to the economic analysis, and general statistical conditions for factor analysis apply here. Items need to have a factor loading score greater than 0.4 for a significant factor membership [45] and those with more than one membership were discarded. Also, only factors with an eigenvalue greater than one were considered. In order to guarantee the internal consistency of the factor items (i.e., the collective reliability defining a single factor), Cronbach’s alpha coefficient for each factor needs to be greater than 0.7 [46]. Furthermore, once structural models involving multiple factors are developed, their model fits are normally assessed using the chi-square (χ2) to degrees of freedom (df) ratio, the Root Mean Square Error of Approximation (RMSEA; [47]), the Comparative Fit Index (CFI; [48]), and the Standardized Root Mean squared Residual (SRMR). A model is considered to have a good fit to the data when its χ2/df < 2, CFI > 0.90, RMSEA < 0.08, and SRMR < 0.05 [49]. The final step for the sequential integration is to utilize the calculated factor scores during the estimation process of discrete choice models.

2.3. Discrete Choice Modeling

In order to fully understand the role of the CW scale in improving valuation models by measuring and revealing unobserved heterogeneity, it is necessary to comprehend how cultural WTP values are estimated in discrete choice models. Cultural heritage sites or visitors’ interactions with tangible and intangible cultural goods and services often provide public good values. These values are positive externalities and the market prices are unable to capture their full benefits to society. In order to measure the relative economic values of these goods at the margin [50], stated preference valuation methods, such as contingent valuation methods or discrete choice modeling, are commonly applied. These methods are necessary because the consumer surplus or demand is difficult or impossible to quantify when no markets exist or relevant market transactions are not available for meaningful inferences (i.e., revealed preferences) [51,52]. In particular, the choice modeling technique is currently widely used across various disciplines, such as transportation, environmental economics, health economics, marketing, cultural economics, and tourism [53,54,55,56,57].
The choice modeling technique is based on the random utility maximization model [58]. Rational choices of respondents lead to the choices that provide the maximum utilities in a given choice situation. Respondents normally face multiple choice questions where they select the most preferred alternative. Different alternatives are defined with a bundle of attributes describing the relevant goods or services and their level changes [59]. One of the choice options is usually a status quo or no action alternative. Discrete choice experiments examine the contextualized heuristic process that explains latent utilities underlying the reported choices by respondents. This modelling technique is different from other conjoint-based approaches involving rating or ranking of alternatives. As utilities are latent properties, choice probabilities of different choice options are expressed as a function of choice attributes and characteristics of respondents [60]. The expected utility of individual q facing option i (Uiq) is comprised of the observable deterministic component (Viq) and the unobservable random component (εiq): Uiq = Viq + εiq. In order to develop simplified but useful operational models explaining choice probabilities, researchers made important behavioral assumptions; for example, the random component is independently and identically distributed (IID) over alternatives and individuals [60,61]. This assumption leads to the extreme value type 1 (EV1) distribution of the random component, further leading to the probability statement of the multinomial logit (MNL) model [61,62]: the probability for the option to be chosen (Liq) within a set of J alternatives.
L i q = exp V i q j   =   1 J exp V j q
Overcoming the restrictive assumption and other operational restrictions (for details, see Train [60]), random parameter logit (or mixed logit) models became popular in the last fifteen years. These models are particularly useful when researchers examine a distribution of estimates or heterogeneous preferences (i.e., random coefficients with a significant stand deviation) and identify source variables for the revealed preference heterogeneity [28,61,63]. Choice probabilities of random parameter logit models are calculated as a mean of Liq over a density function (f(β)) [60]:
P i q = L i q f ( β ) d β
Following the “characteristic theory of value” of Lancaster [59], the indirect utility is normally explained by a bundle of choice attributes and characteristics of respondents. As shown in Choi and Fielding [6], random parameter logit models allow researchers to examine whether particular characteristics variables (e.g., CW factors) are linked to significant preference heterogeneity for a particular choice attribute. To do this, the present study applied the sequential integration approach, where latent variables are estimated, before their factor scores for individual respondents are used for interaction terms with random parameter estimates:
V i q = α i q Y i + β i q ( α i q Z q ) + γ i q M i + k = 1 K δ i q k X i k
where Yi is a particular attribute describing cultural goods and services (e.g., a number of heritage sites or the extent to which cultural items are interpreted for visitors); Zq is a vector of respondent characteristics; Mi is the payment variable; Xik is one of the K remaining attributes other than the cultural and payment variables; and α, β, γ, δ are coefficients. The interaction term (αiqZq) is necessary in order to reveal heterogeneous preferences around the mean of a random parameter. Following routine procedures for model estimation, these coefficients are determined by the maximum likelihood estimation that offers the best explanatory power of the collected choice data. Then the WTP for a cultural change can be calculated as a negative ratio between the parameters that describe marginal utilities of the cultural variable (α and β) and the monetary parameter (γ):
W T P = α + β Z ¯ γ
where Z ¯ and β are a vector of the mean values for respondent characteristics (Zq) and a vector of their parameter estimates from Equation (3), respectively.

3. Empirical Data

This paper involves a host of cultural heritage sites that are registered at the national and local levels and located along the Demilitarized Zone (DMZ) between North and South Korea, mostly within its southern Civilian Control Zone (for detailed information about this case study, see Choi [57]). Tourists are allowed to visit only designated sites along the DMZ, in a controlled environment under military supervision. Limited agricultural activities are also possible in the Civilian Control Zone. Since 1953, when the Korean War was put into the Armistice Agreement, these areas have served both as a geopolitical buffer and as a vault of diverse ecological and cultural assets [64,65]. Although a few researchers have examined the conservation values of ecological resources in these areas [57,66,67], little has been reported in the literature on the welfare benefits stemming from those cultural heritage sites within the restricted areas of the DMZ. Conservation values of the DMZ resources, including cultural heritage sites, are critically important because the long-awaited unification on the Korean peninsula can lead to a potentially destructive path (i.e., a careless development rush) for many rare species and heritage sites [68].
In order to frame choice situations, major resources of the DMZ areas were defined using focus groups, expert consultations, and one pretest (for a detailed description of this qualitative stage, see Choi [57]). The experimental designs were also improved using a D-optimal efficient design. As shown in Table 1, the number of cultural heritage sites (CUL) was one of the six attributes that were employed to describe varying conservation levels. Other attributes included the symbolic areas of the DMZ to be preserved when a peaceful inter-Korean relationship is eventually realized in the future (AREA), the UN guarded negotiation house (“Panmungeom”) as one of many war-related sites (MIL), ten special villages located within the CCZ (VIL), and the number of endangered species (SPE). A voluntary conservation fund (FUND) in Korean Won (KRW) was adopted as a payment vehicle [67], with varying levels between 2500 KRW (US$2.08) and 20,000 KRW ($16.67).
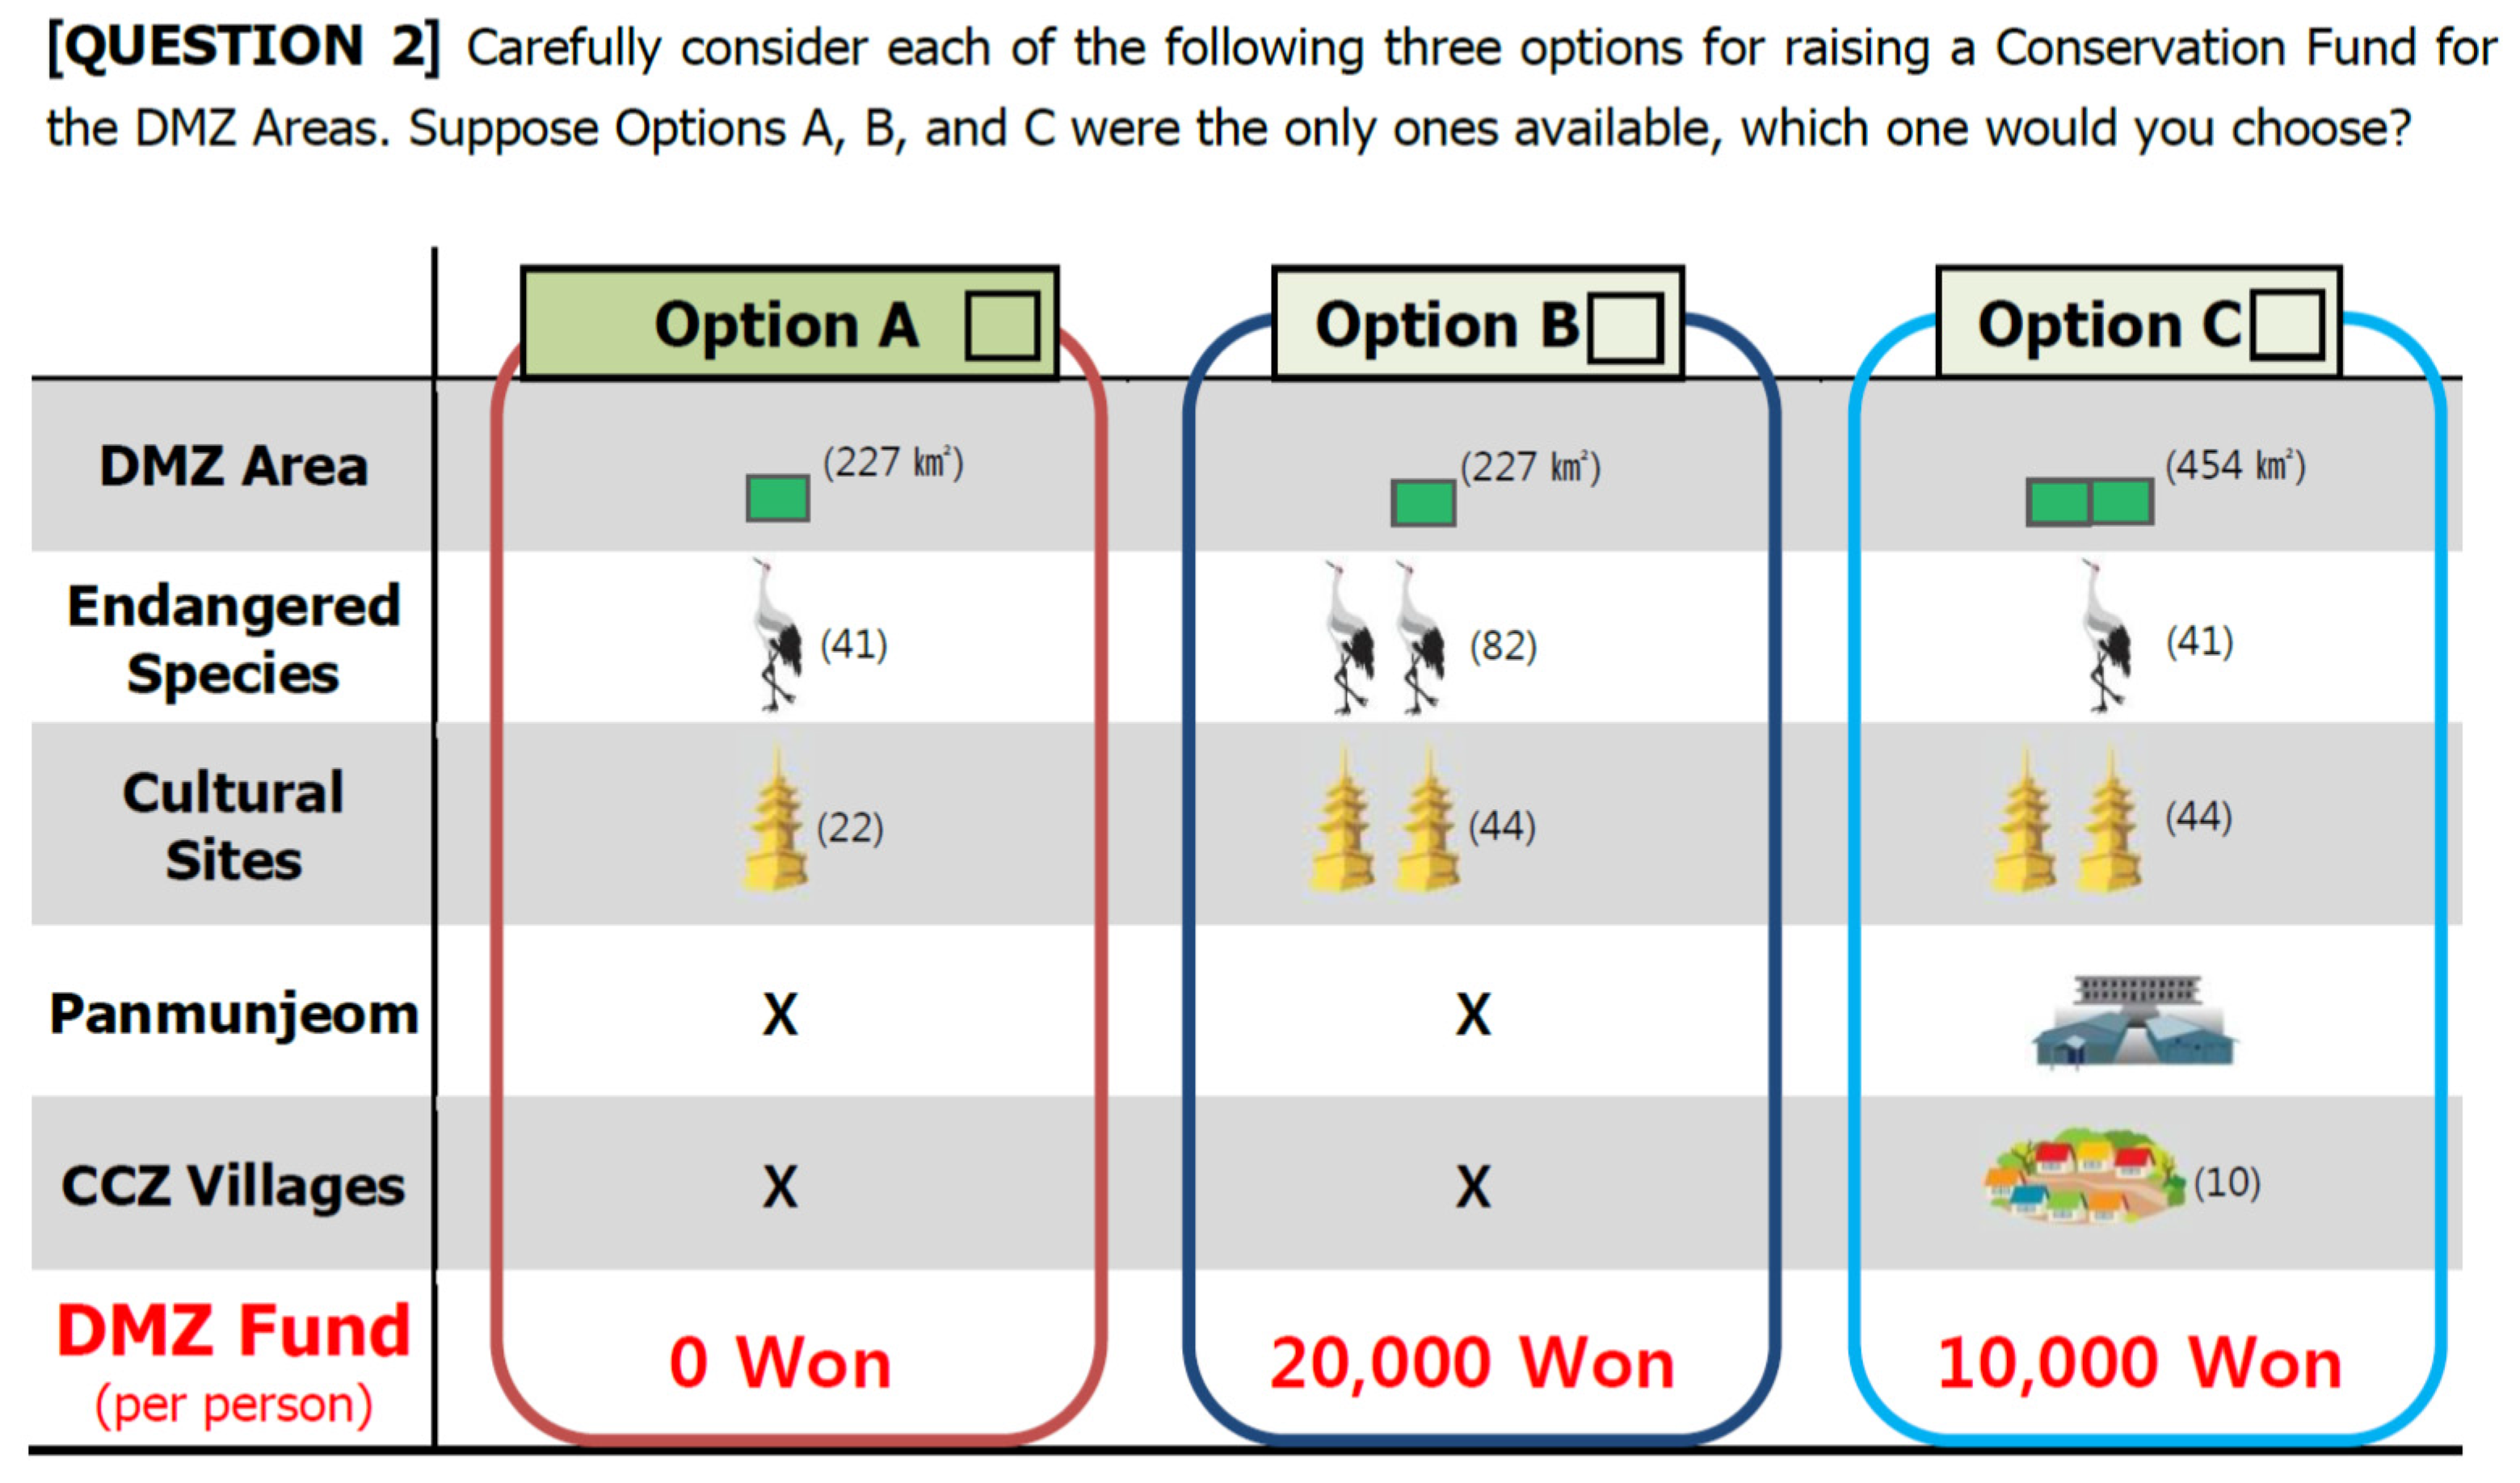
Questionnaires were developed through focus group reviews and a pre-test involving 100 respondents living in Seoul. Each questionnaire comprised three sections. Respondents were briefly introduced to the purpose of the study and some basic descriptions of the study areas, followed by a valuation section. They were informed that different management options of the DMZ areas can result in a loss of the major resources in the future. After the six attributes were introduced in a simple table, respondents were shown a couple of familiarization questions before they answered six choice questions, as shown in Figure 2. The first alternative (Option A) served as a reference that represented the hypothetical worst case scenario [69], which was compared against the other two options that included improved quality in the attributes. The final section was about respondent characteristics, including the original nineteen items of the CW scale.

4. Results

A nationwide survey was administered in South Korea in 2009 using self-completion questionnaires. Questionnaires were allocated to a number of local areas in order to meet a stratified random sampling design based on location, age, and gender, and trained survey assistants approached respondents. As a result, a total of 997 questionnaires were collected (see Table 2 for sample characteristics). As Table 2 shows, approximately half of the respondents were female, age was relatively evenly spread, and the sample had more respondents with college/university education than the national average. Just under half of respondents had visited the DMZ areas at least once.

4.1. A Shorter CW Scale with Twelve Items

A central aim of the paper was to develop a parsimonious version of the cultural worldviews scale that would be relatively brief and therefore easy to use. The originally suggested nineteen items were examined and then twelve items were selected for a balanced and efficient representation of the four-factor structure. Measurement scales normally include equal numbers of positively and negatively stated items in order to avoid agreement bias [15]. Odd-numbered items of the CW scale are procultural (i.e., in favor of preserving cultural resources), whereas even-numbered are anticultural (i.e., opposed to preserving cultural resources). As shown in Table 3, the sample in the current study showed general support for a procultural worldview and there was strong internal consistency of the overall scale (i.e., the nineteen items as a whole showed an alpha coefficient of 0.88). Some items in Table 3 receive more than 80% procultural support from respondents, such as Items 5, 9, 12, 16, 17, and 18. These are member items for either F1 (LINKAGES) or F2 (RECOGNITION). In contrast, responses to all four items of the F4 (TRADITIONS) suggested ambivalence on the part of many respondents, with more than 30% answering “Unsure”. They are Items 3, 7, 11, and 15. As a general practice, scores of odd-numbered items were reverse coded for the further analyses, so that increasing values indicate procultural views.
A shorter CW scale with twelve items is shown in Table 4. Three items with the highest loadings on each of the four factors were selected, which ranged between 0.48 and 0.78. New item numbers were designated for a balanced representation across the factors and for easy use, from CW1 to CW12. Scale reliability (Cronbach’s alpha) values were 0.76 (F1), 0.71 (F2), 0.73 (F3), and 0.78 (F4). Further, the shorter version, as a whole, showed a reliability value of 0.83. These reliability coefficients support the possibility of using the CW scale as a single factor or as multiple factors.

4.2. Confirmation of the Cultural Worldview Scale

Based on the shorter CW scale with twelve items, in order to examine a proper factor structure of the new CW scale with twelve items, confirmatory factor analyses were carried out as structural equation models using the statistical program AMOS 20.0 [70]. The maximum likelihood estimation was applied in this paper. As discussed above, the CW scale might be used either as a single factor with twelve items or four factors with three items each. Another possibility is to have a second-order structure. As a result, structural models could be single or four factors, either with or without a second-order factor. As shown in Table 5, variables within a multiple factor structure could also be either independent or correlated. For instance, three structural models with four factors were considered, whose factors were subject to three different relationships: independent, correlated, and second-order. As these a priori models shared the same manifest variables, they were nested models to one another.
When the data were examined closely, the fundamental assumption of multivariate normality for the maximum likelihood estimation was found to be violated. Although 52 respondents were subject to multivariate non-normality measured using Mahalanobis distance [71], the model fit relationships (reported below) among the seven models were not changed by deleting these individuals from the sample. At the same time, ten out of the twelve CW items had significantly negative skewness (absolute values of the skewness scores larger than three). Consequently, considering possible impacts of distributional misspecification on the model fit, the Bollen–Stine bootstrapping method was additionally considered [72].
Resulting model fit statistics are shown in Table 6. The single factor model shows the worst model fit, followed by multi-factor models with their latent variables uncorrelated. When the chi-square ratio is considered, the model with four correlated factors provides the best model fit. Also, the model with four factors that have a second-order factor has an acceptable fit. However, the difference in chi-square values between this model and the one with four correlated factors implies a significant improvement in the goodness-of-fit at the 0.05 level (∆χ2 (2) = 9.57).
Figure 3 and Figure 4 show the selected structural models that are standardized, with four factor dimensions either correlated or in a second-order structure, respectively. All factor loadings are significant, with scores ranging between 0.61 and 0.79, demonstrating their construct validity. As for the convergent validity, average variance extracted (AVE) for each construct was calculated [73]. The AVE values for the four factors are between 0.74 and 0.82, exceeding the recommended threshold value of 0.50. These latent variables are significantly correlated as they collectively measure the same attitudinal phenomenon [18]. In particular, F1 (LINKAGES), and F3 (LOSS) have the strongest correlation.

4.3. Cultural Attitudes and WTP

We theorize that cultural attitudes might work as significant motivations for culturally oriented WTP. In order to examine the CW–WTP relationship, two separate approaches were tested in this paper to incorporating latent variables into discrete choice models (i.e., sequential incorporation). The first approach represented the latent structure of the four correlated factors. Although these factors were significantly correlated, their explanatory powers for the unobserved preference heterogeneity might be different when examined individually as parts of choice models. The second approach to testing the attitude–WTP association was based on the second-order structure with four factors. As shown in Table 5, this structural model showed the second best fit that was acceptable. Further, there might be practical necessity when a single latent variable is preferred for parsimony to multiple factors, without knowing factor-specific contributions [3,4,12]. Accordingly, the first approach used four factor-specific scores, while the second approach employed the CW score that was supported by the four factors in a second-order structure.
Table 7 shows estimation results of three random parameter logit models using Nlogit 4. For random parameter logit models, the distributional simulation of parameter estimates was carried out using 200 Halton draws, and choice responses from the same individuals were treated differently from those from others using a panel data setting. The models include one alternative specific constant (ASC) that differentiates between Option A (the hypothetical worst case; ASC = 0) and the other two alternatives representing a conservation policy (ASC = 1). There exists significant preference heterogeneity around the means for most choice attributes, which are shown as significant standard deviations of parameter distributions, while the monetary parameter was constrained to be a constant in order to avoid the issue of undefinable moments [54,57,74]. Model A is the standard choice model that does not incorporate respondents’ characteristics. Models B and C include heterogeneity source variables as interaction terms of the CUL parameter estimates. Interaction terms link between preference heterogeneity and its potential sources (e.g., cultural attitudes) in discrete choice models.
According to the Chi-square statistics, these models have a significant model fit at the 0.01 level. Further, these models demonstrate an exceptional model fit with R2 values of 0.39 [75]. The two models with interaction terms show a significantly better goodness-of-fit than that of Model A at the 0.01 level, based on the standard likelihood ratio test [76], and Model B is slightly better than Model C, based on the Bayesian Information Criteria [77]. Parameter estimates are mostly significant with the expected signs.
However, estimation results of Model A show that respondents on average are not sensitive to a 50% loss of the currently available number of cultural heritage sites (CUL). This is in line with the results of Campbell et al. [56], showing that people might not be as sensitive to cultural changes as they are to ecological changes. At the same time, the CUL parameter of Model A has a significant standard deviation for the preference distribution that was modeled as a normal distribution. The distributed parameter estimates spread to both negative and positive sides, indicating potentially mixed preferences for pro- and anti-conservation of cultural heritage sites.
In order to explore the revealed preference heterogeneity in cultural preferences, Models B and C in Table 7 include some heterogeneity source variables as interaction terms with the CUL parameters. Socio-economic variables and cultural attitudes were individually tested for a significant interaction. These variables were age, gender, educational level (EDU; up to secondary education = 0, otherwise = 1), household income, and either the four CW factors (Model B) or the single CW score (Model C). Among these, EDU was the only significant socio-economic variable, together with either F4 (TRADITIONS), or CW (i.e., the latent CW variable with four component factors in a second-order structure). Accordingly, respondents who have finished tertiary education and who have strong cultural attitudes are likely to hold a significantly higher WTP than the others, ceteris paribus. In relation to the four CW factors, it is the perceived importance of traditions and customs (F4) that underpin the significant CW–WTP association, but not cultural linkages (F1), recognized diverse cultural values (F2), or the perception of cultural loss (F3).
As a consequence of the interactions, mean parameter estimates of the CUL attribute became significant, with a negative sign in Models B and C. As interaction terms were engaged as parts of the models, however, mean values for the CUL parameters (CUL’) need to be recalculated using the following equation [6,63]:
C U L = α + β Z ¯ + η
where η is the parameter distribution that is defined by the standard deviation parameter σ for a normal distribution N(0, σ2). For example, using the results from Model B the newly calculated mean for the CUL parameter estimate equals −1.6122 + 0.3586 × EDU + 0.4544 × F4. Mean values for EDU, F4, and CW are 0.62 (standard deviation 0.4844), 3.27 (standard deviation 0.5892), and 2.24 (standard deviation 0.2779), respectively. Accordingly, the newly calculated mean values for Models B and C are 0.0959 and 0.0838, respectively. The CW–WTP association is depicted as a linear line in this paper. Alternatively, a segmentation-based approach can be applied to capture a full spectrum of the attitude–WTP relationship [6].
Given the measured impacts from the source variables for the observed preference heterogeneity, as reported in Table 7, conservation values of cultural heritage sites can then be calculated using Equation (4). Mean implicit prices per person for the prevention of a 50% loss in the number of cultural heritage sites in the DMZ areas are 1308.31 KRW and 1176.51 KRW, respectively calculated for Models B and C, when simple ratios are taken based on the mean parameter estimates (these figures are 1217.24 KRW and 1182.76 KRW, respectively, when “common-choice-specific” (conditional) parameter estimates are applied [63]). Their 95% confidence intervals [78] are −1304.28 KRW and 3304.62 KRW for Model B, and −1296.90 KRW and 2975.17 KRW for Model C. These figures are 1217.24 KRW and 1182.76 KRW, respectively, when “common-choice-specific” (conditional) parameter estimates are applied [63]. In terms of preference heterogeneity, a procultural profile is those who hold a tertiary educational background (EDU = 1) and perceive traditions and customsto be important (e.g., F4 = 3.7). The opposite anticultural profile can be also considered (e.g., EDU = 0 and F4 = 2.7). When the two profiles are compared, the symbolic welfare benefits are respectively 5839.10 KRW and −5256.83 KRW, all other things being equal. The substantial value anomaly might explain the insignificant coefficient estimate of the CUL variable for Model A.

5. Discussion and Conclusions

The development of the Cultural Worldview (CW) scale has been a response to the paucity of systematic measures of cultural attitudes in the literature of cultural economics and nonmarket valuation. The current research extended previous research on the CW scale by examining key issues associated with the development of an attitudinal scale and identified a more parsimonious version with twelve items. In doing this, it has demonstrated how the scale benefits our understanding of preference heterogeneity involving cultural heritage sites. The scale might be useful for studies that aim to delve into attitudinal profiles of respondents or to segment populations according to perceived cultural importance. In particular, the CW scale can easily be incorporated into economic valuation models that try to address the population heterogeneity issue.
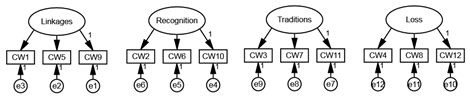
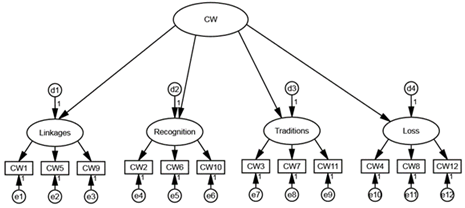
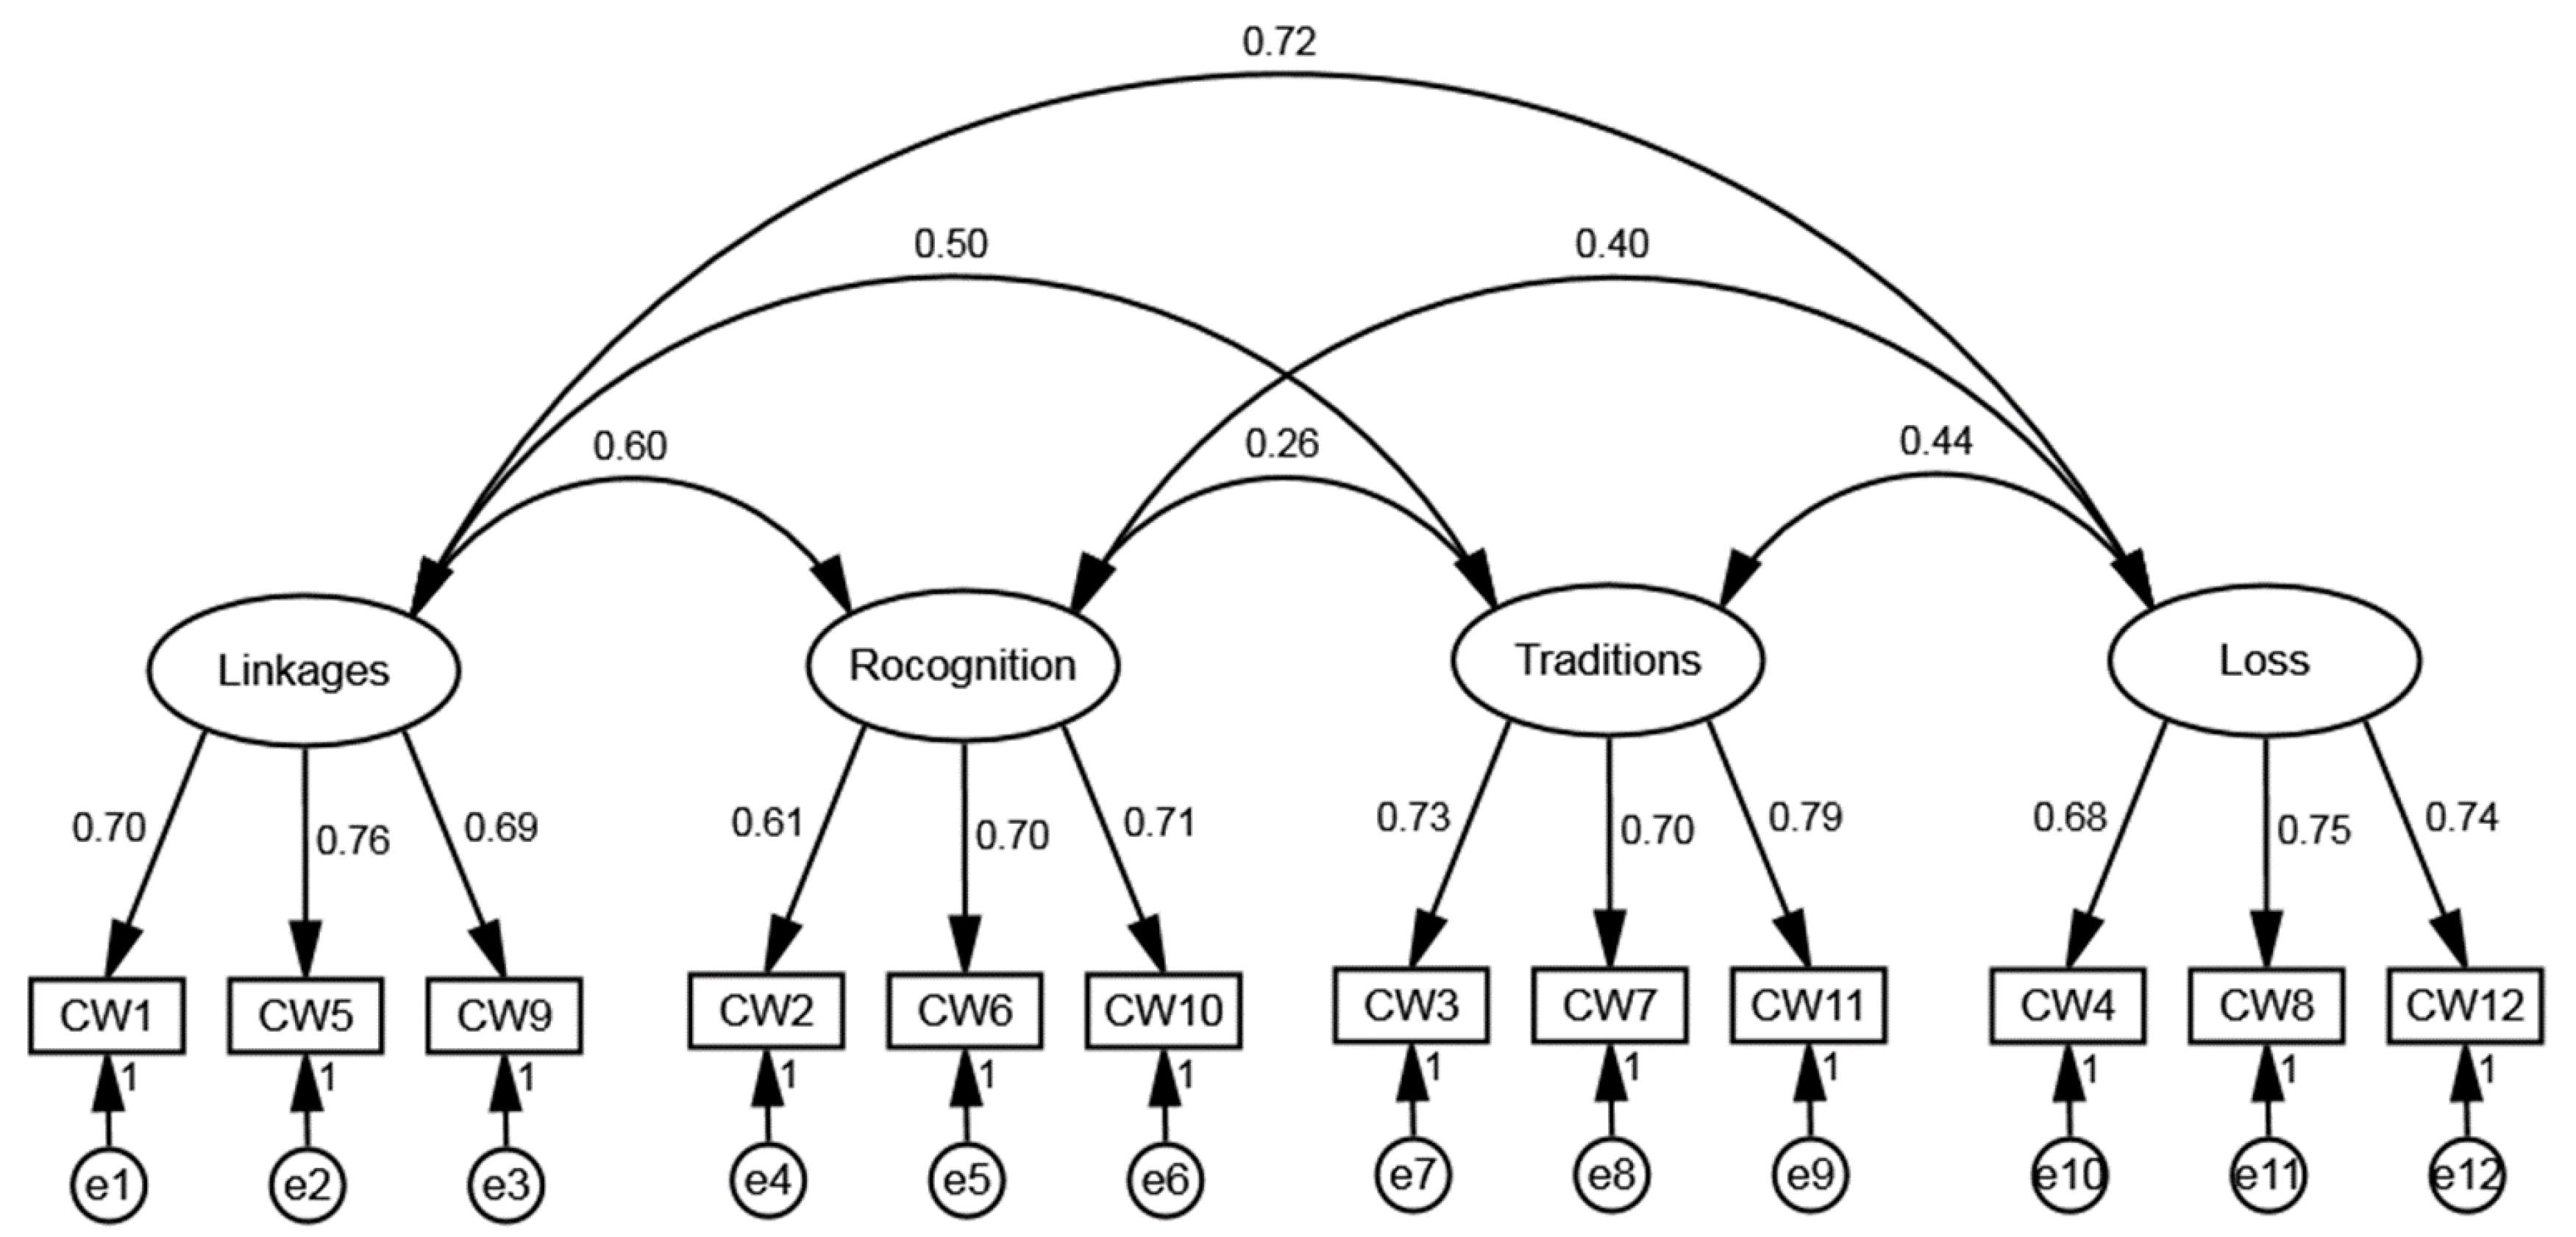
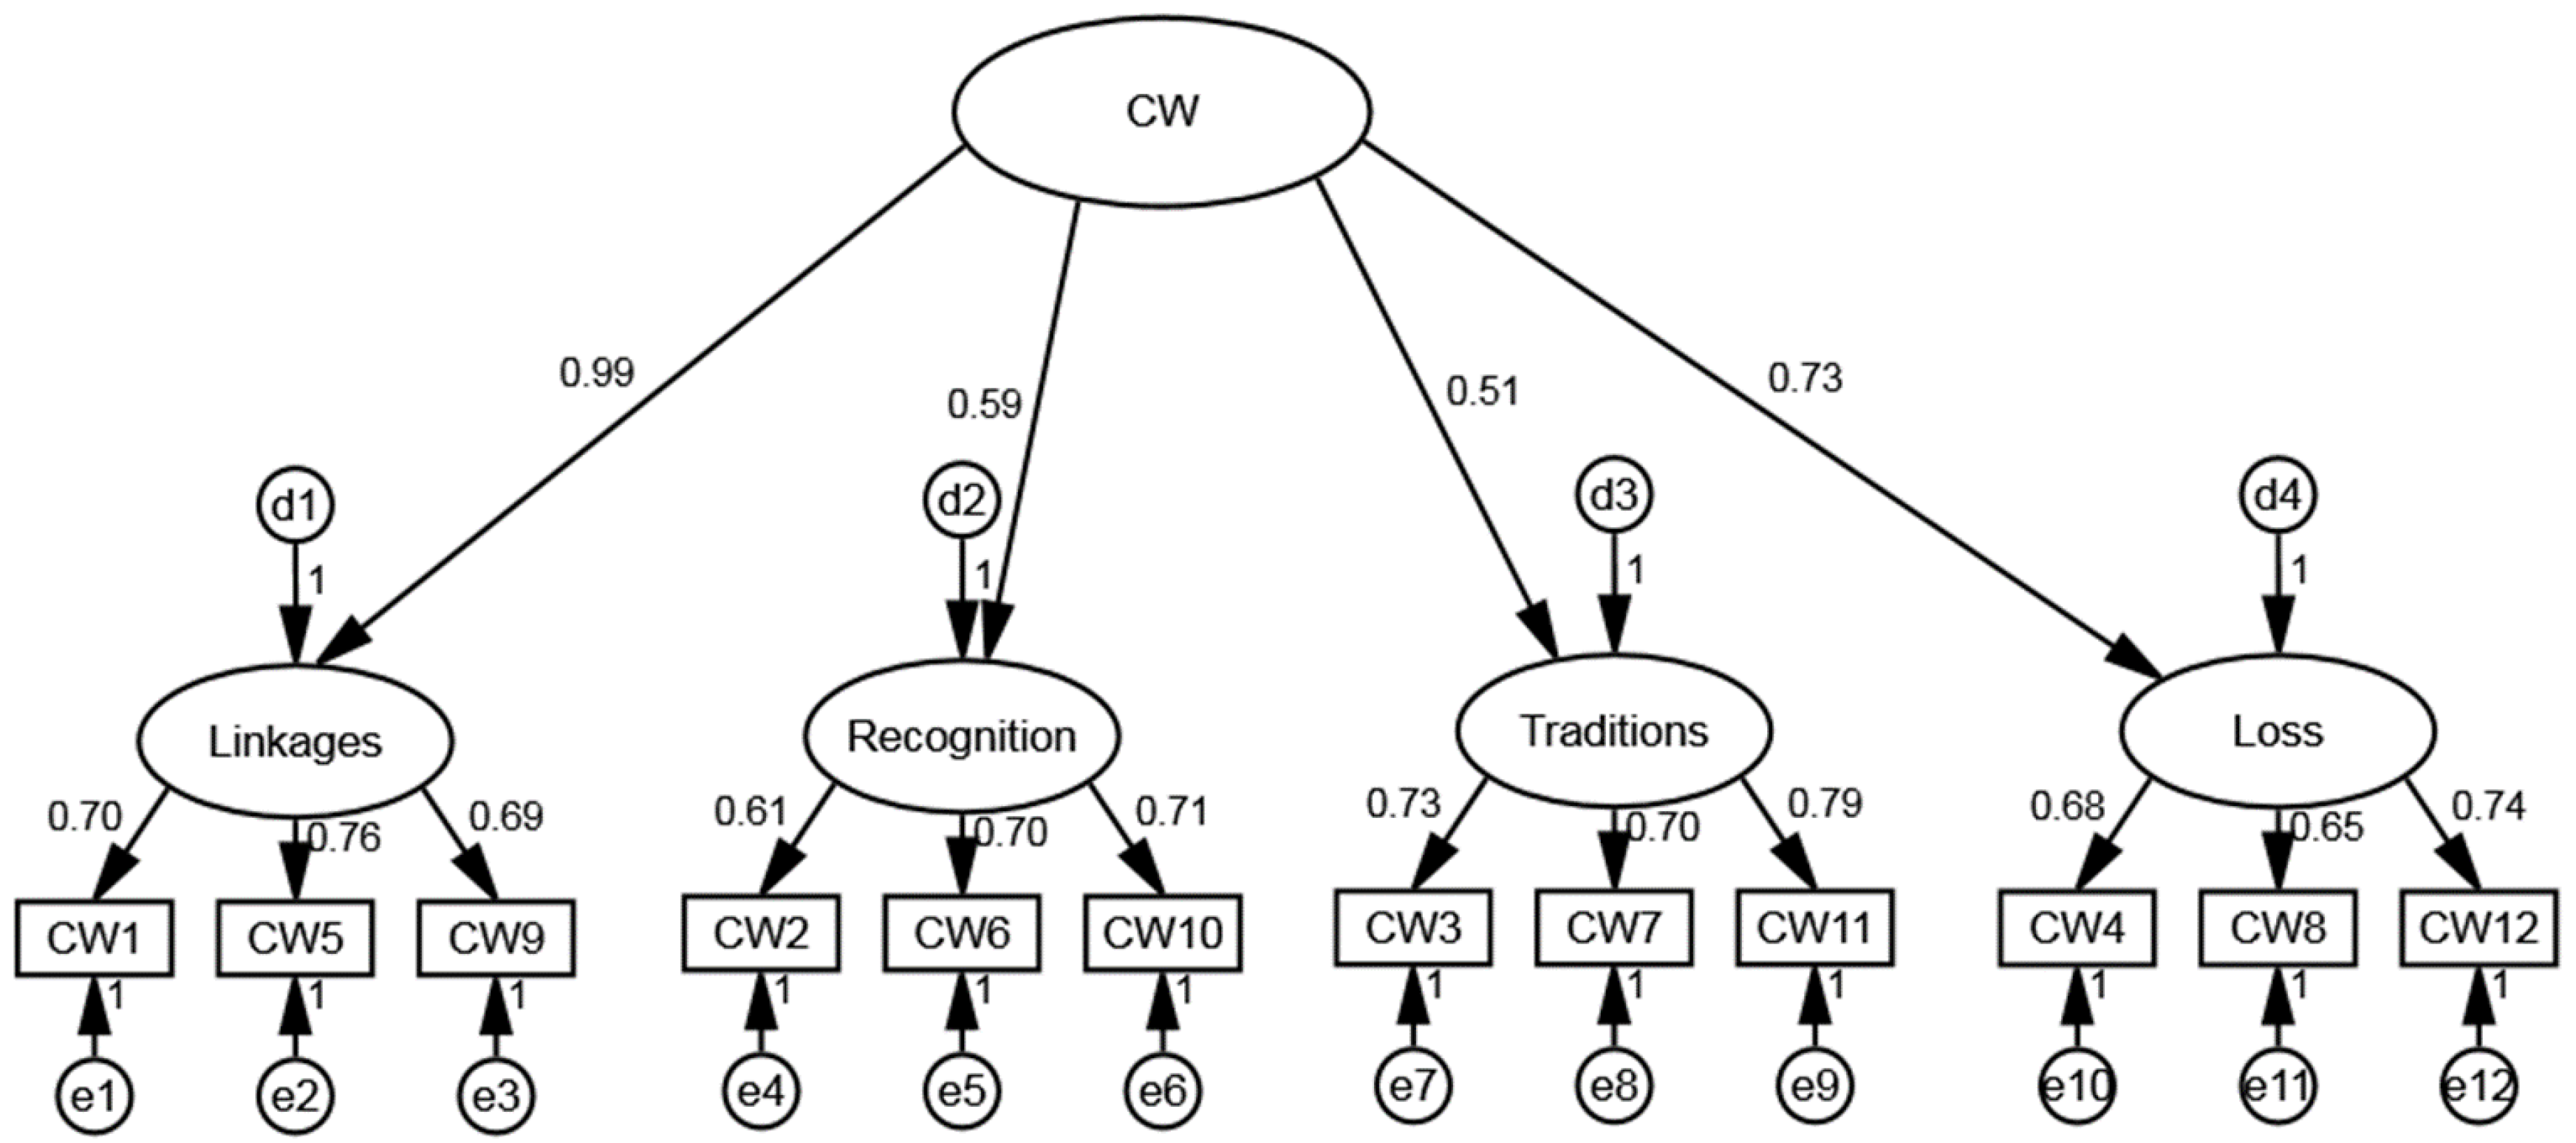
This paper addressed three major issues. As the first of these, a four-factor structure was confirmed as proposed by the scale developers [18]. This finding thus supports the conceptual belief that cultural value is multidimensional [16,17]. Among the four factors, “LINKAGES” and “LOSS” variables might be substantially correlated. Further, confirmatory factor analyses verified the latent structure of the CW scale to be four correlated factors, or one second-order factor with four underlying factors. As to the second issue of developing a more parsimonious version of the scale, this paper presented a shorter list of the twelve items that loaded highest on the factors and demonstrated applicability of this version of the scale in the economic valuation context. Finally, in relation to the third issue, the current study suggests a potential applicability of the CW scale to non-Western nations as well as Western nations. A high level of procultural support in this case study involving Korean respondents was consistent with the findings of the previous Australian cases [18].
This paper also confirmed that cultural attitudes work as significant motivations for the WTP for the conservation of cultural heritage sites, and as unobserved factors of economic models. General cultural attitudes were measured systematically using the CW scale. Systematic measurement of attitudinal characteristics is crucial for comparative studies, as shown in the literature of environmental studies [3,4,6,13]. By including CW factors individually, or as the total score as parts of economic models, not only were the model fits improved, but underlying factors for the heterogeneous cultural values were also identified.
The CW scale can be used either as four correlated factors or a single index, depending on the research purposes. As a single index, respondents can be differentiated according to their overall procultural positions. For instance, three equal-size groups can be arbitrarily created and various consumer profiles or relationships among the subgroups can be examined [6]. Alternatively, researchers can employ four factors as explanatory variables and verify which latent variables carry meaningful relationships with choice attributes. As evidenced in this paper, stated preferences for the conservation of cultural heritage sites in the restricted areas are largely influenced by the perceived importance of traditions and customs, whereas cultural linkages, perceived cultural loss, and recognized cultural significance do not play a significant role. The stable multidimensional structure of this scale provides one avenue for helping researchers to delve into the root causes of culturally meaningful phenomena, which have been previously unavailable to them.
Although the latent dimensionality underlying the CW scale was confirmed and cultural attitudes were found to be significant motivations for WTP, there are several limitations of the research that need to be considered in future studies that investigate the measurement and contribution of cultural worldview. Firstly, the shorter version of the CW scale may be subject to some framing effects. As the new version only includes twelve items out of the original nineteen items, it is not clear whether different sequences and positions of these items cause any impacts on factor scores. Our expectation is to see the same reliable constructs as demonstrated in this study. Follow-up studies can verify this expectation. Secondly, this paper applied only one of the two commonly used methods involving attitudinal variables. As introduced in the beginning, Cultural Worldview measures can also be applied as segmentation criteria, and segment-specific mean WTP estimates can be examined for the statistical relationships. Future research adopting this approach is needed to confirm the findings of the current study. Finally, to date, CW scales have only been used in the context of economic valuation cases. Diverse study contexts need to be investigated in the future, using the same measurement items, such as destination choices involving cultural sites, the demand for intangible cultural goods, and different interpretations of cultural landscapes.

Acknowledgments

Valuable inputs from anonymous reviewers are gratefully acknowledged.

Author Contributions

Andy Choi designed and conducted the study and analyzed the data. Kelly Fielding worked on the structure and implication side of the manuscript. Both authors read and approve the final manuscript.

Conflicts of Interest

The authors declare no conflict of interest.

References

  1. Jones, S.; Hensher, D.A. Predicting firm financial distress: A mixed logit model. Account. Rev. 2004, 79, 1011–1038. [Google Scholar] [CrossRef]
  2. Louviere, J.J. Choice experiments: An overview of concepts and issues. In The Choice Modelling Approach to Environmental Valuation; Bennett, J., Blamey, R., Eds.; Edward Elgar: Northampton, MA, USA, 2001; pp. 13–36. [Google Scholar]
  3. Cooper, P.; Poe, G.L.; Bateman, I.J. The structure of motivation for contingent values: A case study of lake water quality improvement. Ecol. Econ. 2004, 50, 69–82. [Google Scholar] [CrossRef]
  4. Kotchen, M.J.; Reiling, S.D. Environmental attitudes, motivations, and contingent valuation of nonuse values: A case study involving endangered species. Ecol. Econ. 2000, 32, 93–107. [Google Scholar] [CrossRef]
  5. Boxall, P.C.; Adamowicz, W.L. Understanding heterogeneous preferences in random utility models: A latent class approach. Environ. Resour. Econ. 2002, 23, 421–446. [Google Scholar] [CrossRef]
  6. Choi, A.S.; Fielding, K.S. Environmental attitudes as WTP predictors: A case study involving endangered species. Ecol. Econ. 2013, 89, 24–32. [Google Scholar] [CrossRef]
  7. Daly, A.; Hess, S.; Patruni, B.; Potoglou, D.; Rohr, C. Using ordered attitudinal indicators in a latent variable choice model: A study of the impact of security on rail travel behaviour. Transportation 2012, 39, 267–297. [Google Scholar] [CrossRef]
  8. Ben-Akiva, M.; McFadden, D.; Gärling, T.; Gopinath, D.; Walker, J.; Bolduc, D.; Börsch-Supan, A.; Delquié, P.; Larichev, O.; Morikawa, T.; et al. Extended framework for modeling choice behavior. Mark. Lett. 1999, 10, 187–203. [Google Scholar] [CrossRef]
  9. Yáñez, M.F.; Raveau, S.; Ortúzar, J.D.D. Inclusion of latent variables in mixed logit models: Modelling and forecasting. Transp. Res. Part A 2010, 44, 744–753. [Google Scholar] [CrossRef]
  10. Temme, D.; Paulssen, M.; Dannewald, T. Incorporating latent variables into discrete choice models—A simultaneous estimation approach using sem software. Bus. Res. 2014, 1, 220–237. [Google Scholar] [CrossRef]
  11. Aldrich, G.; Grimsrud, K.; Thacher, J.; Kotchen, M. Relating environmental attitudes and contingent values: How robust are methods for identifying preference heterogeneity? Environ. Resour. Econ. 2007, 37, 757–775. [Google Scholar] [CrossRef]
  12. Dunlap, R.E.; Van Liere, K.D.; Mertig, A.G.; Jones, R.E. Measuring endorsement of the new ecological paradigm: A revised nep scale. J. Soc. Issues 2000, 56, 425–442. [Google Scholar] [CrossRef]
  13. Hawcroft, L.J.; Milfont, T.L. The use (and abuse) of the new environmental paradigm scale over the last 30 years: A meta-analysis. J. Environ. Psychol. 2010, 30, 143–158. [Google Scholar] [CrossRef]
  14. Millennium Ecosystem Assessment Board. Ecosystems and Human Well-Being: Synthesis; Island Press: Washington, DC, USA, 2005. [Google Scholar]
  15. DeVellis, R.F. Scale Development: Theory and Applications, 2nd ed.; Sage: Newbury Park, CA, USA, 2003. [Google Scholar]
  16. Throsby, D. Economics and Culture; Cambridge University Press: Cambridge, UK, 2001. [Google Scholar]
  17. Mazzanti, M. Cultural heritage as multi-dimensional, multi-value and multi-attribute economic good: Toward a new framework for economic analysis and valuation. J. Socio-Econ. 2002, 31, 529–558. [Google Scholar] [CrossRef]
  18. Choi, A.S.; Papandrea, F.; Bennett, J. Assessing cultural values: Developing an attitudinal scale. J. Cult. Econ. 2007, 31, 311–335. [Google Scholar] [CrossRef]
  19. Eagly, A.H.; Chaiken, S. Psychology of Attitudes; Harcourt Brace Jovanovich: Fort Worth, TX, USA, 1993. [Google Scholar]
  20. Throsby, D. Determining the value of cultural goods: How much (or how little) does contingent valuation tell us? J. Cult. Econ. 2003, 27, 275–285. [Google Scholar] [CrossRef]
  21. McFadden, D. Economic choices. Am. Econ. Rev. 2001, 91, 351–378. [Google Scholar] [CrossRef]
  22. Armbrecht, J. Developing a scale for measuring the perceived value of cultural institutions. Cult. Trends 2014, 23, 252–272. [Google Scholar] [CrossRef]
  23. Durán, R.; Farizo, B.A.; Vázquez, M.X. Conservation of maritime cultural heritage: A discrete choice experiment in a European atlantic region. Mar. Policy 2015, 51, 356–365. [Google Scholar] [CrossRef]
  24. Fulton, D.C.; Manfredo, M.J.; Lipscomb, J. Wildlife value orientations: A conceptual and measurement approach. Hum. Dimens. Wildl. 1996, 1, 24–47. [Google Scholar] [CrossRef]
  25. Stern, P.C. Toward a coherent theory of environmentally significant behavior. J. Soc. Issues 2000, 56, 407–424. [Google Scholar] [CrossRef]
  26. Ajzen, I. The theory of planned behavior. Organ. Behav. Hum. Decis. Process. 1991, 50, 179–211. [Google Scholar] [CrossRef]
  27. Heberlein, T.A.; Bishop, R. Assessing the validity of contingent valuations: Three field experiments. Sci. Total Environ. 1986, 56, 434–479. [Google Scholar] [CrossRef]
  28. McFadden, D.; Train, K. Mixed mnl models for discrete response. J. Appl. Econom. 2000, 15, 447–470. [Google Scholar] [CrossRef]
  29. Johansson, M.V.; Heldt, T.; Johansson, P. The effects of attitudes and personality traits on mode choice. Transp. Res. Part A 2006, 40, 507–525. [Google Scholar] [CrossRef]
  30. Winter, C. Preferences and values for forests and wetlands: A comparison of farmers, environmentalists, and the general public in australia. Soc. Nat. Resour. 2005, 18, 541–555. [Google Scholar] [CrossRef] [Green Version]
  31. Scarpa, R.; Menzel, S. Protection Motivation Theory and Contingent Valuation: Perceived Realism, Threat and WTP Estimates for Biodiversity Protection. Available online: http://ssrn.com/abstract=670231 (accessed on 13 June 2016).
  32. Morey, E.R.; Thacher, J.; Breffle, W. Using angler characteristics and attitudinal data to identify environmental preference classes: A latent-class model. Environ. Resour. Econ. 2006, 34, 91–115. [Google Scholar] [CrossRef]
  33. Choi, A.S. Implicit prices for longer temporary exhibitions in a heritage site and a test of preference heterogeneity: A segmentation-based approach. Tour. Manag. 2011, 32, 511–519. [Google Scholar] [CrossRef]
  34. Amburgey, J.W.; Thoman, D.B. Dimensionality of the new ecological paradigm: Issues of factor structure and measurement. Environ. Behav. 2012, 44, 235–256. [Google Scholar] [CrossRef]
  35. Dunlap, R.E. The new environmental paradigm scale: From marginality to worldwide use. J. Environ. Educ. 2008, 40, 3–18. [Google Scholar] [CrossRef]
  36. Hofstede, G.; McCrae, R.R. Personality and culture revisited: Linking traits and dimensions of culture. Cross Cult. Res. 2004, 38, 52–88. [Google Scholar] [CrossRef]
  37. Erdogan, N. Testing the new ecological paradigm scale: Turkish case. Afr. J. Agric. Res. 2009, 4, 1023–1031. [Google Scholar]
  38. Vikan, A.; Camino, C.; Biaggio, A.; Nordvik, H. Endorsement of the new ecological paradigm: A comparison of two Brazilian samples and one Norwegian sample. Environ. Behav. 2007, 39, 217–228. [Google Scholar] [CrossRef]
  39. Liu, J.; Ouyang, Z.; Miao, H. Environmental attitudes of stakeholders and their perceptions regarding protected area-community conflicts: A case study in China. J. Environ. Manag. 2010, 91, 2254–2262. [Google Scholar] [CrossRef] [PubMed]
  40. Chatterjee, D.P. Oriental disadvantage versus occidental exuberance—Appraising environmental concern in india—A case study in a local context. Int. Sociol. 2008, 23, 5–33. [Google Scholar] [CrossRef]
  41. Kim, J.; Rasouli, S.; Timmermans, H. Hybrid choice models: Principles and recent progress incorporating social influence and nonlinear utility functions. Procedia Environ. Sci. 2014, 22, 20–34. [Google Scholar] [CrossRef]
  42. Choi, A.S. An experimental study to explore WTP for aviation carbon offsets: the impact of a carbon tax on the voluntary action. J. Environ. Plan. Manag. 2015, 58, 1617–1634. [Google Scholar] [CrossRef]
  43. Elrod, T.; Keane, M.P. A factor-analytic probit model for representing the market structure in panel data. J. Mark. Res. 1995, 32, 1–16. [Google Scholar] [CrossRef]
  44. Walker, J.; Ben-Akiva, M. Generalized random utility model. Math. Soc. Sci. 2002, 43, 303–343. [Google Scholar] [CrossRef]
  45. Hinkin, T.R. A review of scale development practices in the study of organisations. J. Manag. 1995, 21, 967–988. [Google Scholar]
  46. Hair, J.F.; Black, B.; Babin, B.; Anderson, R.E.; Tatham, R.L. Multivariate Data Analysis, 6th ed.; Prentice Hall: Upper Saddle River, NJ, USA, 2006. [Google Scholar]
  47. Browne, M.W.; Cudeck, R. Alternative ways of assessing model fit. Sociol. Methods Res. 1992, 21, 230–258. [Google Scholar] [CrossRef]
  48. Bentler, P.M. Comparative fit indexes in structural models. Psychol. Bull. 1990, 107, 238–246. [Google Scholar] [CrossRef] [PubMed]
  49. Hu, L.T.; Bentler, P.M. Cutoff criteria for fit indexes in covariance structure analysis: Conventional criteria versus new alternatives. Struct. Equ. Model. A Multidiscip. J. 1999, 6, 1–55. [Google Scholar] [CrossRef]
  50. Hicks, J.R. A suggestion for simplifying the theory of money. Economica 1935, 2, 1–19. [Google Scholar] [CrossRef]
  51. Bateman, I.J.; Carson, R.T.; Day, B.; Hanemann, M.; Hanley, N.; Hett, T.; Jones-Lee, M.; Loomes, G.; Mourato, S.; Ozemiroglu, E.; et al. Economic Valuation with Stated Preference Techniques: A Manual; Edward Elgar: Northampton, MA, USA, 2002; p. 458. [Google Scholar]
  52. UKNEA. The UK National Ecosystem Assessment Technical Report; UNEP-WCMC: Cambridge, UK, 2011. [Google Scholar]
  53. Correia, A.; Santos, C.M.; Barros, C.P. Tourism in latin america: A choice analysis. Ann. Tour. Res. 2007, 34, 610–629. [Google Scholar] [CrossRef]
  54. Hensher, D.A.; Greene, W.H. The mixed logit model: The state of practice. Transp. Res. Part A 2003, 30, 133–176. [Google Scholar]
  55. Choi, A.S.; Ritchie, B.W.; Papandrea, F.; Bennett, J. Economic valuation of cultural heritage sites: A choice modeling approach. Tour. Manag. 2010, 31, 213–220. [Google Scholar] [CrossRef]
  56. Campbell, D.; Hutchinson, W.G.; Scarpa, R. Using choice experiments to explore the spatial distribution of willingness to pay for rural landscape improvements. Environ. Plan. A 2009, 41, 97–111. [Google Scholar] [CrossRef] [Green Version]
  57. Choi, A.S. Nonmarket values of major resources in the korean dmz areas: A test of distance decay. Ecol. Econ. 2013, 88, 97–107. [Google Scholar] [CrossRef]
  58. McFadden, D. Regression-based specification tests for the multinomial logit model. J. Econom. 1987, 34, 63–82. [Google Scholar] [CrossRef]
  59. Lancaster, K.J. A new approach to consumer theory. J. Political Econ. 1966, 74, 132–157. [Google Scholar] [CrossRef]
  60. Train, K. Discrete Choice Methods with Simulation; Cambridge University Press: Cambridge, UK, 2003. [Google Scholar]
  61. Louviere, J.J.; Hensher, D.A.; Swait, J.D. Stated Choice Methods: Analysis and Applications; Cambridge University Press: Cambridge, UK, 2000. [Google Scholar]
  62. McFadden, D. Conditional logit analysis of qualitative choice behavior. In Frontiers in Econometrics; Zarembka, P., Ed.; Academic Press: New York, NY, USA, 1974. [Google Scholar]
  63. Hensher, D.A.; Rose, J.M.; Greene, W.H. Applied Choice Analysis: A primer; Cambridge University Press: Cambridge, UK, 2005. [Google Scholar]
  64. Ministry of Culture, S.A.T. Culture Ministry Looks to Establish DMZ Tour in Near Future. Available online: http://www.mcst.go.kr/english/issue/issueView.jsp?pSeq=1160 (accessed on 22 March 2016).
  65. Ministry of Environment. Comprehensive Ecological Survey Report of the DMZ and Its Vicinity; Ministry of Environment: Gwacheon, Korea, 2003.
  66. John, K.H.; Youn, Y.C.; Shin, J.H. Resolving conflicting ecological and economic interests in the Korean DMZ: A valuation based approach. Ecol. Econ. 2003, 46, 173–179. [Google Scholar] [CrossRef]
  67. Lee, C.-K.; Mjelde, J.W. Valuation of ecotourism resources using a contingent valuation method: The case of the Korean DMZ. Ecol. Econ. 2007, 63, 511–520. [Google Scholar] [CrossRef]
  68. Brady, L. Korea’s Green Ribbon of Hope: History, Ecology, and Activism in the DMZ. Available online: http://www.aljazeera.com/indepth/opinion/2012/02/2012213144630285786.html (accessed on 16 March 2016).
  69. Rolfe, J.; Windle, J. Distance decay functions for iconic assets: Assessing national values to protect the health of the great barrier reef in Australia. Environ. Resour. Econ. 2012, 53, 347–365. [Google Scholar] [CrossRef]
  70. Arbuckle, J.L. Ibm Spss Amos 20 User’s Guide; SPSS Inc.: Chicago, IL, USA, 2011. [Google Scholar]
  71. Mardia, K.V. Assessment of multinormality and the robustness of hotelling’s t2 test. J. R. Stat. Soc. Ser. C (Appl. Stat.) 1975, 24, 163–171. [Google Scholar]
  72. Bollen, K.A.; Stine, R.A. Bootstrapping goodness-of-fit measures in structural equation models. Sociol. Methods Res. 1992, 21, 205–229. [Google Scholar] [CrossRef]
  73. Fornell, C.; Larcker, D.F. Evaluating structural equation models with unobservable variables and measurement error. J. Mark. Res. 1981, 18, 39–50. [Google Scholar] [CrossRef]
  74. Hess, S.; Bierlaire, M.; Polak, J.W. Estimation of value of travel-time savings using mixed logit models. Transp. Res. Part A 2005, 39, 221–236. [Google Scholar] [CrossRef]
  75. Hensher, D.A.; Johnson, L. Applied Discrete Choice Modeling; Wiley: New York, NY, USA, 1981. [Google Scholar]
  76. Vuong, Q.H. Likelihood ratio for model selection and non-nested hypotheses. Econometrica 1989, 57, 307–333. [Google Scholar] [CrossRef]
  77. Kadane, J.B.; Lazar, N.A. Methods and criteria for model selection. J. Am. Stat. Assoc. 2004, 99, 279–290. [Google Scholar] [CrossRef]
  78. Krinsky, I.; Robb, A.L. On approximating the statistical properties of elastistics. Rev. Econ. Stat. 1986, 68, 715–719. [Google Scholar] [CrossRef]
Figure 1. Three approaches to incorporating attitudinal variables into choice models (modified from Daly et al. [7]): Inclusion of indicators (a) or factor scores (b) in a choice model, or a simultaneous estimation of latent variables as a part of choice analysis (c).
Sustainability 08 00570 g001
Figure 2. An example of choice sets used in the final questionnaires.
Sustainability 08 00570 g002
Figure 3. A structural model of the CW scale with four correlated factors.
Sustainability 08 00570 g003
Figure 4. A structural model of the CW scale with four factors in a second-order structure.
Sustainability 08 00570 g004
Table 1. The attributes used in Choi [57] describing major DMZ (Demilitarized Zone) resources.
AttributeVariableLevels of Changes (after Unification)
Cultural heritage sitesCUL44 (present), 22
Remaining area of the DMZAREA907 km2 (present), 680 km2, 454 km2, 227 km2
PanmunjeomMILIntact (present), destroyed
CCZ villagesVIL10 (present), 0
The number of endangered speciesSPE82 (present), 41
DMZ conservation fund (KRW) aFUND2.5, 5, 10, 20
a Fund figures are in 1000 KRW (US$1 = 1200 KRW).
Table 2. Sample characteristics.
CharacteristicCategoryN (%)
GenderMale490 (49.1%)
Female507 (51.9%)
Age20–39432 (43.3%)
40–49239 (24.0%)
50 & over326 (32.5%)
EducationCollege/university622 (62.4%) (National average 31.0%)
Visited DMZVisited at least once469 (47.0%)
Table 3. Distributional frequencies (%) for the original CW (Cultural Worldview) scale.
Item Statement aAgreeUnsureDisagreeFactorN bMeanSD
1. The cultural values of our forefathers are important to me.71.4125.382.91F19942.160.71
2. Culture does not help me to identify myself.6.7224.3768.51F29933.690.73
3. I want to know the foods our grandmothers made.51.8638.729.03F49932.470.82
4. We are not losing our cultural heritage.4.5115.9579.04F39922.100.71
5. We need to conserve more cultural heritage for future generations.87.269.832.41F19921.890.69
6. Cultural heritage does not mean anything to my wellbeing.4.8119.6675.03F29923.850.74
7. I would like to know our traditional style of dress.42.9344.2312.44F49932.620.83
8. Students do not need to learn what their culture is.15.759.9373.82F29923.731.04
9. The present cultural heritage should be available for my children’s children.86.9610.631.81F19911.880.68
10. Cultural heritage is not disappearing.5.1218.0576.33F39922.150.76
11. The foods our grandmothers made are important to me.49.3540.629.43F49912.510.82
12. We do not need to care about cultural heritage.8.129.9381.44F29923.930.85
13. Cultural heritage must be a part of our life.70.3125.284.01F19932.190.73
14. Although we do our business as usual, there won’t be any major cultural loss.3.4121.8774.22F39922.140.71
15. Our traditional style of dress is important to me.33.9047.2418.46F49932.800.84
16. Buildings, museums, and paintings do not have the right to be preserved.4.716.9287.96F29934.060.74
17. Future generations have the right to enjoy the present cultural heritage.83.5513.142.81F19921.950.72
18. Ideas, beliefs, and customs do not have the right to be preserved.4.7113.2481.64F29933.960.73
19. Culture helps us to live with people of different backgrounds.77.7319.362.51F19932.050.71
a Each statement was originally coded using a five point Likert scale: (1) Strongly agree, (2) Mildly agree, (3) Unsure, (4) Mildly disagree, and (5) Strongly disagree; b The number of respondents who provided valid answers. The remaining respondents were given a mean value for each item.
Table 4. Exploratory factor analysis results using a shorter version of the CW scale.
Item Number aMeanStatement
Intercommunity and intergenerational linkages (LINKAGES; F1).
CW1 (9)4.12The present cultural heritage should be available for my children’s children.
CW5 (17)4.05Future generations have the right to enjoy the present cultural heritage.
CW9 (19)3.95Culture helps us to live with people of different backgrounds.
Recognition of cultural values (RECOGNITION; F2).
CW2 (12)3.93We do not need to care about cultural heritage.
CW6 (16)4.06Buildings, museums, and paintings do not have the right to be preserved.
CW10 (18)3.96Ideas, beliefs, and customs do not have the right to be preserved.
Preservation of traditions and customs (TRADITIONS; F4).
CW3 (7)3.38I would like to know our traditional style of dress.
CW7 (11)3.49The foods our grandmothers made are important to me.
CW11 (15)3.20Our traditional style of dress is important to me.
Awareness of cultural loss (LOSS; F3).
CW4 (4)3.90We are not losing our cultural heritage.
CW8 (10)3.85Cultural heritage is not disappearing.
CW12 (14)3.86Although we do our business as usual, there won’t be a major cultural loss.
a Original item numbers used in Choi et al. [18] are in parentheses.
Table 5. Four latent structures of the CW scale with twelve items.
StructureSingle FactorFour Factors
Independent Sustainability 08 00570 i001 Sustainability 08 00570 i002
CorrelatedN.A. Sustainability 08 00570 i003
Second-orderN.A. Sustainability 08 00570 i004
Table 6. Model fit statistics for the seven confirmatory factor models.
Modelχ2dfχ2/dfSRMRCFIRMSEA
Single factor1146.445421.230.09980.6940.143
Four factors independent847.955415.700.21260.7780.121
Four factors correlated93.94481.960.02460.9870.031
Four factors second order103.51502.070.02860.9850.033
Table 7. Estimation results of random parameter logit models.
AttributeModel A (No Interactions)Model B (Four Factors)Model C (CW Factor)
Coefficientt-RatioCoefficientt-RatioCoefficientt-Ratio
ASC5.7572 **10.935.6622 **11.316.2707 *10.58
CUL0.09901.04−1.6122 **−4.35−1.8991 **−3.73
AREA0.0015 **8.160.0015 **8.130.0014 **8.11
MIL0.9112 **12.230.9124 **12.220.9126 **12.30
VIL0.8808 **11.290.8843 **11.330.8791 **11.44
SPE0.4156 **4.060.4202 **4.110.4347 **4.28
FUND−0.0727 **−9.19−0.0733 **−9.24−0.0722 **−9.41
CUL:EDU b 0.3586 **2.790.2925 *2.27
CUL:F4 b 0.4544 **4.29
CUL:CW b 0.8047 **3.57
NsASC a4.6918 **12.124.6029 **12.625.2163 **12.67
NsCUL a0.7560 **5.020.7153 **4.580.7363 **5.53
NsAREA a0.0018 **6.750.0018 **6.770.0017 **6.77
NsMIL a1.0568**12.391.0619 **12.451.0649 **12.37
NsVIL a1.0955 **8.701.0972 **8.761.0599 **8.76
Summary statistics
LL−3989.75 −3976.81 −3976.96
X25164.30 [12] **5190.19 [14] **5189.87 [14] **
Pseudo R20.39 0.39 0.39
Respondents997 997 997
a These are derived standard deviations of parameter distributions, assumed to be normally distributed; b Interaction terms of the CUL random parameter with heterogeneity source variables; * Significant at the 0.05 level; ** Significant at the 0.01 level.

