
2D Versus 3D: The Relevance of the Mode of Presentation for the Economic Valuation of an Alpine Landscape


Abstract
:1. Introduction
- How are changes of a typical Alpine landscape (pasture) valued by respondents in an experimental setting?
- Are the revealed (actual) and stated (potential, hypothetical) travel frequencies different between scenarios?
- How does the form of presentation (3D vs. 2D) influence the respondents’ answers?
- How do respondents perceive advantages or disadvantages of 3D vs. 2D presentations?
2. Valuing Landscapes by Visual Presentations
3. The Experimental Setting and Testable Hypotheses
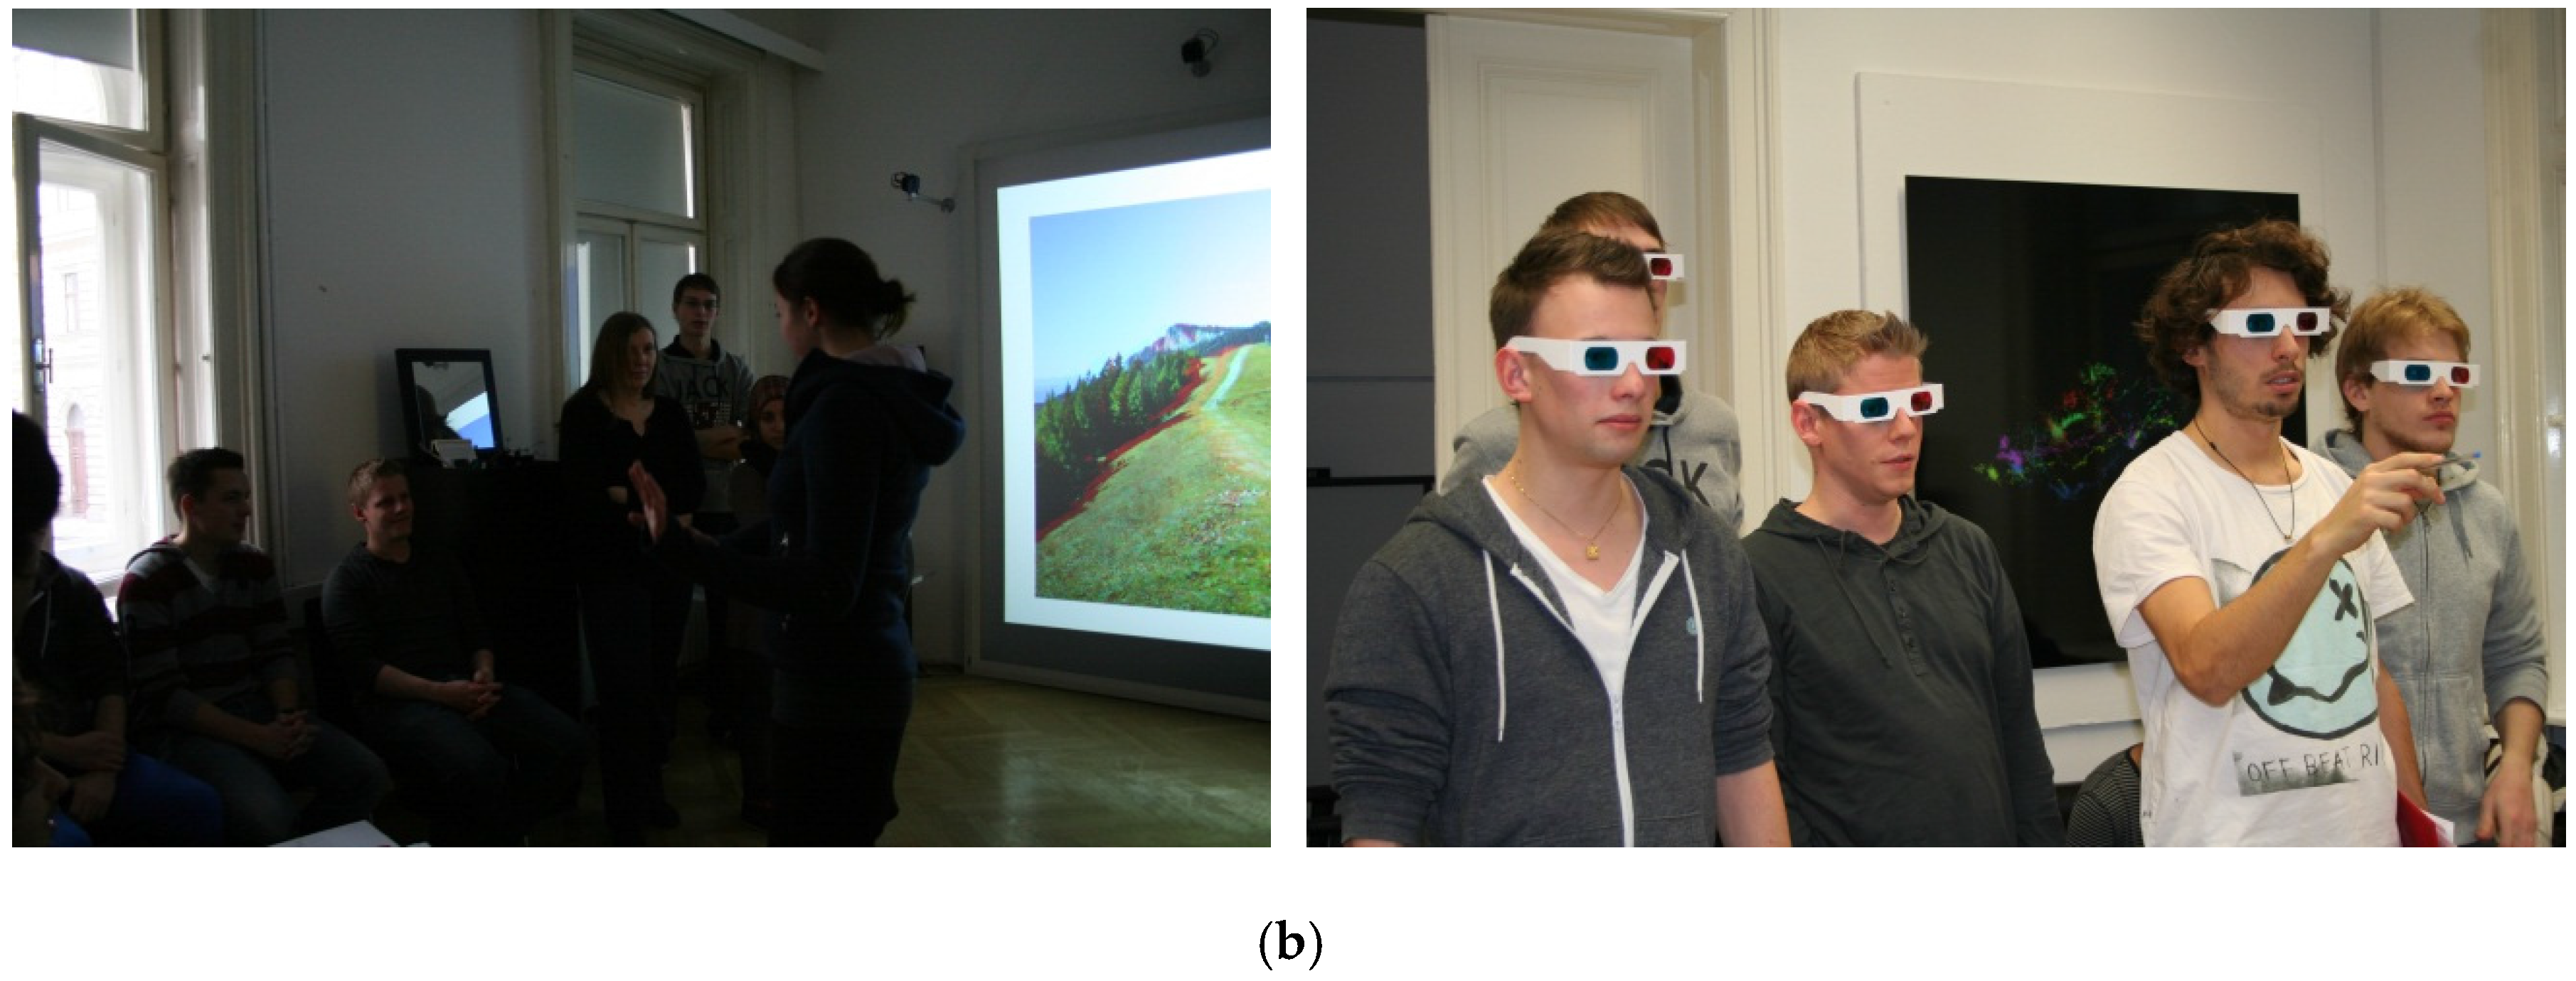
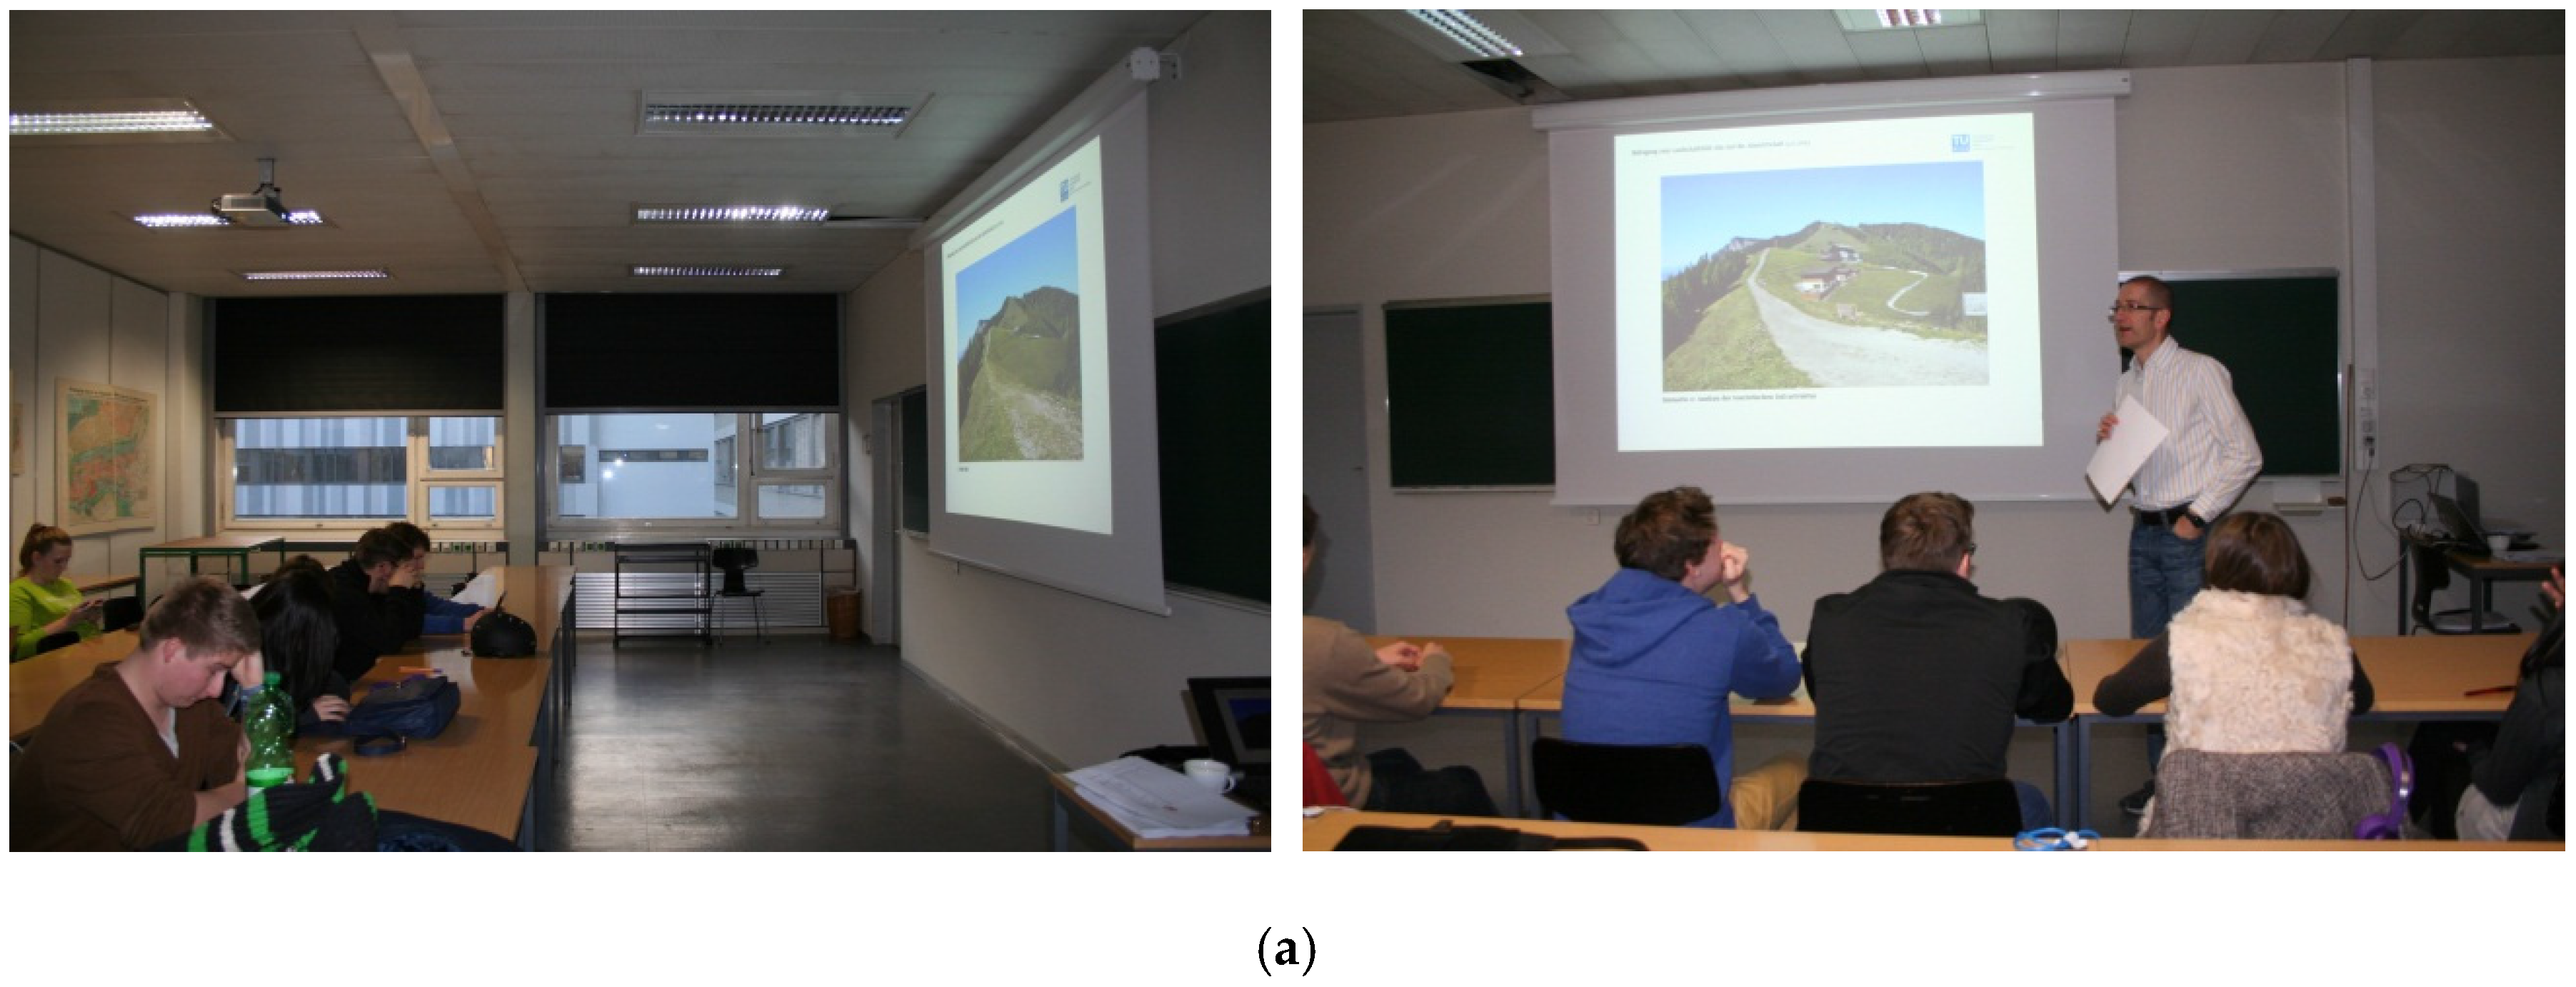
3.1. The Classroom Experiment
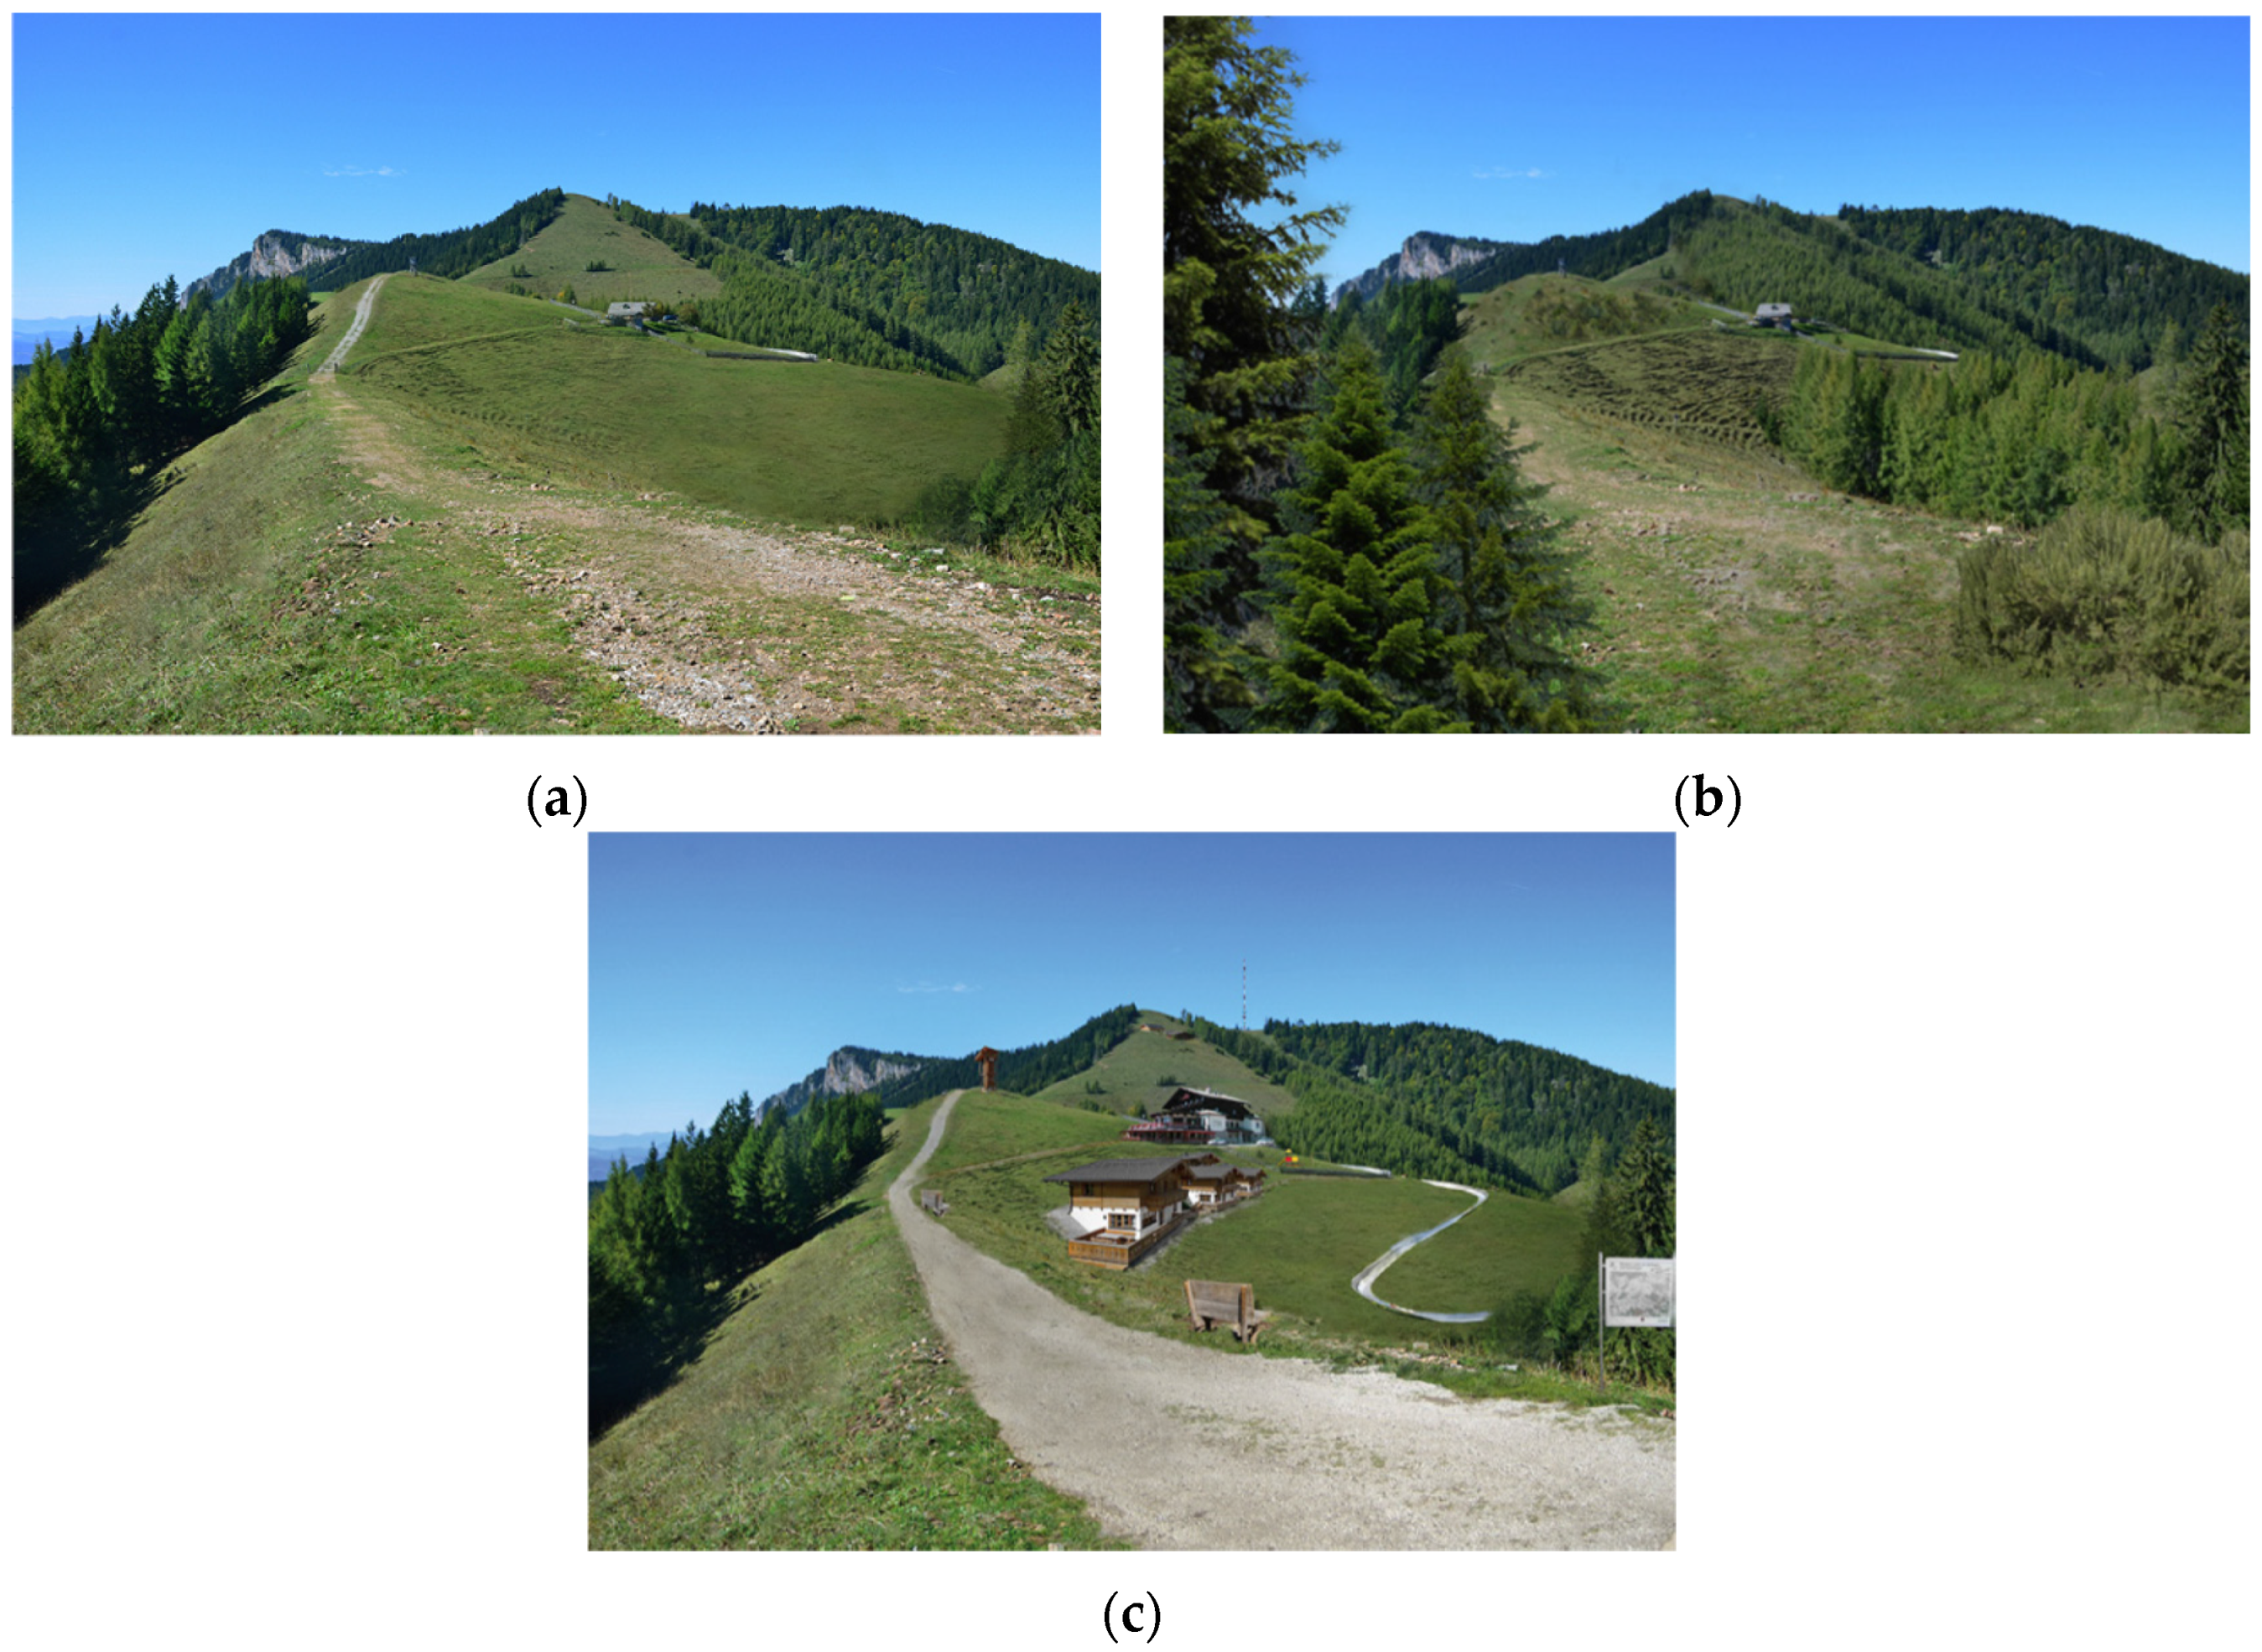
3.2. Development Scenarios of Alpine Pastures and Testable Hypotheses
- H1: Travelfrequency2D,Status quo ≠ Travelfrequency3D,Status quo
- H2: Travelfrequency2D,Scenario1 ≠ Travelfrequency3D,Scenario1
- H3: Travelfrequency2D,Scenario2 ≠ Travelfrequency3D,Scenario2
- H4: WTP2D,Scenario1 ≠ WTP3D,Scenario1
- H5: WTP2D,Scenario2 ≠ WTP3D,Scenario2
- H6: WTP∅(2D,3D),Scenario1 ≠ WTP∅(2D,3D),Scenario2
4. Empirical Results
4.1. Descriptive Survey Results
4.2. Travel Frequency and Willingness-to-Pay for Preventing Unsustainable Landscape Changes
5. Discussion, summary, and conclusions
Acknowledgments
Author Contributions
Conflicts of Interest
References
- Zoderer, B.M.; Tasser, E.; Erb, K.-H.; Lupo Stanghellini, P.S.; Tappeiner, U. Identifying and mapping the tourists’ perception of cultural ecosystem services: A case study from an Alpine region. Land Use Policy 2016, 56, 251–261. [Google Scholar] [CrossRef]
- Bednar-Friedl, B.; Behrens, D.; Getzner, M. Socioeconomics of conservation in the Alps. In The Alpine Environment: Geology, Ecology and Conservation; Schmidt, J.G., Ed.; NOVA Science Publishers: Hauppauge, NY, USA, 2011; pp. 135–152. [Google Scholar]
- Vos, W.; Meekes, H. Trends in European cultural landscape development: Perspectives for a sustainable future. Landsc. Urban Plan. 1999, 46, 3–14. [Google Scholar] [CrossRef]
- Plieninger, T.; Höchtl, F.; Spek, T. Traditional land-use and nature conservation in European rural landscapes. Environ. Sci. policy 2006, 9, 317–321. [Google Scholar] [CrossRef]
- Lienhoop, N.; Ansmann, T. Valuing water level changes in reservoirs using two stated preference approaches: An exploration of validity. Ecol. Econ. 2011, 70, 1250–1258. [Google Scholar] [CrossRef]
- Getzner, M.; Svajda, J. Preferences of tourists with regard to changes in the landscape of the Tatra National Park in Slovakia. Land Use Policy 2015, 48, 107–119. [Google Scholar] [CrossRef]
- Whitehead, J.C.; Haab, T.C.; Huang, J.-C. Measuring recreation benefits of quality improvements with revealed and stated behavior data. Resour. Energy Econ. 2000, 27, 339–354. [Google Scholar] [CrossRef]
- Hoyos, D.; Riera, P. Convergent validity between revealed and stated recreation demand data: Some empirical evidence from the Basque Country, Spain. J. For. Econ. 2013, 19, 234–248. [Google Scholar] [CrossRef]
- Zech, S. Raum planen ohne Pläne? In Jahrbuch Raumplanung 2013; Bröthaler, J., Getzner, M., Giffinger, R., Hamedinger, A., Voigt, A., Eds.; NWV Verlag: Vienna, Austria, 2013; pp. 69–86. [Google Scholar]
- Tisma, A.; Knegt, B.; Van Egmond, P. Evaluation of visualization techniques in communicating nature perspectives. In Proceedings of the AESOP-ACSP Joint Congress, Conference Paper, Dublin, Ireland, 15–19 July 2013.
- Pietsch, S. Computer visualization in the design and control of urban environments: A literature review. Environ. Plan. B 2000, 27, 521–536. [Google Scholar] [CrossRef]
- Roupé, M.; Johansson, M. Supporting 3D City Modelling, Collaboration and Maintenance through an Open-Source Revision Contol System. In New Frontiers, Proceedings of the 15th International Conference on Computer-Aided Architectural Design Research in Asia CAADRIA, Hongkong, China, 14–17 May 2010; Dave, B., Li, A., Park, H.-J., Eds.; pp. 347–356. Available online: http://www.caadria.org/cnf/index.html (accessed on 21 June 2016).
- Fiore, S.M.; Harrison, G.W.; Hughes, C.E. Virtual experiments and environmental policy. J. Environ. Manag. 2009, 57, 65–86. [Google Scholar] [CrossRef]
- Schroth, O.; Pond, E.; Sheppard, S.R.J. Evaluating presentation formats of local climate change in community planning with regard to process and outcomes. Landsc. Urban Plan. 2015, 142, 147–158. [Google Scholar] [CrossRef]
- Grêt-Regamey, A.; Celio, E.; Klein, T.M.; Wissen Hayek, W. Understanding ecosystem services trade-offs with interactive procedural modeling for sustainable urban planning. Landsc. Urban Plan. 2013, 109, 107–116. [Google Scholar] [CrossRef]
- Thill, J.-C.; Dao, T.H.D.; Zhou, Y. Traveling in the three-dimensional city: Applications in route planning, accessibility assessment, location analysis and beyond. J. Transp. Geogr. 2011, 19, 405–421. [Google Scholar] [CrossRef]
- Bishop, I.D.; Stock, C. Using collaborative virtual environments to plan wind energy installations. Renew. Energy 2010, 35, 2348–2355. [Google Scholar] [CrossRef]
- Benoit, A.; Le Callet, P.; Campisi, P.; Cousseau, R. Quality assessment of stereoscopic images. EURASIP J. Image Video Process. 2008. [Google Scholar] [CrossRef]
- Tauer, H. Stereo 3D. Grundlagen, Technik und Bildgestaltung; Fachverlag Schiele und Schön: Berlin, Germany, 2010. (In German) [Google Scholar]
- Liebold, B.; Pietschmann, D.; Valtin, G.; Ohler, P. Taking Space Literally: Reconceptualizing the Effects of Stereoscopic Representation on User Experience. 2013. Available online: http://www.gamejournal.it/taking-space-literally-reconceptualizing-the-effects-of-stereoscopic-representation-on-user-experience/ (accessed on 21 June 2016).
- Färber, B. Die ökonomische Bewertung der Veränderung des Landschaftsbildes Alm. Master’s Thesis, Department of Spatial Planning, Vienna University of Technology, Vienna, Austria, November 2014. [Google Scholar]
- Antonides, G.; Bolger, F.; Trip, G. Classroom experiments in behavioral economics. In Handbook of Contemporary Behavioral Economics: Foundations and Developments; Altman, M., Ed.; M.E. Sharpe: New York, NY, USA, 2006; pp. 379–404. [Google Scholar]
- Centre for Spatial Simulation and Modelling. Information and technical details about the spatial simulation laboratory at the Department of Spatial Planning at the Vienna University of Technology. 2016. Available online: simlab.tuwien.ac.at (accessed on 20 June 2016).
- Bergstrom, J.C.; Stoll, J.R.; Randall, A. The impact of information on environmental commodity valuation decisions. Am. J. Agric. Econ. 1990, 72, 614–621. [Google Scholar] [CrossRef]
- Getzner, M. The regional context of infrastructure policy and environmental valuation: The importance of stakeholders’ opinions. J. Environ. Econ. Policy 2012, 1, 255–275. [Google Scholar] [CrossRef]
- Ajzen, I.; Brown, T.C.; Rosenthal, L.H. Information bias in contingent valuation: Effects of personal relevance, quality of information, and motivational orientation. J. Environ. Econ. Manag. 1996, 30, 43–57. [Google Scholar] [CrossRef]
- Bartkowski, B.; Lienhoop, N.; Hansjürgens, B. Capturing the complexity of biodiversity: A critical review of economic valuation studies of biological diversity. Ecol. Econ. 2015, 113, 1–14. [Google Scholar] [CrossRef]
- Phaneuf, D.J.; Smith, V.K. Recreation demand models. In Handbook of Environmental Economics; Mäler, K.G., Vincent, J., Eds.; Elsevier: North Holland, Amsterdam, The Netherlands, 2005; Volume 2, pp. 671–761. [Google Scholar]
- Randall, A. A difficulty with the travel cost method. Land Econ. 1994, 70, 88–96. [Google Scholar] [CrossRef]


| Variable Name | Description |
|---|---|
| Dependent variables: | |
| Travelfrequency | Frequency of vacations (trips) at an Alpine pasture landscape |
| WTP | Willingness-to-pay (WTP) of respondents to prevent either scenario 1 or scenario 2 (EUR) |
| Explanatory variables: | |
| Ti | |
| Travelcost | Travel costs of respondents for their visits to an Alpine pasture landscape (EUR) |
| Gi | |
| Scen1 | =1 for scenario 1 |
| Scen2 | =1 for scenario 2 |
| Group | =1 for the sub-sample of the 3D treatment |
| Si | |
| Income1 | Income of respondent (net monthly income, per person, EUR, natural log) |
| Income2 | =1 for respondents with a income higher than EUR 450 (per month, net of taxes) |
| Pi | |
| Essential | =1 for the respondent's view that Alpine pastures are essential for the landscape |
| Identity | =1 for respondents agreeing to the statement that Alpine pasture promote the national identity |
| Recreation | =1 for recreation considered to an important ecosystem service of Alpine pastures |
| Experience1 | =1 for respondents who have experienced the reforestation of Alpine pastures |
| Experience2 | =1 for the respondent's past experience with intensive touristic development on Alpine pastures |
| Variable Name | Results 1 |
|---|---|
| Main reason for choosing Alpine landscapes with pastures as destinations of vacations | Percentage of respondents (multiple answers) |
| Appearance of the landscape | 69.41% |
| Reasonable prices | 47.06% |
| Possibilities for sports | 44.71% |
| Recreation possibilities | 42.35% |
| Nature experience | 36.47% |
| Comprehensive provision of hotels, restaurants | 18.82% |
| Solitude | 12.94% |
| Accessibility to the area | 10.59% |
| Sightseeing | 9.41% |
| Contact with wildlife | 5.88% |
| Friendly to families and children | 3.53% |
| Main sports activities | Percentage of respondents (multiple answers) |
| Swimming | 65.88% |
| Hiking | 51.76% |
| Cycling | 37.65% |
| Mountaineering | 20.00% |
| Climbing | 14.12% |
| Jogging | 9.41% |
| Riding | 3.53% |
| No sports | 2.35% |
| Annual frequency and length of vacations in Alpine landscapes | Percentage of respondents |
| More than 4 weeks | 14.29% |
| Two to four weeks | 28.57% |
| One to two weeks | 26.19% |
| Less than one week | 21.43% |
| No vacations in Alpine regions | 9.52% |
| Importance and functions of Alpine pastures | Mean on a 4-point Likert scale (4 = most important) |
| Sustaining and support for biodiversity | 3.51 |
| Preservation of cultural landscapes for recreation | 3.52 |
| Ecological farming of classical pasture products | 3.46 |
| Sustaining Alpine pasture as ancient culture | 3.17 |
| Ecological, low-tech agriculture | 2.93 |
| Keeping the landscape open | 2.38 |
| Variable | 2D Group | 3D Group | Total Sample | |||
|---|---|---|---|---|---|---|
| EUR (mean) | n | EUR (mean) | n | EUR (mean) | n | |
| WTP to prevent scenario 1 | 10.58 | 43 | 10.9 | 41 | 10.74 | 84 |
| WTP to prevent scenario 2 | 10.72 | 43 | 9.95 | 41 | 10.35 | 84 |
| Statements | 2D Group | 3D Group | Total Sample | |||
|---|---|---|---|---|---|---|
| Percent of resp. | n | Percent of resp. | n | Percent of resp. | n | |
| 3D presentations would have helped to understand the topic and the problems | 23% | 31 | ||||
| Pictures present the issues and problems equally well as the 3D presentations | 85% | 39 | ||||
| 3D presentations help to understand the topic and the problems | 33% | 36 | ||||
| Pictures would have presented the issues and problems equally well as the 3D presentations | 88% | 42 | ||||
| Average points 1 | n | Average points 1 | n | Average points 1 | n | |
| 3D presentations are more vivid, changes can be illustrated much better | 3.56 | 43 | 3.74 | 42 | 3.65 | 85 |
| 3D presentations contain more information which makes valuation more easy | 3.28 | 43 | 2.95 | 42 | 3.12 | 85 |
| 3D presentations are more modern and correspond to modern technology | 3.44 | 43 | 3.79 | 42 | 3.61 | 85 |
| Variables 1 | Basic Travel Cost Model 2 | Expanded Travel Cost Model 2 | ||||
|---|---|---|---|---|---|---|
| Coeff. | z-Stat | Sign. 3 | Coeff. | z-Stat | Sign. 3 | |
| Constant | 0.1556 | 0.3273 | 1.2389 | 2.171 | ** | |
| Travelcost | −0.0023 | −3.2338 | *** | −0.0023 | −3.0682 | *** |
| Scen1 | −0.9835 | −7.341 | *** | −0.9115 | −6.6756 | *** |
| Scen2 | −0.9541 | −7.157 | *** | −0.8858 | −6.5217 | *** |
| Group | 0.3501 | 3.1551 | *** | 0.2165 | 1.8194 | * |
| Income1 | 0.3714 | 4.7842 | *** | 0.1973 | 2.2962 | ** |
| Essential | 0.4518 | 3.0162 | *** | |||
| Identity | 0.5401 | 2.2008 | ** | |||
| Recreation | −1.3437 | −4.8067 | *** | |||
| Experience1 | 0.5365 | 3.711 | *** | |||
| Experience2 | 0.3325 | 2.6367 | *** | |||
| Adj. R² | 0.1498 | 0.3065 | ||||
| S.E. of regr. | 7.8991 | 7.1341 | ||||
| Log likelihood | −560.7406 | −533.8609 | ||||
| LR statistic | 238.7263*** | 292.4857*** | ||||
| n | 203 | 203 | ||||
| Variables 1 | Basic WTP Model 2 | Expanded WTP Model 2 | ||||
|---|---|---|---|---|---|---|
| Coeff. | z-Stat | Sign. 3 | Coeff. | z-Stat | Sign. 3 | |
| Constant | 2.2721 | 48.7988 | *** | 1.9323 | 9.0088 | *** |
| Scen2 | −0.0511 | −1.0442 | −0.0509 | −1.0225 | ||
| Group | −0.0246 | −0.5027 | −0.1224 | −2.3613 | ** | |
| Income2 | 0.2805 | 5.6222 | *** | 0.2865 | 5.3073 | *** |
| Essential | 0.1096 | 1.7697 | * | |||
| Identity | −0.2330 | −2.7955 | *** | |||
| Recreation | 0.5851 | 2.9496 | *** | |||
| Experience1 | 0.4570 | 8.0454 | *** | |||
| Experience2 | −0.3519 | −6.8151 | *** | |||
| Quasi-log likelihood. | 2309.2520 | 2401.6600 | ||||
| LR stat. | 33.3217*** | 218.1369*** | ||||
| Deviance stat. | 18.9026 | 18.3237 | ||||
| n | 165 | 165 | ||||
© 2016 by the authors; licensee MDPI, Basel, Switzerland. This article is an open access article distributed under the terms and conditions of the Creative Commons Attribution (CC-BY) license (http://creativecommons.org/licenses/by/4.0/).
Share and Cite
Getzner, M.; Färber, B.; Yamu, C. 2D Versus 3D: The Relevance of the Mode of Presentation for the Economic Valuation of an Alpine Landscape. Sustainability 2016, 8, 591. https://doi.org/10.3390/su8060591
Getzner M, Färber B, Yamu C. 2D Versus 3D: The Relevance of the Mode of Presentation for the Economic Valuation of an Alpine Landscape. Sustainability. 2016; 8(6):591. https://doi.org/10.3390/su8060591
Chicago/Turabian StyleGetzner, Michael, Barbara Färber, and Claudia Yamu. 2016. "2D Versus 3D: The Relevance of the Mode of Presentation for the Economic Valuation of an Alpine Landscape" Sustainability 8, no. 6: 591. https://doi.org/10.3390/su8060591
APA StyleGetzner, M., Färber, B., & Yamu, C. (2016). 2D Versus 3D: The Relevance of the Mode of Presentation for the Economic Valuation of an Alpine Landscape. Sustainability, 8(6), 591. https://doi.org/10.3390/su8060591