
Evaluation of the Life Cycle Greenhouse Gas Emissions from Hydroelectricity Generation Systems


Abstract
:
1. Introduction
2. Methodology
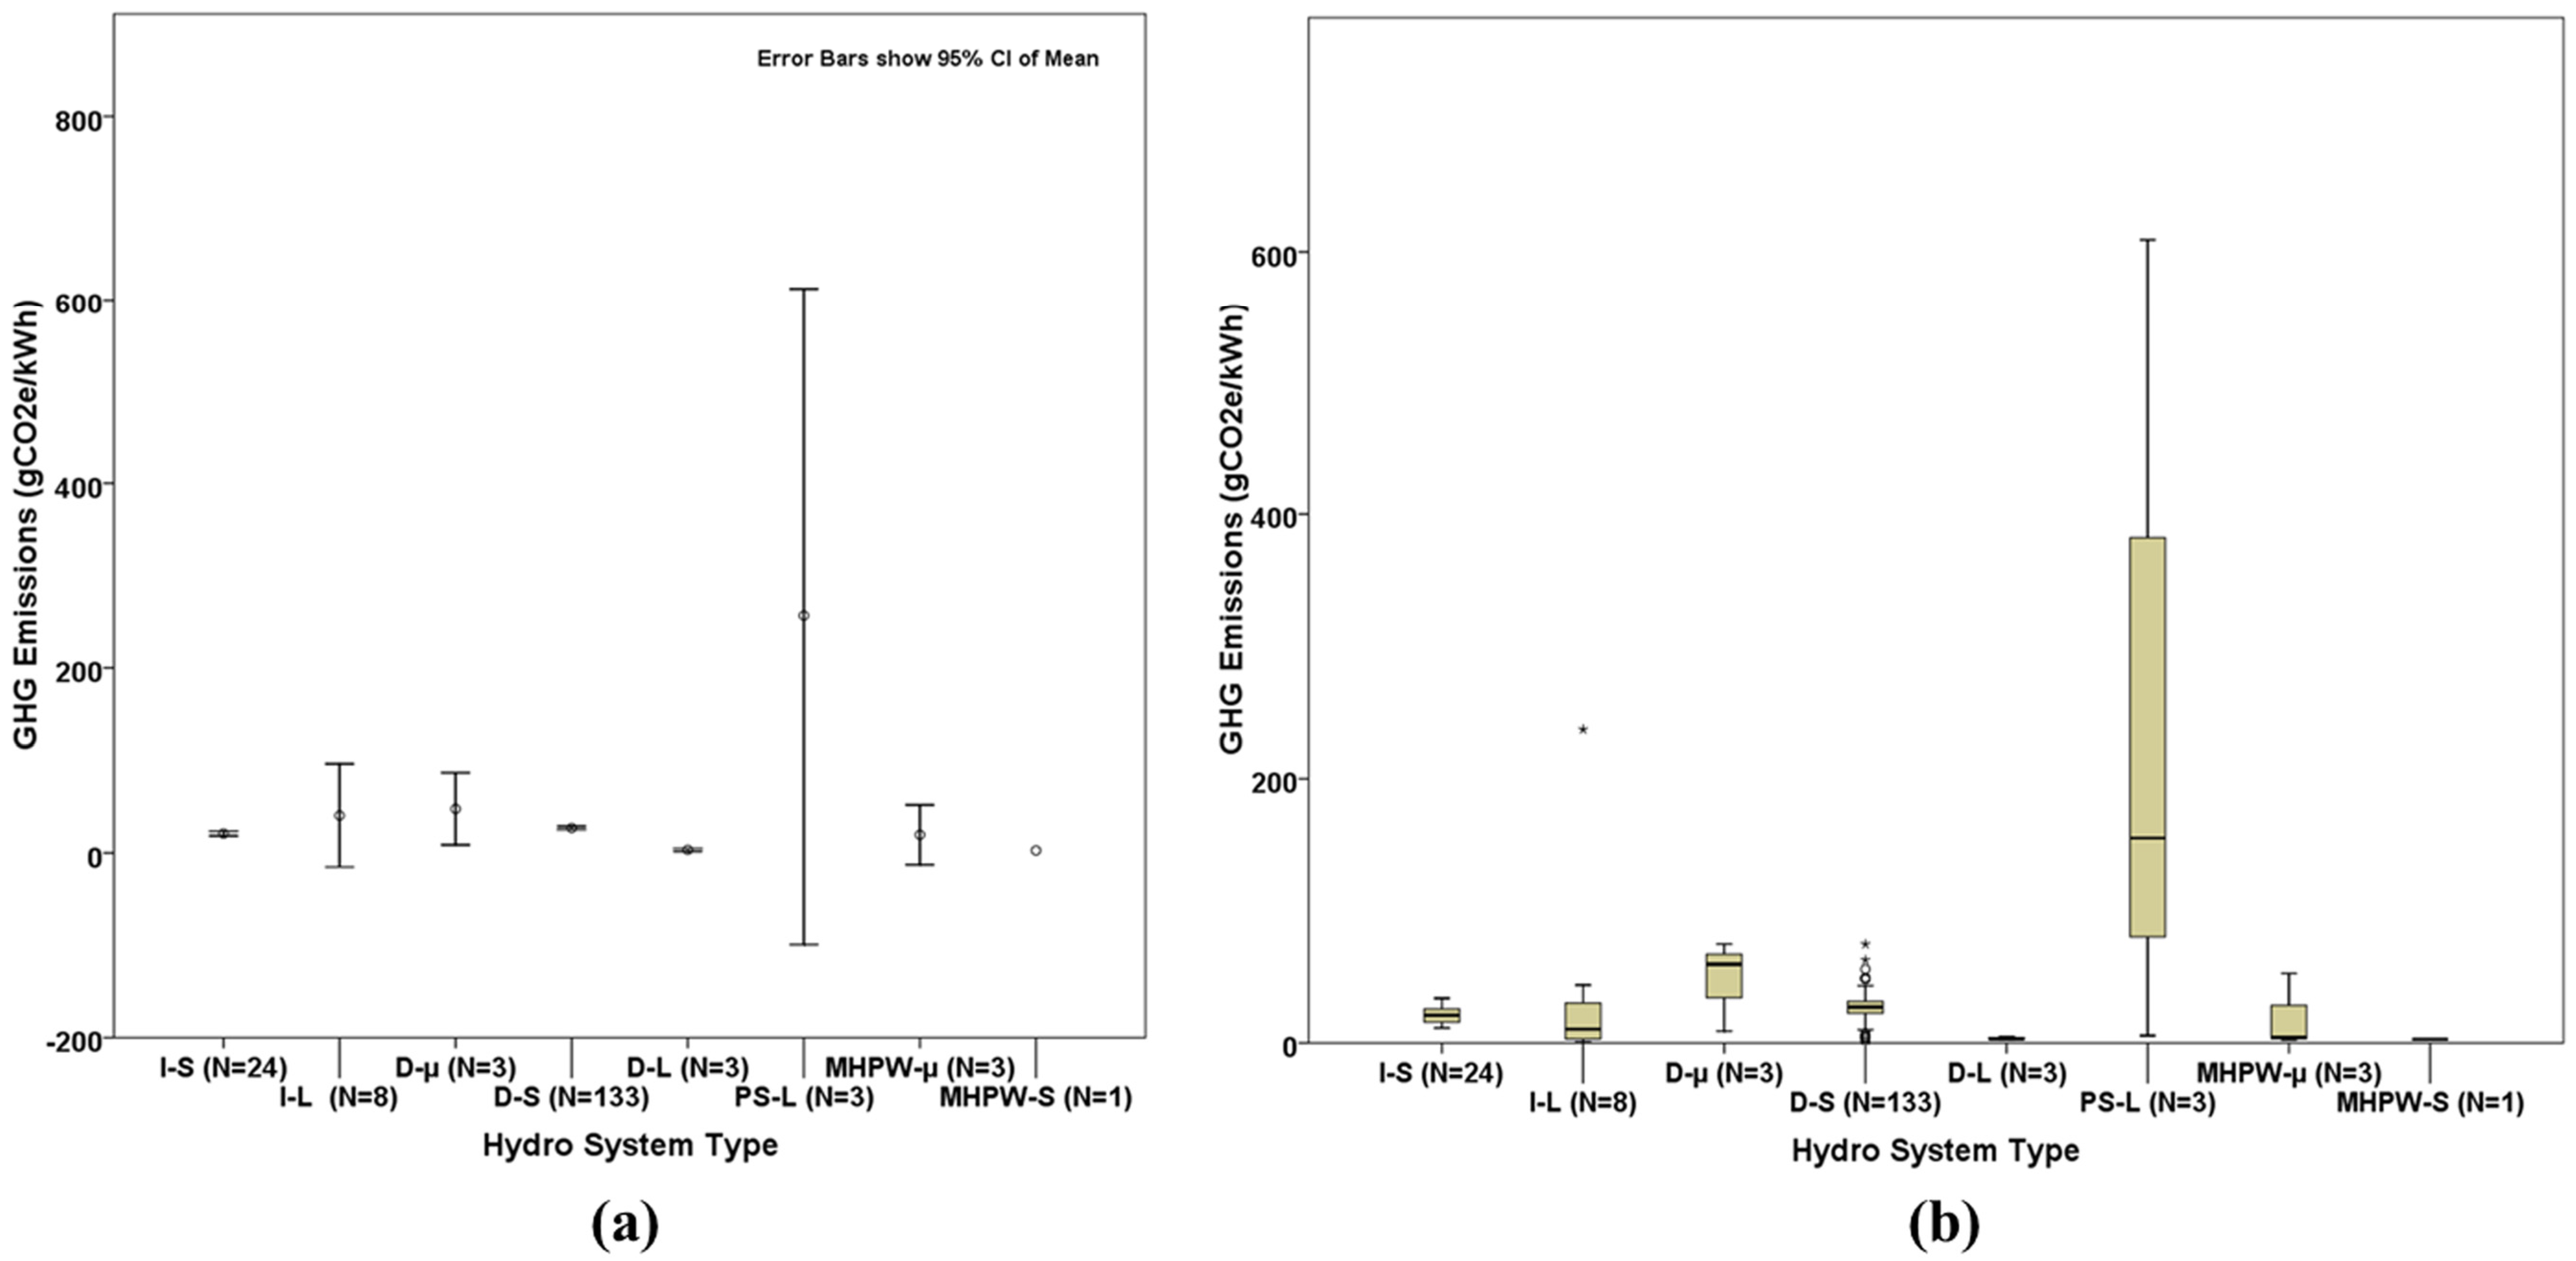
- impoundment (I)—The impoundment is the most common type of facility. The facility has a dam that stores water in the reservoir and generates electricity when moving water rotates the turbines.
- diversion (D)—The diversion facility, also referred to as the run-of-river facility, diverts a section of river water through a canal or penstock to generate electricity. The use of a dam is not mandatory in the diversion facility.
- pumped storage (PS)—The pumped storage facility uses energy from other sources (e.g., solar, wind, etc.) to pump water uphill from a lower reservoir to an upper reservoir during periods of low energy demand. Water from the upper reservoir flows back into the lower reservoir during periods of high energy demand and generates electricity.
- micro (µ)—electricity generation capacity is less than 0.1 megawatt (MW).
- small (S)—electricity generation capacity is between than 0.1 and 30 MW.
- large (L)—electricity generation capacity is greater than 30 MW.
3. Results and Discussion
3.1. Review of Hydro LCA Studies
3.2. Statistical Evaluation of Hydro LCA Studies
4. Conclusions
Acknowledgments
Author Contributions
Conflicts of Interest
References
- Wagner, H.J.; Mathur, J. Introduction to Hydro Energy Systems: Basics, Technology and Operation; Springer: New York, NY, USA, 2011; pp. 49–52. [Google Scholar]
- International Energy Statistics. Available online: http://www.eia.gov/cfapps/ipdbproject/iedindex3.cfm?tid=44&pid=44&aid=2&cid=ww,r1,&syid=2008&eyid=2012&unit=QBTU (accessed on 1 June 2016).
- United States Energy Information Administration. International Energy Outlook 2013. Available online: http://www.eia.gov/forecasts/ieo/pdf/0484(2013).pdf (accessed on 1 June 2016).
- Gagnon, L.; van de Vate, J.F. Greenhouse gas emissions from hydropower: The state of research in 1996. Energy Policy 1997, 25, 7–13. [Google Scholar] [CrossRef]
- Denholm, P.; Kulcinski, G.L. Life cycle energy requirements and greenhouse gas emissions from large scale energy storage systems. Energy Convers. Manag. 2004, 45, 2153–2172. [Google Scholar] [CrossRef]
- Hondo, H. Life cycle GHG emission analysis of power generation systems: Japanese case. Energy 2005, 30, 2042–2056. [Google Scholar] [CrossRef]
- Pehnt, M. Dynamic life cycle assessment (LCA) of renewable energy technologies. Renew. Energy 2006, 31, 55–71. [Google Scholar] [CrossRef]
- Rule, B.M.; Worth, Z.J.; Boyle, C.A. Comparison of life cycle carbon dioxide emissions and embodied energy in four renewable electricity generation technologies in New Zealand. Environ. Sci. Technol. 2009, 43, 6406–6413. [Google Scholar] [CrossRef] [PubMed]
- Environmental Product Declaration: Wildegg-Brugg Run-of-River Power Plant. Available online: http://gryphon.environdec.com/data/files/6/9037/epd205_Axpo_Wildegg_Brugg.pdf (accessed on 1 June 2016).
- Ribeiro, F.M.; da Silva, G.A. Life-cycle inventory for hydroelectric generation: A Brazilian case study. J. Clean. Prod. 2010, 18, 44–54. [Google Scholar] [CrossRef]
- Pascale, A.; Urmee, T.; Moore, A. Life cycle assessment of a community hydroelectric power system in rural Thailand. Renew. Energy 2011, 36, 2799–2808. [Google Scholar] [CrossRef]
- Suwanit, W.; Gheewala, S.H. Life cycle assessment of mini-hydropower plants in Thailand. Int. J. Life Cycle Assess. 2011, 16, 849–858. [Google Scholar] [CrossRef]
- Flury, K.; Frischknecht, R. Life Cycle Inventories of Hydroelectric Power Generation. Available online: http://www.esu-services.ch/fileadmin/download/publicLCI/flury-2012-hydroelectric-power-generation.pdf (accessed on 1 June 2016).
- National Energy Technology Laboratory. Role of Alternative Energy Sources: Hydropower Technology Assessment. Available online: https://www.netl.doe.gov/energy-analyses/temp/FY12_RoleofAlternativeEnergySourcesHydropowerTechnologyAssessmentBrief_080112.pdf (accessed on 13 May 2016).
- Varun; Prakash, R.; Bhat, I.K. Life cycle greenhouse gas emissions estimation for small hydropower schemes in India. Energy 2012, 44, 498–508. [Google Scholar] [CrossRef]
- Arnøy, S.; Modahl, I.S. Life Cycle Data for Hydroelectric Generation at Embretsfoss 4 (E4) Power Station: Background Data for Life Cycle Assessment (LCA) and Environmental Product Declaration (EPD) 2013. Available online: http://ostfoldforskning.no/uploads/dokumenter/publikasjoner/703.pdf (accessed on 9 May 2016).
- Arnøy, S.; Modahl, I.S. Life Cycle Data for Hydroelectric Generation at Trollheim Power Station: Background Data for Updating Environmental Product Declaration (EPD) 2013. Available online: http://ostfoldforskning.no/uploads/dokumenter/publikasjoner/722.pdf (accessed on 9 May 2016).
- Donnelly, C.R.; Carias, A.; Morgenroth, M.; Ali, M.; Bridgeman, A.; Wood, N. An assessment of the life cycle costs and GHG emissions for alternative generation technologies. In Proceedings of the 2010 International World Energy Council Conference, Montreal, Quebec, Canada, 12–16 September 2010.
- Environmental Product Declaration: Au-Schönenberg Small-Scale Hydro Power Plant. Available online: https://www.axpo.com/content/dam/axpo/switzerland/umwelt/dokumente/umweltdeklaration_au_schoenenberg_2014_en.pdf (accessed on 1 June 2016).
- Gallagher, J.; Styles, D.; McNabola, A.; Williams, A.P. Current and future environmental balance of small-scale run-of-river hydropower. Environ. Sci. Technol. 2015, 49, 6344–6351. [Google Scholar] [CrossRef] [PubMed]
- Gallagher, J.; Styles, D.; McNabola, A.; Williams, A.P. Life cycle environmental balance and greenhouse gas mitigation potential of micro-hydropower energy recovery in the water industry. J. Clean. Prod. 2015, 99, 152–159. [Google Scholar] [CrossRef]
- Hanafi, J.; Riman, A. Life cycle assessment of a mini hydro power plant in Indonesia: A case study in Karai river. Procedia CIRP 2015, 29, 444–449. [Google Scholar] [CrossRef]
- Amponsah, N.W.; Troldborg, M.; Kington, B.; Aalders, I.; Hough, R.L. Greenhouse gas emissions from renewable energy sources: A review of lifecycle considerations. Renew. Sustain. Energy Rev. 2014, 39, 461–475. [Google Scholar] [CrossRef]
- Asdrubali, F.; Baldinelli, G.; D’Alessandro, F.; Scrucca, F. Life cycle assessment of electricity production from renewable energies: Review and results harmonization. Renew. Sustain. Energy Rev. 2015, 42, 1113–1122. [Google Scholar] [CrossRef]
- Raadal, H.L.; Gagnon, L.; Modahl, I.S.; Hanssen, O.J. Life cycle greenhouse gas (GHG) emissions from the generation of wind and hydro power. Renew. Sustain. Energy Rev. 2011, 15, 3417–3422. [Google Scholar] [CrossRef]
- Turconi, R.; Boldrin, A.; Astrup, T. Life cycle assessment (LCA) of electricity generation technologies: Overview, comparability and limitations. Renew. Sustain. Energy Rev. 2013, 28, 555–565. [Google Scholar] [CrossRef]
- Types of Hydropower Plants. Available online: http://energy.gov/eere/water/types-hydropower-plants (accessed on 1 June 2016).
- Gleick, P.H. Environmental consequences of hydroelectric development: The role of facility size and type. Energy 1992, 17, 735–747. [Google Scholar] [CrossRef]

| Source | Categorization | GHG Emissions (gCO2e/kWh) | Additional Features | ||
|---|---|---|---|---|---|
| Facility Type | Electric Power Generation Capacity | Unique Category Code | EGC (MW); CF (%); PL (years); GL | ||
| Gagnon and van de Vate [4] | I | L | I-L | 237 | EGC = 4000; PL = 100; GL = Japan |
| Denholm and Kulcinski [5] | PS | L | PS-L | 5.6 | EGC = 31-2100; CF = 20; PL = 60; GL = USA |
| Hondo [6] | D | S | D-S | 11.3 | EGC = 10; CF = 45; PL = 30; GL = Japan |
| Pehnt [7] | D | S | D-S | 10 | EGC = 3.1; GL = Germany |
| D | S | D-S | 13 | EGC = 0.3; GL = Germany | |
| Rule et al. [8] | I | L | I-L | 4.6 | EGC = 432 (4 × 10⁸); PL = 100; GL = New Zealand |
| Environmental Product Declaration Report [9] | D | L | D-L | 3.16 | EGC = 50; PL = 100; GL = Aargau, Switzerland |
| Ribeiro and Silva [10] | I | L | I-L | 1.56 | EGC = 14000; PL =100; GL = Brazil-Paraguay |
| Pascale et al. [11] | MHPW | µ | MHPW-µ | 52.7 | EGC = 0.003; CF = 53; PL = 20; GL = Thailand |
| Suwanit and Gheewala [12] | D | S | D-S | 11.01 | EGC = 5.1; PL = 100; GL = Thailand |
| D | S | D-S | 23.01 | EGC = 6 (2 × 3); PL = 100; GL = Thailand | |
| D | S | D-S | 16.28 | EGC = 2.5 (2 × 1.25); PL = 100; GL = Thailand | |
| D | S | D-S | 22.71 | EGC = 2.25; PL = 100; GL = Thailand | |
| D | S | D-S | 16.49 | EGC = 1.15; PL = 100; GL = Thailand | |
| Flury and Frischknecht [13] | I | L | I-L | 5.86 | EGC = 95; PL = 150; GL = alpine, Europe |
| I | L | I-L | 16.64 | EGC = 95; PL = 150; GL = non-alpine, Europe | |
| PS | L | PS-L | 155.1 | EGC = 95; PL = 150; GL = Switzerland | |
| PS | L | PS-L | 609.2 | EGC = 95; PL = 150; GL = Europe | |
| D | S | D-S | 3.62 | EGC = 8.6; PL = 80; GL = Switzerland | |
| D | S | D-S | 3.79 | EGC = 8.6; PL = 80; GL = Europe | |
| National Energy Technology Laboratory Report [14] | I | L | I-L | 43.8 | EGC = 2080; PL = 80; GL = USA |
| Varun et al. [15] | D | S | D-S | 26.41 | EGC = 1; PL = 30; GL = Karnataka, India |
| D | S | D-S | 25.52 | EGC = 1.5; PL = 30; GL = Karnataka, India | |
| D | S | D-S | 28.14 | EGC = 1; PL = 30; GL = Karnataka, India | |
| D | S | D-S | 30.33 | EGC = 0.25; PL = 30; GL = Karnataka, India | |
| D | S | D-S | 16.44 | EGC = 4.5; PL = 30; GL = Rajasthan, India | |
| D | S | D-S | 15.44 | EGC = 4.5; PL = 30; GL = Rajasthan, India | |
| D | S | D-S | 15.85 | EGC = 4 (2 × 2); PL = 30; GL = Rajasthan, India | |
| D | S | D-S | 31.19 | EGC = 0.85; PL = 30; GL = Karnataka, India | |
| D | S | D-S | 24.19 | EGC = 1.5; PL = 30; GL = Andhra Pradesh, India | |
| D | S | D-S | 19.99 | EGC = 3; PL = 30; GL = Karnataka, India | |
| D | S | D-S | 31.11 | EGC = 0.8 (2 × 0.4); PL = 30; GL = Andhra Pradesh, India | |
| D | S | D-S | 29.97 | EGC = 0.8; PL = 30; GL = Andhra Pradesh, India | |
| D | S | D-S | 27.96 | EGC = 2 (2 × 1); PL = 30; GL = Andhra Pradesh, India | |
| D | S | D-S | 25.27 | EGC = 2 (2 × 1); PL = 30; GL = Andhra Pradesh, India | |
| D | S | D-S | 33.12 | EGC = 0.65; PL = 30; GL = Andhra Pradesh, India | |
| D | S | D-S | 28.75 | EGC = 0.8; PL = 30; GL = Andhra Pradesh, India | |
| D | S | D-S | 23.8 | EGC = 2 (2 × 1); PL = 30; GL = Andhra Pradesh, India | |
| D | S | D-S | 26.33 | EGC = 2.14 (2 × 1.07); PL = 30; GL = Andhra Pradesh, India | |
| D | S | D-S | 28.67 | EGC = 1.588 (2 × 0.794); PL = 30; GL = Andhra Pradesh, India | |
| D | S | D-S | 26.16 | EGC = 2.47 (2 × 1.235); PL = 30; GL = Andhra Pradesh, India | |
| D | S | D-S | 35.97 | EGC = 0.5; PL = 30; GL = Andhra Pradesh, India | |
| D | S | D-S | 37.56 | EGC = 0.5; PL = 30; GL = Andhra Pradesh, India | |
| D | S | D-S | 38.25 | EGC = 0.55; PL = 30; GL = Andhra Pradesh, India | |
| D | S | D-S | 35.64 | EGC = 0.55; PL = 30; GL = Andhra Pradesh, India | |
| D | S | D-S | 33.44 | EGC = 0.5; PL = 30; GL = Andhra Pradesh, India | |
| D | S | D-S | 27.1 | EGC = 3.3 (2 × 1.65); PL = 30; GL = Andhra Pradesh, India | |
| D | S | D-S | 32.71 | EGC = 0.5; PL = 30; GL = Andhra Pradesh, India | |
| D | S | D-S | 30.43 | EGC = 0.8 (2 × 0.4); PL = 30; GL = Andhra Pradesh, India | |
| D | S | D-S | 23.34 | EGC = 2 (2 × 1); PL = 30; GL = Andhra Pradesh, India | |
| D | S | D-S | 32.37 | EGC = 0.55; PL = 30; GL = Tamilnadu, India | |
| D | S | D-S | 29.56 | EGC = 0.8; PL = 30; GL = Andhra Pradesh, India | |
| D | S | D-S | 26.51 | EGC = 3.3 (2 × 1.65); PL = 30; GL = Andhra Pradesh, India | |
| D | S | D-S | 20.56 | EGC = 7.5 (3 × 2.5); PL = 30; GL = Andhra Pradesh, India | |
| D | S | D-S | 28.92 | EGC = 1; PL = 30; GL = Andhra Pradesh, India | |
| D | S | D-S | 32.71 | EGC = 0.65; PL = 30; GL = Andhra Pradesh, India | |
| D | S | D-S | 23.74 | EGC = 1.85; PL = 30; GL = Andhra Pradesh, India | |
| D | S | D-S | 24.89 | EGC = 1.7; PL = 30; GL = Andhra Pradesh, India | |
| D | S | D-S | 25.42 | EGC = 1.7; PL = 30; GL = Andhra Pradesh, India | |
| D | S | D-S | 20.39 | EGC = 3.75 (3 × 1.25); PL = 30; GL = Andhra Pradesh, India | |
| D | S | D-S | 28.17 | EGC = 1 (2 × 0.5); PL = 30; GL = Bihar, India | |
| D | S | D-S | 33.31 | EGC = 0.7 (2 × 0.35); PL = 30; GL = Bihar, India | |
| D | S | D-S | 28.18 | EGC = 1 (2 × 0.5); PL = 30; GL = Bihar, India | |
| D | S | D-S | 31.56 | EGC = 0.5; PL = 30; GL = Bihar, India | |
| D | S | D-S | 41.75 | EGC = 0.25; PL = 30; GL = Bihar, India | |
| D | S | D-S | 28.19 | EGC = 1 (2 × 0.5); PL = 30; GL = Bihar, India | |
| D | S | D-S | 39.77 | EGC = 0.5 (2 × 0.25); PL = 30; GL = Bihar, India | |
| D | S | D-S | 23.38 | EGC = 1.5 (2 × 0.75); PL = 30; GL = Bihar, India | |
| D | S | D-S | 26.12 | EGC = 1 (2 × 0.5); PL = 30; GL = Bihar, India | |
| D | S | D-S | 21.2 | EGC = 3 (2 × 1.5); PL = 30; GL = Karnataka, India | |
| D | S | D-S | 22.15 | EGC = 2.8; PL = 30; GL = Karnataka, India | |
| D | S | D-S | 24.29 | EGC = 1.3; PL = 30; GL = Karnataka, India | |
| D | S | D-S | 36.4 | EGC = 0.25; PL = 30; GL = Madhya Pradesh, India | |
| D | S | D-S | 28.07 | EGC = 1 (2 × 0.5); PL = 30; GL = Madhya Pradesh, India | |
| D | S | D-S | 32.02 | EGC = 1.4 (2 × 0.7); PL = 30; GL = Punjab, India | |
| D | S | D-S | 32.05 | EGC = 1.5 (2 × 0.75); PL = 30; GL = Punjab, India | |
| D | S | D-S | 32.05 | EGC = 1.5 (2 × 0.75); PL = 30; GL = Punjab, India | |
| D | S | D-S | 31.04 | EGC = 1.5 (2 × 0.75); PL = 30; GL = Punjab, India | |
| D | S | D-S | 35.12 | EGC = 0.535; PL = 30; GL = Rajasthan, India | |
| D | S | D-S | 27.55 | EGC = 1.2; PL = 30; GL = Rajasthan, India | |
| D | S | D-S | 22.85 | EGC = 2.25 (3 × 0.75); PL = 30; GL = Tamilnadu, India | |
| D | S | D-S | 31.29 | EGC = 0.75; PL = 30; GL = West Bengal, India | |
| I | S | I-S | 31.2 | EGC = 1 (2 × 0.5); PL = 30; GL = Bihar, India | |
| I | S | I-S | 33.86 | EGC = 0.4 (2 × 0.2); PL = 30; GL = Bihar, India | |
| I | S | I-S | 23.9 | EGC = 15; PL = 30; GL = Maharashtra, India | |
| I | S | I-S | 25.6 | EGC = 1.5 (2 × 0.75); PL = 30; GL = Karnataka, India | |
| I | S | I-S | 16.63 | EGC = 10; PL = 30; GL = Andhra Pradesh, India | |
| I | S | I-S | 26.6 | EGC = 1.5; PL = 30; GL = Karnataka, India | |
| I | S | I-S | 21.46 | EGC = 2; PL = 30; GL = Andhra Pradesh, India | |
| I | S | I-S | 15.1 | EGC = 15 (2 × 7.5); PL = 30; GL = Andhra Pradesh, India | |
| I | S | I-S | 17.6 | EGC = 2.4; PL = 30; GL = Karnataka, India | |
| I | S | I-S | 19.39 | EGC = 2 (2 × 1); PL = 30; GL = Karnataka, India | |
| I | S | I-S | 16.4 | EGC = 9 (2 × 4.5); PL = 30; GL = Karnataka, India | |
| I | S | I-S | 15.25 | EGC = 16 (4 × 4); PL = 30; GL = Karnataka, India | |
| I | S | I-S | 21.57 | EGC = 2.4 (2 × 1.2); PL = 30; GL = Madhya Pradesh, India | |
| I | S | I-S | 12.76 | EGC = 16 (2 × 8); PL = 30; GL = Maharashtra, India | |
| I | S | I-S | 11.34 | EGC = 16; PL = 30; GL = Maharashtra, India | |
| I | S | I-S | 27.5 | EGC = 1.3 (2 × 0.65); PL = 30; GL = Tamilnadu, India | |
| I | S | I-S | 18.62 | EGC = 2.5 (2 × 0.125); PL = 30; GL = Tamilnadu, India | |
| I | S | I-S | 30.99 | EGC = 0.7 (2 × 0.35); PL = 30; GL = Tamilnadu, India | |
| I | S | I-S | 23.76 | EGC = 2; PL = 30; GL = Tamilnadu, India | |
| I | S | I-S | 13.53 | EGC = 9 (2 × 4.5); PL = 30; GL = Maharashtra, India | |
| I | S | I-S | 26.06 | EGC = 1.5; PL = 30; GL = Maharashtra, India | |
| I | S | I-S | 20.58 | EGC = 1.5; PL = 30; GL = Karnataka, India | |
| I | S | I-S | 21.44 | EGC = 3 (2 × 1.5); PL = 30; GL = Andhra Pradesh, India | |
| I | S | I-S | 14.13 | EGC = 8 (2 × 4); PL = 30; GL = Karnataka, India | |
| D | S | D-S | 24.57 | EGC = 5 (2 × 2.5); PL = 30; GL = Uttarakhand, India | |
| D | S | D-S | 21.43 | EGC = 8 (2 × 4); PL = 30; GL = Arunachal Pradesh, India | |
| D | S | D-S | 29.19 | EGC = 2 (2 × 1); PL = 30; GL = Sikkim, India | |
| D | S | D-S | 27.94 | EGC = 3 (3 × 1); PL = 30; GL = Uttarakhand, India | |
| D | S | D-S | 33.66 | EGC = 1 (2 × 0.5); PL = 30; GL = Sikkim, India | |
| D | S | D-S | 23.68 | EGC = 5 (2 × 2.5); PL = 30; GL = Sikkim, India | |
| D | S | D-S | 20.5 | EGC = 9 (3 × 3); PL = 30; GL = Sikkim, India | |
| D | S | D-S | 27.89 | EGC = 2 (2 × 1); PL = 30; GL = Arunachal Pradesh, India | |
| D | S | D-S | 21.12 | EGC = 6 (3 × 2); PL = 30; GL = Arunachal Pradesh, India | |
| D | S | D-S | 31.46 | EGC = 0.9 (3 × 0.3); PL = 30; GL = Jammu & Kashmir, India | |
| D | S | D-S | 18.87 | EGC = 4 (2 × 2); PL = 30; GL = Himachal Pradesh, India | |
| D | S | D-S | 23.17 | EGC = 2 (2 × 1); PL = 30; GL = Himachal Pradesh, India | |
| D | S | D-S | 48.23 | EGC = 0.2 (2 × 0.1); PL = 30; GL = Himachal Pradesh, India | |
| D | S | D-S | 20.18 | EGC = 4.5 (2 × 2.25); PL = 30; GL = Himachal Pradesh, India | |
| D | S | D-S | 37.52 | EGC = 1 (2 × 0.5); PL = 30; GL = Uttarakhand, India | |
| D | S | D-S | 29.12 | EGC = 2 (2 × 1); PL = 30; GL = Sikkim, India | |
| D | S | D-S | 25.05 | EGC = 4.5 (2 × 2.25); PL = 30; GL = Himachal Pradesh, India | |
| D | S | D-S | 31.2 | EGC = 1 (2 × 0.5); PL = 30; GL = Himachal Pradesh, India | |
| D | S | D-S | 32.57 | EGC = 0.9 (2 × 0.45); PL = 30; GL = Himachal Pradesh, India | |
| D | S | D-S | 34.03 | EGC = 0.8; PL = 30; GL = Himachal Pradesh, India | |
| D | S | D-S | 29 | EGC = 3 (2 × 1.5); PL = 30; GL = Himachal Pradesh, India | |
| D | S | D-S | 24.22 | EGC = 3 (2 × 1.5); PL = 30; GL = Himachal Pradesh, India | |
| D | S | D-S | 22.99 | EGC = 3 (2 × 1.5); PL = 30; GL = Himachal Pradesh, India | |
| D | S | D-S | 23.99 | EGC = 5 (2 × 2.5); PL = 30; GL = Himachal Pradesh, India | |
| D | S | D-S | 21.12 | EGC = 3 (2 × 1.5); PL = 30; GL = Himachal Pradesh, India | |
| D | S | D-S | 26.7 | EGC = 1.8 (2 × 0.9); PL = 30; GL = Himachal Pradesh, India | |
| D | S | D-S | 27.12 | EGC = 1 (2 × 0.5); PL = 30; GL = Himachal Pradesh, India | |
| D | S | D-S | 30.58 | EGC = 1 (2 × 0.5); PL = 30; GL = Himachal Pradesh, India | |
| D | S | D-S | 28.71 | EGC = 1 (2 × 0.5); PL = 30; GL = Himachal Pradesh, India | |
| D | S | D-S | 22.66 | EGC = 3 (2 × 1.5); PL = 30; GL = Himachal Pradesh, India | |
| D | S | D-S | 14 | EGC = 21; PL = 30; GL = Kerala, India | |
| D | S | D-S | 25.11 | EGC = 2 (2 × 1); PL = 30; GL = Uttar Pradesh, India | |
| D | S | D-S | 21.03 | EGC = 3 (3 × 1); PL = 30; GL = Uttar Pradesh, India | |
| D | S | D-S | 20.58 | EGC = 3 (3 × 1); PL = 30; GL = Uttarakhand, India | |
| D | S | D-S | 22.85 | EGC = 3 (3 × 1); PL = 30; GL = Uttarakhand, India | |
| D | S | D-S | 28.12 | EGC = 1 (2 × 0.5); PL = 30; GL = Uttarakhand, India | |
| D | S | D-S | 22.01 | EGC = 3 (3 × 1); PL = 30; GL = Uttarakhand, India | |
| D | S | D-S | 27.16 | EGC = 3 (2 × 1.5); PL = 30; GL = Uttarakhand, India | |
| D | S | D-S | 26.63 | EGC = 6 (2 × 3); PL = 30; GL = Uttarakhand, India | |
| D | S | D-S | 49.18 | EGC = 0.3 (3 × 0.1); PL = 30; GL = Jammu & Kashmir, India | |
| D | S | D-S | 43.36 | EGC = 0.6 (3 × 0.2); PL = 30; GL = Himachal Pradesh, India | |
| D | S | D-S | 29.18 | EGC = 6 (2 × 3); PL = 30; GL = Arunachal Pradesh, India | |
| D | S | D-S | 43.06 | EGC = 0.75 (3 × 0.25); PL = 30; GL = Arunachal Pradesh, India | |
| D | S | D-S | 41.91 | EGC = 0.75 (3 × 0.25); PL = 30; GL = Arunachal Pradesh, India | |
| D | µ | D-µ | 74.87 | EGC = 0.05 (2 × 0.025); PL = 30; GL = Uttarakhand, India | |
| D | S | D-S | 55.87 | EGC = 0.1 (2 × 0.05); PL = 30; GL = Uttarakhand, India | |
| D | S | D-S | 25.85 | EGC = 6 (2 × 3); PL = 30; GL = Arunachal Pradesh, India | |
| D | µ | D-µ | 59.65 | EGC = 0.05 (2 × 0.025); PL = 30; GL = Uttarakhand, India | |
| D | S | D-S | 62.86 | EGC = 0.1 (2 × 0.05); PL = 30; GL = Uttarakhand, India | |
| D | S | D-S | 49.24 | EGC = 0.2 (2 × 0.1); PL = 30; GL = Uttarakhand, India | |
| D | S | D-S | 21.98 | EGC = 4; PL = 30; GL = Maharashtra, India | |
| D | S | D-S | 15.96 | EGC = 25 (2 × 12.5); PL = 30; GL = Orissa, India | |
| D | S | D-S | 18.26 | EGC = 12 (3 × 4); PL = 30; GL = Orissa, India | |
| D | S | D-S | 27.24 | EGC = 3 (2 × 1.5); PL = 30; GL = Uttarakhand, India | |
| D | S | D-S | 26.95 | EGC = 3 (2 × 1.5); PL = 30; GL = Uttarakhand, India | |
| D | S | D-S | 22.76 | EGC = 3 (2 × 1.5); PL = 30; GL = Uttarakhand, India | |
| D | S | D-S | 32.49 | EGC = 3 (2 × 1.5); PL = 30; GL = Arunachal Pradesh, India | |
| D | S | D-S | 74.79 | EGC = 2 (2 × 1); PL = 30; GL = Arunachal Pradesh, India | |
| D | S | D-S | 31.74 | EGC = 3 (3 × 1); PL = 30; GL = Uttar Pradesh, India | |
| D | S | D-S | 35.49 | EGC = 3 (3 × 1); PL = 30; GL = Uttarakhand, India | |
| Arnøy and Modahl [16] | D | L | D-L | 2.19 | EGC = 52.5; PL = 100; GL = Embretsfoss, Norway |
| Arnøy and Modahl [17] | I | L | I-L | 0.61 | EGC = 130; PL = 100; GL = Trollheim, Norway |
| Donnelly et al. [18] | I | L | I-L | 15 | EGC = 1000; CF = 57.5; PL = 100 |
| D | L | D-L | 5 | EGC = 100; CF = 57.5; PL = 100 | |
| Environmental Product Declaration Report [19] | D | S | D-S | 5.23 | EGC = 2.1; PL = 100; GL = Zürich, Switzerland |
| Gallagher et al. [20] | D | S | D-S | 5.46 | EGC = 0.65; PL = 50; GL = North Wales, UK |
| D | S | D-S | 7.39 | EGC = 0.1; PL = 50; GL = North Wales, UK | |
| D | µ | D-µ | 8.93 | EGC = 0.05; PL = 50; GL = North England, UK | |
| Gallagher et al. [21] | MHPW | µ | MHPW-µ | 2.14 | EGC = 0.015; PL = 30; GL = UK |
| MHPW | µ | MHPW-µ | 4.36 | EGC = 0.09; PL = 30; GL = Ireland | |
| MHPW | S | MHPW-S | 2.78 | EGC = 0.14; PL = 30; GL = UK | |
| Hanafi and Riman [22] | D | S | D-S | 1.2 | EGC = 9; PL = 50; GL = Simalungun, Indonesia |
| Hydro System Type | N | X ± SD | Min. | Max. | SE | Q1 | Q2 | Q3 |
|---|---|---|---|---|---|---|---|---|
| I-S | 24 | 21.05 ± 6.25 | 11.34 | 33.86 | 1.28 | 15.25 | 21.01 | 25.6 |
| I-L | 8 | 40.63 ± 80.57 | 0.61 | 237 | 28.49 | 1.56 | 10.43 | 16.64 |
| D-µ | 3 | 47.82 ± 34.53 | 8.93 | 74.87 | 19.93 | 8.93 | 59.65 | 74.87 |
| D-S | 133 | 27.18 ± 10.38 | 1.2 | 74.79 | 0.9 | 22.66 | 27.1 | 31.56 |
| D-L | 3 | 3.45 ± 1.43 | 2.19 | 5 | 0.82 | 2.19 | 3.16 | 5 |
| PS-L | 3 | 256.63 ± 314.35 | 5.6 | 609.2 | 181.49 | 5.6 | 155.1 | 155.1 |
| MHPW-µ | 3 | 19.73 ± 28.57 | 2.14 | 52.7 | 16.5 | 2.14 | 4.36 | 52.7 |
| MHPW-S | 1 | 2.78 ± 0 | 2.78 | 2.78 | 0 | 2.78 | 2.78 | 2.78 |
© 2016 by the authors; licensee MDPI, Basel, Switzerland. This article is an open access article distributed under the terms and conditions of the Creative Commons Attribution (CC-BY) license (http://creativecommons.org/licenses/by/4.0/).
Share and Cite
Kadiyala, A.; Kommalapati, R.; Huque, Z. Evaluation of the Life Cycle Greenhouse Gas Emissions from Hydroelectricity Generation Systems. Sustainability 2016, 8, 539. https://doi.org/10.3390/su8060539
Kadiyala A, Kommalapati R, Huque Z. Evaluation of the Life Cycle Greenhouse Gas Emissions from Hydroelectricity Generation Systems. Sustainability. 2016; 8(6):539. https://doi.org/10.3390/su8060539
Chicago/Turabian StyleKadiyala, Akhil, Raghava Kommalapati, and Ziaul Huque. 2016. "Evaluation of the Life Cycle Greenhouse Gas Emissions from Hydroelectricity Generation Systems" Sustainability 8, no. 6: 539. https://doi.org/10.3390/su8060539
APA StyleKadiyala, A., Kommalapati, R., & Huque, Z. (2016). Evaluation of the Life Cycle Greenhouse Gas Emissions from Hydroelectricity Generation Systems. Sustainability, 8(6), 539. https://doi.org/10.3390/su8060539