Article

Measuring the Interprovincial CO2 Emissions Considering Electric Power Dispatching in China: From Production and Consumption Perspectives

1
School of Economics and Management, Wuyi University, Jiangmen 529020, China
2
Jiangmen Economic Research Center, Jiangmen 529020, China
3
School of Management, Jinan University, Guangzhou 510632, China
*
Author to whom correspondence should be addressed.
Sustainability 2016, 8(6), 506; https://doi.org/10.3390/su8060506
Submission received: 1 April 2016 / Revised: 20 May 2016 / Accepted: 23 May 2016 / Published: 25 May 2016

Abstract

:
How to accurately measure the interprovincial CO2 emissions is key to achieving the task of energy saving and emission reduction. Electric power is very important for economy development. At the same time, the amount of interprovincial electric power dispatching is very large in China, so it is obligatory to measure the CO2 emissions from both electricity production and consumption perspectives. We have measured China's interprovincial CO2 emissions from fossil fuel combustion during 2000–2014, in which the revised regional electric power CO2 emissions are used to adjust interprovincial CO2 emissions. The obtained results show that: no matter from which perspective one considers the situation, the overall CO2 emissions of China are almost the same amount. From different perspectives, the interprovincial CO2 emissions are different. In terms of the production perspective, CO2 emissions of Beijing, Hebei, Shandong, Shanghai, Jiangsu, Zhejiang and Guangdong are underestimated. However, Shanxi, Inner Mongolia, Hubei, Sichuan, Guizhou, and Shaanxi are overestimated. If the electric power dispatching is not considered, it is unfairly portrayed as transferring CO2 emissions from the electricity input provinces to the output ones, because the electricity input provinces enjoy clean energy, but the electricity production ones pay for the environmental pollution.

1. Introduction

During the past 30 years, China’s economy has experienced a rapid development, while consuming a large amount of energy, which has caused many environmental problems such as smog, sand storm and acid rain. All these problems seriously affect the sustainable economic development of China. It is urgent to solve the dilemma of simultaneously achieving economic development and environmental protection. China, as the biggest energy consumer and CO2 emitter, clearly indicates in U.S.-China Joint Announcement on Climate Change that China intends to achieve a peak of CO2 emissions around 2030 [1].
A large amount of research has been done on energy saving and emission reduction. From the perspective of energy efficiency, Zhou et al. [2], Yang et al. [3], Wang et al. [4] and Zhang et al. [5] investigated how to save energy and reduce CO2 emissions by improve energy efficiency. From the perspective of key factors, Wang et al. [6] and Li et al. [7] tried to find out key factors that affect CO2 emissions, then put forward corresponding energy saving and emission reducing measures. From the perspective of industry, Lin et al. [8], Li et al. [9], Mi et al. [10], Zhang et al. [11] , Xiang et al. [12], Xiao et al. [13] and Chi et al. [14] attempted to find out key industries or enterprises in energy saving and emission reduction. All the researches, although from different perspectives, must be based on the accurate measurement of CO2 emissions.
The 2006 Intergovernmental Panel on Climate Change (IPCC) Guidelines for National Greenhouse Gas Inventories [15] introduces three Tiers and one Reference Approach to measure energy-related CO2 emissions. Tier 1 method is subject to national fuel combustion data and default emission factors provided by IPCC. Tier 2 method is subject to national fuel combustion data and specific national emission factors. Combustion amount and emission factors of Tier 3 method are both subject to industrial data, which is a departmental method implemented from the bottom up. The accuracy is improved from Tier 1 to Tier 3 but industrial data are usually unavailable. Reference approach is an effective method when there are limited data. The basic idea of this method is to use the activity data multiplied by the emission factors. Current research varies in the selection of activity data, and is characterized as follows:
Firstly, activity data is based on primary energy consumption including coal, oil and natural gas [16,17,18,19]. This method is simple and easy to use. However, there will be a relatively big deviation of interprovincial CO2 emissions when primary energy consumption data is used, because it does not take into account the transfer of CO2 emissions when secondary energy (electricity, coke, gasoline, diesel and fuel oil, etc.) are transferred in and out the provinces. It cannot measure the CO2 emissions responsibility of each province precisely.
Secondly, activity data is based on various fuel types in the energy balance sheet. Wang and Zhang [20] used the total final consumption data of 15 types of fossil fuel according to the energy balance sheet to measure the CO2 emissions of all provinces of China. Wang et al. [21] used the total final consumption plus input and output of transformation as activity data. However, there are different activity levels of “total primary energy supply”, “input and output of transformation”, and “total final consumption” in the energy balance sheet. There are great differences in interprovincial CO2 emissions based on different activity data. Different activity data means different CO2 emissions responsibilities.
Thirdly, a few studies have considered the issue of CO2 emissions transfer during the process of secondary energy production, especially in electricity production and dispatching. Because of the complexity of electricity dispatching, only a few researchers consider the interprovincial electricity dispatching in the calculation of CO2 emissions [22,23]. However, they only use an average electric power emission factor to measure electricity CO2 emissions of different provinces. They ignore the difference of electric power emission factors in different provinces due to different sources of electricity.
To solve the shortcomings, we can measure the interprovincial CO2 emissions from both electricity production and consumption perspectives, corresponding to different CO2 emissions responsibilities. The contributions lie in the following aspects: (i) we measure the interprovincial CO2 emissions based on the energy balance sheet which can effectively distinguish various types of fuel. This includes not only the primary energy sources of coal, oil, natural gas, but also secondary energy, such as coke, coke oven gas, gasoline, diesel, fuel oil, liquefied petroleum gas et al. Provinces should be responsible for the CO2 emissions produced by their energy consumption. In order to more accurately measure CO2 emissions of the provinces; (ii) we consider the issue of CO2 emissions generated in the production process of secondary energy. Production of secondary energy mainly includes thermal power generation, heat supply, coking and oil refining. CO2 emissions in coking and oil refining mainly occur in consumption process, and CO2 emissions are relatively small in production process. Therefore, CO2 emitted in the coking and oil refining is not considered in this paper. In contrast, CO2 emissions of thermal power generation and heat supply are mainly incurred in the production process. In China, CO2 emissions of thermal power account for a huge amount of total CO2 emissions of fossil fuel consumption [24,25]. Electricity input amount in eight provinces of Guangdong, Hebei, Jiangsu, Beijing, Zhejiang, Shanghai, Liaoning and Shandong is more than 550 billion KWh; electricity output amount of Inner Mongolia, Shanxi, Hubei, Guizhou and Anhui is more than 330 billion KWh. In face of such a huge amount of electricity dispatch, if we do not consider the transfer of CO2 emissions caused by the electricity dispatch, will make the provinces dispatching out electricity to bear more emissions responsibilities than the actual; (iii) most importantly, we try to make the electric power emission factors accord with the actual situation of the provinces. There are no official electricity emission factors in China. Some researches measure electricity CO2 emissions with reference to “China’s regional grid baseline emission factors” determined by the Department of Climate Change of National Development and Reform Commission. However, this emission factor mainly reflects CO2 emissions of thermal electricity. Electricity consumed by some provinces is a large proportion of hydroelectricity. Proportions of hydroelectricity are relatively high especially in Hubei, Hunan, Chongqing, Sichuan, Guangxi and Yunnan, which are 61.9%, 39.8%, 34.2%, 70.5%, 42.5% and 67.7% respectively. If the electricity consumed in these regions is measured by thermal electricity emission factor, the result will be higher. This paper calculates comprehensive electricity emission factors of regional electric power grid according to regional electricity dispatching feature.
The remainder of this paper is organized as follows. In Section 2, the research methods and data used in this study will be explained in detail. Section 3 provides the discussion and results. Conclusions will be drawn and corresponding policy suggestions proposed in Section 4.

2. Research Methods

2.1. Basic Method

Referring to the Reference Approach of IPCC2006 Guidelines [15], we measure energy-related consumption CO2 emissions:
T C = ( Q i × δ i )
where T C is the amount of CO2 emissions produced by energy consumption; Q i is the consumption of the ith fossil fuel, presented by physical unit (unit: t or m3); δ i is the CO2 emission factor of the ith fossil fuel (unit: tCO2/t or tCO2/ m3); i represents the types of fossil fuel, including raw coal, cleaned coal, other washed coal, coal briquette, coke, coke oven gas, natural gas, liquefied natural gas, crude oil, gasoline, kerosene, diesel, fuel oil, liquefied petroleum gas. Fuels of “other petroleum products”, “other coked products” and coal gangues that are not mainly used for combustion are excluded. CO2 emission factors of 12 types of major energy are shown in Table 1.

2.2. Measurement of CO2 Emissions from the Perspective of Production

From the production perspective, the responsibility of CO2 emissions is included in fuel combustion places. Therefore, CO2 emitted in thermal power generation and heat production is included in energy consumption CO2 emissions of the province that produces them. However, some kinds of energy are used as industrial raw materials and not directly combusted in final consumption. These types energy consumption will not produce CO2 emissions, so this consumption amount shall be excluded. Moreover, as CO2 emissions of electricity and heat are already calculated at the production process, they are not included into energy consumption CO2 emissions to avoid an overlap in calculation. Therefore, provinces should be responsible for the CO2 emissions produced by their energy consumption.
T C 1 = [ Q i ( total final consumption + thermal power consumption + heating consumption  ) × δ i ]
where, T C 1 is energy consumption CO2 emission from the production perspective. Q i is the consumption of the ith energy, δ i is the CO2 emission factor of the ith energy, as shown in Table 1.

2.3. Measurement of CO2 Emissions from the Perspective of Consumption

From the perspective of consumption, apart from CO2 emitted in actually consumed energy, CO2 emitted in the electricity production process is also included in total CO2 emission of the electricity consumption place. Therefore, from the perspective of consumption, CO2 emission in the production processes of thermal power generation and heat supply shall be included into total CO2 emission of electricity and heat consumption places.
At present, concentrated heat supply of a city has regional monopoly in China. One thermal area is often equipped with one thermal source and heat power is seldom dispatched across regions [27]. Therefore, CO2 emissions of heat consumption can be measured according to energy actually consumed to produce it. CO2 emission factor of heat does not need to be calculated.
As for electric power emission factors, this is much more complex. “China’s regional grid baseline emission factors” determined by Department of Climate Change of National Development and Reform Commission, which we denote by δ e 1 , as shown in Table 2, only reflects CO2 emission of thermal electricity. Song et al. [22] use “national electricity CO2 emissions/national electricity generation” as electricity emission factor for input electricity, which neglects the difference of electricity sources of different regions and cannot measure electricity CO2 emissions of all the provinces effectively. Zhou et al. [23] use “ provincial CO 2  emission / provincial electricity generation ” as the electric power emission factor for electricity input provinces and use “thermal electricity emission factor × thermal electricity proportion” as electric power emission factor for electricity production provinces. They consider emission factors of electricity with different sources but emission factors of input electricity must be the same as that of the output province. However, the fact is the electricity emission factors of production province and consumption province are not the same. Therefore, we calculate comprehensive electricity emission factors of regional electric power grid according to regional electricity dispatching feature. Revised electric power emission factor is calculated as:
δ e 2 = Q i e × δ i E e
where δ e 2 is the revised electric power emission factor, Q i e is the amount of type i energy consumed to produce electricity in a region. E e is the amount of electricity produced in a region, including thermal electricity, hydroelectricity and other electric power.
To calculate δ e 2 , we refer to power grid division made by the Department of Climate Change of National Development and Reform Commission of China. There are six regions: north China (Beijing, Tianjin, Hebei, Shanxi and Inner Mongolia), northeast China (Liaoning, Jilin and Heilongjiang), east China (Shanghai, Jiangsu, Zhejiang, Anhui and Fujian), central China (Henan, Hubei, Hunan, Jiangxi, Sichuan and Chongqing), northwest China (Shaanxi, Gansu, Qinghai, Ningxia and Xinjiang) and south China (Guangdong, Guangxi, Yunnan, Guizhou and Hainan). We use Formula (3) to calculate the revised electric power emission factor of six regions of China, as shown in Table 3.
It can be found by comparing Table 2 with Table 3 that revised electric power emission factor is lower than baseline emission factor of regional power grid of China, especially for central China, northwest China and south China revised electric power emission factor is about 40% lower than baseline emission factor of regional power grid of China. This is because hydroelectricity resources in these regions are abundant.
In theory we should cite the sources for the electricity inflow and outflow data for each province. However, interprovincial power dispatching is very complex. Limited by data availability, we assume the electricity of the province is for the use of the province’s priority. After that, the shortage will be dispatched from other provinces and the excess will be dispatched out of the province. Thus, from the perspective of consumption, CO2 emissions are measured as:
T C 2 = T C 1 + Q E D × δ e 2
where T C 2 is CO2 emissions from the perspective of consumption; Q E D is the amount of dispatched electricity; when electricity is dispatched out, Q E D is negative and when electricity is dispatched in, Q E D is positive; δ e 2 is revised electric power emission factor.

2.4. CO2 Emission Responsibility

For the purpose of revealing CO2 emissions responsibilities from different perspectives, production and consumption perspectives, we define:
Δ = T C 1 T C 2
If Δ > 0 , CO2 emissions responsibility from production perspective are overestimated, it indicates that the energy produced by these provinces is not entirely consumed locally, and they are energy exporting provinces; if Δ < 0 , they are underestimated.

2.5. Other Measuring Methods

To compare the difference of actual energy consumption CO2 emissions measured by different methods, we further select other methods for comparative analysis.
T C 3 = [ Q i ( total final consumption + heating consumption  ) × δ i + Q E × δ e 2 ]
T C 4 = [ Q i ( total final consumption + heating consumption  ) × δ i + Q E × δ e 1 ]
T C 5 = [ Q i ( r a w c o a l , c r u d e o i l , n a t r u a l g a s ) × δ i ]
where, T C 3 represents total CO2 emissions when revised electric power emission factors are used to calculate total consumed electricity CO2 emissions; T C 4 represents total CO2 emissions when China’s regional grid baseline emission factors are used to calculate total consumed electricity CO2 emissions; T C 5 represents CO2 emissions measured on the basis of primary energy consumption. Q E represents electricity consumption and δ e 1 represents China’s regional grid baseline emission factor.

3. Empirical Analysis

3.1. Data

We chose 30 provinces in mainland China as the sample of our study (excluding Tibet, Taiwan, Hong Kong and Macao). Data on the fossil fuel consumption, including “total final consumption”, “thermal power consumption” and “heating consumption” of 12 types of major fossil fuels, of each province is collected from the energy balance sheets of the China Energy Statistical Yearbook [26]. Electricity consumption and production data is also from China Energy Statistical Yearbook [26].

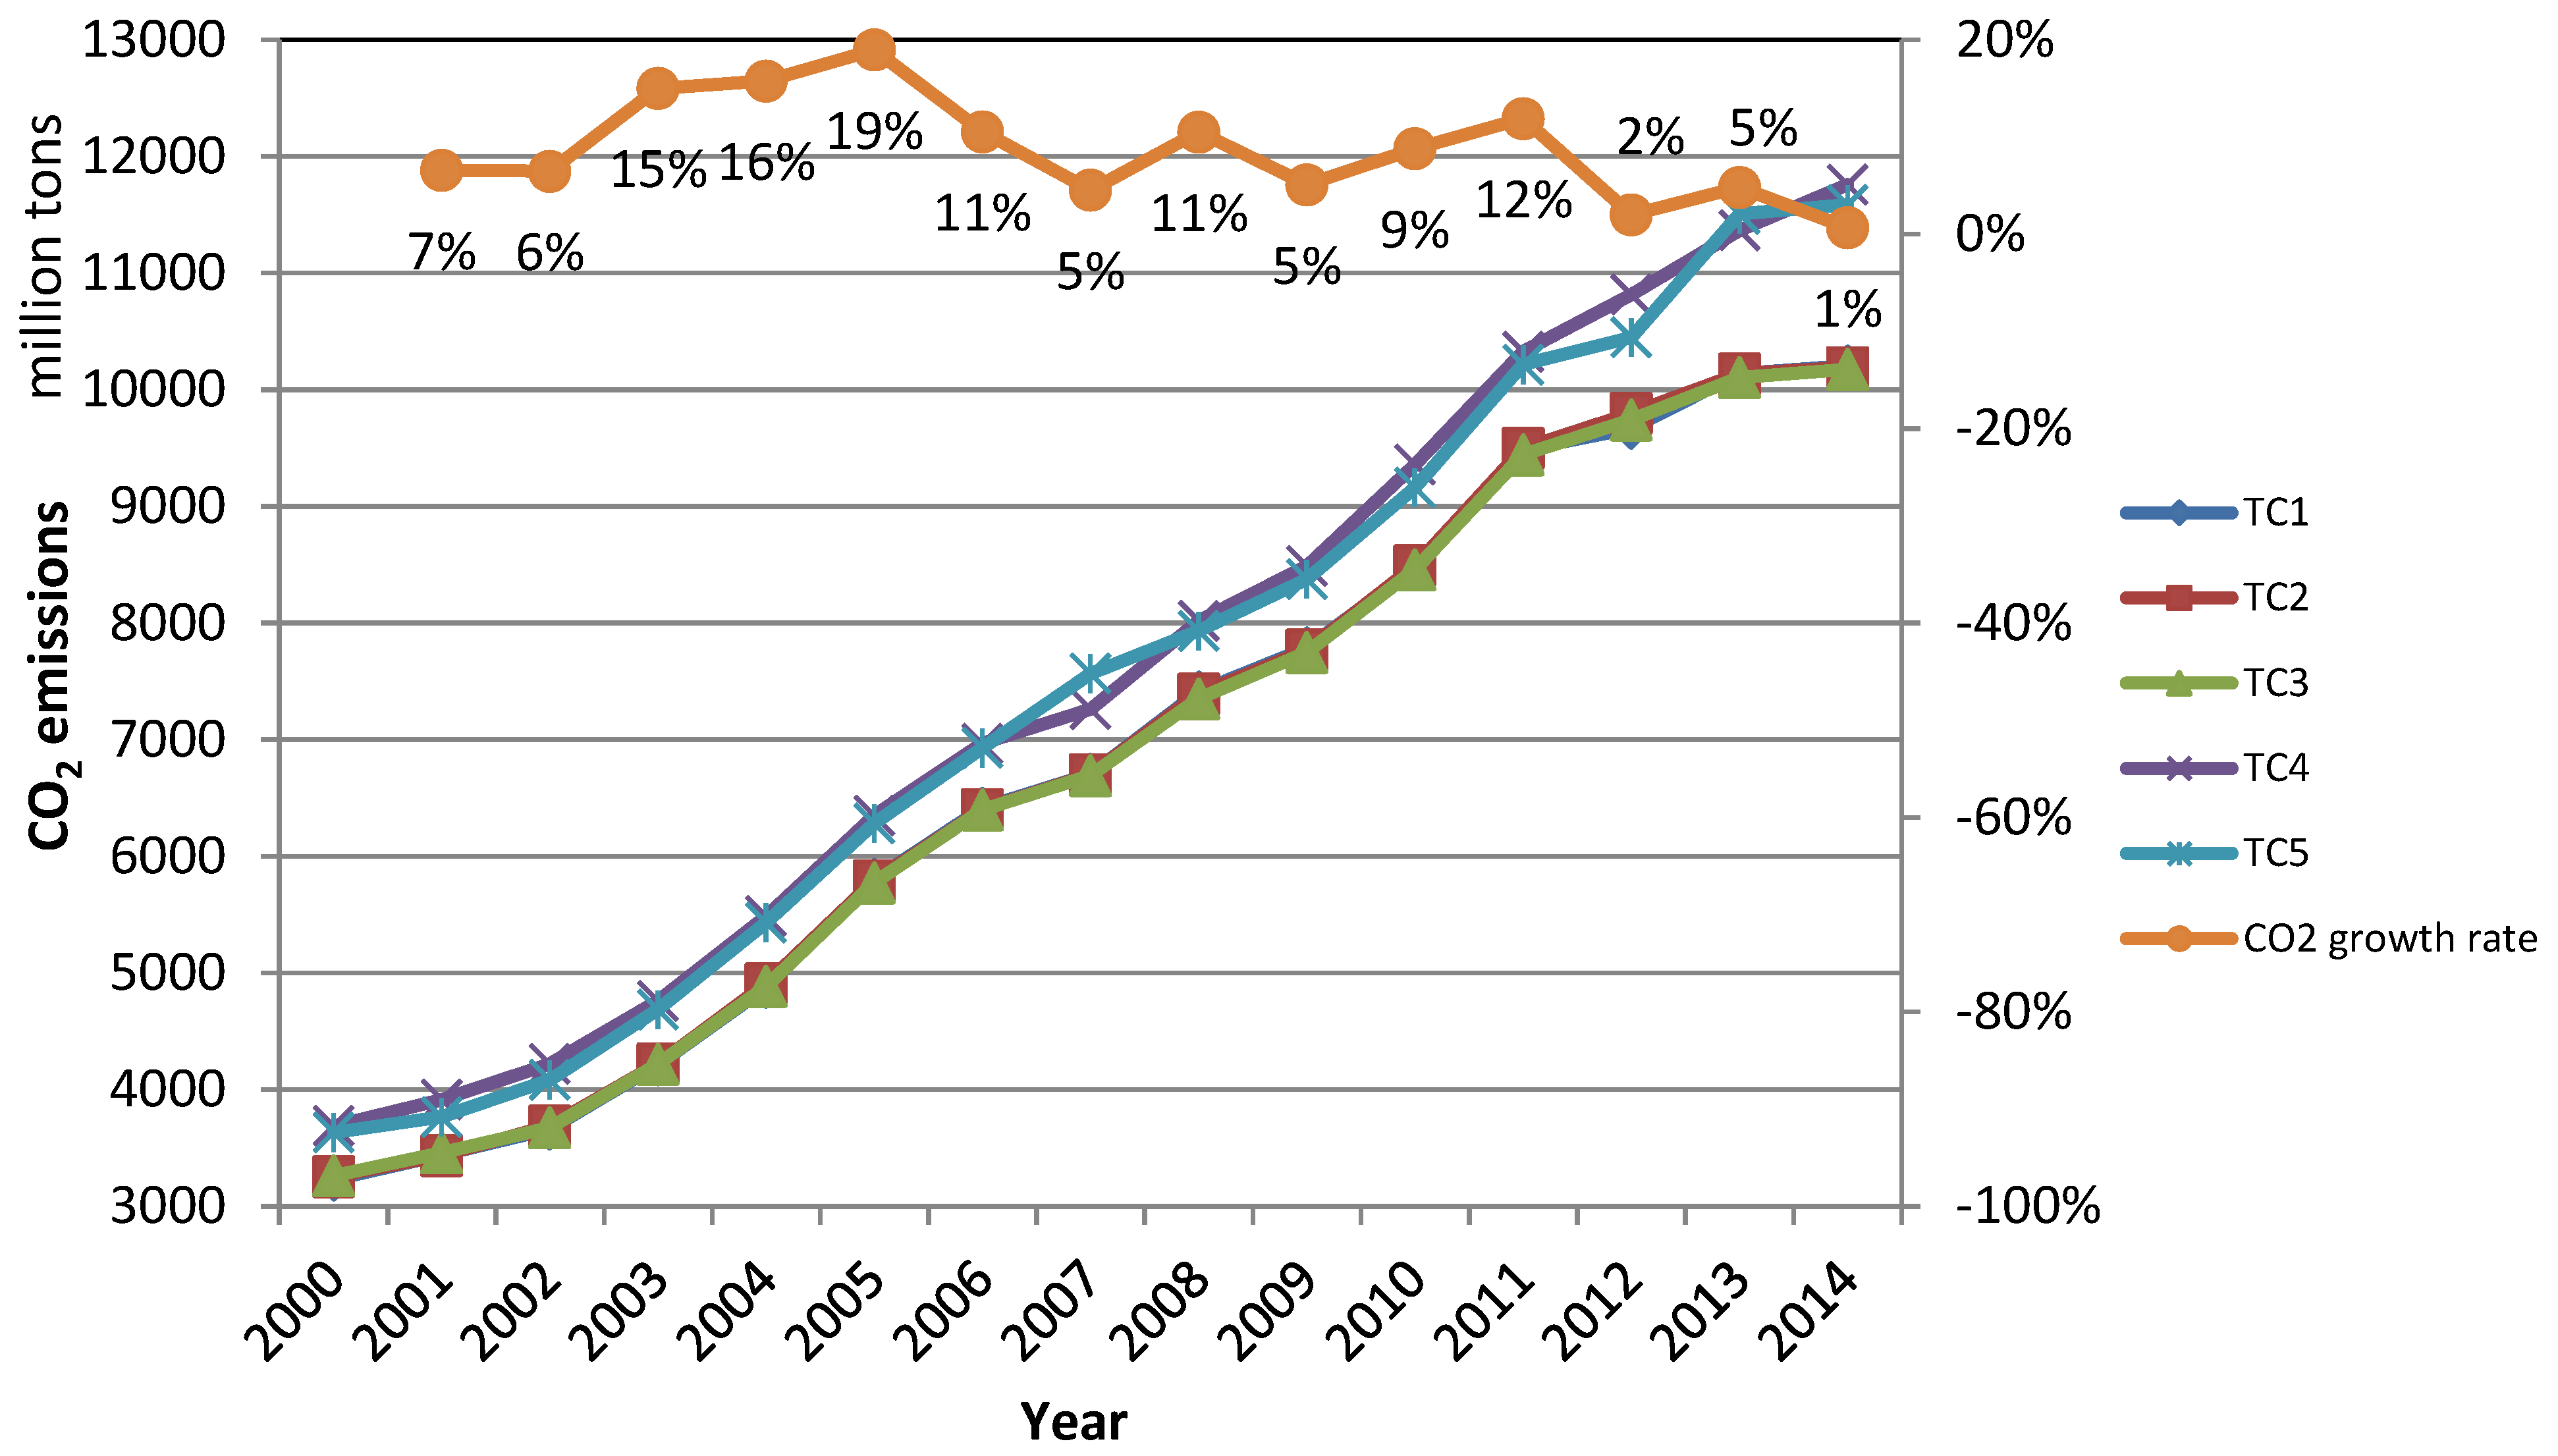
3.2. Overall National CO2 Emission Analysis

According to Figure 1, we can find that no matter from which perspectives the situation is considered, the amount of overall CO2 emissions of China rose from 2000 to 2014 with an annual growth rate of about 9%, from 3.6 billion tons in 2000 to more than 10 billion tons in 2014. Especially from 2000 to 2005, the CO2 emissions rose rapidly; after 2005, CO2 the emissions growth rate slowed down but the development trend fluctuated. T C 1 is energy consumption CO2 emissions from production perspective, and T C 2 is from consumption perspective. From Figure 1 we can see that, the gaps between T C 1 and T C 2 are small, about 0.5%, which indicates national CO2 emissions measured from the perspectives of production and consumption are approximately the same. Meanwhile, it also indicates the electric power emission factors revised by this paper are reasonable.
Total CO2 emissions measured by T C 4 and T C 5 are both about 10% higher than by T C 1 . The reason is in T C 4 all electricity consumption CO2 emissions are based on thermal electricity emission factors, no matter it is thermal electricity or hydroelectricity. Thus, national CO2 emissions will be overestimated. It further proves the revised regional electric power emission factors comply with actual situation better than China’s regional grid baseline emission factors when calculate electricity CO2 emissions. As for T C 5 , activity data is based on primary energy consumption. However, some types of energy such as “other petroleum products”, “other coked products” and coal gangues produced by the primary energy are not mainly used for combustion, so T C 5 overestimates the national CO2 emissions.

3.3. Interprovincial CO2 Emission Analysis of Different Measuring Methods

We adopt the principle: combination of consumption and responsibility. Therefore, in this part, we take T C 2 as the benchmark, and compare it with other methods. Table 4 comparatively shows difference of interprovincial energy consumption CO2 emissions of different measuring methods. CO2 emissions responsibilities of provinces are different based on different methods.
From electricity production perspective, according to Table 4 Column (7), Beijing, Tianjin, Hebei, Shanghai, Zhejiang, Jiangsu and Guangdong are free from CO2 emissions responsibilities of input electricity, which is underestimated. CO2 emissions of Beijing, Guangdong and Shanghai are underestimated by 29.5%, 7. 7% and 11.8%, respectively. On the contrary, CO2 emissions of Shanxi, Inner Mongolia, Hubei, Guizhou and Yunnan are overestimated by 13.0%, 19.6%, 13.4%, 13.8% and 9.5%, respectively.
When revised electric power emission factors are used to calculate total consumed electricity CO2 emissions, from Table 4 Column (8), we can find that, CO2 emissions of Fujian, Hubei, Guangxi, Sichuan and Qinghai will be overestimated. Hydroelectricity in these provinces is abundant, and gives priority for their own consumption. The actual electric power emission factors of these provinces are lower than the revised regional average electric power emission factors. Therefore, the assumption that “the electricity of the province is for the use of the province’s priority” is reasonable.
When China’s regional grid baseline emission factors are used to calculate total consumed electricity CO2 emissions, from Table 4 Column (9), it can be found that CO2 emissions of most provinces are higher than T C 2 .
If primary energy consumption data is used to measure CO2 emissions, according to Table 4 column (10), CO2 emissions of Shanxi, Inner Mongolia, Liaoning, Heilongjiang, Shandong, Shaanxi, Guizhou, Gansu and Xinjiang would be overestimated. As is the case with some secondary energy (e.g., electricity) the resources produced by primary energy are not combusted locally. However, CO2 emissions responsibilities are underestimated for Beijing, Shanghai, Zhejiang, Fujian and Guangdong.
From the above, it can be seen that, based on the principle of provinces bearing the responsibilities for their energy consumption, T C 2 is more reasonable to calculate interprovincial CO2 emissions.

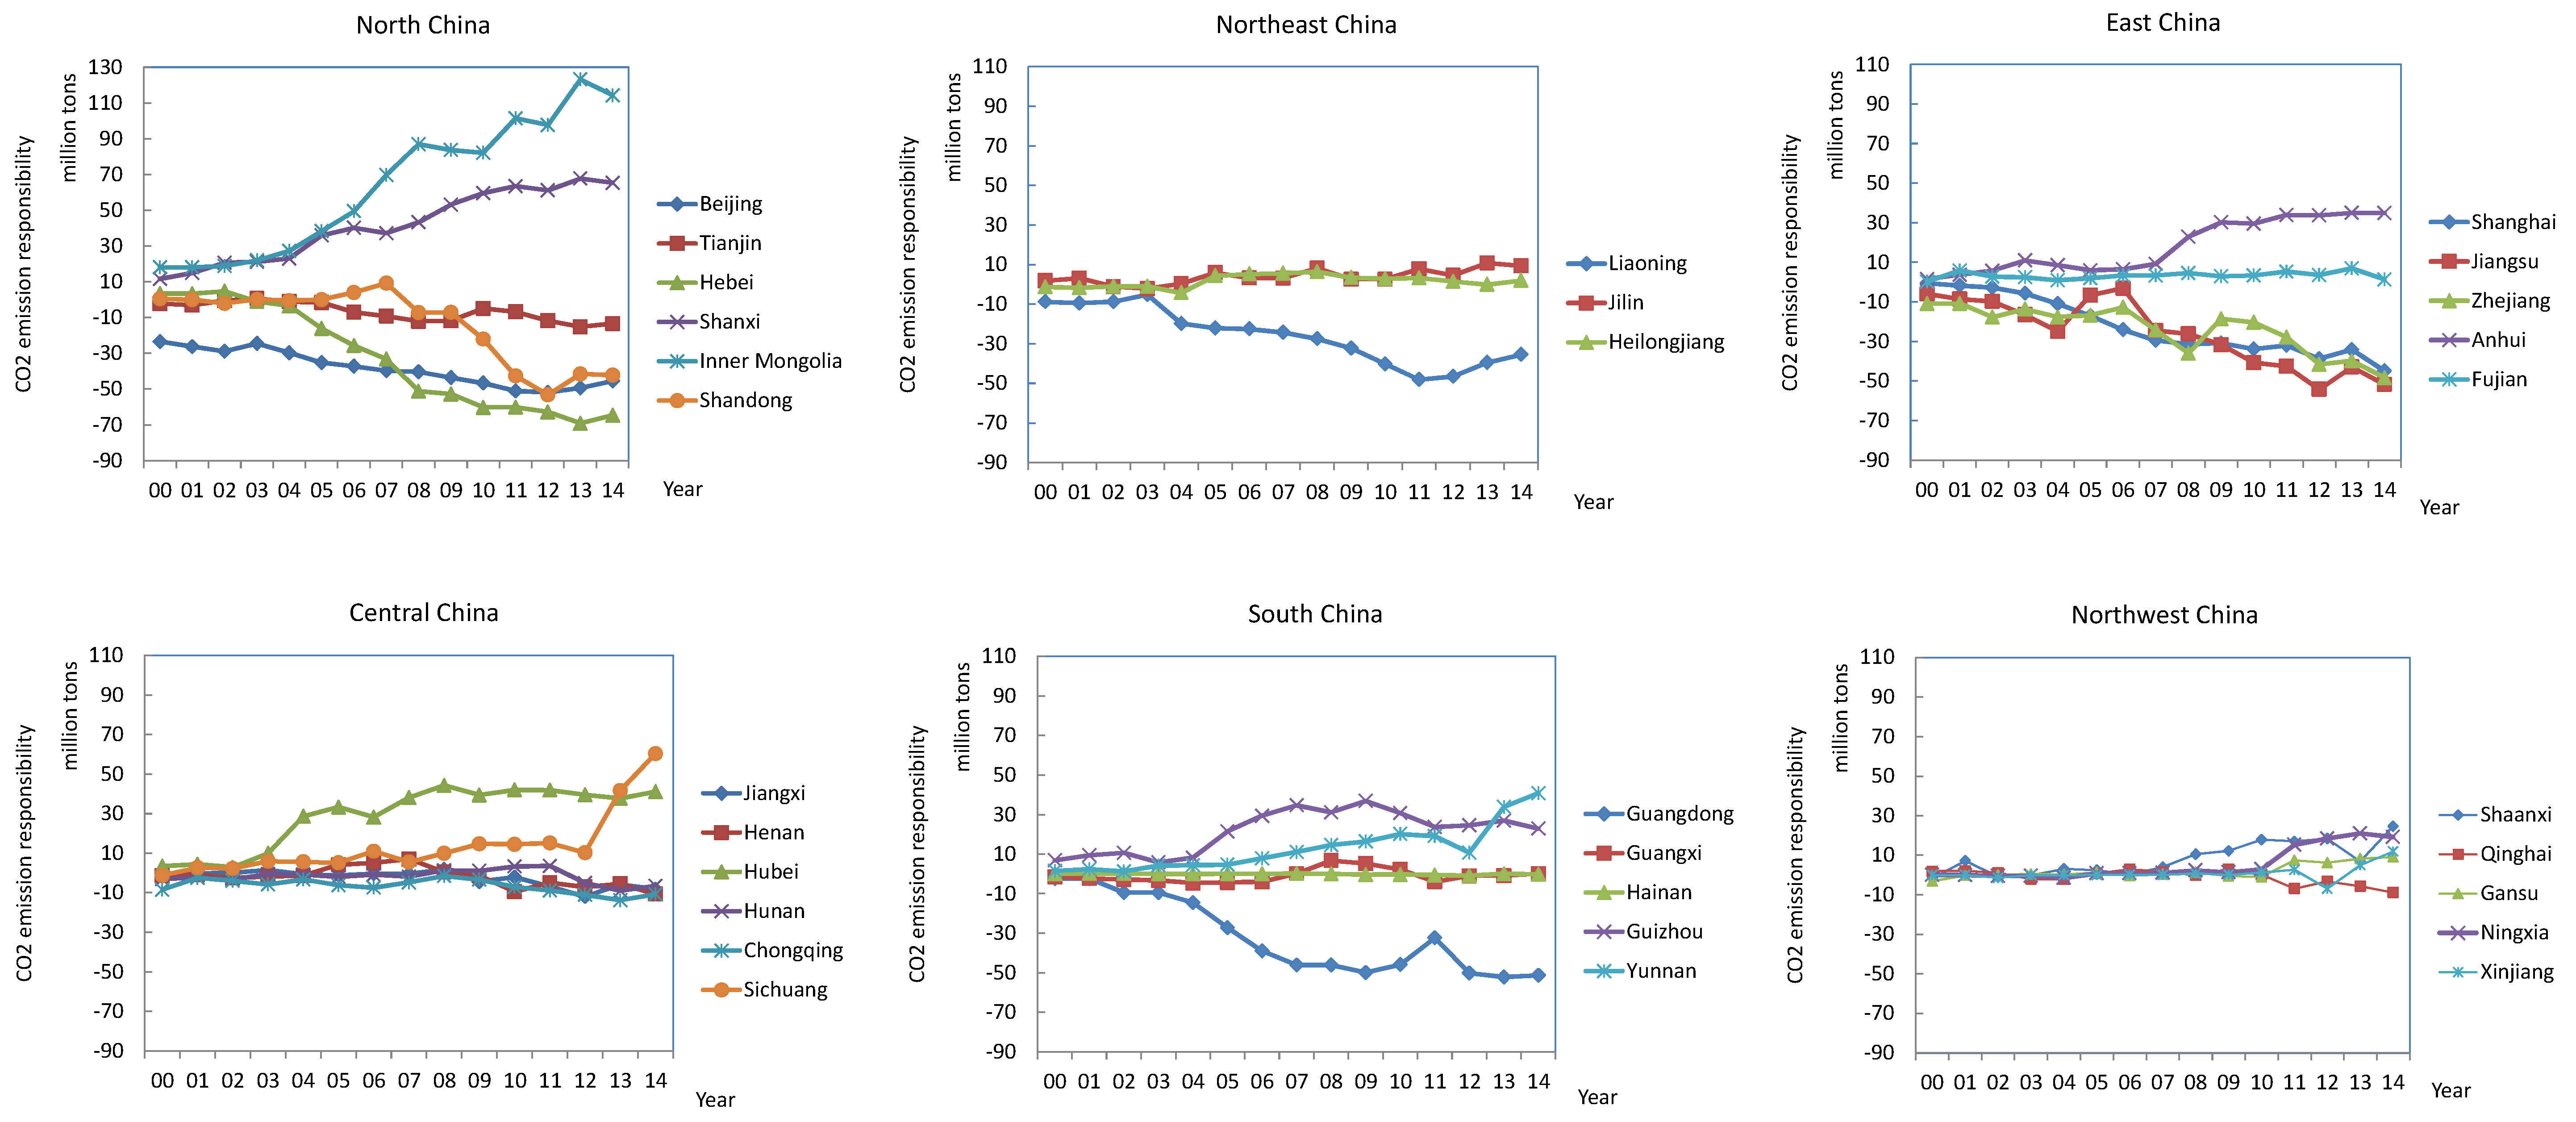
3.4. Interprovincial CO2 Emission Responsibility Analysis

Based on Formula (5) and according to Figure 2, from a production perspective, CO2 emissions of Beijing in North China are underestimated and the underestimated amount expands gradually, increasing from 22 million tons in 2000 to 45 million tons in 2014. CO2 emissions of Hebei and Shandong are also underestimated, the underestimated amount rises sharply after 2003 and 2009, reaching 64 and 42 million tons in 2014, respectively. CO2 emissions of Shanghai, Jiangsu and Zhejiang in Eastern China are also underestimated. Moreover, the underestimated amount expands year by year. CO2 emissions of Guangdong in the south are seriously underestimated, and the underestimated amount has an annual growth rate of 45%.
Meanwhile, CO2 emissions of Shanxi and Inner Mongolia in North China and Anhui and Fujian in East China are greatly overestimated. CO2 emissions of Hubei and Sichuan in Central China and Guizhou and Yunnan in south China are overestimated and the overestimated amount expands year by year.
From above, it can be found that, if we do not consider the transfer of CO2 emissions due to electricity dispatching, for provinces with overestimated CO2 emissions, the overestimated amount will become greater and greater. For underestimated provinces, the underestimated amount will also increase rapidly. CO2 emissions responsibilities become increasingly unfair. The reason for this is that interprovincial electric power dispatching in China has an increasing trend year by year. If we measure interprovincial CO2 emissions based on a production perspective, electricity output provinces will undertake increasingly heavy CO2 emissions reduction responsibilities which do not conform to actual consumption.

4. Conclusions and Policy Enlightenments

We have measured energy-related CO2 emissions of provinces in China, especially considering electric power dispatching from both electricity production and consumption perspectives. The obtained results reveal that: (i) Based on the energy balance sheet, the CO2 emissions of the provincial energy consumption are more favorable than the primary energy consumption method to determine the CO2 emissions responsibilities of the provinces; (ii) The revised electric power emission factor is more in line with the actual situation of China’s regional power grid. The assumption that “the electricity of the province is for the use of the province’s priority” can better reflect the characteristics of China’s regional grid electricity dispatch; (iii) No matter from which perspective, the overall CO2 emission of China are almost the same amount. However, interprovincial CO2 emissions differ greatly from different perspectives. From the production perspective, CO2 emissions of Beijing, Tianjin, Hebei, Shandong, Heilongjiang, Shanghai, Zhejiang, Jiangsu and Guangdong are underestimated and the underestimated amount increases gradually. CO2 emissions of Shanxi, Inner Mongolia, Hubei, Sichuan, Guizhou and Shaanxi are overestimated and the overestimated amount has a tendency to expand.
Different methods for CO2 emissions accounting have their own features. The results calculated by different methods are very different, because of the different level of activity data and different electric power emission factors. Most electricity production provinces are located in middle and west area with undeveloped economy, and most electricity input provinces are economically developed areas. Economically less-developed areas should not pay for pollution of economic developed areas. Therefore, in order to reflect the principle “combination of consumption and responsibility”, the following items may be taken into full consideration when measuring CO2 emissions responsibilities of various provinces: (1) It is better to use comprehensive activity data with classification of fuel variety rather than primary energy consumption data; (2) Secondary energy dispatching should be taken into full consideration when measuring interprovincial CO2 emissions. This is because it will cause interprovincial CO2 emissions transfer so that provinces bear the responsibilities for their energy consumption, rather than escape the responsibilities and transfer them to provinces that produced secondary energy. Due to the availability of data, this paper only considers CO2 emissions transfer triggered by electric power dispatching. CO2 emissions transfer in the production process of other secondary energy will be one of the follow-up research focusses of this paper; (3) Develop power emission factors in line with the actual situation of the provinces. For revised electric power emission factors in this paper, we comprehensively consider hydroelectricity and thermal electricity produced in the regional grid, which is more practical than China’s regional grid baseline emission factors. However, this assumes that electric power produced by the provinces is a priority for their own consumption and electric power is dispatched in the scope of the regional grid. Actual conditions may be much more complicated than this: electric power dispatch is changing all the time. A province can dispatch out electric power to other provinces at a certain moment, the next moment may need to input electric power from other provinces. Moreover, electricity dispatching is not limited in the regional grid. Electric power is more and more important to the development of the economy, and the amount of interprovincial electric power dispatching is very large and complex. Therefore, it is important to determine reasonable electric power emission factors. This is also one of the follow-up key points of this paper.

Acknowledgments

We express our gratitude to the National Natural Science Foundation of China (71303174), Soft Science Foundation of Guangdong (2014A070703062), Social Science Foundation of Guangdong (GD14XYJ21), Science and Technology Bureau of Jiangmen city (JK[2014]145), Social Science Foundation of Jiangmen city (JM2014C37), Science Foundation for Young Teachers of Wuyi University (2014zk02), Guangdong key base of humanities and social science: Enterprise Development Research Institute and Institute of Resource, Environment and Sustainable Development Research, and Guangzhou key base of humanities and social science: Centre for Low Carbon Economic Research for funding supports.

Author Contributions

Xueping Tao performed research, analyzed the data and wrote the paper. Ping Wang analyzed the data as well. Bangzhu Zhu contributed to analysis tools and revised the manuscript.

Conflicts of Interest

The authors declare no conflict of interest.

References

  1. Xinhuanet. UN Climate Chief Hails China-U.S. Announcement on Climate Change. Available online: http://news.xinhuanet.com/english/china/2014-11/13/c_133785521.htm (accessed on 30 March 2016).
  2. Zhou, P.; Zhou, X.; Fan, L.W. On estimating shadow prices of undesirable outputs with efficiency models: A literature review. Appl. Energy 2014, 130, 799–806. [Google Scholar] [CrossRef]
  3. Yang, L.; Wang, K.L. Regional differences of environmental efficiency of China’s energy utilization and environmental regulation cost based on provincial panel data and DEA method. Math. Comp. Model. Dyn. 2013, 58, 1074–1083. [Google Scholar] [CrossRef]
  4. Wang, K.; Wei, Y.M. China’s regional industrial energy efficiency and carbon emissions abatement costs. Appl. Energy 2014, 130, 617–631. [Google Scholar] [CrossRef]
  5. Zhang, N.; Choi, Y. A note on the evolution of directional distance function and its development in energy and environmental studies 1997–2013. Renew. Sust. Energy Rev. 2014, 33, 50–59. [Google Scholar] [CrossRef]
  6. Wang, Q.W.; Chiu, Y.H.; Chiu, C.M. Driving factors behind carbon dioxide emissions in China: A modified production-theoretical decomposition analysis. Energy Econ. 2015, 51, 252–260. [Google Scholar] [CrossRef]
  7. Li, K.; Lin, B.Q. Impacts of urbanization and industrialization on energy consumption/CO2 emissions: Does the level of development matter? Renew. Sust. Energy Rev. 2015, 52, 1107–1122. [Google Scholar] [CrossRef]
  8. Lin, B.Q.; Moubarak, M.; Ouyang, X.L. Carbon dioxide emissions and growth of the manufacturing sector: Evidence for China. Energy 2014, 76, 830–837. [Google Scholar] [CrossRef]
  9. Li, Y.M.; Zhao, R.; Liu, T.S.; Zhao, J.F. Does urbanization lead to more direct and indirect household carbon dioxide emissions? Evidence from China during 1996–2012. J. Clean Prod. 2015, 102, 103–114. [Google Scholar] [CrossRef]
  10. Mi, Z.F.; Pan, S.Y.; Yu, H.; Wei, Y.M. Potential impacts of industrial structure on energy consumption and CO2 emission: A case study of Beijing. J. Clean Prod. 2015, 103, 455–462. [Google Scholar] [CrossRef]
  11. Zhang, J.; Wang, C.M.; Liu, L.; Guo, H.; Liu, G.D.; Li, Y.W.; Deng, S.H. Investigation of carbon dioxide emission in China by primary component analysis. Sci. Total Environ. 2014, 472, 239–247. [Google Scholar] [CrossRef] [PubMed]
  12. Xiang, N.; Xu, F.; Sha, J.H. Simulation Analysis of China’s Energy and Industrial Structure Adjustment Potential to Achieve a Low-carbon Economy by 2020. Sustainability 2013, 5, 5081–5099. [Google Scholar] [CrossRef]
  13. Xiao, F.; Hu, Z.; Wang, K.; Fu, P. Spatial Distribution of Energy Consumption and Carbon Emission of Regional Logistics. Sustainability 2015, 7, 9140–9159. [Google Scholar] [CrossRef]
  14. Chi, Y.Y.; Guo, Z.Q.; Zheng, Y.H.; Zhang, X.P. Scenarios Analysis of the Energies’ Consumption and Carbon Emissions in China Based on a Dynamic CGE Model. Sustainability 2014, 6, 487–512. [Google Scholar] [CrossRef]
  15. Intergovernmental Panel on Climate Change. The 2006 IPCC Guidelines for National Greenhouse Gas Inventories. Available online: http://www.ipcc-nggip.iges.or.jp/public/2006gl/index.html (accessed on 30 March 2016).
  16. Long, X.L.; Naminse, E.Y.; Du, J.G; Zhuang, J.C. Nonrenewable energy, renewable energy, carbon dioxide emissions and economic growth in China from 1952 to 2012. Renew. Sust. Energy Rev. 2015, 52, 680–688. [Google Scholar] [CrossRef]
  17. Zha, Y.; Zhao, L.L.; Bian, Y.W. Measuring regional efficiency of energy and carbon dioxide emissions in China: A chance constrained DEA approach. Comput. Oper. Res. 2016, 66, 351–361. [Google Scholar] [CrossRef]
  18. Zhao, X.T.; Wesley, B.J.; Lacombe, D.J. Province-Level convergence of China’s carbon dioxide emissions. Appl. Energy 2015, 150, 286–295. [Google Scholar] [CrossRef]
  19. Xu, B.; Lin, B.Q. Factors affecting carbon dioxide (CO2) emissions in China’s transport sector: A dynamic nonparametric additive regression model. J. Clean Prod. 2015, 101, 311–322. [Google Scholar] [CrossRef]
  20. Wang, J.; Zhang, K.Z. Convergence of carbon dioxide emissions in different sectors in China. Energy 2014, 65, 605–611. [Google Scholar] [CrossRef]
  21. Wang, H.K.; Zhang, Y.X.; Lu, X.; Nielsen, C.P.; Bi, J. Understanding China’s carbon dioxide emissions from both production and consumption perspectives. Renew. Sust. Energy Rev. 2015, 52, 189–200. [Google Scholar] [CrossRef]
  22. Song, D.Y.; Xu, A. Regional difference and influential factors of china’s urban carbon emissions. China Popul. Resour. Environ. 2011, 21, 8–14. (In Chinese) [Google Scholar]
  23. Zhou, S.D.; Zhao, M.Z.; Wang, C.X.; Li, B. Calculation of carbon dioxide emissions considering secondary energy deployment among provinces in China. China Popul. Resour. Environ. 2012, 22, 69–75. (In Chinese) [Google Scholar]
  24. Liu, Y.; Xiao, H.; Zhang, N. Industrial Carbon Emissions of China’s Regions: A Spatial Econometric Analysis. Sustainability 2016, 8, 210. [Google Scholar] [CrossRef]
  25. Li, L.; Wang, J.J. The Effects of Coal Switching and Improvements in Electricity Production Efficiency and Consumption on CO2 Mitigation Goals in China. Sustainability 2015, 7, 9540–9559. [Google Scholar] [CrossRef]
  26. National Bureau of Statistics PR China. China Energy Statistical Yearbook, 2000–2015; China Statistics Press: Beijing, China, 2004–2016. (In Chinese)
  27. Analysis of the Current Situation of City Heating Industry. Available online: http://finance.glinfo.com/12/1115/12/C72E318E8E751202.html (accessed on 30 March 2016). (In Chinese)
  28. 2014 Baseline Emission Factors for Regional Power Grids in China. Available online: http://cdm.ccchina.gov.cn/archiver/cdmcn/UpFile/Files/Default/20150204155537627092.pdf (accessed on 24 May 2016). (In Chinese)
  29. 2013 Baseline Emission Factors for Regional Power Grids in China. Available online: http://cdm.ccchina.gov.cn/archiver/cdmcn/UpFile/Files/Htmleditor/201310/20131024151336847.pdf (accessed on 24 May 2016). (In Chinese)
  30. 2012 Baseline Emission Factors for Regional Power Grids in China. Available online: http://cdm.ccchina.gov.cn/WebSite/CDM/UpFile/File2975.pdf (accessed on 24 May 2016). (In Chinese)
  31. 2011 Baseline Emission Factors for Regional Power Grids in China. Available online: http://cdm.ccchina.gov.cn/WebSite/CDM/UpFile/File2720.pdf (accessed on 24 May 2016). (In Chinese)
  32. 2010 Baseline Emission Factors for Regional Power Grids in China. Available online: http://cdm.ccchina.gov.cn/WebSite/CDM/UpFile/File2552.pdf (accessed on 24 May 2016). (In Chinese)
  33. 2009 Baseline Emission Factors for Regional Power Grids in China. Available online: http://cdm.ccchina.gov.cn/WebSite/CDM/UpFile/File2333.pdf (accessed on 24 May 2016). (In Chinese)
  34. 2008 Baseline Emission Factors for Regional Power Grids in China. Available online: http://cdm.ccchina.gov.cn/WebSite/CDM/UpFile/2008/20081230102527637.pdf (accessed on 24 May 2016). (In Chinese)
  35. 2007 Baseline Emission Factors for Regional Power Grids in China. Available online: http://cdm.ccchina.gov.cn/WebSite/CDM/UpFile/File1364.pdf (accessed on 24 May 2016). (In Chinese)
  36. Baseline Emission Factors for Regional Power Grids in China. Available online: http://cdm.ccchina.gov.cn/WebSite/CDM/UpFile/2006/2006121591135575.pdf (accessed on 24 May 2016). (In Chinese)
Figure 1. Energy Consumption CO2 Emissions of China (2000–2014).
Sustainability 08 00506 g001
Figure 2. CO2 emissions responsibility of each province ( T C 1 T C 2 ).
Sustainability 08 00506 g002
Table 1. CO2 emission factors of 12 types of major energy.
ItemCO2 Emission FactorsItemCO2 Emission Factors
raw coal1.98 t/tliquefied natural gas2.84 t/t
cleaned coal2.49 t/tcrude oil3.10 t/t
other washed coal0.79 t/tgasoline3.18 t/t
coal briquette1.72 t/tkerosene3.15 t/t
coke3.02 t/tdiesel3.18 t/t
coke oven gas7.42 t/(104 m3)fuel oil3.13 t/t
natural gas21.84 t/(104 m3)liquefied petroleum gas2.98 t/t
Note: CO2 emission factors are calculated by the conversion factor for the fuel to energy units (TJ) on a net calorific value basis in the China Energy Statistical Yearbooks [26] and carbon content referred by IPCC [15].
Table 2. China’s regional grid baseline emission factors. Unit: (tCO2/MWh).
Regions2003–20052004–20062005–20072006–20082007–20092008–20102009–20112010–2012
North 1.12081.11691.00690.99140.98031.00211.03021.058
Northeast 1.24041.25611.12931.11091.08521.09351.1121.1281
East0.94210.9540.88250.85920.83670.82440.810.8095
Central1.28991.27831.12551.08711.02970.99440.97790.9724
Northwest1.12571.12251.02460.99471.00010.99130.9720.9578
South 1.01191.06080.99870.97620.94890.93440.92230.9183
Note: Data on China’s regional grid baseline emission factors are from China’s clean development mechanism website: http://cdm.ccchina.gov.cn/ [28,29,30,31,32,33,34,35,36].
Table 3. Revised electric power emission factors. Unit: (tCO2/MWh).
Regions2000 2001 2002 2003 2004 2005 2006 2007
North 0.979 0.984 0.970 0.911 0.971 0.984 0.938 0.904
Northeast 0.856 0.922 1.039 1.037 1.082 1.072 1.055 0.995
East0.965 0.946 0.761 0.979 0.940 0.904 0.894 0.882
Central0.607 0.597 0.630 0.650 0.719 0.665 0.655 0.637
Northwest0.754 0.697 0.766 0.762 0.811 0.749 0.752 0.749
South 0.582 0.600 0.587 0.643 0.594 0.690 0.725 0.697
Regions2008 2009 2010 2011 20122013 2014
North 0.903 0.877 0.863 0.915 0.8880.855 0.793
Northeast 1.006 0.991 0.959 0.979 0.9600.908 0.907
East0.862 0.822 0.806 0.820 0.8300.778 0.778
Central0.575 0.577 0.589 0.659 0.5930.623 0.566
Northwest0.725 0.718 0.705 0.709 0.6960.676 0.622
South 0.585 0.586 0.557 0.543 0.4890.492 0.399
Note: Calculation is based on Formula (3) and data from the China Statistical Yearbook and the China Energy Statistical Yearbook from 2000 to 2015 [26].
Table 4. Average Comparison of Interprovincial Energy Consumption CO2 Emissions by Different Measuring Methods (2000–2014). Unit: Million tons.
Provinces T C 1 T C 2 T C 3 T C 4 T C 5 T C 1 T C 2 T C 2 T C 3 T C 2 T C 2 T C 4 T C 2 T C 2 T C 5 T C 2 T C 2
(1)(2)(3)(4)(5)(6)(7)(8)(9)(10)
Beijing91 129 134 144 92 −29.5%3.3%11.0%−29.2%
Tianjin116 123 124 131 116 −5.4%1.0%7.2%−5.7%
Hebei530 563 559 590 487 −5.8%−0.6%4.9%−13.5%
Shanxi359 318 315 333 654 13.0%−0.9%4.8%105.7%
Inner Mongolia386 323 276 294 429 19.6%−14.4%−8.8%32.9%
Shandong579 592 592 631 686 −2.3%0.0%6.5%15.8%
Liaoning343 369 372 396 457 −7.1%0.8%7.1%23.7%
Jilin174 170 164 173 184 2.4%−3.3%1.5%8.2%
Heilongjiang196 194 189 201 262 0.9%−2.5%3.3%34.8%
Shanghai169 191 196 196 167 −11.8%2.2%2.6%−12.5%
Jiangsu460 486 488 490 449 −5.4%0.4%0.9%−7.7%
Zhejiang282 305 334 336 287 −7.8%9.5%10.0%−6.2%
Anhui223 205 204 204 233 8.9%−0.7%−0.3%13.8%
Fujian155 152 180 181 135 2.1%18.5%19.1%−10.9%
Jiangxi115 118 108 132 109 −2.3%−8.8%12.0%−7.5%
Henan396 398 338 420 427 −0.5%−15.2%5.3%7.1%
Hubei251 222 255 302 228 13.1%15.2%36.2%2.8%
Hunan202 204 208 249 193 −0.9%2.1%22.1%−5.2%
Chongqing110 116 115 137 101 −5.7%−1.3%17.9%−13.0%
Sichuan224 211 246 301 213 6.4%16.6%42.7%0.9%
Guangdong381 413 389 533 347 −7.7%−5.7%29.1%−15.9%
Guangxi123 124 130 163 104 −0.8%4.4%31.1%−16.0%
Hainan25 25 23 29 32 −0.7%−7.1%15.3%27.0%
Guizhou177 155 146 177 198 13.8%−6.3%13.9%27.3%
Yunnan148 135 147 183 141 9.5%8.5%35.2%4.3%
Shaanxi169 161 151 168 244 5.0%−6.1%4.3%51.3%
Qinghai29 30 44 52 33 −3.6%46.6%74.3%9.5%
Gansu108 106 112 128 131 1.8%5.6%20.5%23.7%
Ningxia89 83 74 84 104 6.4%−11.7%1.2%24.7%
Xinjiang158 157 147 162 200 0.5%−6.3%3.5%27.5%

