
An Optimization System for Concrete Life Cycle Cost and Related CO2 Emissions


Abstract
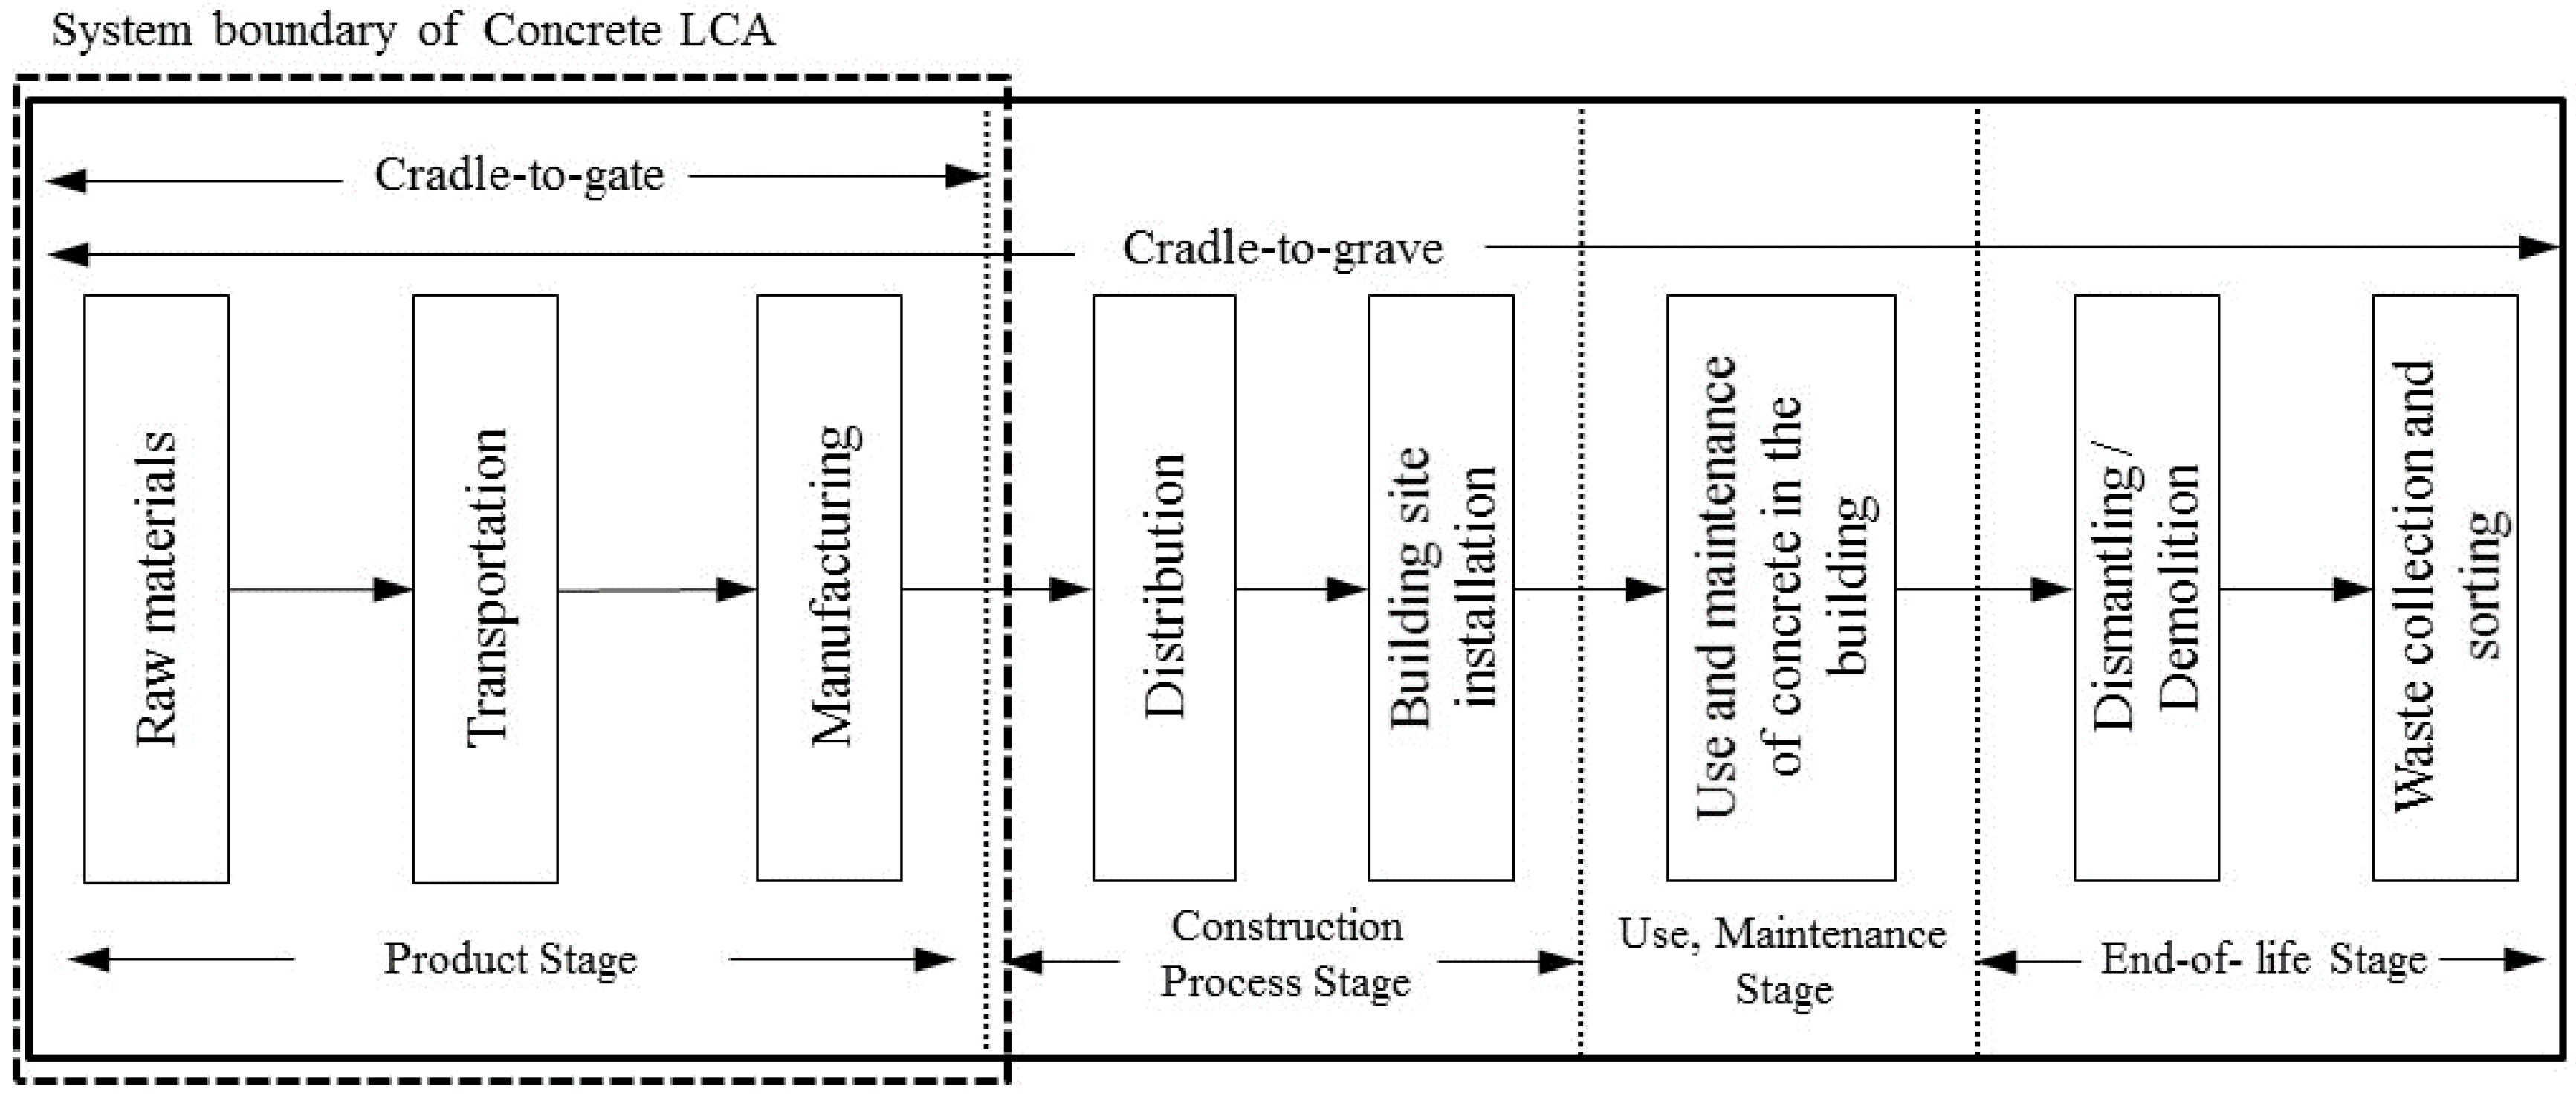
:1. Introduction
2. Review of Life Cycle Assessment Programs
3. Development of an Optimization System
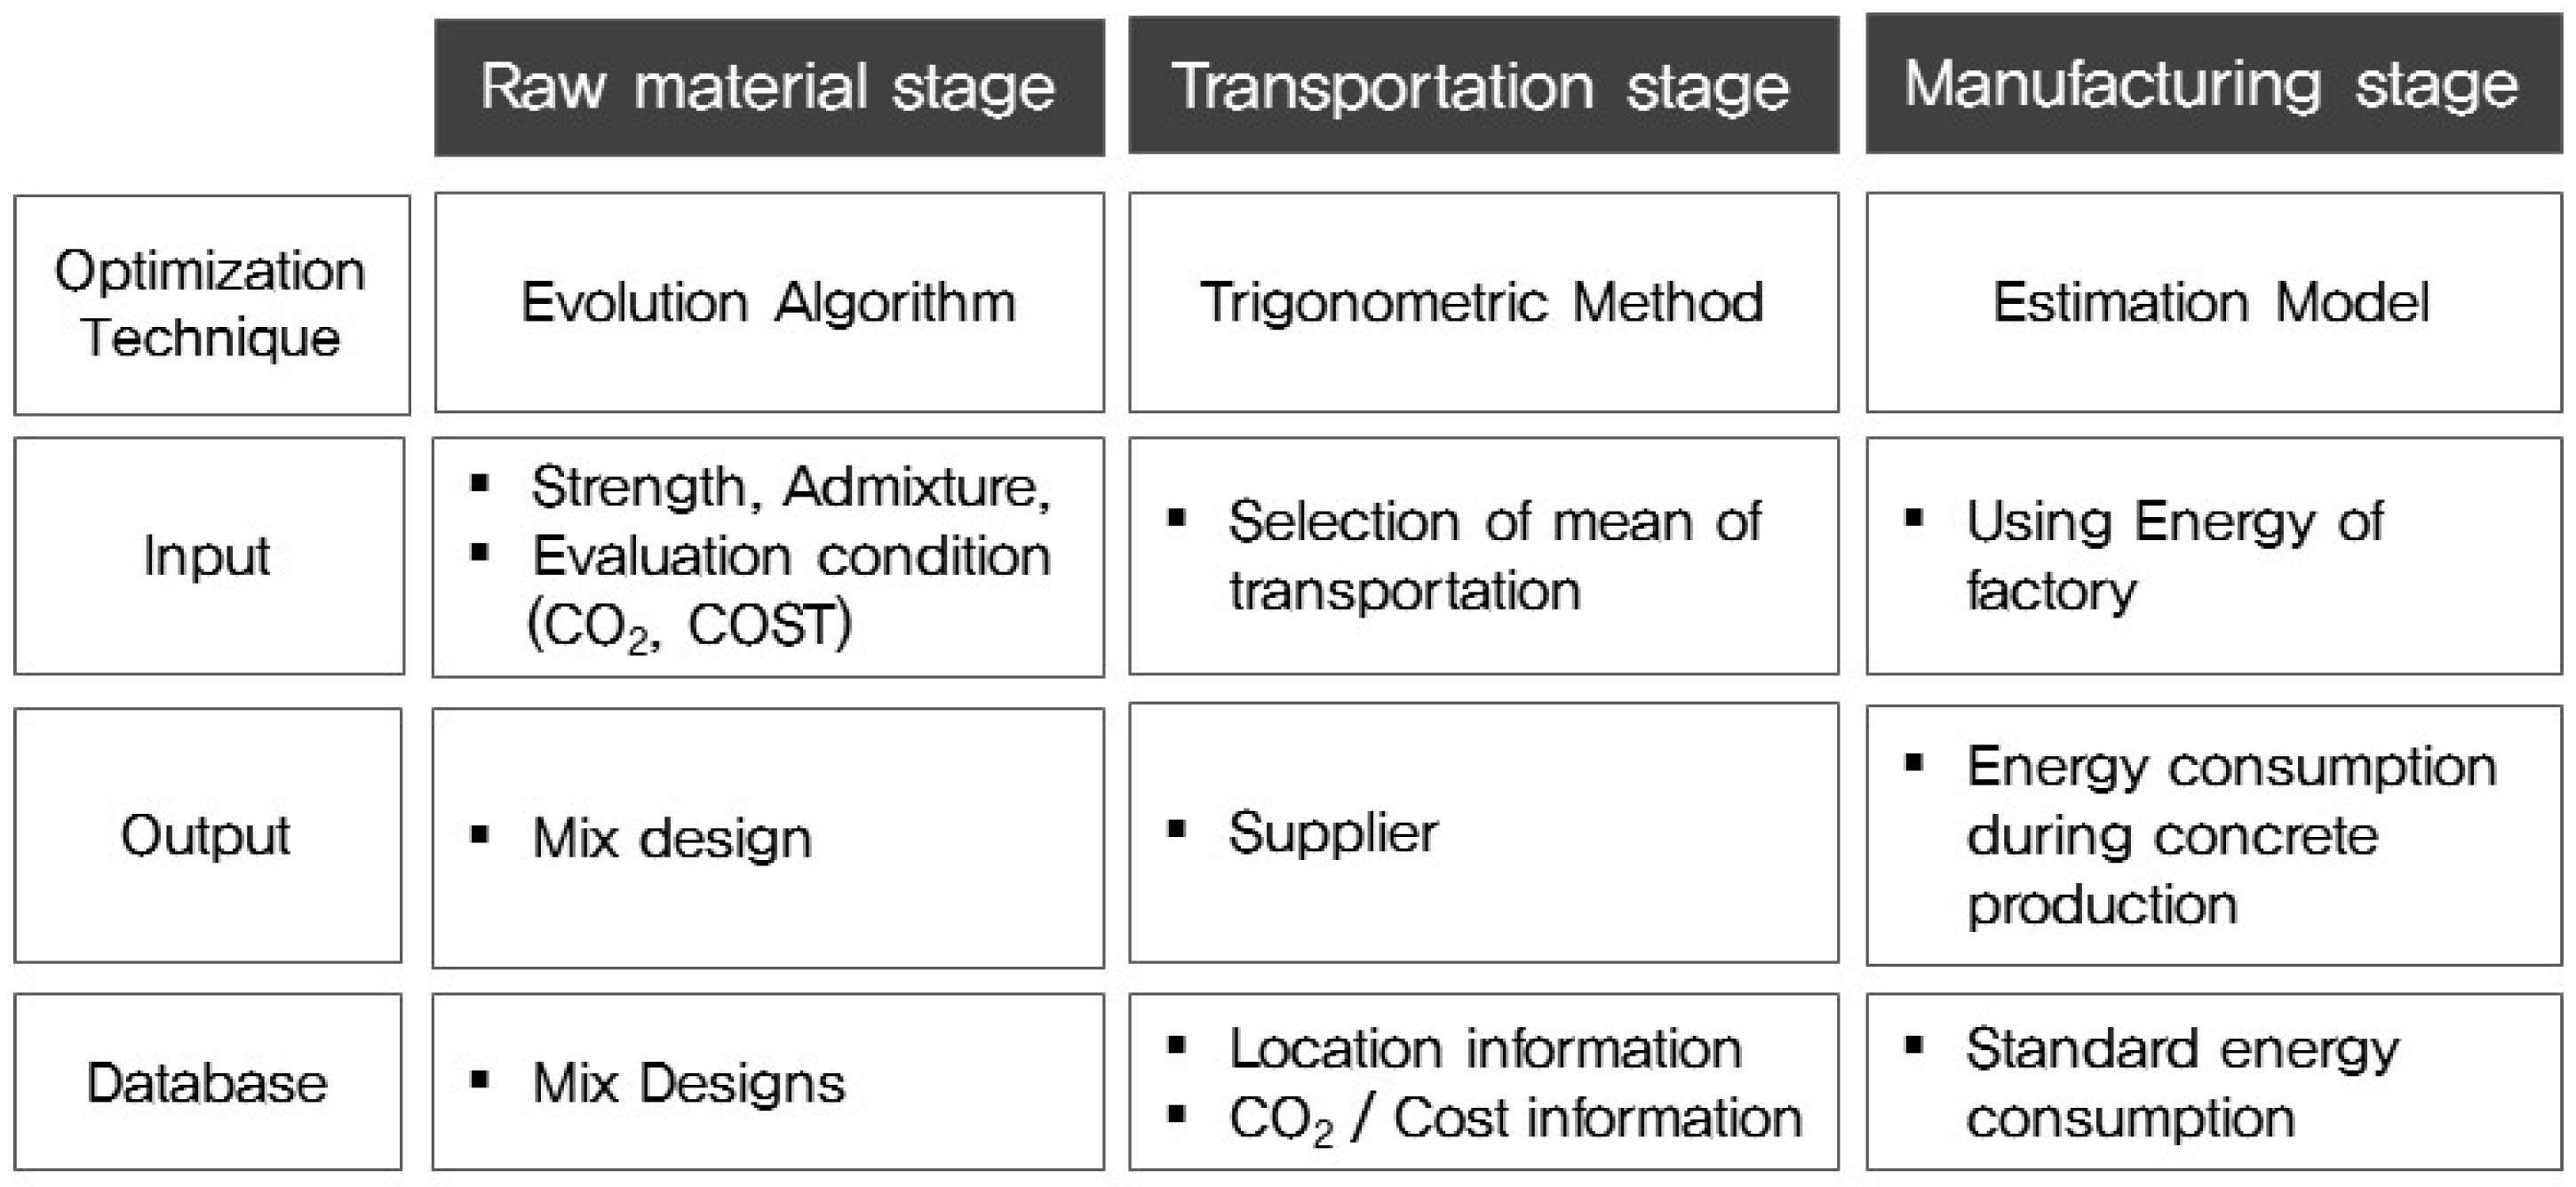
3.1. Characteristics of the Optimization System
3.1.1. Raw Material Stage
(i = 1: cement, 2: aggregate, 3: admixture, 4: water)
(i = 1: cement, 2: aggregate, 3: admixture, 4: water)
3.1.2. Transportation Stage
(i = 1: cement, 2: coarse aggregate, 3: fine aggregate, 4: admixture)
(i = 1: cement, 2: coarse aggregate, 3: fine aggregate, 4: admixture)
3.1.3. Manufacturing Stage
(i = 1: electricity usage, 2: oil usage, 3: water usage)
(i = 1: electricity usage, 2: oil usage, 3: water usage)
3.2. Application of Optimization Techniques
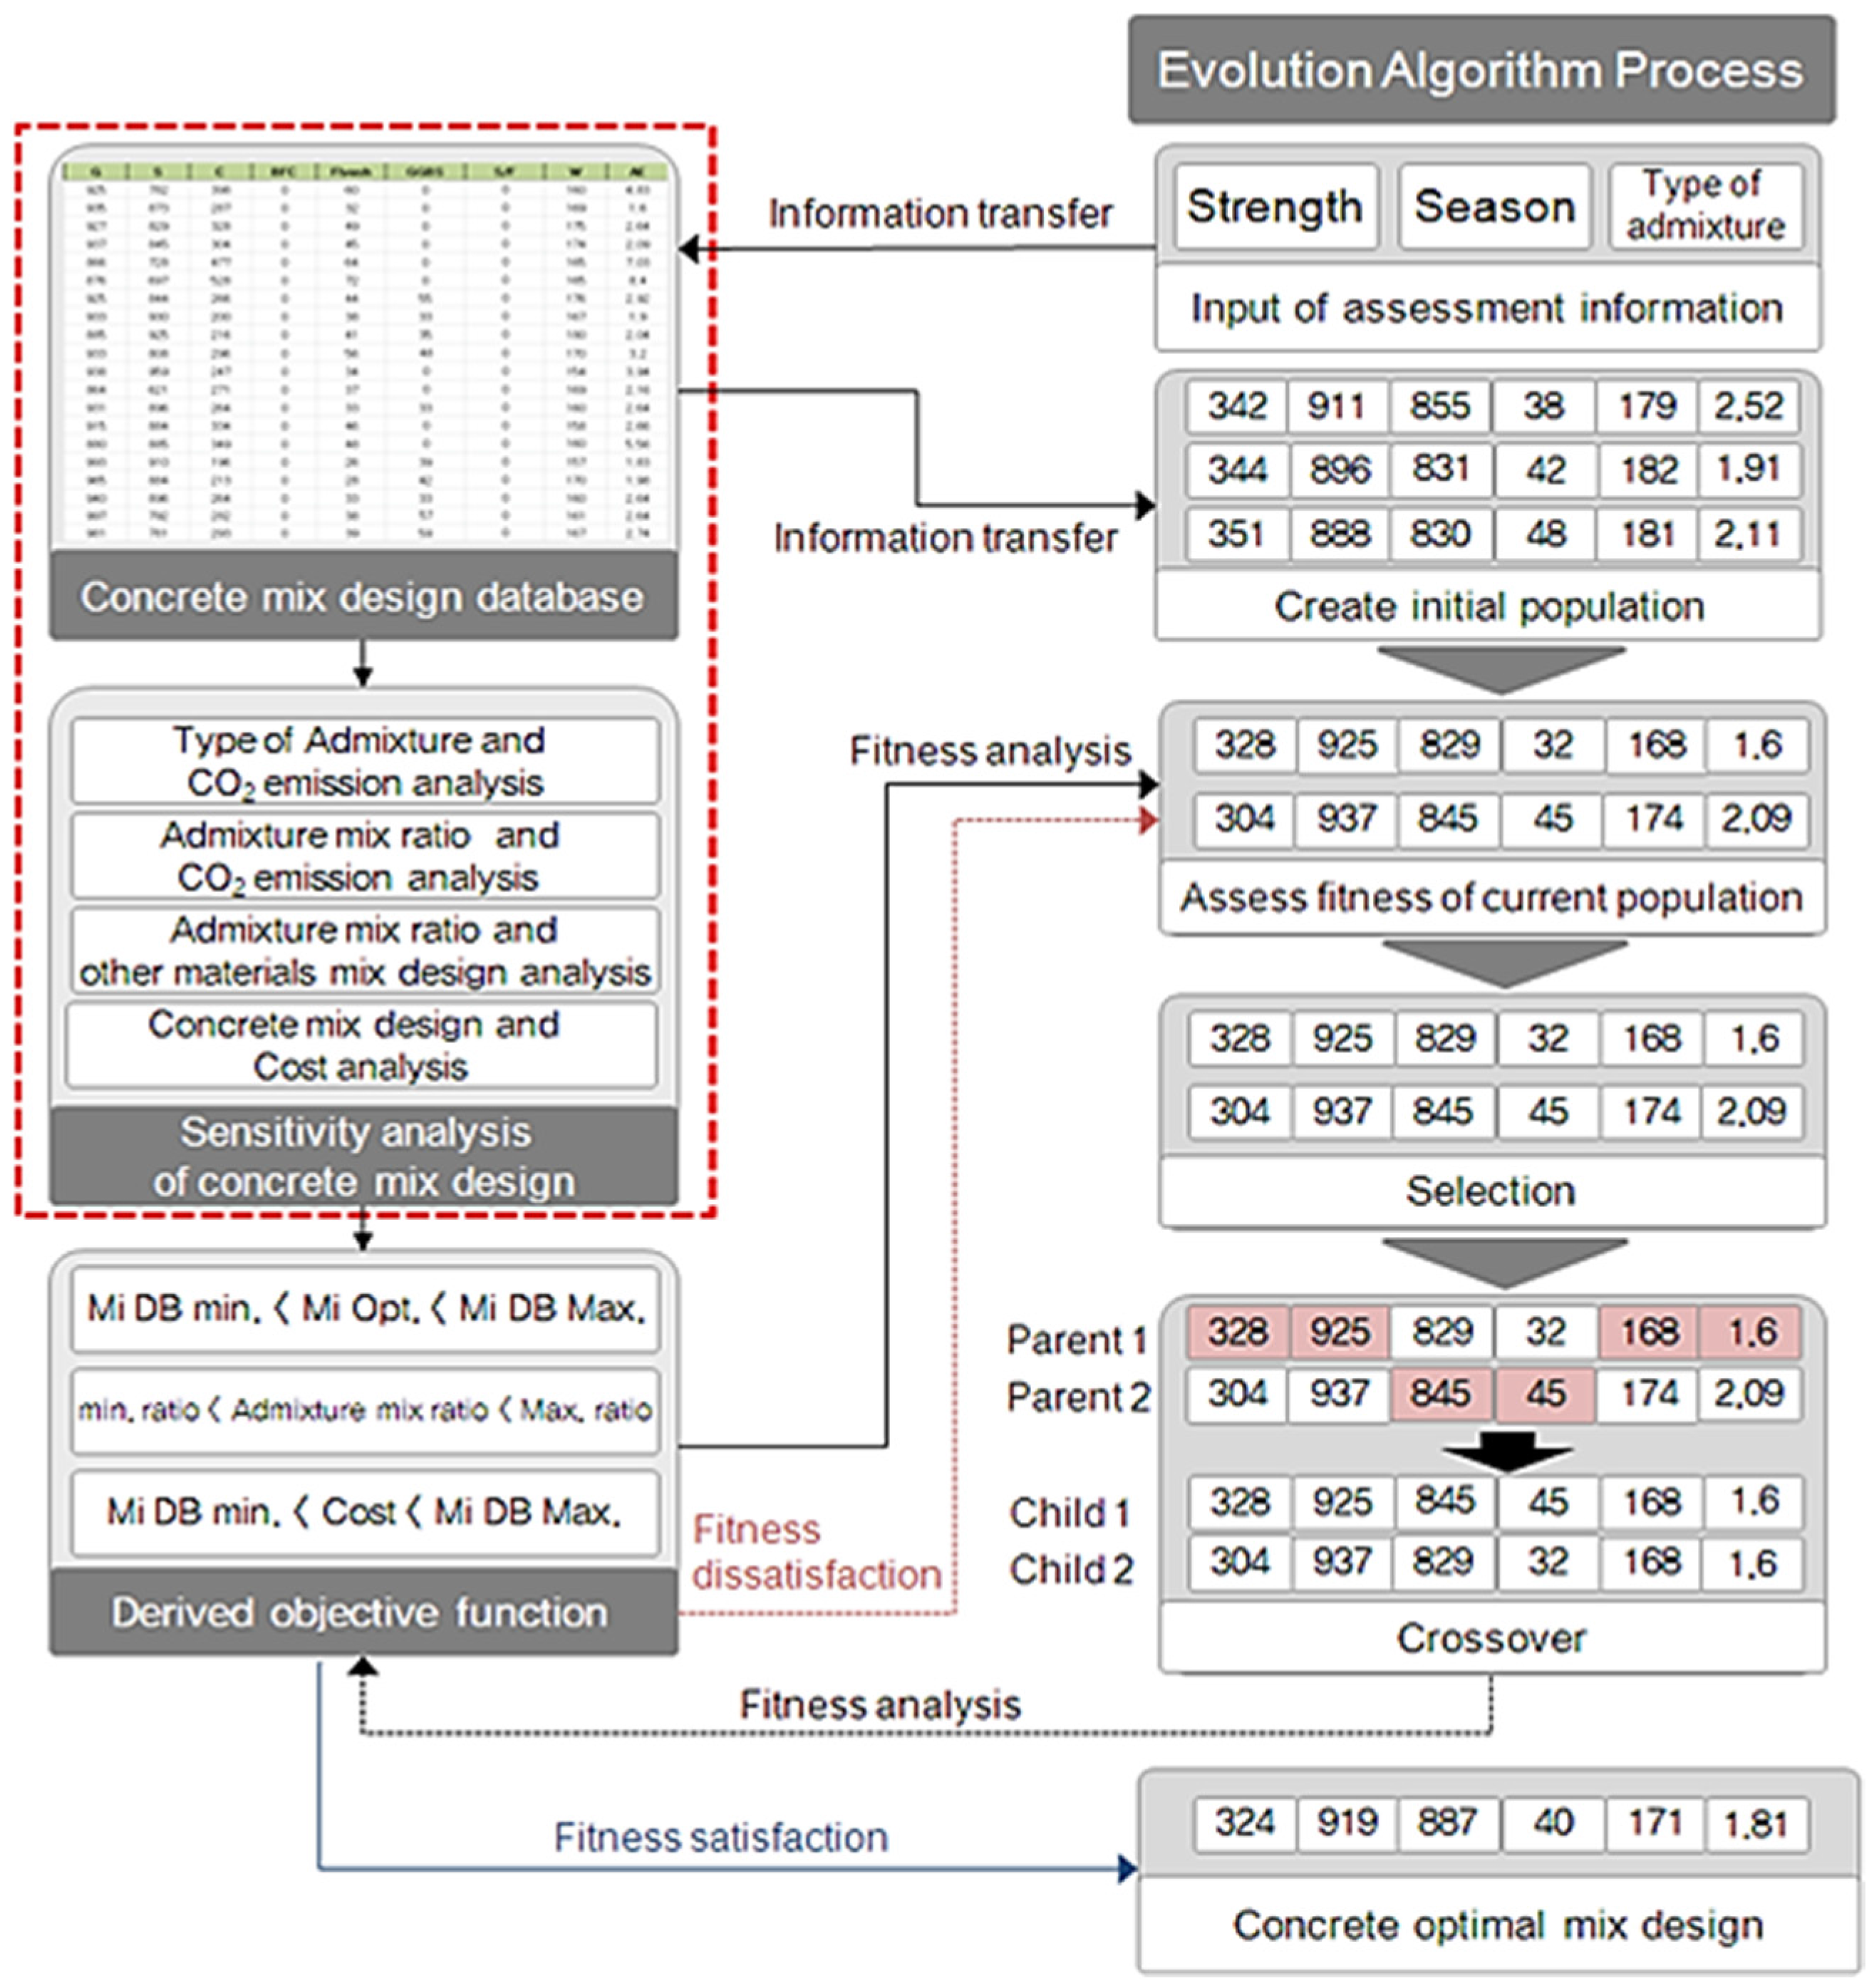
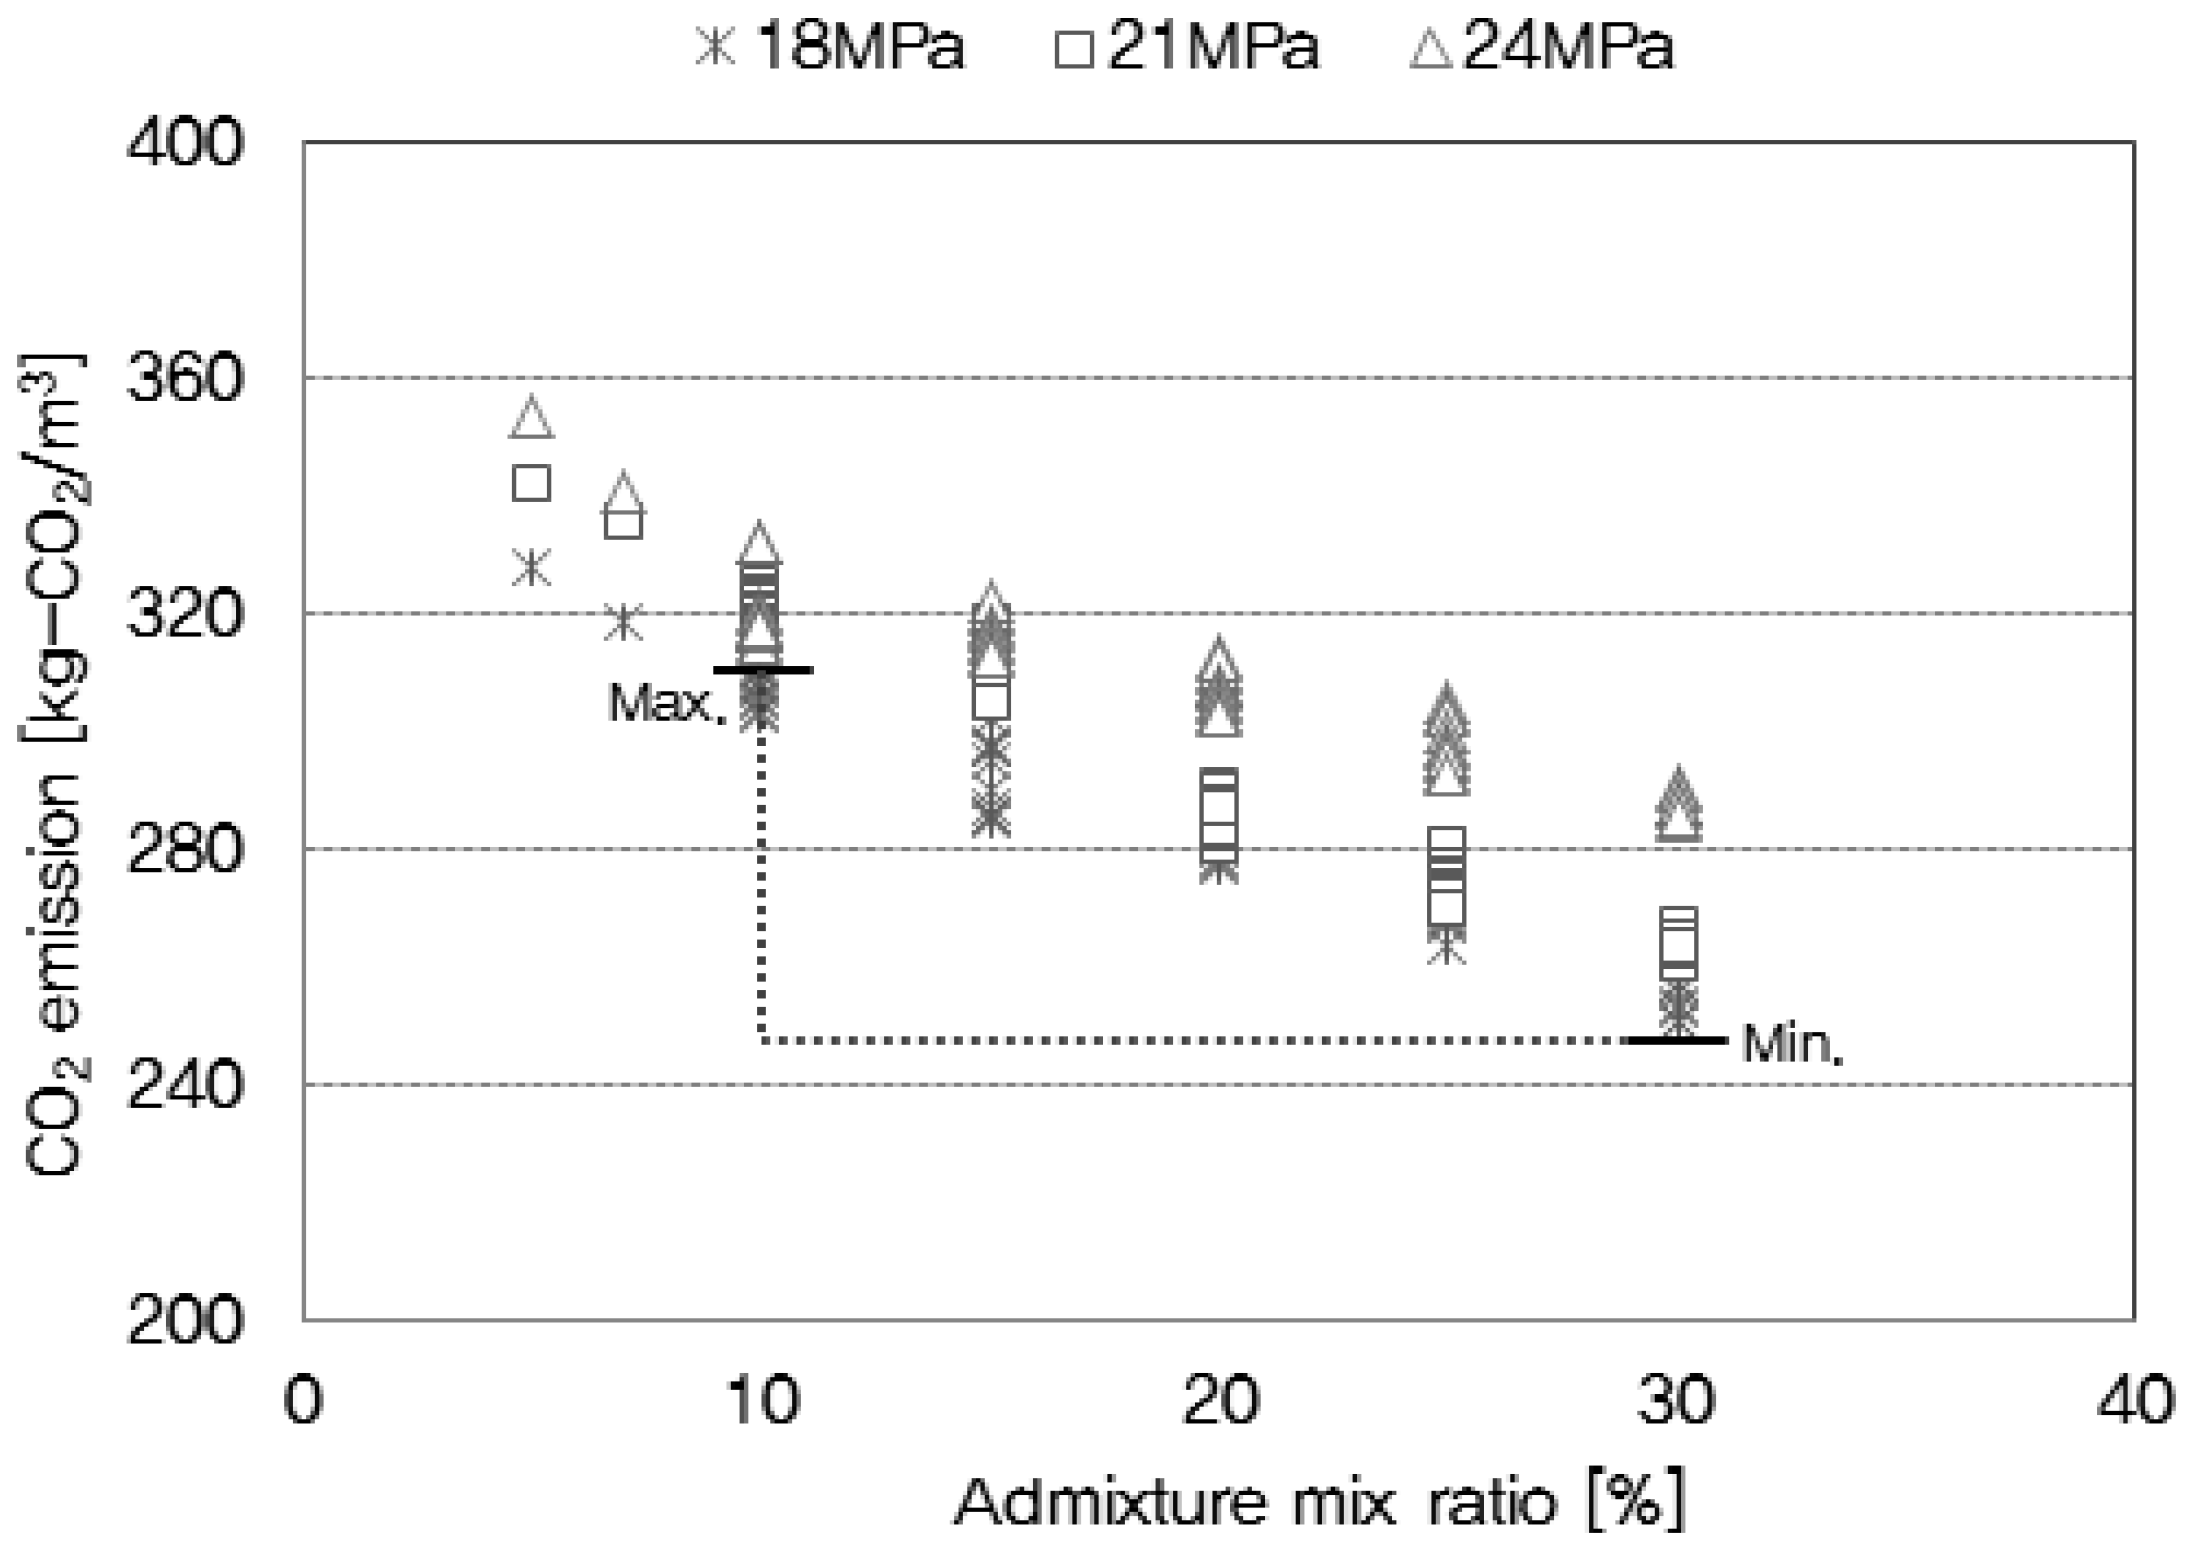
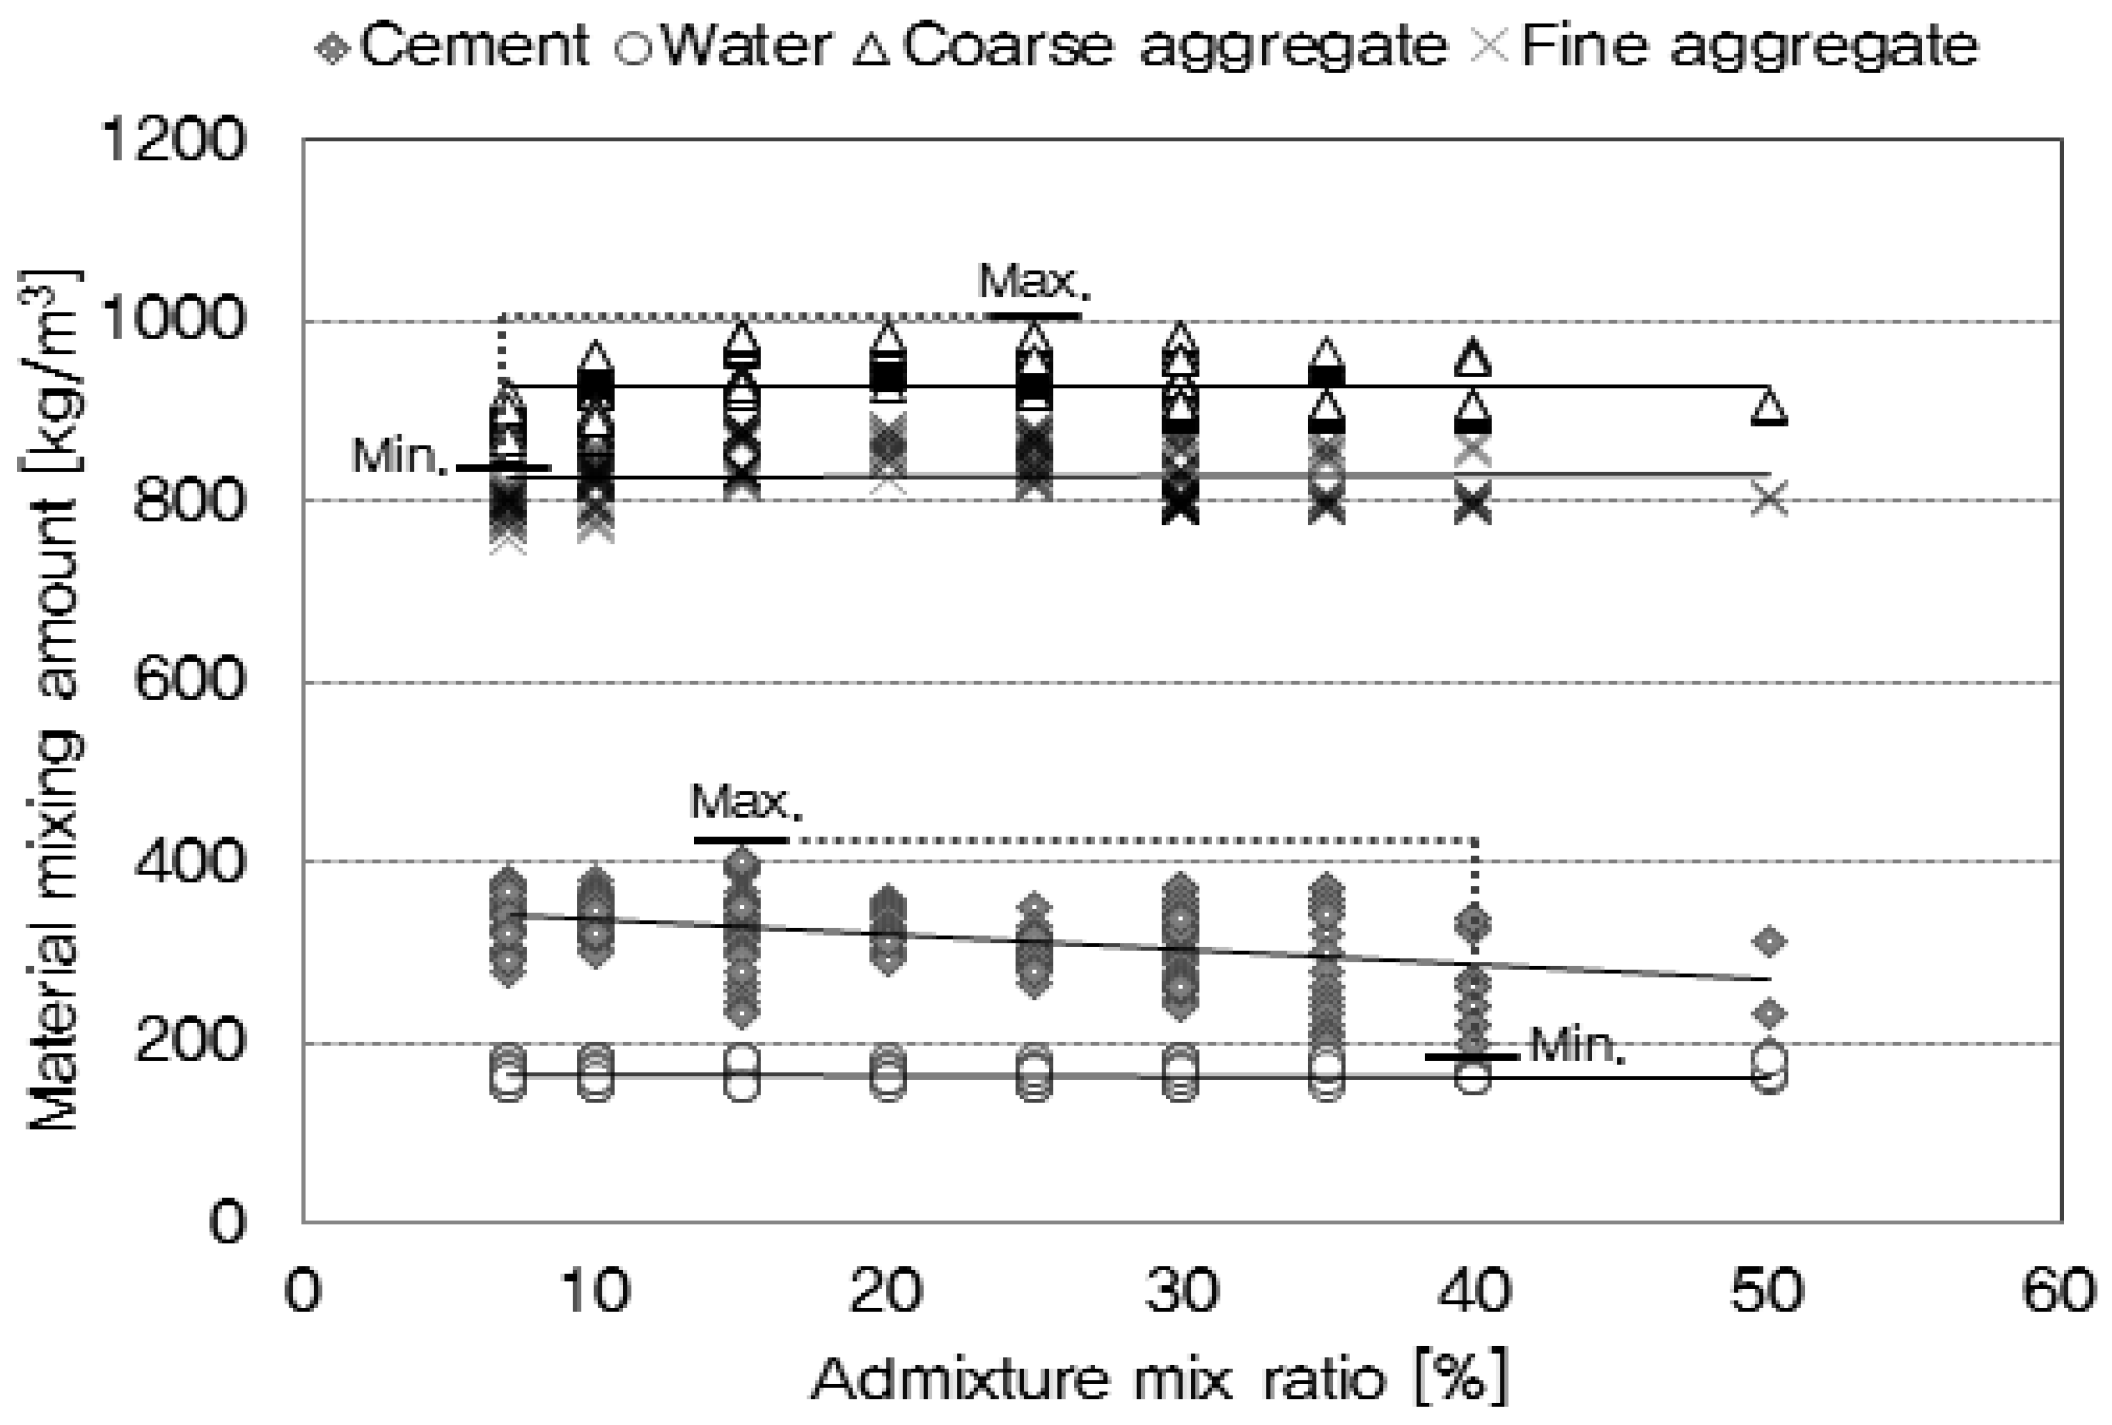
3.2.1. Evolution Algorithm for the Materials Stage
- (1)
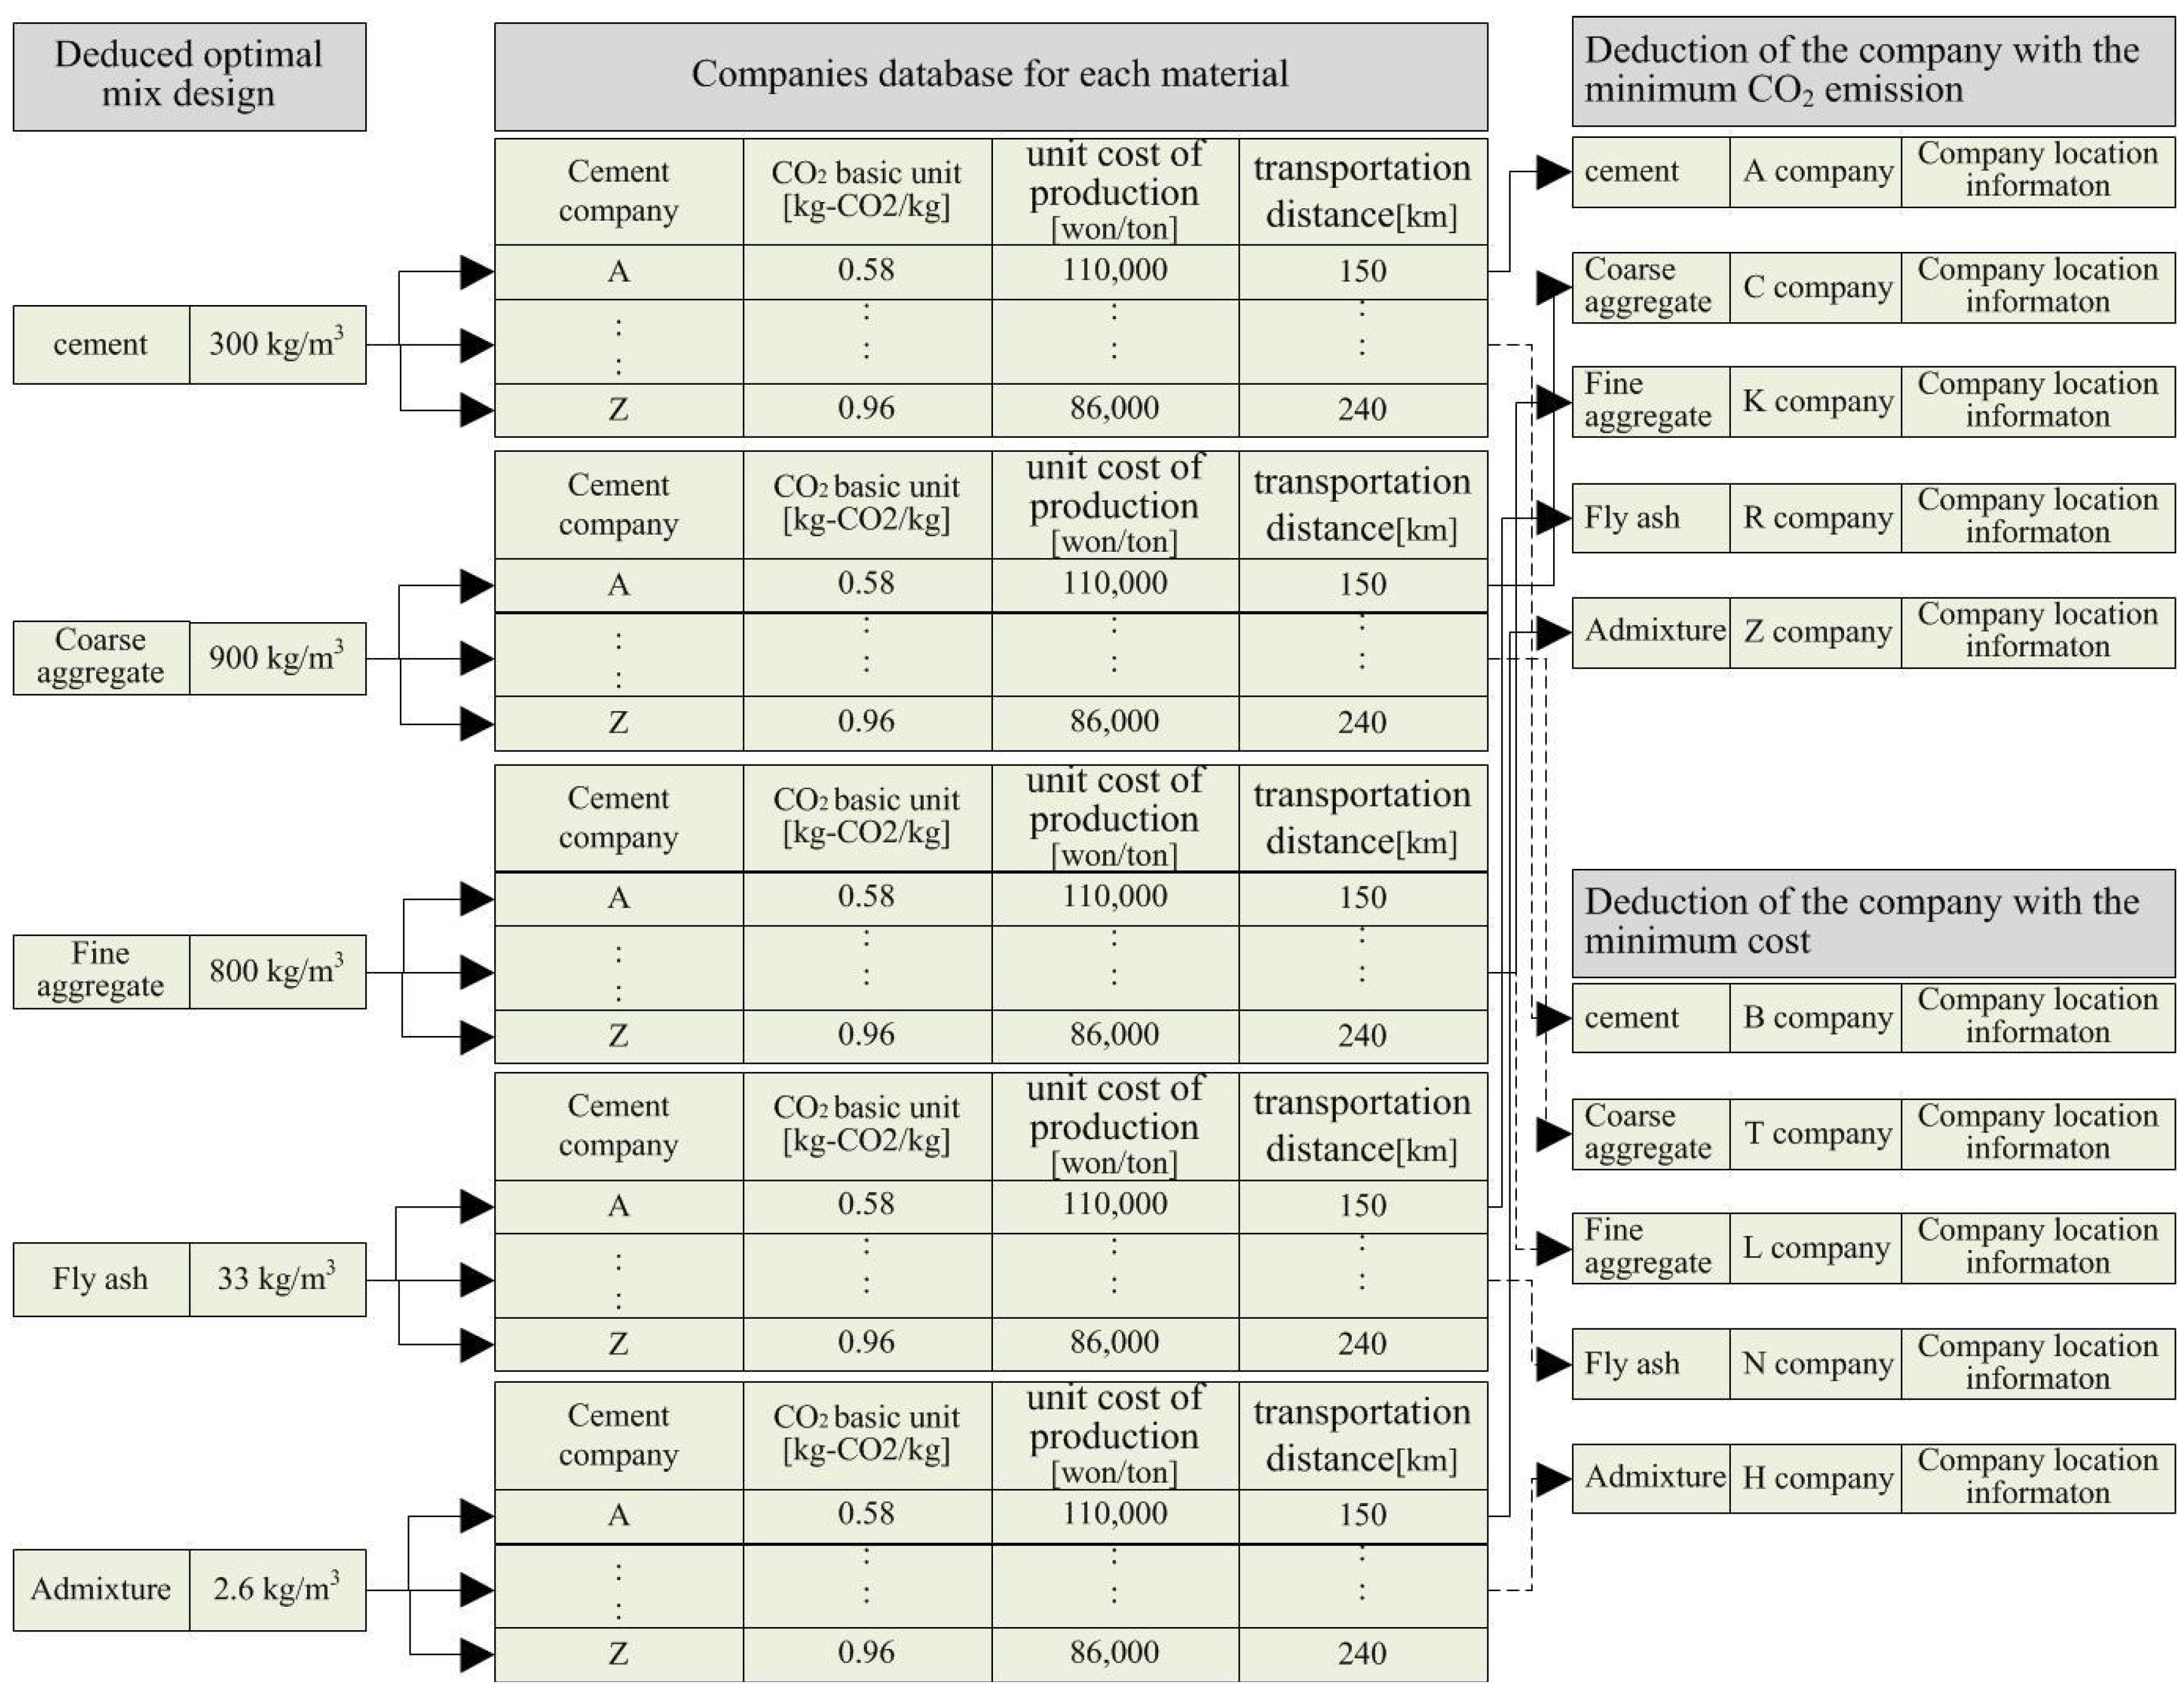
- Mix Design by Applying the Evolution Algorithm
- (2)
- Process of Mix Design Deduction
- (3)
- Analysis for the Mix Design Selection Process
(i = mixing materials)
(i = compressive strength)
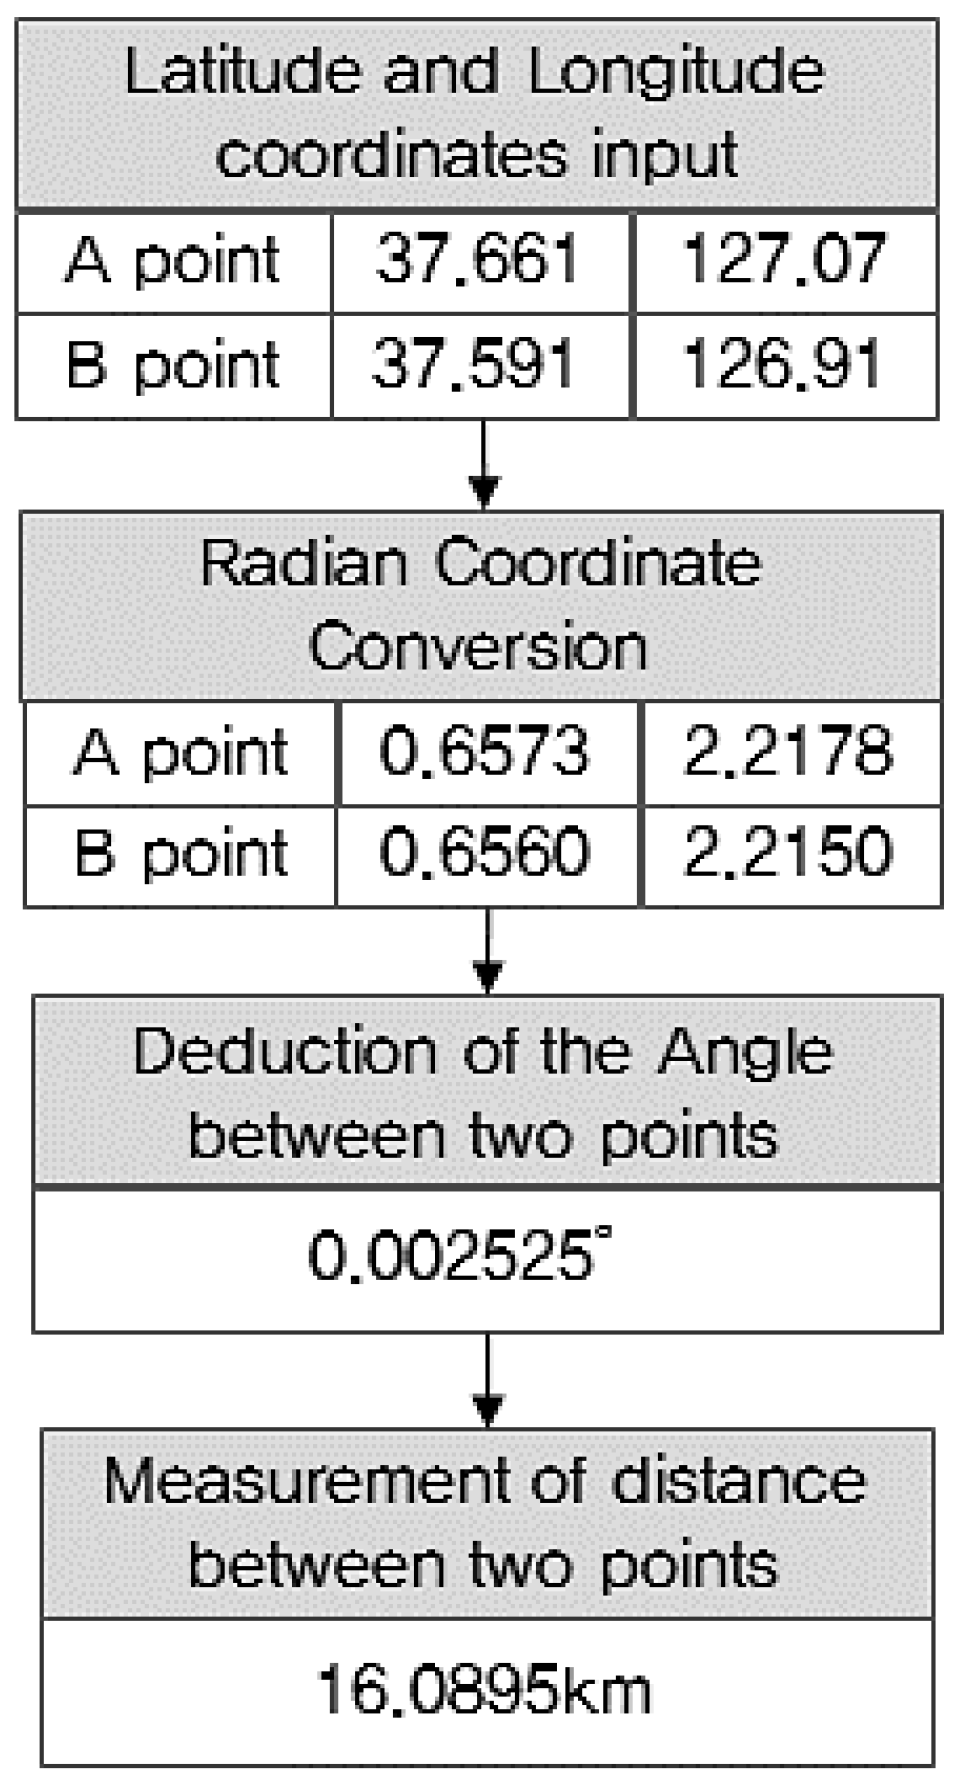
3.2.2. Trigonometric Function Method for the Transportation Stage
3.2.3. Stochastic Model for the Manufacturing Stage
3.3. Verification of the Optimization Techniques
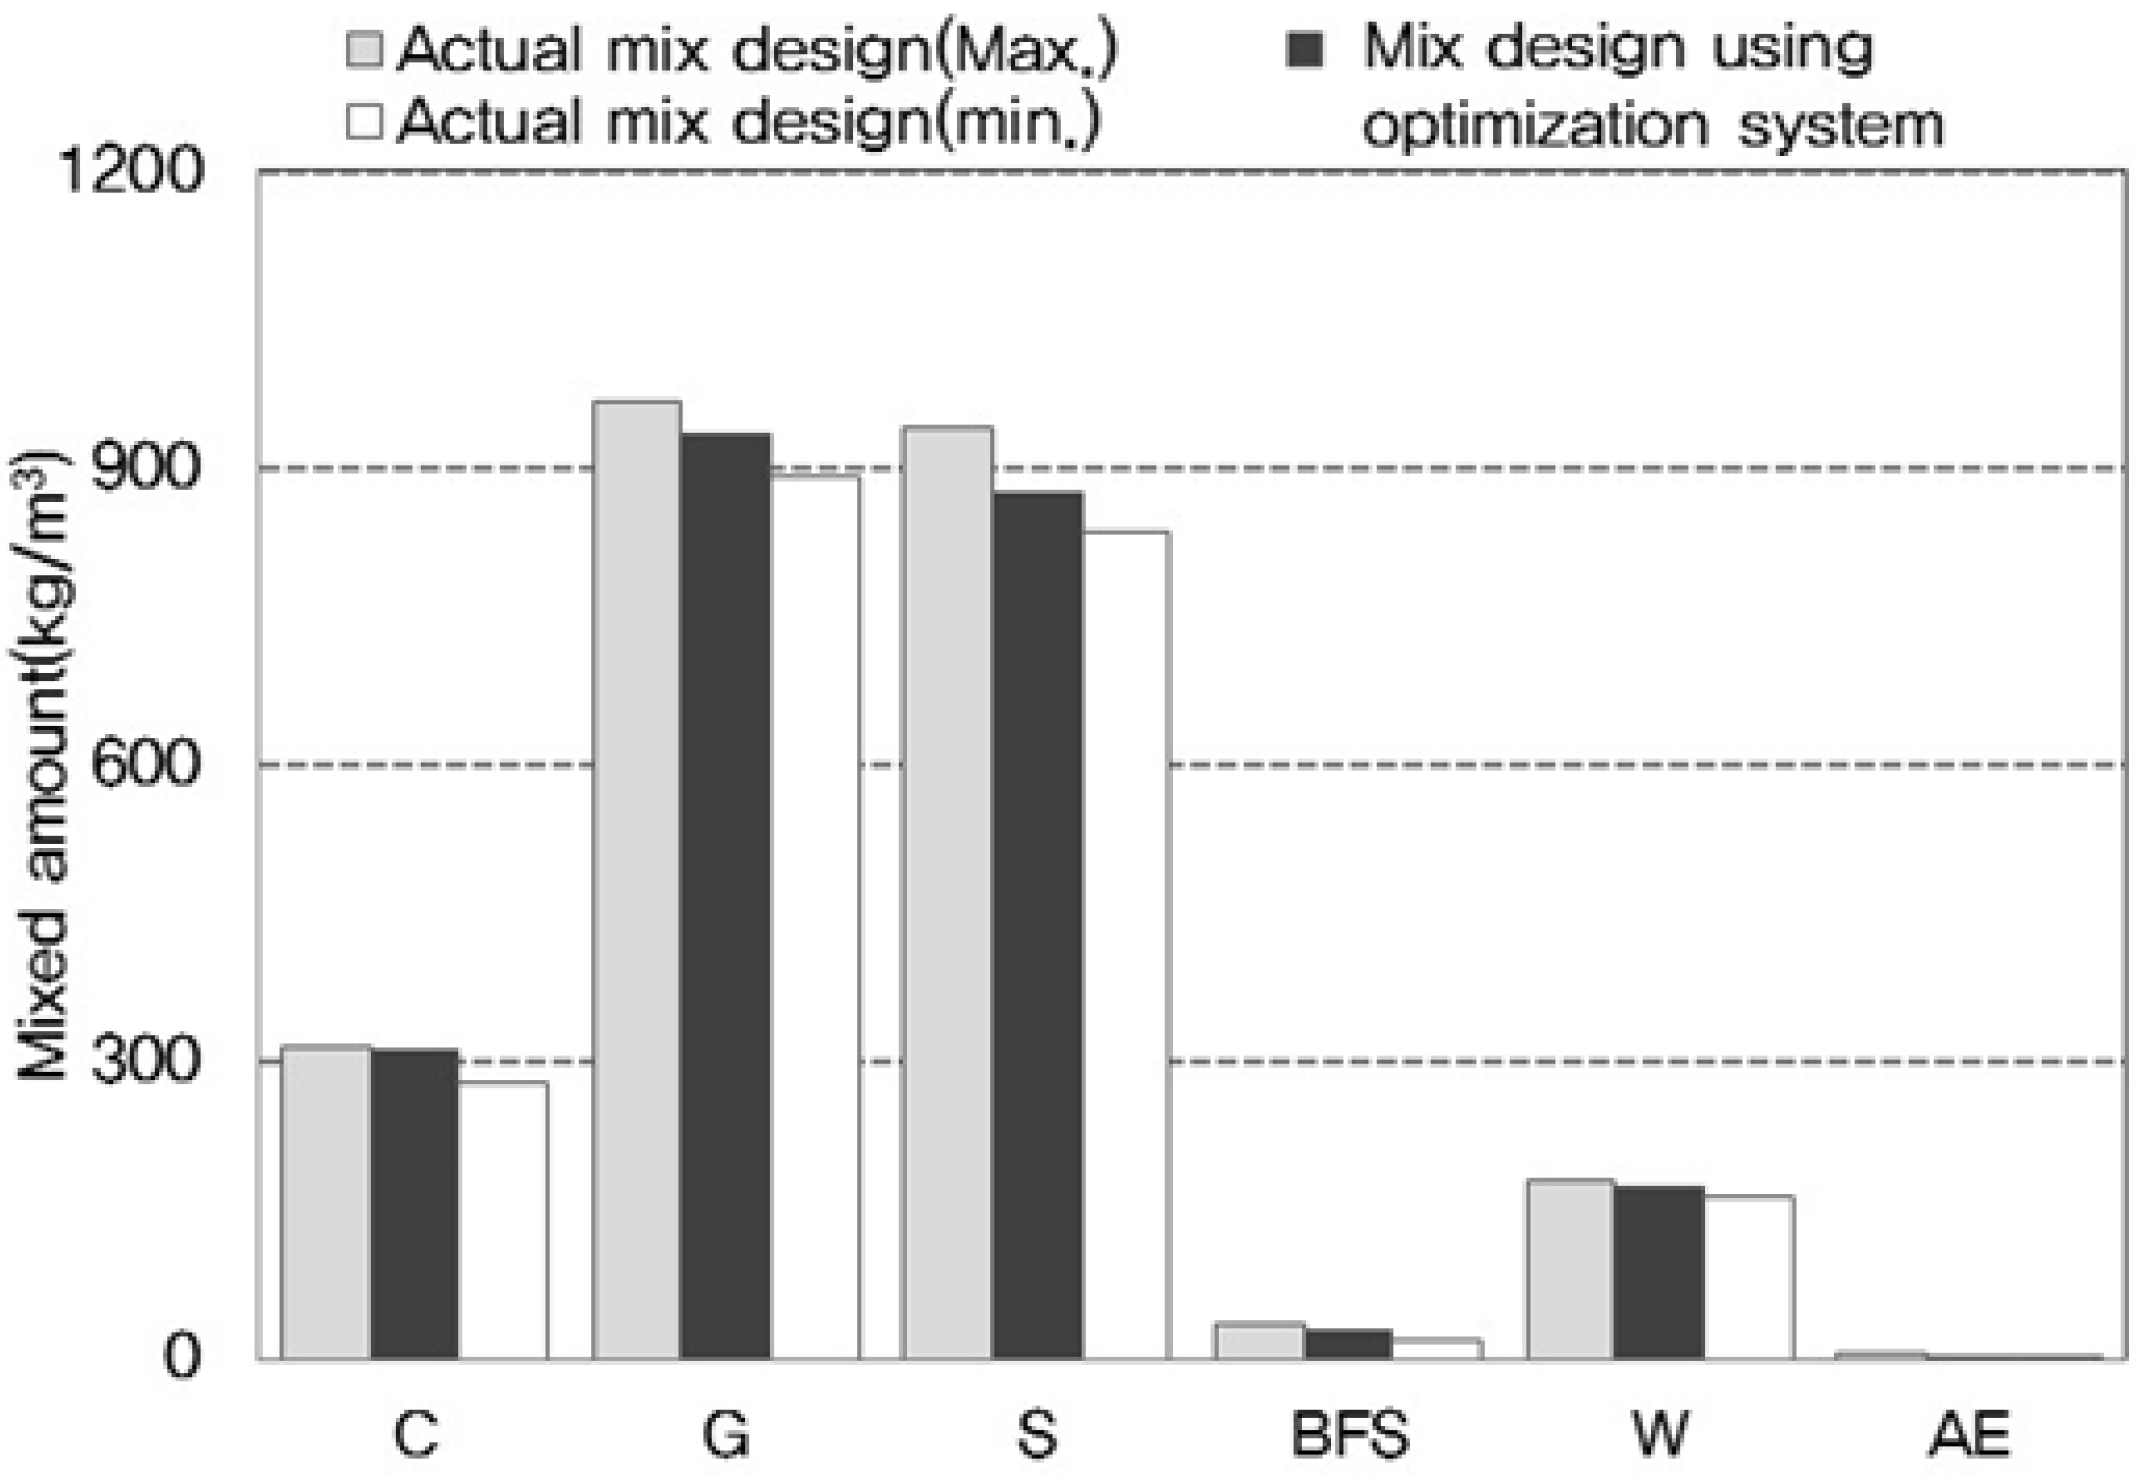
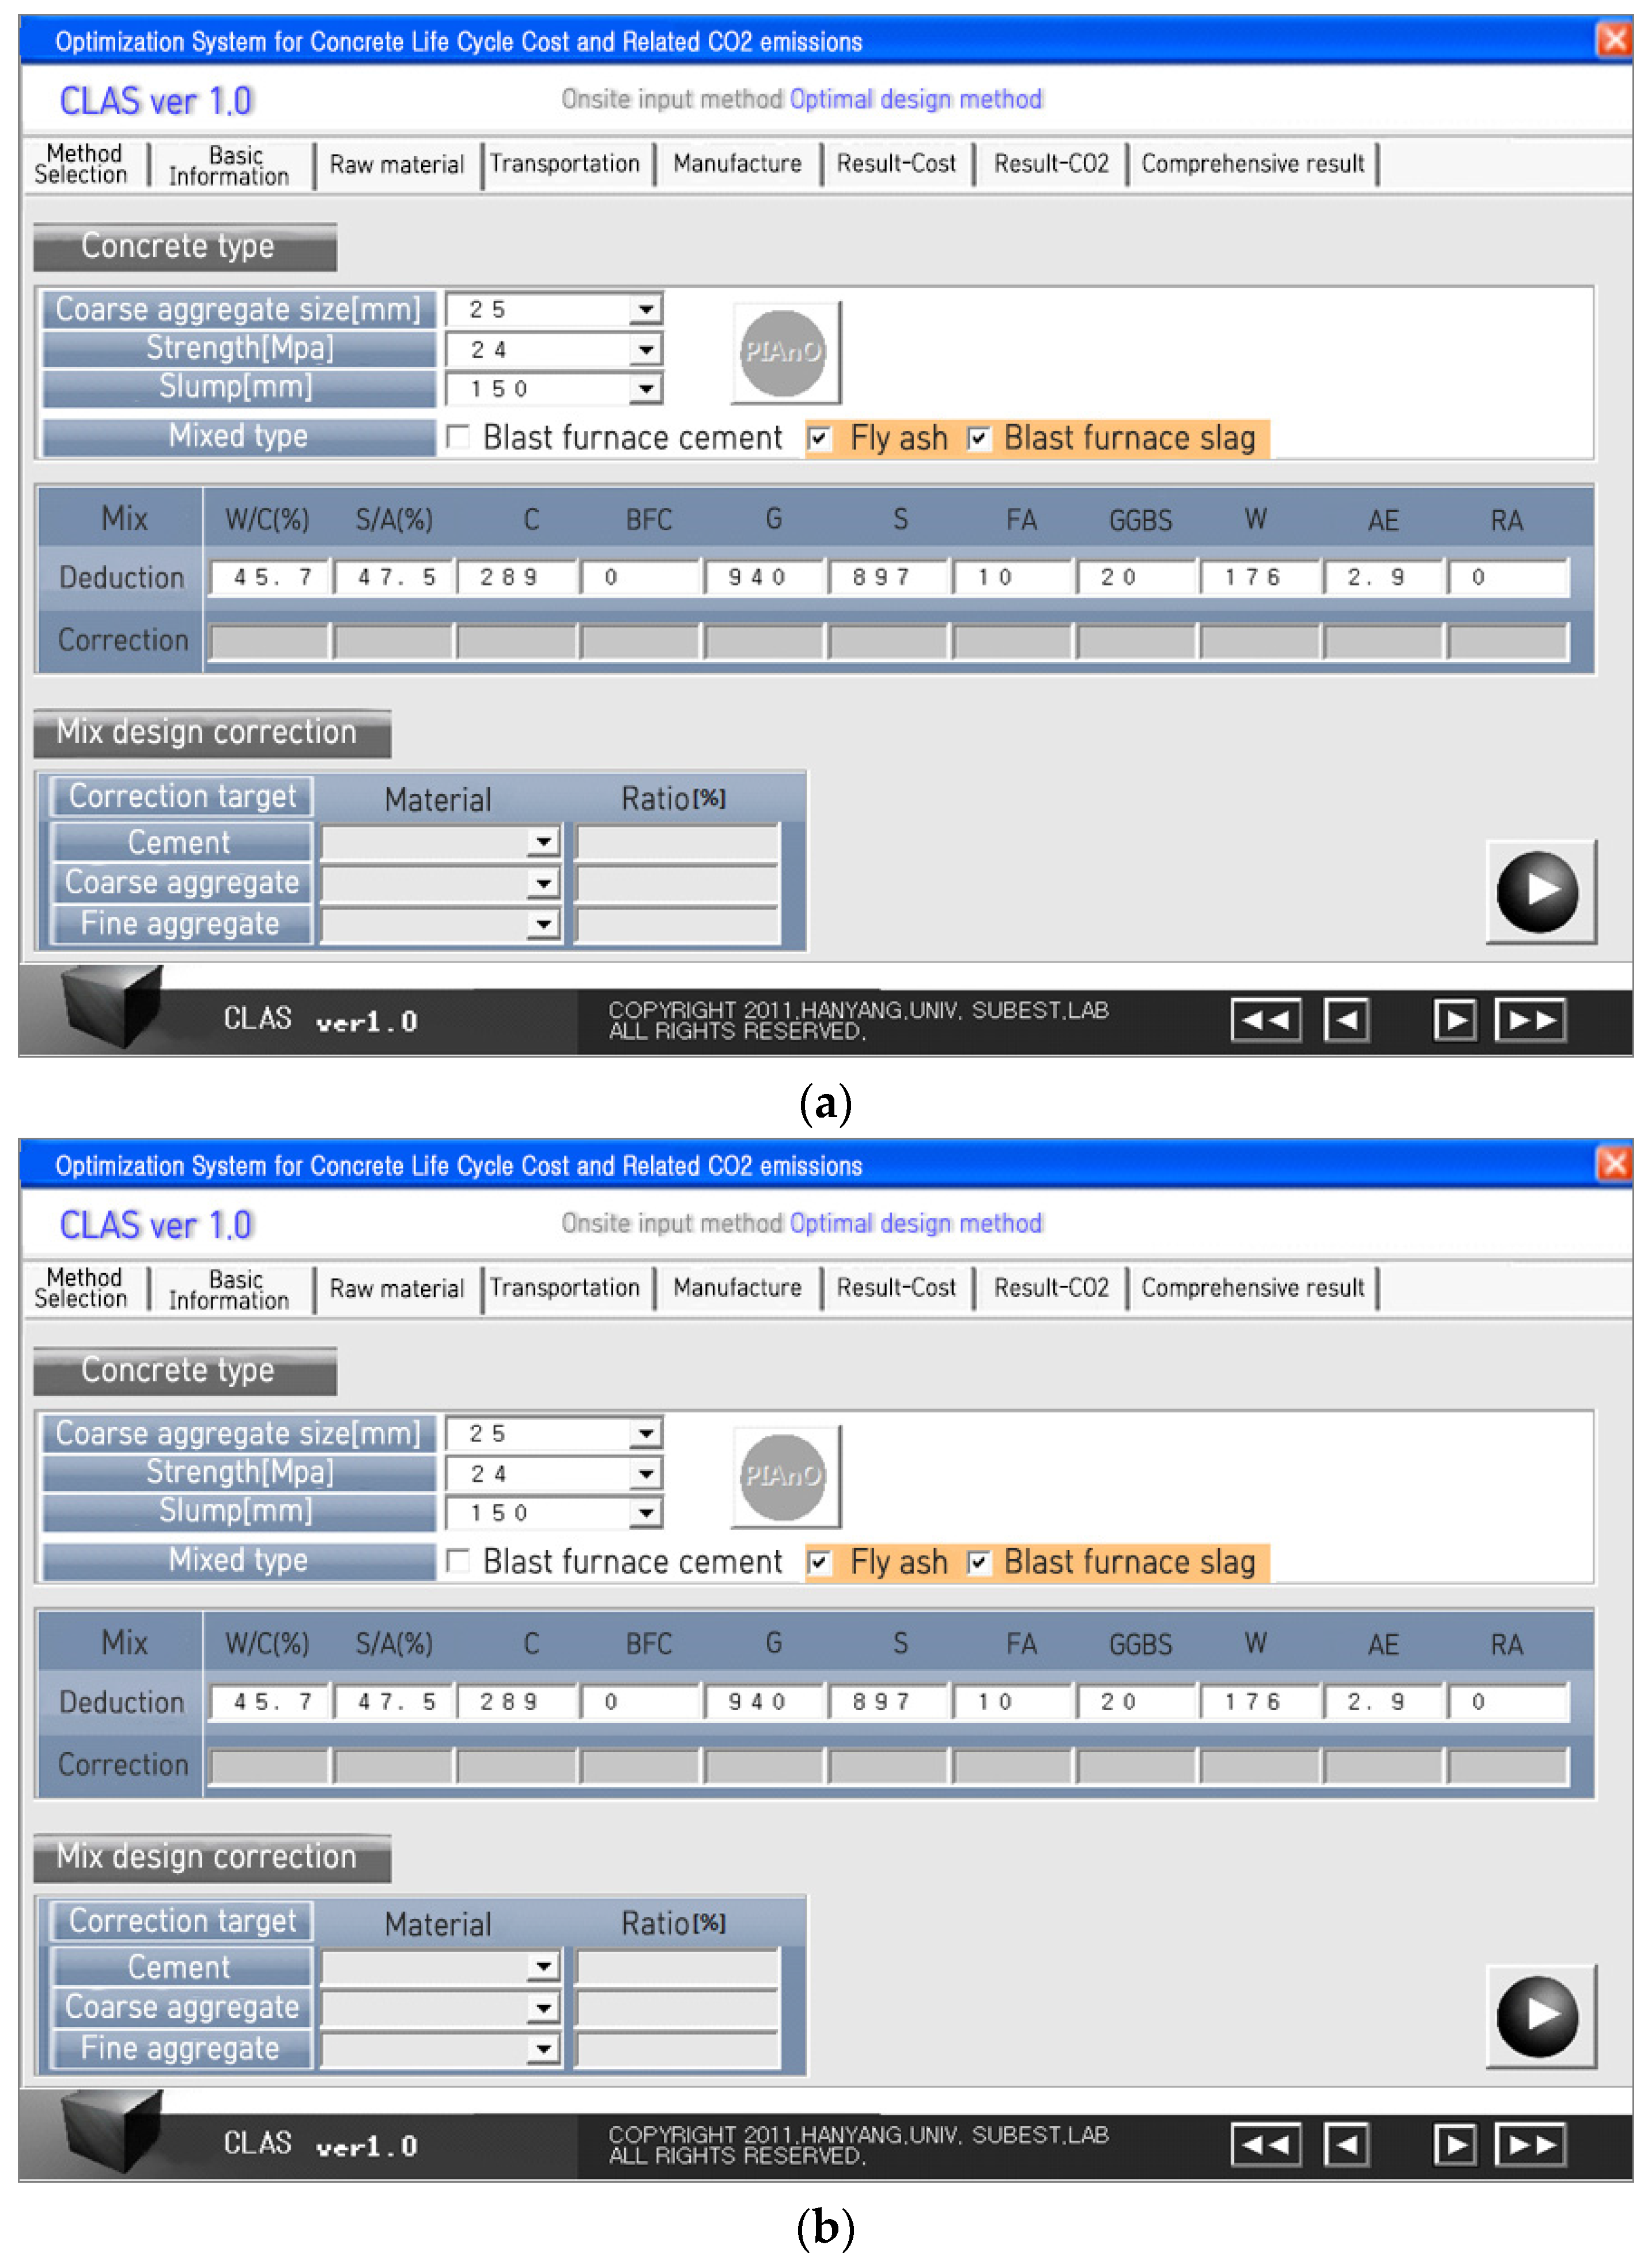
3.3.1. Mix Design
3.3.2. Investigation of the Manufacturing Equipment
4. Development of CLAS
4.1. Basic Information Input Sheet
4.2. Raw Materials Stage Input Sheet
4.3. Transportation Stage Input Sheet
4.4. Manufacturing Stage Input Sheet
4.5. Evaluation Results Sheet
5. Case Analysis
5.1. Method
5.2. Results
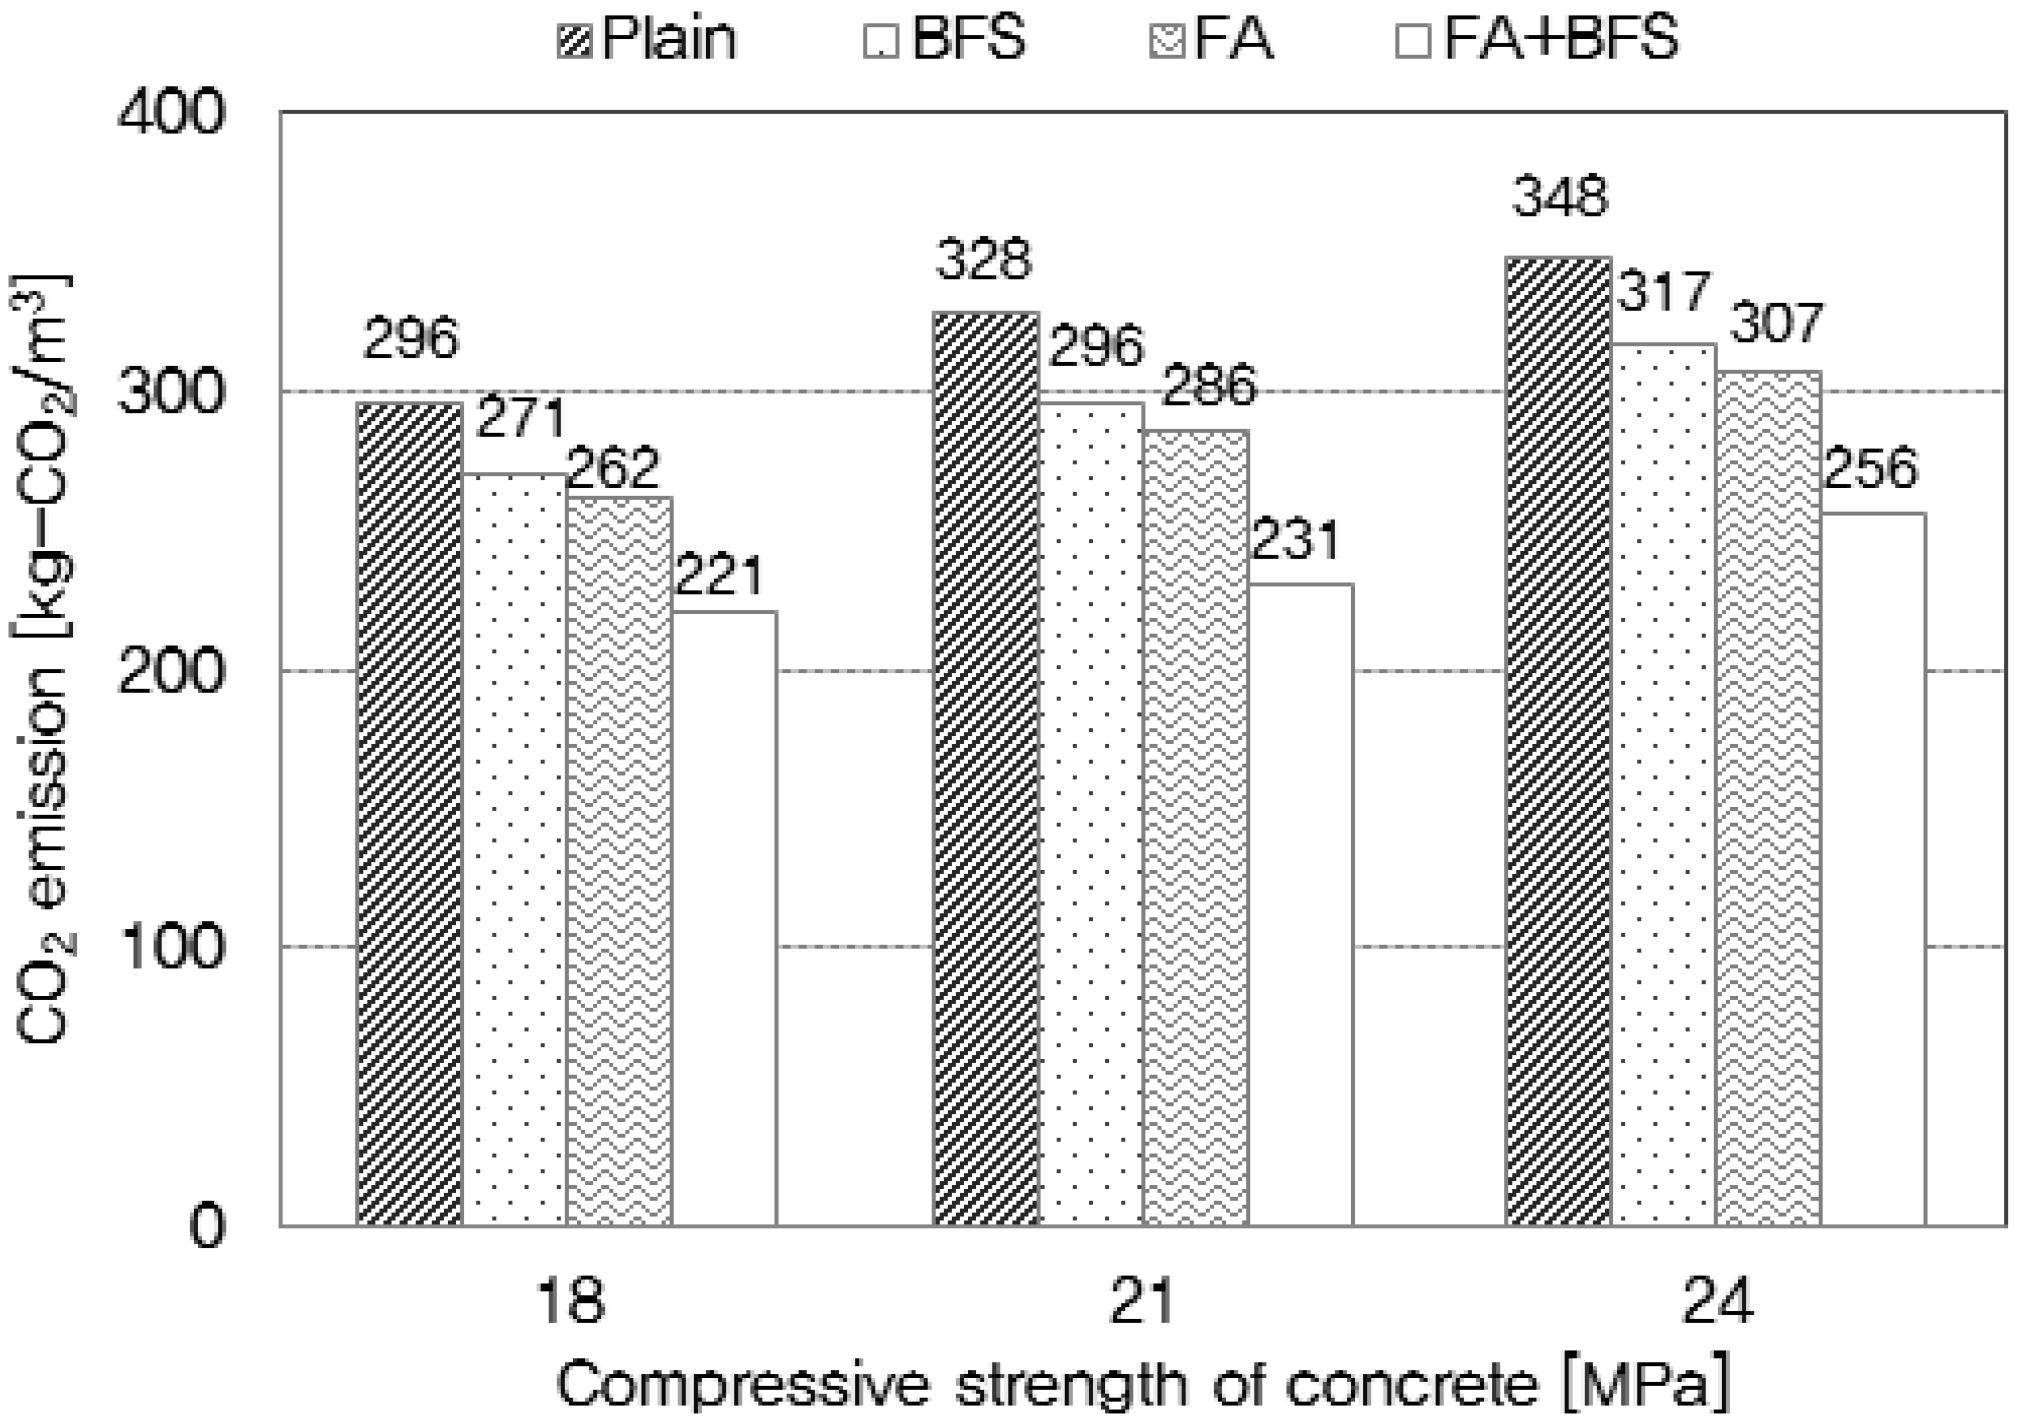
5.2.1. Materials Stage
5.2.2. Transportation Stage
5.2.3. Manufacture Stage
6. Discussion and limitation
7. Conclusions
Acknowledgments
Author Contributions
Conflicts of Interest
References
- World Energy Outlook. International Energy Agency: Paris, France, 2015. Available online: http://www.worldenergyoutlook.org/ (accessed on 11 January 2016).
- Korea Environmental Industry & Technology Institute. Environmental Declaration of Products. Available online: http://www.edp.or.kr/en/ (accessed on 11 January 2015).
- Korea National Cleaner Production Center. Korea LCI DB Information Network. Available online: http://www.kncpc.or.kr/main/main.asp (accessed on 15 January 2015).
- Korea Environmental Industry & Technology Institute. Korea LCI DB Information Network. Available online: http://www.edp.or.kr/en/lci/lci_intro.asp (accessed on 11 January 2015).
- Peuporier, B.; Putzeys, K. Inter-Comparison and Benchmarking of LCA-based Environmental Assessment and Design Tool. Final Report. Practical Recommendations for Sustainable Construction (PRESCO). Available online: http://www.etn-presco.net/library/index.html (accessed on 11 January 2015).
- ASMI. Athena Sustainable Materials Institute. Available online: http://www.athenasmi.org (accessed on 11 January 2016).
- thinkstep GaBi. Available online: http://www.gabi-software.com/international/index/ (accessed on 13 January 2016).
- Building Research Establishment. Envest 2. Available online: http://envest2.bre.co.uk/account.jsp (accessed on 11 January 2016).
- Erin, T. LISA (LCA In Sustainable Architecture). Available online: http://sustainableresourcedatabase.weebly.com/lca-in-sustainable-architecture.html (accessed on 11 March 2016).
- VTT Technical Research Center. Available online: http://www.vttresearch.com/ (accessed on 12 March 2016).
- Scott, M. Eco Quantum Life Cycle and Greenhouse Gas Assessment. Available online: http://ecoquantum.com.au/ (accessed on 11 January 2015).
- International Standard. ISO 14044: Life Cycle Assessment (Requirements and Guidelines); International Organization for Standardization: Geneva, Switzerland, 2006; Available online: http://www.iso.org/iso/home/store/catalogue_tc/catalogue_detail.htm?csnumber=38498 (accessed on 19 March 2015).
- International Standard. ISO 21930: Environmental Declaration of Building Products; International Organization for Standardization: Geneva, Switzerland, 2007; Available online: http://www.iso.org/iso/home/store/catalogue_tc/catalogue_detail.htm?csnumber=40435 (accessed on 19 March 2015).
- Peng, C.H.; Yeh, I.C.; Lien, L.C. Modeling strength of high-performance concrete using genetic operation trees with pruning techniques. Comput. Concr. 2009, 6, 203–223. [Google Scholar] [CrossRef]
- Tae, S.H.; Shin, S.W.; Woo, J.H.; Roh, S.J. The development of environmental load evaluation system of a standard Korean apartment house. Renew. Sustain. Energy Rev. 2011, 15, 1239–1249. [Google Scholar]
- Parichatprecha, R.; Nimityongskul, P. An integrated approach for optimum design of HPC mix proportion using genetic algorithm and artificial neural networks. Comput. Concr. 2009, 6, 253–268. [Google Scholar] [CrossRef]
- Kim, T.H.; Tae, S.H.; Roh, S.J. Assessment of the CO2 emission and cost reduction performance of a low-carbon-emission concrete mix design using an optimal mix design system. Renew. Sustain. Energy Rev. 2013, 25, 729–741. [Google Scholar] [CrossRef]
- Kewalramani, M.; Gupta, R. Concrete compressive strength prediction using ultrasonic pulse velocity through artificial neural networks. Autom. Constr. 2006, 15, 374–379. [Google Scholar] [CrossRef]
- Goldberg, D. Genetic Algorithms in Search, Optimization and Machine Learning; Addison-Welsley: Reading, MA, USA, 1989. [Google Scholar]
- Habert, G.; Roussel, N. Study of two concrete mix-design strategies to reach carbon mitigation objectives. Cem. Concr Compos. 2009, 31, 397–402. [Google Scholar] [CrossRef]
- Holland, J.H. Adaptation in Natural and Artificial Systems; University of Michigan Press: Ann arbor, MI, USA, 1975. [Google Scholar]
- Jeong, M.J. Integrated Support System for Decision Making in Optimization. Ph.D. Thesis, The University of Tokyo, Tokyo, Japan, 2003; pp. 6–14. [Google Scholar]
- Thomas, B. Evolutionary Algorithms in Theory and Practice; Oxford University Press: Oxford, UK, 1996. [Google Scholar]
- Korea Price Information. Available online: http://www.kpi.or.kr/ (accessed on 15 March 2016).
- Liu, Y.; Xi, N. Low-cost and automated calibration method for joint offset of industrial robot using single-point constraint. Ind. Robot 2011, 38, 577–584. [Google Scholar] [CrossRef]
- Park, C.S.; Hong, S.E.; Park, J.O.; Jeong, T.S.; Sung, B.Y. A study on converting cadastral coordinate system into global coordinate system. J. Korean Soc. Geosp. Inf. Sys. 2010, 18, 105–114. [Google Scholar]
- Badekas, J. Investigations Related to the Establishment of a World Geodetic System; Report 124; Department of Geodetic Science, Ohio State University: Columbus, OH, USA, 1969. [Google Scholar]
- Bursa, M. The theory for the determination of the non-parallelism of the minor axis of the reference ellipsoid and the inertial polar axis of the earth, and the planes of the initial astronomic and geodetic meridians from observations of artificial earth satellites. Stud. Geophys. Geod. 1962, 6, 209–214. [Google Scholar]
- Krakiwsky, E.J.; Thomson, D.B. Mathematical models for the combination of terrestrial and satellite networks. Can. Surv. 1974, 28, 606–615. [Google Scholar]
- Molodensky, M.S.; Eremeev, V.F.; Yurkina, M.I. Methods for Study of the External Gravitational Field and Figure of the Earth; Israeli Program for the Translation of Scientific Publications: Jerusalem, Israel, 1962. [Google Scholar]
- Ramsey, P. The State of Open Source GIS; Refractions Research Inc.: Victoria, BC, Canada, 2004; pp. 3–10. [Google Scholar]
- Wolf, H. Geometric connection and re-orientation of three-dimensional triangulation nets. Bull. Géod. 1963, 68, 165–169. [Google Scholar] [CrossRef]
- Chou, J.; Tsai, C. Concrete compressive strength analysis using a combined classification and regression technique. Autom. Constr. 2012, 24, 52–60. [Google Scholar] [CrossRef]
- Zain, M.F. An expert system for mix design of high-performance concrete. Adv. Eng. Softw. 2005, 36, 325–337. [Google Scholar] [CrossRef]
- Oner, A.; Akyuz, A.; Yildiz, R. An experimental study on strength develpoment of concrete containing fly ash and optimum usage of fly ash in concrete. Cem. Concr Res. 2005, 35, 1165–1171. [Google Scholar] [CrossRef]
- Kim, T.H.; Tae, S.H.; Lee, J.S. A Study on development of a CO2 assessment program of concrete. Int. Conf. Sustain. Build. Asia 2010, 1, 303–310. [Google Scholar]
- Tae, S.H.; Shin, S.W.; Ha, S.G. Life cycle environmental loads and economic efficiencies of apartment buildings with plaster board drywall. Renew. Sustain. Energy Rev. 2011, 15, 4145–4155. [Google Scholar] [CrossRef]
- Kjellsen, K.O.; Guimaraes, M.; Nilsson, A. The CO2 Balance of Concrete in a Life Cycle 430 Perspective; Nordic Innovation Centre: Stensberggt, Norway, 2005. [Google Scholar]
- Ko, J.H.; Kim, G.T.; Kim, D.H.; Kim, H.S. Development of an optimal design program for a triple-band PIFA using the evolutionary strategy. J. Korean Inst. Electromagn. Eng. Sci. 2009, 2, 746–753. [Google Scholar] [CrossRef]


| Material | Unit | Reference Basis |
|---|---|---|
| Ordinary Portland Cement | kg | National LCI Database (Korea) |
| Coarse aggregate | kg | National LCI Database (Korea) |
| Fine aggregate | kg | National LCI Database (Korea) |
| Blast furnace slag powder | kg | Overseas LCI DB (ecoinvent) |
| Fly ash | kg | Overseas LCI DB (ecoinvent) |
| Water | kg | National LCI Database (Korea) |
| Chemical admixture compound | kg | Overseas LCI DB (ecoinvent) |
| Transportation Equipment | Unit | Reference Basis |
|---|---|---|
| Truck | km | National LCI Database (Korea) |
| Train | km | National LCI Database (Korea) |
| Division | Reference basis | |
|---|---|---|
| Energy | Electric | National LCI Database (Korea) |
| Diesel | National LCI Database (Korea) | |
| Material | Company Address | Latitude-Longitude | CO2 Emission Basic Unit (kg-CO2/ton) | COST ($/ton) | |
|---|---|---|---|---|---|
| X Coordinate | Y Coordinate | ||||
| C | Samcheok, Gangwon | 129.1768 | 37.4286 | 760 | 120 |
| G | Gwangmyeong, Gyeonggi | 126.8846 | 37.4236 | 0.005 | 8.2 |
| S | Jung-gu, Incheon | 126.5082 | 37.4844 | 0.005 | 7.6 |
| B/C | Jung-gu, Incheon | 126.6145 | 37.4410 | 0.8 | 117 |
| F/A | Taean, Chungcheong | 126.1664 | 36.9226 | 0.0196 | 48 |
| GGBS | Dong-gu, Incheon | 126.6231 | 37.4905 | 0.0265 | 54 |
| AE | Asan, Chungcheong | 127.0678 | 36.9301 | 0.22 | 880 |
| R/G | Goyang, Gyeonggi | 126.8133 | 37.6896 | 0.004 | 2.9 |
| W | running water | ||||
| Classification | Equipment Types | ||||
|---|---|---|---|---|---|
| Material Loading and Unloading | Unloading equipment | Horizontal Conveyor Belt | Middle Screen | Conveyor Belt | Shuttle Belt |
| Heavy Equipment | Wheel Loader | Middle Screen | |||
| Material Storage | Cement Silo | Fly ash silo | Blast Furnace Slag Silo | ||
| Material Transportation | Aggregate | Rotary feeder | Conveyor belt | Gauge | Bucket Elevator |
| Cement | Brewer pump | Dust collector | Rotary Feeder | ||
| GGBS | Brewer Pump | Dust Collector | Rotary Feeder | ||
| Fly Ash | Brewer Pump | Dust Collector | Rotary Feeder | ||
| Others | Admixture Pump | Water Pump | Recycled Water Pump | ||
| Material Mixing | Concrete Mixer | ||||
| Other Equipment | Dust Collector | Compressor | Boiler | Cooling Chiller | |
| Accessory Equipment | Equipment Wash | Pump | |||
| Recycle Water Facility | Pump | Aggregate Screen | Sand Screen | Whisk | |
| Office | Lighting | Power Outlet | |||
| Company/Season | Production (m3/year) | Yearly Consumption by Energy Source | ||||
|---|---|---|---|---|---|---|
| Electric Power (kwh/year) | Diesel (L/year) | Kerosene (L/year) | Running Water (ton/year) | |||
| A | Summer | 514,662 | 775,405 | 187,953 | 1056 | 16,203 |
| Winter | 404,297 | 783,534 | 130,132 | 15,526 | 17,195 | |
| B | Summer | 430,271 | 739,440 | 30,809 | 3726 | 16,203 |
| Winter | 442,059 | 827,395 | 31,827 | 52,774 | 17,195 | |
| C | Summer | 430,271 | 792,704 | 54,581 | 895 | 34,080 |
| Winter | 442,059 | 946,350 | 53,561 | 10,700 | 26,650 | |
| D | Summer | 158,792 | 436,505 | 38,179 | 694 | 34,080 |
| Winter | 137,970 | 467,193 | 36,578 | 7457 | 26,650 | |
| E | Summer | 359,644 | 729,676 | 187,953 | 1837 | 64,189 |
| Winter | 321,316 | 774,282 | 66,068 | 24,703 | 62,016 | |
| Classification | Conventional Input Method | Optimization System Method |
|---|---|---|
| Standard | 25-24-150, Mixed Materials (Fly ash) | |
| Quantity | 1 m3 | |
| Materials Stage | Actual Mix Design | Mix Design using CLAS |
| Transportation Stage | Actual Transportation Distance | Transportation Distance using CLAS |
| Manufacturing Stage | Estimation Model | Estimation Model |
| Classification | Materials | Transportation | Manufacture | TOTAL | ||
|---|---|---|---|---|---|---|
| CO2 emission (kg-CO2/m3) | Conventional input method | 332.4 | 5.7 | 2.8 | 340.9 | |
| Optimization System Method | CO2 Prioritized | 221.8 | 1.2 | 2.8 | 225.8 | |
| COST (US$/m3) | Conventional input method | 46.30 | 2.30 | 0.70 | 49.30 | |
| Optimization System Method | COST Prioritized | 44.20 | 0.60 | 0.70 | 45.50 | |
| Classification | W/B (%) | S/a (%) | Unit Mixed Amount (kg/m3) | |||||
|---|---|---|---|---|---|---|---|---|
| C | G | S | F/A | W | AE | |||
| Conventional Input Method | 48.1 | 47 | 314 | 917 | 902 | 45 | 173 | 2 |
| Optimization System Method | 47.2 | 47.3 | 330 | 924 | 833 | 34 | 172 | 2.6 |
| Classification | Supplier Plant Selection | |||||
|---|---|---|---|---|---|---|
| C | G | S | F/A | AE | ||
| Conventional Input Method | D company | I company | G company | T company | P company | |
| Optimization System Method | CO2 Prioritized | U company | G company | G company | D company | A company |
| Optimization System Method | COST Prioritized | J company | Y company | Y company | T company | P company |
| Classification | Consumption by Energy Source | ||
|---|---|---|---|
| Electric (kwh/m3) | Oil (L/m3) | Water (ton/m3) | |
| Conventional Input Method | 3.21 | 1.32 | 0.29 |
| Optimization System Method | |||
© 2016 by the authors; licensee MDPI, Basel, Switzerland. This article is an open access article distributed under the terms and conditions of the Creative Commons by Attribution (CC-BY) license (http://creativecommons.org/licenses/by/4.0/).
Share and Cite
Kim, T.H.; Tae, S.H.; Suk, S.J.; Ford, G.; Yang, K.H. An Optimization System for Concrete Life Cycle Cost and Related CO2 Emissions. Sustainability 2016, 8, 361. https://doi.org/10.3390/su8040361
Kim TH, Tae SH, Suk SJ, Ford G, Yang KH. An Optimization System for Concrete Life Cycle Cost and Related CO2 Emissions. Sustainability. 2016; 8(4):361. https://doi.org/10.3390/su8040361
Chicago/Turabian StyleKim, Tae Hyoung, Sung Ho Tae, Sung Joon Suk, George Ford, and Keun Hyek Yang. 2016. "An Optimization System for Concrete Life Cycle Cost and Related CO2 Emissions" Sustainability 8, no. 4: 361. https://doi.org/10.3390/su8040361
APA StyleKim, T. H., Tae, S. H., Suk, S. J., Ford, G., & Yang, K. H. (2016). An Optimization System for Concrete Life Cycle Cost and Related CO2 Emissions. Sustainability, 8(4), 361. https://doi.org/10.3390/su8040361