Article

Research and Development Strategy in Biological Technologies: A Patent Data Analysis of Japanese Manufacturing Firms

Graduate School of Fisheries and Environmental Sciences, Nagasaki University, 1-14 Bunkyo-machi, Nagasaki 852-8521, Japan
*
Author to whom correspondence should be addressed.
Sustainability 2016, 8(4), 351; https://doi.org/10.3390/su8040351
Submission received: 24 February 2016 / Revised: 1 April 2016 / Accepted: 6 April 2016 / Published: 12 April 2016
(This article belongs to the Special Issue Innovation and Sustainable Development for the Bioeconomy)

Abstract

:
Biological technology allows us to invent new medical approaches, create effective food production methods and reserves and develop new materials for industrial production. There is a diversity of biological technology types, and different technologies have different priorities for invention. This study examines the factors that are important for the invention of biology-related technologies in Japan using patent application data and a decomposition analysis framework. As the results show, patent applications related to biochemistry and biotechnology increased until 1995 because of the expanded scale of R&D activities and the high priority assigned to biological technology. However, the number of patent applications stagnated after 1995, because the importance of biochemistry, especially waste-gas treatment technologies, decreased. Additionally, patent applications for medicines and disease-related technologies increased rapidly from 1971 to 1995. The primary determinant of rapid growth is an increase in research priority, especially among firms in the chemical industry whose technologies are related to supplemental foods and foods with health-promoting benefits. Finally, patent applications involving foodstuff- and agriculture-related technologies increased from 1971 to 1995 due to increased R&D and the increased priority of biological technology.

1. Introduction

The development of biological technology allows us to invent new medical technologies, as well as food production and reserve technologies. Additionally, the development of biological technology creates job opportunities and adds value to a nation’s industries through the bioeconomy [1]. Battelle [2] notes that the U.S. biopharmaceutical sector contributes substantially to national, state and local economies. Both directly and indirectly, it supported approximately 3.4 million U.S. jobs in 2011, including 813,523 direct jobs. Brookes and Barfoot [3] note that the commercialization of genetically-modified crops has continued to occur at a rapid rate, and there have been very significant net economic benefits at the farm level of $18.8 billion in 2012 and $116.6 billion over a 17-year period.
The global importance of biological technology has been increasing. Biological technology, especially life science and nanotechnology, is listed as a high priority in Japan’s 5th Science and Technology Basic Plan, which covers from 2016 to 2020. Similarly, the German government formed the National Research Strategy Bioeconomy 2030 to strengthen the competitiveness of German industries on a global scale. These research and development (R&D) strategies focus on the expansion of the biological products and services market and are intended to improve international market competitiveness.
Furthermore, biological technology provides solutions for food security; it is believed that in the future, food security will be a more serious problem because of an increase in population and climate change. For example, from 2011 to 2014, the U.K. government budgeted approximately 4400 million pounds for global food security and life science innovation promotion. The Chinese government selected the biological industry as a priority industry in its Twelfth 5-year Plan, designating gene recombination, new medicines and epidemiology as its most important projects. Thus, biological technologies are among the most important in the world, and the development of biological technology is one of the most competitive endeavors in the world.
Private companies apply for the largest number of biological patents. Therefore, it would be useful to identify the determinants of corporate decision making regarding biological patent inventions to design effective policies to encourage these inventions. Therefore, this study analyzes the determinants of biological patent inventions, focusing on private companies’ decision making processes.
This study’s objective is to clarify the determinants of biological patent applications by technology type using a dataset of Japanese manufacturing companies. We also use this company dataset to discuss how industrial characteristics affect the invention of biological technology in Japan.
The remainder of this paper is organized as follows. Section 2 explains the background of this research. Section 3 introduces previous research on biological technology development. Section 4 describes our methodology. Section 5 describes the dataset. The results of the biological patent analysis are discussed in Section 6, and the paper concludes with Section 7.

2. Background

Biological technology involves real-world risks and ethical issues. Thus, the development and application of biological technology requires regulations and policies. Table 1 shows international events and restrictions related to biological technology.
As shown in this table, the number of discussions and institutions related to biological technology accelerated after the Convention on Biological Diversity in 1993. Additionally, the Human Genome Project, which began in 1990, contributed not only to an increase in scientific knowledge regarding gene sequences, but also to an improvement in genomic analysis. Allarakhia and Wensley [5] explain that the completion of the Human Genome Project advanced the view that biological information operates on multiple hierarchical levels and is processed in complex networks. From the results of their study, a new hierarchical framework for biological knowledge is being constructed to enable an understanding of the relationships between the various levels of biological information.
In the meantime, the definition of biological technology is diverse. The Organisation for Economic Co-operation and Development (OECD) [6] defines biotechnology as “the application of science and technology to living organisms, as well as parts, products and models thereof, to alter living or non-living materials for the production of knowledge, goods and services”. Oldham [7] classifies patent items related to biodiversity and traditional knowledge using nine technological categories, including foodstuffs, medicine and biotechnology.
However, not every biological technology makes an equal contribution to improved corporate financial performance. Some biological technologies contribute directly to creating new medicines or disease-resistant seeds for which there is a huge market demand, whereas others contribute indirectly and minimally. Oldham [7] notes, “Biodiversity and traditional knowledge are employed in a wide variety of sectors with different characteristics, markets and actors. In an era of emerging developments such as genomics, proteomics, bioinformatics, systems biology and other transformations in science and innovation it is also important to move beyond an overly narrow focus on pharmaceutical compounds that has tended to dominate debates on access and benefit sharing”.
Therefore, it is clear that companies’ incentives to generate biological technology inventions vary by type of technology. A determinant analysis of inventions focusing on the characteristics of each type of biological technology is important for formulating an effective policy that encourages R&D in biological technology. For that reason, this study focuses on the characteristics of biological technology.
That aim notwithstanding, it is difficult to identify the biological technologies that fall within the definition set forth above. Thus, we focus on patent application data for three biological technology groups defined using the International Patent Classification (IPC) grouping introduced by Oldham [7]. Table 2 summarizes the following three biological technologies: (1) biochemistry and biotechnology; (2) medicine and disease; and (3) foodstuff and agriculture.

3. Literature Review

Many previous studies of biological technology have used patent data analysis. Oldham et al. [8] identify 76,274 Latin species names from 23,882 genera in 767,955 patent documents. In the claims sections of 136,880 patent documents, 25,595 species appeared. These figures reveal that innovative human activity involving biodiversity, as reflected in the patent system, focuses on approximately 4% of taxonomically-described species and 0.8%–1.0% of predicted global species.
Magerman et al. [9] investigated whether involvement in patenting hampers the dissemination of a scientist’s published research, which is both relevant and important. Those authors examine a large dataset consisting of 948,432 scientific publications and 88,248 patent documents from the European Patent Office and the U.S. Patent and Trademark Office and identify 584 patent-paper pairs. They conclude that involvement in patenting does not hamper the dissemination of published biotechnology research.
Additionally, the existing literature notes problems with the patent registration system related to genes and biology. For example, Lawson [10] says, “We don't know whether the access price properly reflects the true costs of biodiversity conservation, and what are the role and place of patents in addressing the price of access”. Arnaud-Haond et al. [11] clarify that patent claims associated with marine genes originate from only 31 of the world’s 194 countries. Ten countries own 90% of the patents deposited that are associated with marine genes, with 70% belonging to the top three countries, i.e., the U.S., Germany and Japan.
Firm-level analysis of biological technology has increased in recent years. Hall and Bagchi-Sen [12] analyzed firm-level innovation strategies using patent and survey data for 424 U.S. biotechnology companies. Kang and Park [13] examined the influence of government R&D support and inter-firm collaborations on innovation in 147 Korean biotechnology companies using patent and survey data. In addition to these innovation studies, Petruzzelli et al. [14] clarified the determinants of patent citations in biological technology, focusing on patent influence using data for 293 U.S. biotechnology companies from 1976 to 2003.
Previous studies have primarily focused on national-level patent data for biological technology. Recent studies have analyzed company-level data, but most of these focus on aggregate biological patent data that do not reflect the priority assigned to the development of specific technologies. However, it is clear that business decision making mechanisms for investing in R&D vary because incentives depend on the manner in which biological technology is used. Thus, effective policies for promoting biological technology invention differ according to the type of technology involved. It is therefore necessary to analyze biological technology development by focusing on various types of patents using company-level data.
This study focuses on the biological technology inventions of Japanese manufacturing companies because, after the U.S., Japan is the second-largest biotechnology innovator in the world [15]. Although many studies have addressed biological technology, most of those studies address technologies invented in the U.S. and Europe. One interpretation of this trend is that the data related to patent applications and grants in the U.S. and Europe are open and available in multiple languages [16]. According to Daly [17] and Fujii et al. [18], Japan and the U.S. have different entrepreneurship and business cultures. Additionally, Japanese manufacturing firms have developed their own R&D cultures and strategies. Another reason that we focused on Japan is the high availability of company-level data in Japanese. Therefore, we believe that an empirical study of Japanese manufacturing companies will provide information that is useful for understanding inventions in biological technology around the world.

4. Methodology

We apply a decomposition analysis framework to clarify the changing factors involved in biological patent applications in Japan. The novel aspect of this research is that it clarifies companies’ R&D strategies using logarithmic mean Divisia index (LMDI) analysis. Many previous studies have focused only on the number of patent applications, which is affected by both the priority of inventions and the scale of research activities. This study attempts to derive the pure priority of inventions from patent application data by controlling for scale effects. Fujii [19] applies a decomposition framework in a patent data analysis using these two factors, priority and scale. In this study, we propose a new approach to clarifying the determinants of patent applications using three factors, the priority, scale and importance of the technological category.
According to Allarakhia and Wensley [20] and Allarakhia and Steven [21], a new biological paradigm, systems biology, has emerged since the completion of the Human Genome Project. Systems biology allows us to determine how biological information operates on multiple hierarchical levels. Therefore, the importance of the biological technology category has rapidly increased in recent years. Considering both the macro (technology category) and micro (specific technology) views of biological technology development allows us to understand their relative importance to technology development. To decompose patent applications in the field of biological technology, we use three indicators: the priority of a specific biological technology (PRIORITY), the importance of a biological technology among all patent applications (BIOLOGY) and the scale of patent applications (SCALE). This decomposition research framework was adapted from the existing literature and modified by the authors.
We define the PRIORITY indicator as the number of specific biological patent applications divided by the total number of biological patent applications, yielding the share of specific biological patent applications among total biological patent applications. This indicator increases if the number of specific biological patent applications increases more quickly than the total number of biological patent applications, thus indicating that inventors concentrate their research resources in specific biological technology inventions. Inventors prioritize a specific biological technology over other types of biological technology if the PRIORITY value is higher.
Similarly, the BIOLOGY indicator is defined as the total number of biological patent applications divided by the total number of patent applications, which yields the share of total biological patent applications of total patent applications. This indicator increases if the number of total biological patent applications increases more quickly than the number of total patent applications, thus indicating that inventors concentrate their research resources in biological technology inventions. Inventors prioritize the invention of biological technology over other types of technology if the BIOLOGY value is higher.
The SCALE indicator is defined as the total number of patent applications and thus represents the scale of R&D activities. Generally, active R&D efforts promote the invention of new technologies. Thus, the total number of patent applications reflects the level of active R&D efforts. Additionally, the R&D activities of companies depend on their corporate financial situations, because patent applications are associated with costs, such as the researchers’ salaries, the operating cost of experimental materials and the cost of applying for the patent. For example, the number of patent applications declined after the financial crisis triggered by the collapse of Lehman Brothers [22]. Thus, companies with serious financial difficulties decided to decrease their R&D activities to reduce their risk of bankruptcy. This decrease in R&D activities caused a decline in the number of new patent applications, including those related to biological technologies. Therefore, the scale of R&D activity is an important factor in understanding why the number of biological patent applications changes. SCALE may increase if the total number of patent applications increases. The number of patent applications for biological technology increases due to an increase in overall R&D activities if the SCALE score increases.
Here, we introduce the decomposition approach, using foodstuff and agriculture patents as an example biological patent category (see Table 2). The number of foodstuff and agriculture patent applications (FOOD) is decomposed using total biological patent applications (BIOTOTAL) and total patent applications (TOTAL) as in Equation (1).
FOOD = FOOD BIOTOTAL × BIOTOTAL TOTAL × TOTAL = PRIORITY × BIOLOGY × SCALE
We also consider the change in foodstuff and agriculture patent applications from year t (FOODt) to year t+1 (FOODt+1). Using Equation (1), the growth ratio of foodstuff and agriculture patent applications can be represented as follows:
FOOD t + 1 FOOD t = PRIORITY t + 1 PRIORITY t × BIOLOGY t + 1 BIOLOGY t × SCALE t + 1 SCALE t
We transform Equation (2) into a natural logarithmic function and thus obtain Equation (3). In this transformation, any zero values in the dataset cause problems in the decomposition because of the properties of logarithmic functions. To solve this problem, the LMDI literature suggests replacing zero values with a small positive number [23].
lnFOOD t + 1 lnFOOD t = ln ( PRIORITY t + 1 PRIORITY t ) + ln ( BIOLOGY t + 1 BIOLOGY t ) + ln ( SCALE t + 1 SCALE t )
Multiplying both sides of Equation (3) by ω i t = ( FOOD t + 1 FOOD t ) / ( lnFOOD t + 1 lnFOOD t ) yields Equation (4), as follows. Here, ω i t = 0 if FOODt+1 = FOODt.
FOOD t + 1 FOOD t = Δ FOOD t , t + 1 = ω i t ln ( PRIORITY t + 1 PRIORITY t ) + ω i t ln ( BIOLOGY t + 1 BIOLOGY t ) + ω i t ln ( SCALE t + 1 SCALE t )
Therefore, changes in the number of patent applications of foodstuff and agriculture technology (ΔFOOD) are decomposed by changes in PRIORITY (first term), BIOLOGY (second term) and SCALE (third term). The term ω i t operates as an additive weight for the estimated number of foodstuff and agriculture technology patent applications. This LMDI decomposition technique was developed by Ang et al. [24]. Ang [25] notes that LMDI is the preferred method for decomposition analysis because of its theoretical foundation, adaptability and ease of use and results interpretation, without the residual terms generated by Laspeyres-type methodologies.

5. Data

We used patent application data from the patent database published by the Institute of Intellectual Property (IIP) [26]. The IIP Patent database covers 12,367,268 patent applications from 1964 to 2012. The IIP patent database was constructed using standardized data from the Japan Patent Office through its 25th release. We specified biological technology patents based on Oldham’s research [7]. As explained above, this study focuses on three biological technologies: (1) biochemistry and biotechnology (biochemistry); (2) medicine and disease (medicine); and (3) foodstuff and agriculture (food).
Previous studies have used two types of patent data in their analyses. The first is the number of patents granted [26,27], which represents the number of qualifying patent applications. These data are primarily used to examine the diffusion of technologies. However, these data do not include patents that are not granted. Thus, data on granted patents do not cover inventors’ research, nor do they cover development strategies and activities.
The other type is patent application data [19]. Patent application data can reflect inventors’ R&D activities. However, some of these applications do not pass the examination process, which suggests that the invention does not merit a patent. Additionally, because an application fee is required, inventors are likely to be confident that their invention will pass the examination process if they submit a new patent application. Therefore, we believe that patent application data reflect inventors’ R&D activities and strategies to a greater extent than data on granted patents. We thus used patent application data to represent inventors’ R&D strategies for biological technologies.
Here, we elaborate the trends in biological patent applications by type of industry. Table 3 shows the number of biological patent applications for each industry from 1971 to 2010. The Japan Standard Industrial Classification (JSIC) was used to categorize industry type. The number of biological patent applications increased rapidly in the 1980s, especially in biotechnology fields. One explanation for this increase is the development of experimental equipment.
Table 3 shows that industrial characteristics strongly affected patent application trends. According to Table 3, the chemical industry was the largest source of biological patent applications in Japan from 1971 to 2010, although patent applications in biochemistry and biotechnology were filed by companies in many industries. Medicine and disease technology and foodstuff and agriculture technology are the two industry groups with the most patent applications.
Table 4 lists the companies that filed biological patent applications from 1971 to 2010. The table also shows that the top five companies contributed only 11.4% of applications in biochemistry and biotechnology, 10.86% of those in medicine and disease and 13.11% of those in foodstuff and agriculture technology. The small share contributed by the top five companies implies that many inventors in many fields file these patent applications.
Interestingly, Table 4 indicates that Panasonic Corporation ranked in the top five patent application companies in three biological technology fields despite being an electronics company. One interpretation of these results is that Panasonic Corporation prioritized biological technology as an important factor in its development of electronic products.

6. Results and Discussion

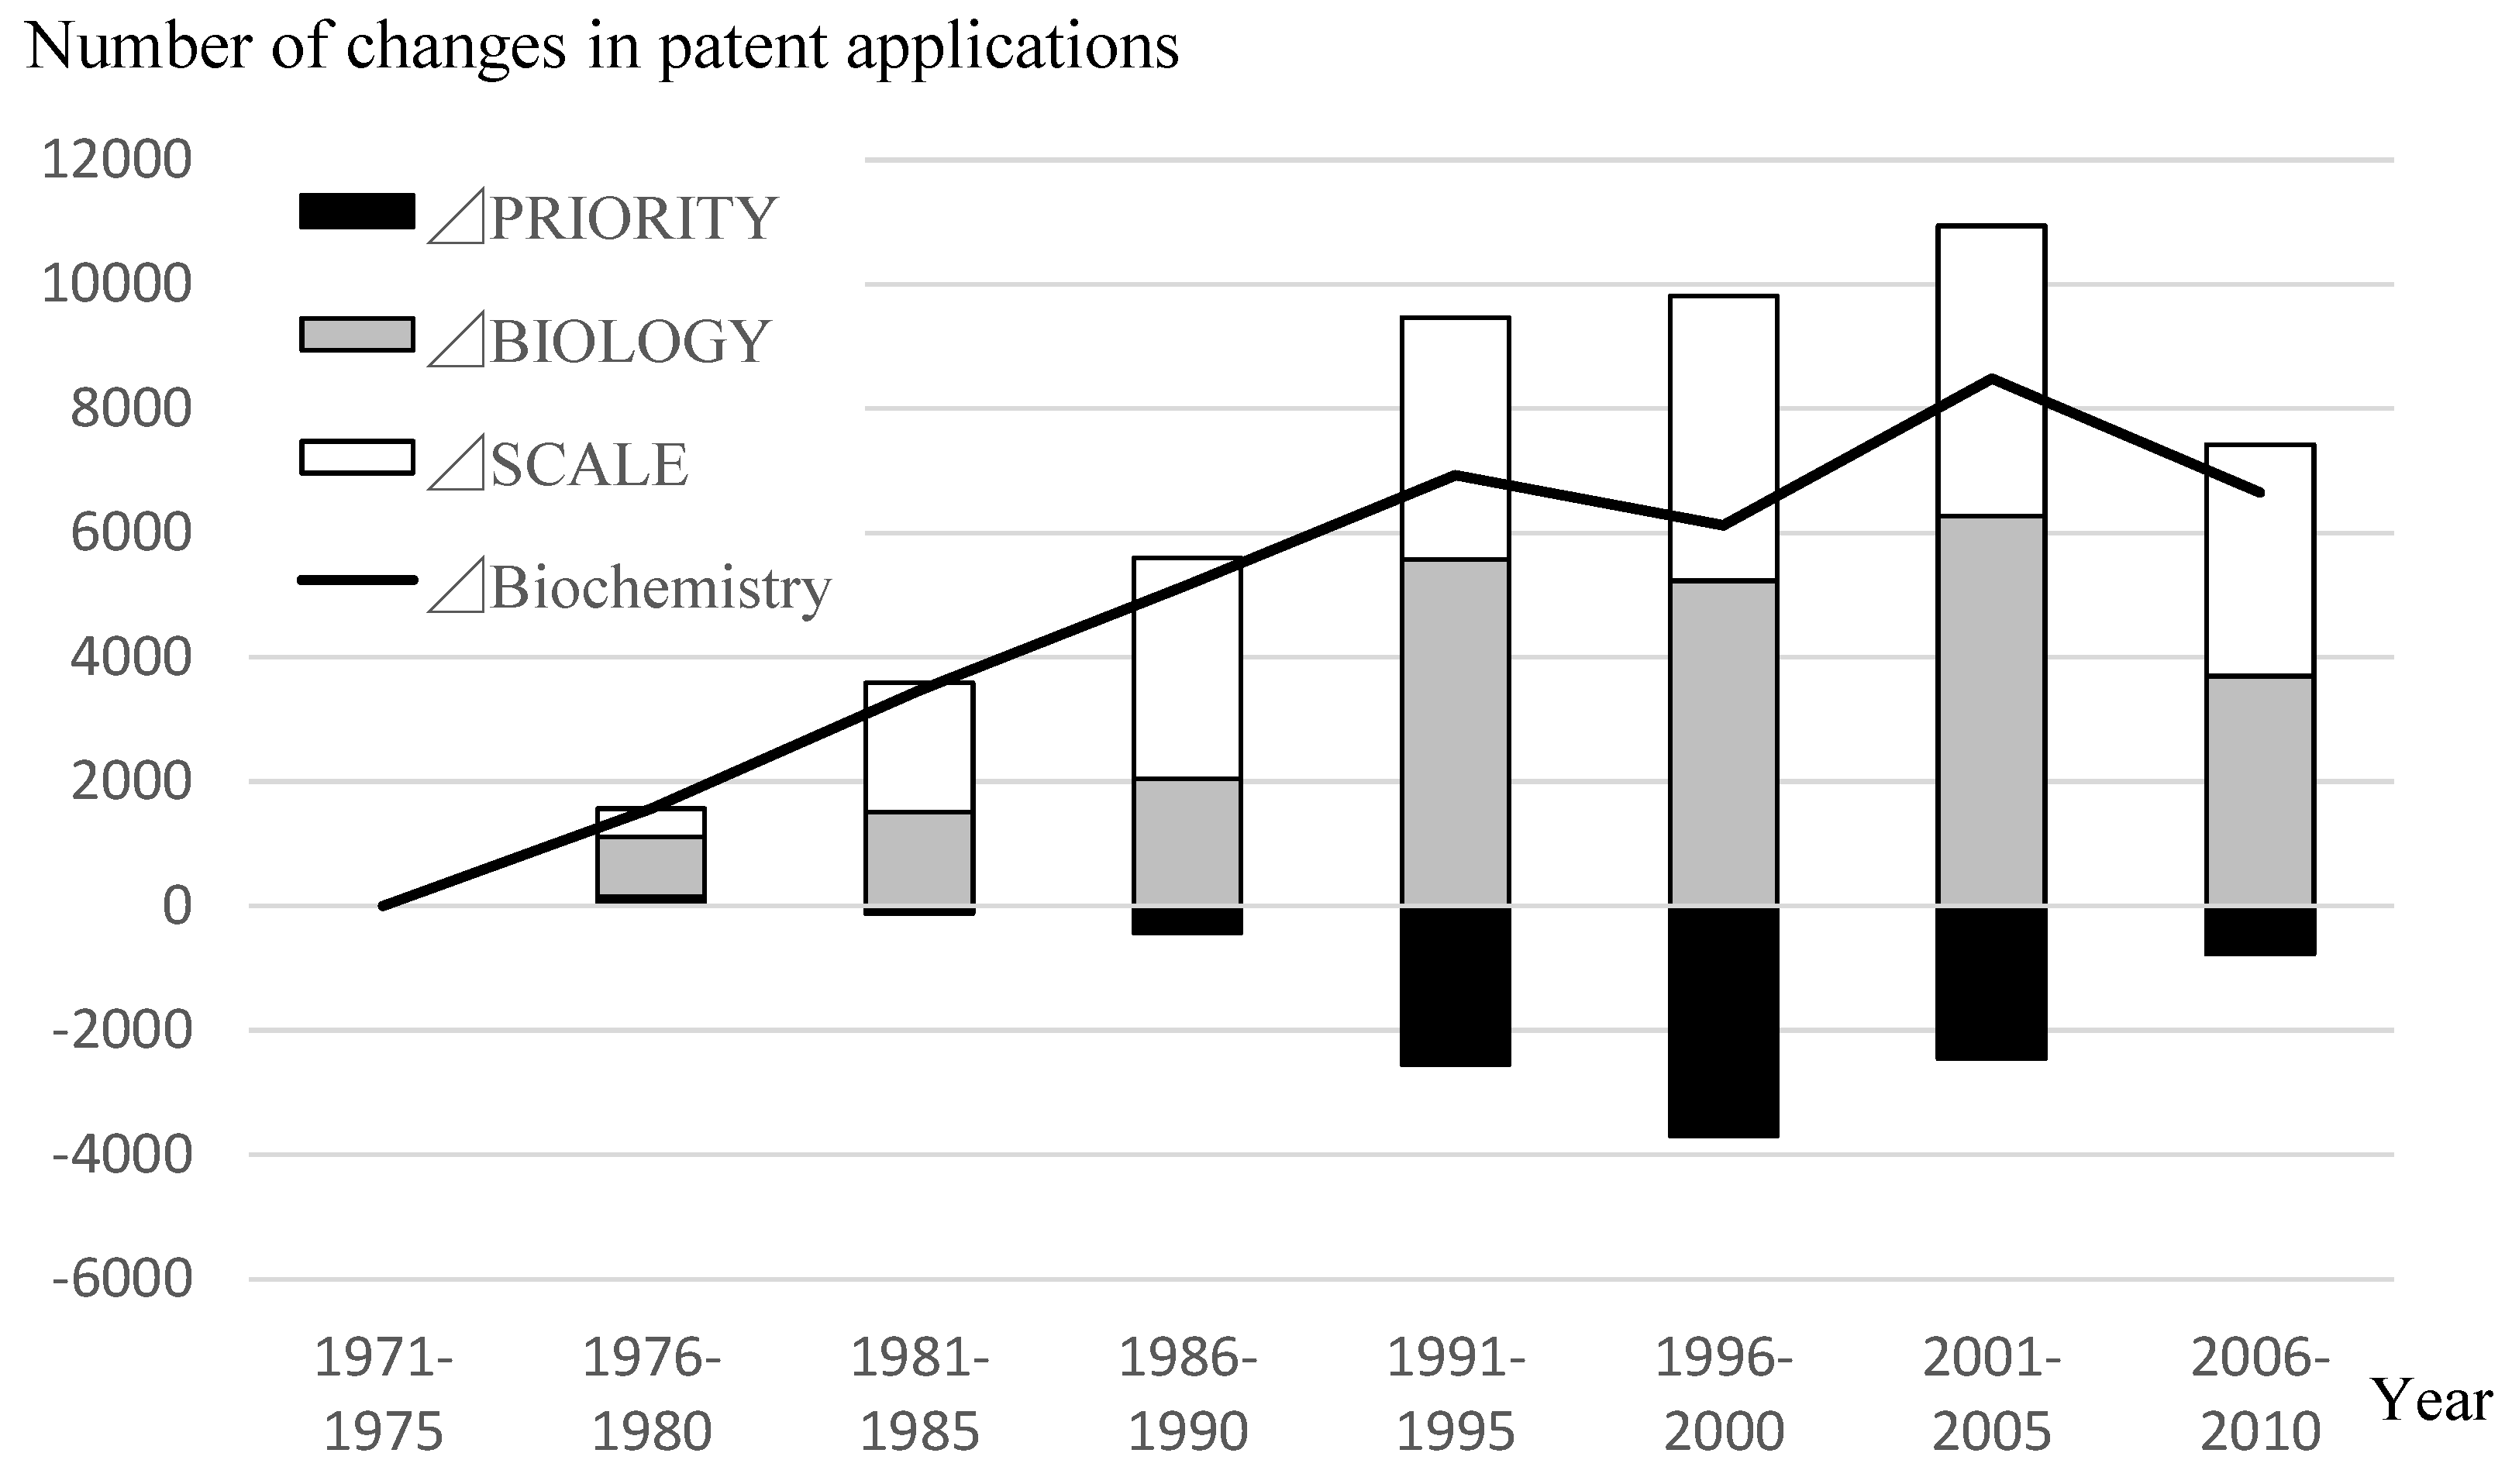
6.1. Biotechnology and Biochemistry Technology

Figure 1, Figure 2 and Figure 3 show the trends for patent applications related to biological technology. The plotted line shows the number of patent applications, and the bar chart shows the effects of each factor on the number of patent applications related to specific biological technologies. The sum of the bars is equivalent to the value of the plotted line. The figures show the differences in the determinants of patent applications by type of biological technology. We divided the whole period of analysis into eight subperiods with five-year intervals to facilitate the discussion of the results. We then examined whether the pattern of technology development varied by period.
Figure 1 shows the results of the decomposition analysis of patent applications in biochemistry and biotechnology. According to Figure 1, patent applications related to biochemistry and biotechnology increased because of the expansion of the scale of R&D activities and increased priority of biological technology from 1971 to 1995. However, the lower priority given to biochemical and biotechnology inventions contributed to decreasing patent applications from 1991 to 2000. These trends show that the number of patent applications for biochemistry and biotechnology as a share of total biological technology declined in the 1990s, showing that inventors allocated their R&D resources to other biological technology fields.
During this period, patent applications for fermentation or enzymes using processes to synthesize chemicals and chemical or biological purification of waste gases decreased rapidly in Japan. One interpretation of this trend is that market demand for these technologies decreased because of the development of substantial technologies (e.g., the development of end-of-pipe technology).
In the meantime, patent applications for technologies involving mutation or genetic engineering, DNA or RNA concerning genetics increased rapidly during the 1990s. We believe that the development of equipment for experiments and the Human Genome Project contributed to increased patent applications in these fields. The development of equipment for experiments also contributed to the growth of patent applications in other biological technologies, which is one reason why a positive score for the biology factor is observed in Figure 1 for 1991.
Additionally, patent applications for inventions involving biochemistry and biotechnology declined from 2006 to 2010. One interpretation of this trend is that the global financial crisis forced private companies to cut R&D expenditures. The 2015 Japan Patent Office Annual Report indicates that the primary reason for this dramatic decline was the economic recession triggered by the 2008 collapse of Lehman Brothers. R&D expenditures by private companies declined during this period because corporate financial performance, which is strongly related to bankruptcy risk, deteriorated [28]. Therefore, the decrease in the scale factor after 2008 was caused by the financial crisis.
Finally, the priority of biochemistry and biotechnology declined to zero during the period from 2006 to 2010. This result shows that the share of biochemistry and biotechnology patents of total biological technology patents from 2006 to 2010 was nearly the same as from 1971 to 1975. From these results, we believe that patent applications in biochemistry and biotechnology increased from 1971 to 2010 primarily because of the expansion of the scale of R&D activities and the increased priority of the entire field of biological technology.

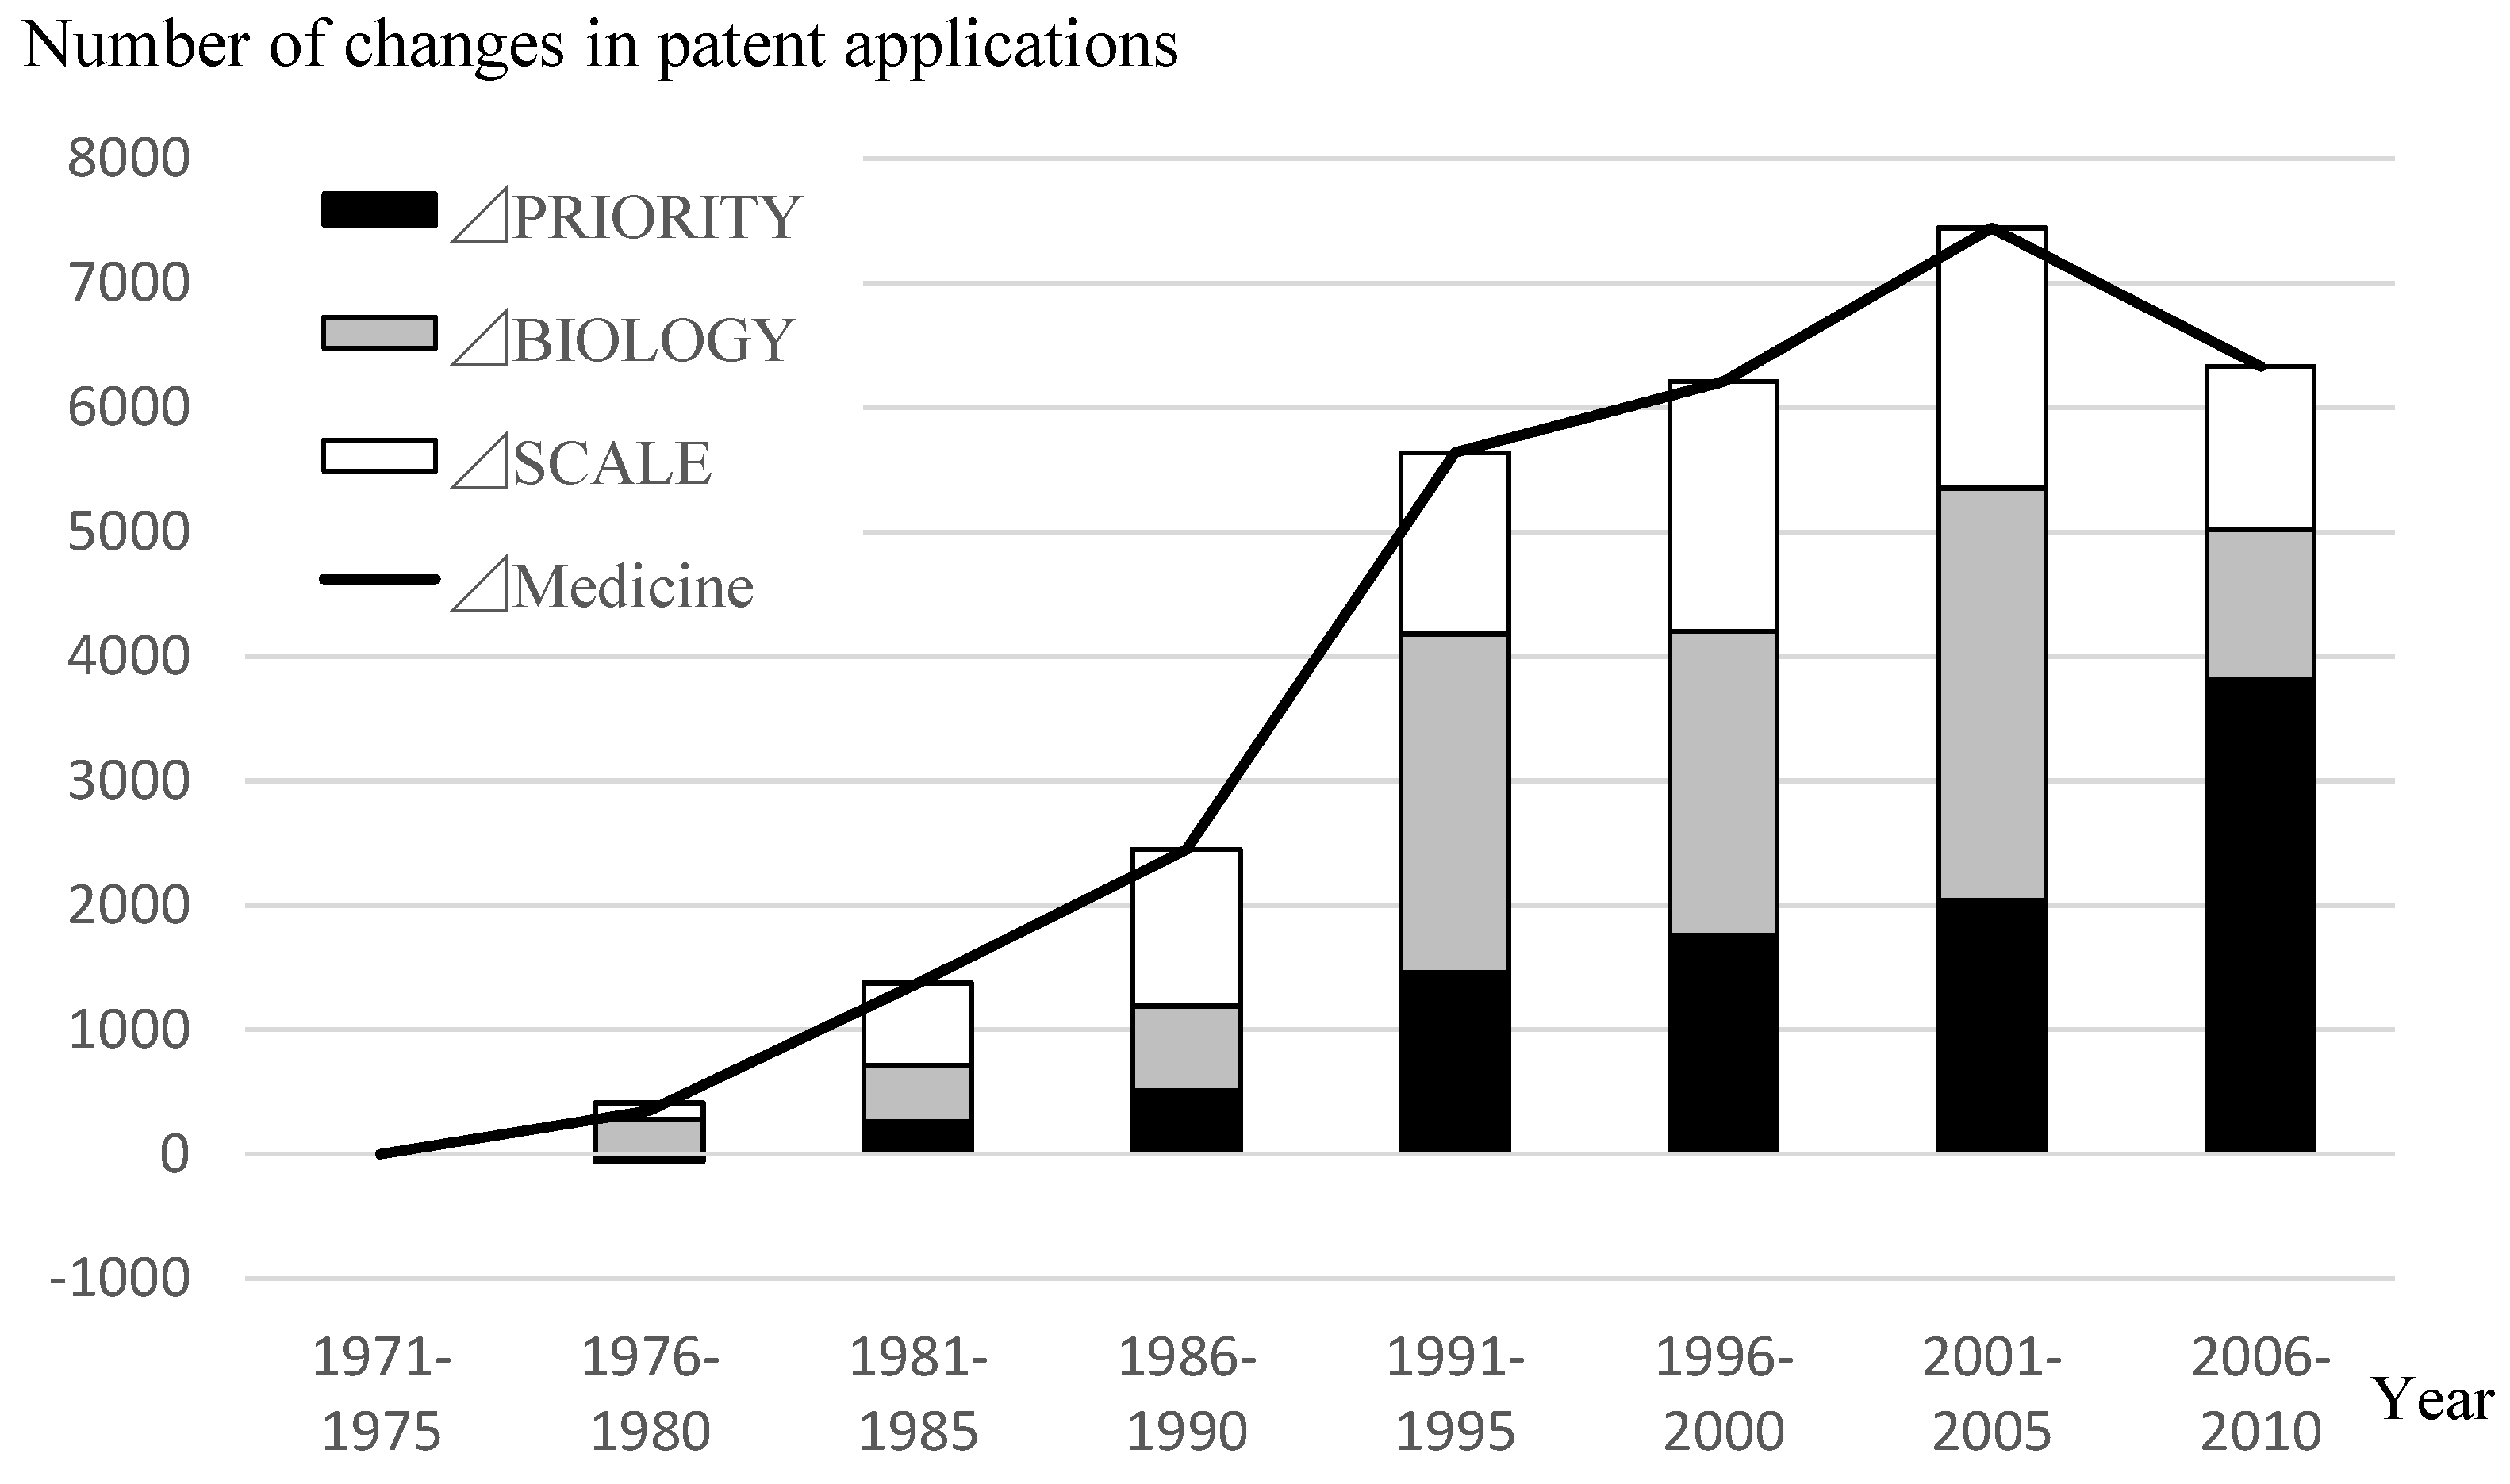
6.2. Medicine and Disease Technology

Next, we consider the result of the decomposition analysis of patent applications in medicine and disease technology. Figure 2 shows that patent applications related to medicine and disease increased rapidly from 1971 to 2005 because of the growth of three factors. Specifically, the priority of biological patents increased from 1991 to 1995. However, the priority of biological patents and scale factors declined from 2006 to 2010 because of the financial crisis. The unique trend shown is that the priority of patent applications specific to medicine and disease increased rapidly during this period. These results show that the trend in patent applications related to medicine and disease differs from those related to other technologies.
During this period, patent applications for medicinal preparations containing organic active ingredients increased rapidly in Japan. According to Jargosch and Jurich [29], the technology of medicinal preparations containing organic active ingredients represented approximately 65% of the top 10 patent application technologies filed by Pfizer Inc. from 1994 to 2013. This technology category included the production of encapsulated medicines using new organic molecules, which were expected to be more medically effective.
Technologies involving medicinal preparations containing organic active ingredients also include the development of supplementary food products, which also affect diet and lower cholesterol. For example, Kao Corporation applied for patents in this technology category for medicinal preparations containing organic active ingredients to develop supplementary food products and supplemental drinks, including Healthya branded water, tea and coffee. According to Kao [30], “Kao Corporation launched Healthya Coffee, the first coffee beverage from the Healthya series, on 4 April 2013. The new drink contains a high level of polyphenol coffee chlorogenic acid and is approved as Food for Specified Health Use because of its ability to enhance the utilization of body fat as energy”. The Healthya brand provides food products that target specific health issues to consumers and is popular in the Japanese market.
The technological development of supplemental diet foods has been prompted by changes to the Japanese lifestyle, specifically high-calorie diets combined with low levels of exercise caused by the prominence of both vehicles and fast food in the 1980s. During this period, the Japanese economy flourished, and social activity followed trends of mass production, consumption and disuse. Meanwhile, the unhealthy effects of obesity were noted in developed countries. This social problem created a new market for supplemental foods in Japan.
Therefore, the market for supplemental foods and foods with health-promoting benefits is one reason for the growth in the priority of patent applications related to medicine and disease in the 1990s. Although the Kao Corporation is not a medicinal product firm, it files the second-largest number of patent applications related to medicine and disease in Japan (see Table 4).

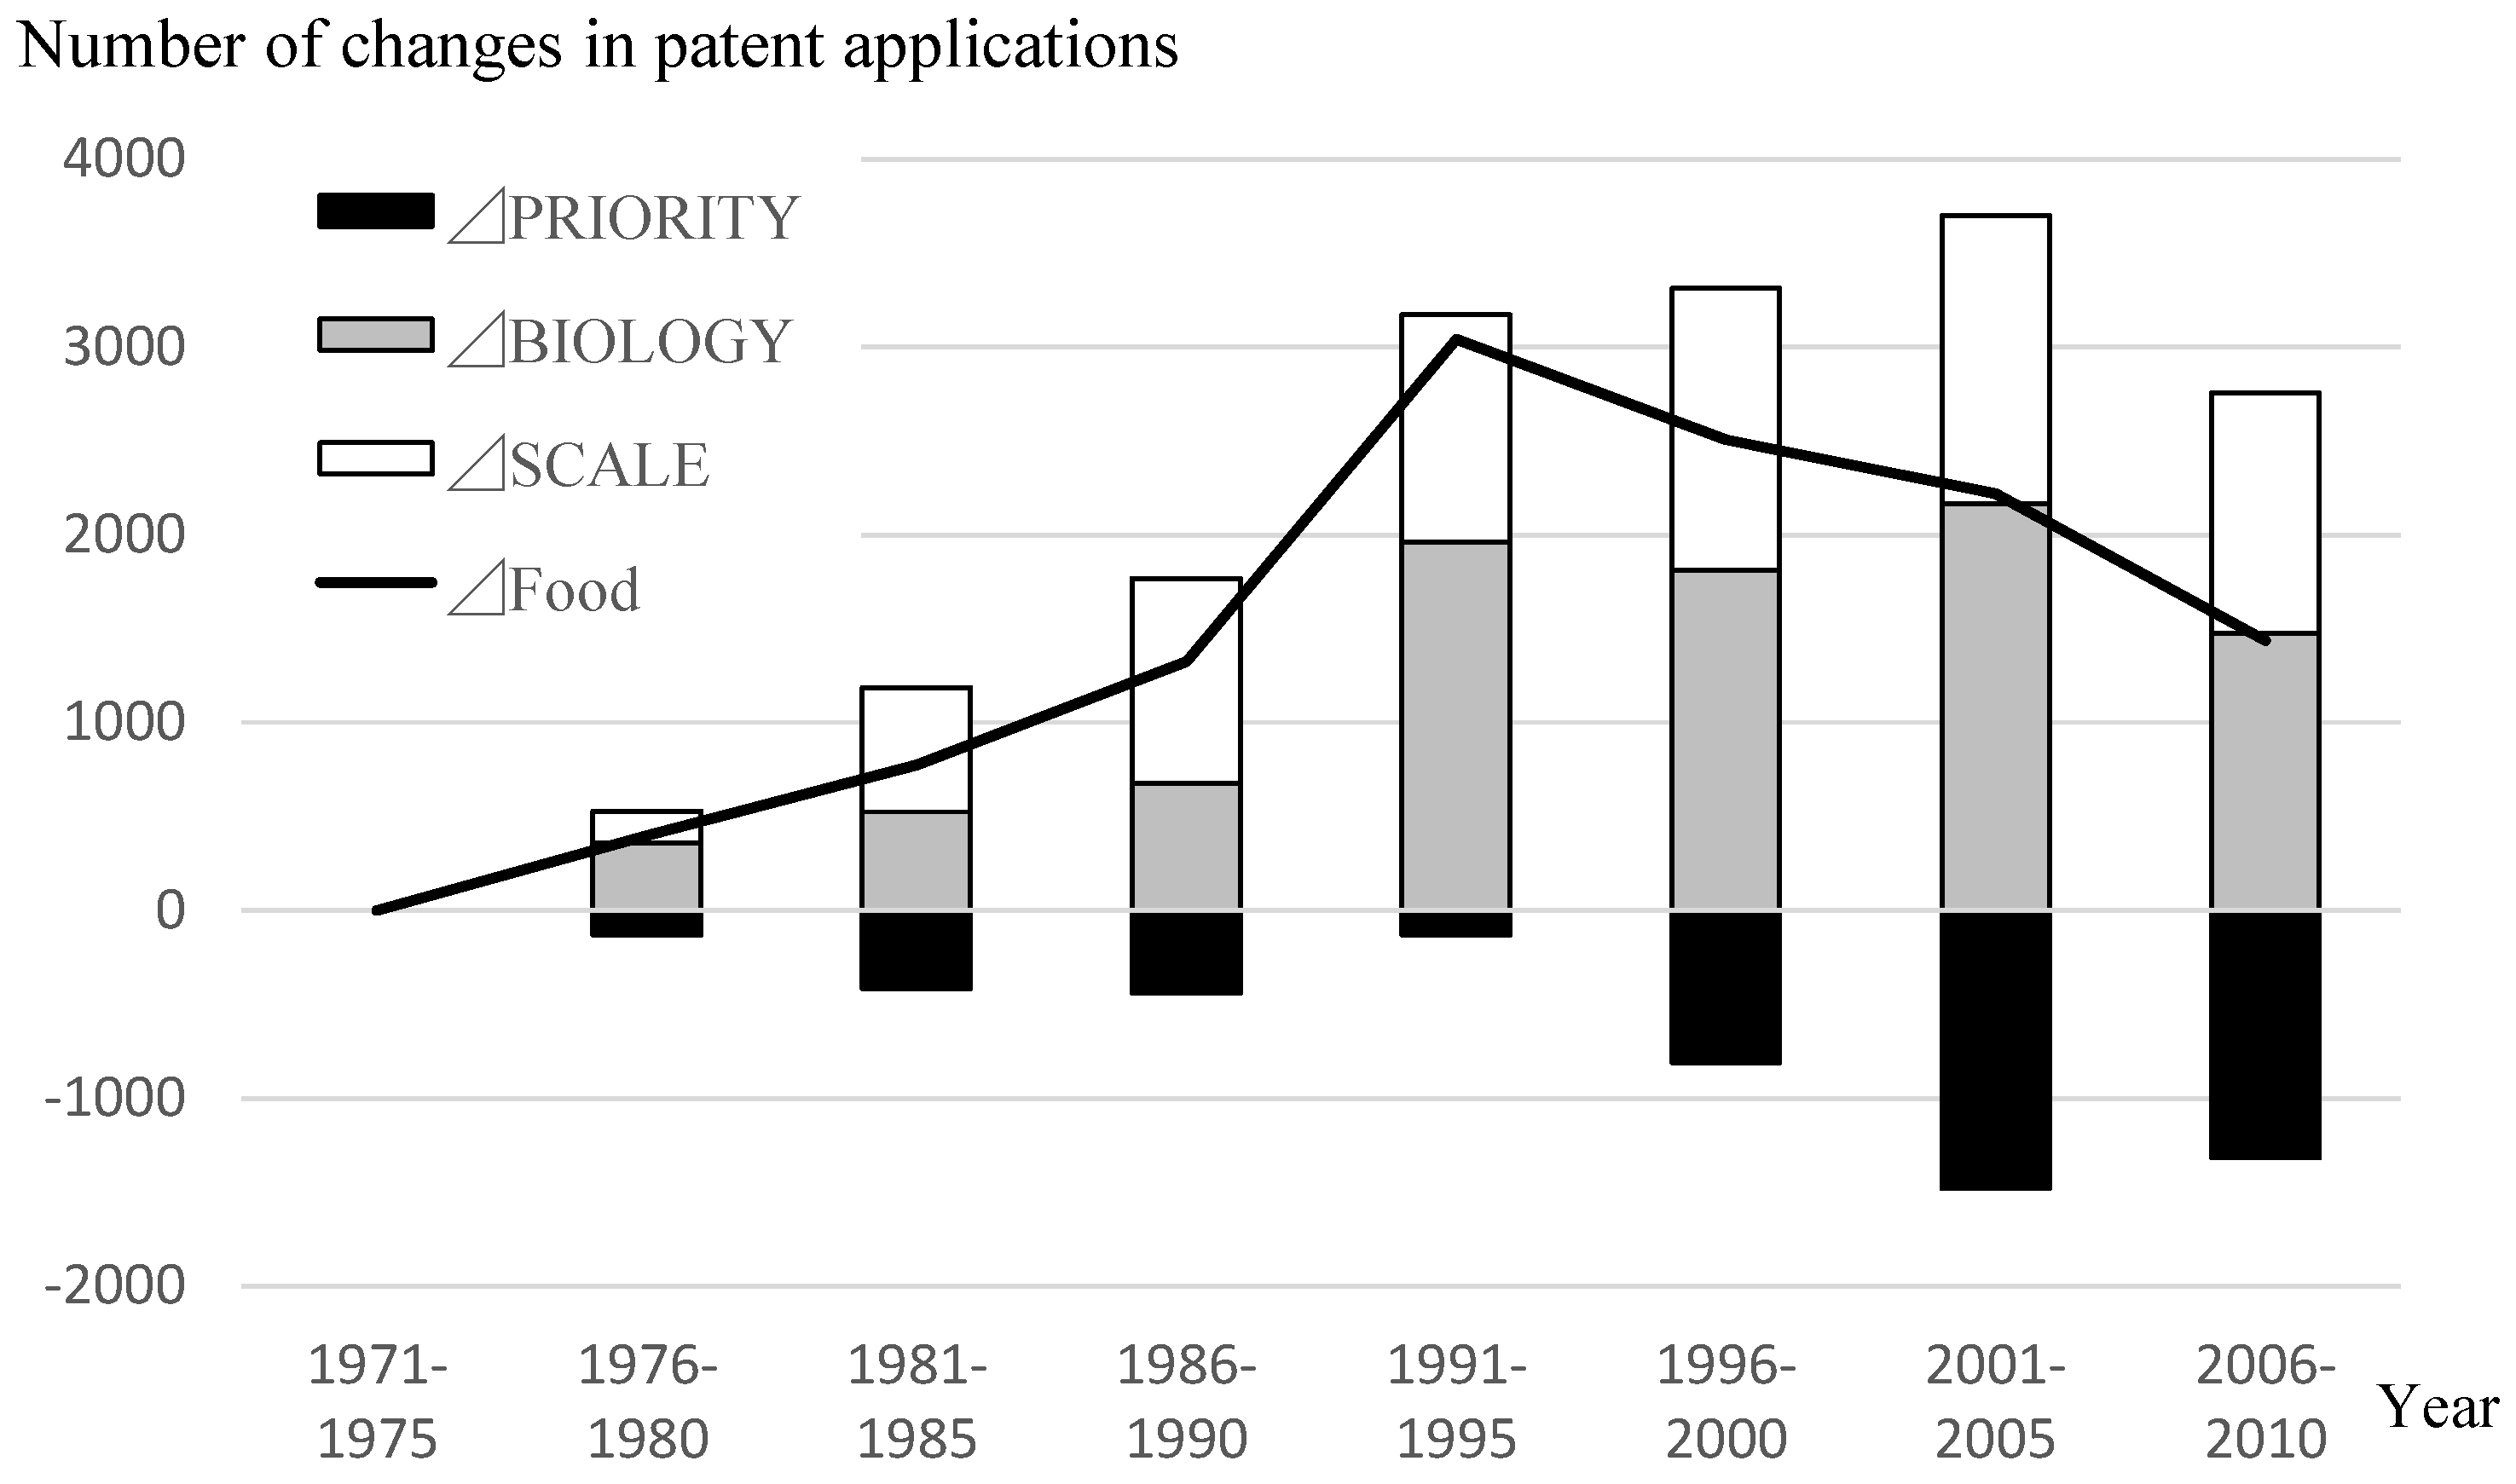
6.3. Foodstuff and Agriculture Technology

Figure 3 shows the results of the decomposition analysis in foodstuff and agriculture technologies. As shown in Figure 3, the priority factor negatively affected patent applications after 1996 in Japan. This trend differs in Japan compared to other countries. According to Singh et al. [31], the number of patent applications involving genetically-modified (GM) crops increased rapidly, especially in the U.S.
Meanwhile, Japanese consumers were unwilling to consume GM crops. Umeda [32] noted, “Although it is legal to plant GM crops in Japan if certain procedures are followed, no commercial planting of GM crops (aside from ornamental flowers) is occurring in Japan at this time, mainly because the general public is skeptical about the safety of GM crops”. This trend can be confirmed by recent academic research.
Fischer et al. [33] systematically reviewed the literature on GM crops in agriculture and clarified the country rankings based on the amount, in millions of hectares, of GM crops planted and their appearance in the academic literature: Japan is not included among the top 20 countries in the world. Therefore, Japanese companies’ incentives to invent GM crop technologies were relatively low compared to those of companies in other countries.
Additionally, the priority of specific foodstuff and agriculture technologies declined from 1996 to 2000 because patent applications in plant reproduction by tissue culture techniques and preservation of foods or foodstuffs technologies declined rapidly.
Finally, we compare patent application trends in three technology groups. The priorities assigned to specific technologies have a positive effect on increasing patent applications in medicine and disease technology. Meanwhile, no increase in applications related to biochemistry and biotechnology is observed, while in foodstuff and agriculture, the trend is negative. The differences in priority among the three specific technology groups can be clarified by applying the decomposition analysis framework proposed in this study, which we believe is the novelty of this study.

7. Conclusions

This study examined the determinants of biological patent applications in Japan from 1971 to 2010. We focused on the following three biological technologies: (1) biochemistry and biotechnology; (2) medicine and disease; and (3) foodstuff and agriculture. We clarified the determining factors for patent applications related to these three technologies by applying an LMDI decomposition analysis. We obtained the following results.
First, until 1995, patent applications related to biochemistry and biotechnology increased because of the expansion of the scale of R&D activities and the increased priority of biological technology. However, the number of applications stagnated after 1995 because the priority of biochemistry decreased, especially for waste-gas treatment technologies. Additionally, patent applications decreased after 2006 because R&D was scaled down during the financial crisis.
Second, the number of patent applications involving medicine and disease technologies increased rapidly from 1971 to 1995. The primary determinant of rapid growth was an increase in the research priority, especially for technologies for supplemental foods and foods with health-promoting benefits, among chemical industry firms.
Third, patent applications related to foodstuff and agriculture technology increased from 1971 to 1995 because R&D was scaled up and the priority of biological technology increased; however, the number of applications decreased after 1991 because of a decline in the priority of foodstuff and agriculture technologies. This trend was caused by the low market demand for GM products in Japan.
Finally, we explain the utility of the decomposition framework for biological patent applications. From the above results, we can better understand the research priority of each technological invention. Changes in research priorities are important factors in encouraging private firms to invent new technologies. Today, many governments design their policies and subsidies to encourage private firms to invent biological technologies; however, it is difficult to clarify how these policies and subsidies motivate private firms to invent biological technologies, because private firms have various motivations for inventing different types of biological technologies. Additionally, the determinants of biological technologies vary by technology type.
We believe that the new decomposition analysis application proposed in this study is useful for understanding inventors’ changed priorities. Additionally, a comparison of the scale effect, prioritization of the entire field of biological technology and prioritization of specific technology is useful for understanding changes in patent application activities. A limitation of this study is the difficulty of clarifying the effects of policies and subsidies on biological technology development activities. Therefore, further research is needed to develop the research framework to consider the causal relationship between corporate priority changes and factors external to the company (e.g., subsidies). Identifying the determinants of corporate priority change is helpful for creating an effective policy for promoting biological technology development.
Additionally, patent indexes, which reflect patent citation networks, also provide important information for understanding the spillover effects in different research areas, the quality of patents and collaboration in corporate R&D activities. Recent studies develop many types of patent indexes focusing on the value of the patent [34], patent quality [35], patent citations [36] and patent novelty [37]. Thus, future research should develop the decomposition framework to address these patent indexes to clarify corporate priority changes.

Acknowledgments

This research was funded by the research program ‘‘Policy studies of environmental economics’’ by the Japanese Ministry of the Environment. The results and conclusions of this article do not necessary represent the views of the funding agencies.

Author Contributions

Hidemichi Fujii contributed to the construction of the dataset, the development of the methodology and the drafting the article; Kentaro Yoshida helped revise the introduction and discussion; Ken Sugimura assisted with the literature revision and conclusions.

Conflicts of Interest

The authors declare no conflict of interest.

Appendix

Table A1. Detail IPC code related to biochemistry and biotechnology.
IPC# of Patent ApplicationDescription
A01N63/02183Fermentates or substances produced by or extracted from microorganisms or animal material
A23F3/104Fermentation with addition of micro-organisms or enzymes
A23J3/200Proteins from microorganisms or unicellular algae
A23L1/10520Fermentation of farinaceous cereal or cereal material; Addition of enzymes or microorganisms (1/16, 1/185, 1/238 take precedence)
A23L2/843Clarifying or fining of non-alcoholic beverages; removing unwanted matter (purifying water C02F) using micro-organisms or biological material, e.g., enzymes
B01D37/360Biochemical methods
B01D53/345447Chemical or biological purification of waste gases
B01D59/360Separation by biological methods
B09C1/10454Reclamation of contaminated soil microbiologically or by using enzymes
C02F11/02282Biological treatment of sludge; devices thereof
C02F3/341693Biological treatment of water wastewater, or sewage characterised by microorganism used;
C02F9/140Multistep treatment of water, waste water, or sewage, at least one step being a biological treatment
C05F1126Organic fertilisers not covered by subclasses C05B, C05C, e.g., Fertilisers from waste or refuse. i.e., see 9/04, 11/10
C12M3723Apparatus for Enzymology or Microbiology
C12N19,660Microorganisms or Enzymes, compositions thereof; propagating, preserving, or maintaining microorganisms; Mutation or Genetic Engineering; Culture Media
C12P8707Fermentation or Enzyme using processes to synthesise chemical compounds
C12Q5194Measuring or testing processes involving enzymes or microorganisms
C12R1Indexing classifiers for microorganisms for sub-classes C12C to C12Q and C12S
C12S5Processes using enzymes or microorganisms to liberate, separate or purify pre-existing compound or composition. Note that under the following classes enzymes or microorganisms should also be classified under C12S: A21, A23, A61L, A62D, B01D 53, B08B, B09C, C01, C05F, C08, C09B, C09B, C09H, C10G, C13, C14C, C21B, C22B, C23F, C23G, D01C, D01F, D06L, D06M, D06P, D21C, D21H, F24F, F24J, F26B and H01M
C22B37180Extraction of metal compounds from ores or concentrates by wet processes with the aid of microorganisms or enzymes e.g., bacteria or algae
C40B40/020Libraries contained in or displayed by microorganisms, e.g., bacteria or animal cells; Libraries contained in or displayed by vectors, e.g., plasmids; Libraries containing only microorganisms or vectors
D06L3/113Bleaching fibres, threads, yarns, fabrics, feathers, or made-up fibrous goods, leather, or fur using enzymes
G01N 33/530Immunoassay; Biospecific binding assay; Materials thereof
G01N13/10430Investigating or analysing surface structures in atomic ranges using scanning-probe techniques
G01N27/327798Biochemical Electrodes
G01N33/481098Biological material, e.g., blood, urine; Haemocytometers
G01N33/54208as above, double or second antibody etc. [deleted in IPC8]
G01N33/550as above, relating to type of carrier etc. [deleted in IPC8]
G01N33/570as above, relating to specific disease i.e., hepatitis, cancer etc. [deleted in IPC8]
G01N33/68331as above, involving proteins, peptides or amino acids etc.
G01N33/7415as above, involving hormones
G01N33/762as above, Human chorionic gonadotropin
G01N33/782as above, Thyroid gland hormones
G01N33/881as above, involving prostaglandins
G01N33/9286as above, involving lipids, e.g., cholesterol
G21F9/1814Treating liquids, processing by biological processes
H01M8/1696Biochemical fuel cells, i.e., cells in which microorganisms function as catalysts
Table A2. Detail IPC code related to foodstuff and agriculture.
IPC# of Patent ApplicationDescription
A01C1/0883Immunising Seed
A01H657New Plants or Process for Obtaining Them; Plant Reproduction by Tissue Culture Techniques
A01K1300Animal Husbandry; Care of Birds, Fishes, Insects; Fishing; Rearing or Breeding Animals, not otherwise provided for; New Breeds of Animals
A01N3157Preservation of Bodies of Humans or Animals or Plants or parts thereof; biocides, e.g., as disinfectants, as pesticides, as herbicides.
A01P1Biocidal, pest repellent, pest attractant or plant growth regulatory activity of chemical compounds or preparation (for material already classified under A01N or C12N, C01, C07 or C08)
A21D8/0495Treating Dough with microorganisms or enzymes
A23B2095Preserving, e.g., by canning, meat, fish, eggs, fruit, vegetables, edible seeds; chemical ripening of fruit or vegetables; the preserved ripened or canned products (i.e., 4/027. 4/20. 5/15, 7/154 and 9/26)
A23C1561Dairy Products, e.g., milk, butter, cheese; milk or cheese substitutes; making thereof (i.e., 9/12, 13/16, 17/02 and 19/032, 21/02)
A23K22Fodder
A23L6614Foods, Foodstuffs, or non-alcoholic beverages not covered by Subclasses A23B to J; their preparation or Treatment…; Preservation of Foods or Foodstuffs in General.
A23N878Machines or apparatus for treating harvested fruit, vegetables, or flower bulbs in bulk, not otherwise provided for; peeling vegetables or fruit in bulk; apparatus for preparing animal feeding-stuffs.
Table A3. Detail IPC code related to medicine and disease.
IPC# of Patent ApplicationDescription
A61K913Medicinal preparaions characterised by special physical form
A61K3114,611Medicinal preparations containing organic active ingredients
A61K353232Medicinal preparations containing material or reaction products thereof with undetermined constitution, from
A61K36161Medicinal preparations of undertermined constitution containing material from algae, lichens, fungi or plants, or derivatives thereof, e.g., traditional herbal medicine
A61K381876Medicinal preparations containing peptides
A61K39924Medicinal preparations containing antigens or antibodies
A61K4893Treatments for genetic diseases, Gene therapy
A61L9563Methods or apparatus for sterilising materials or objects in general; disinfection, sterilisation, or deodorisation of air; chemical aspects of bandages, dressings, absorbent pads, or surgical articles; materials for bandages, dressings, absorbent pads, or surgical articles (e.g., 15/38. 27/54,29/16, 31/16)
A61P7Therapeutic Activity of Chemical Compounds or Medicinal Preparations

References

  1. De Besi, M.; McCormick, K. Towards a bioeconomy in Europe: National, regional and industrial strategies. Sustainability 2015, 7, 10461–10478. [Google Scholar] [CrossRef]
  2. Battelle. Technology Partnership Practice. The Pconomic Impact of the US Biopharmaceutical Industry. Available online: http://phrma.org/sites/default/files/pdf/The-Economic-Impact-of-the-US-Biopharmaceutical-Industry.pdf (accessed on 24 February 2016).
  3. Brookes, G.; Barfoot, P. Economic impact of GM crops: The global income and production effects 1996–2012. GM Crops Food 2014, 5, 65–75. [Google Scholar] [CrossRef] [PubMed]
  4. Convention on Biological Diversity. Timeline Leading to the Adoption of the Nagoya Protocol on ABS. Available online: https://www.cbd.int/abs/background/default.shtml (accessed on 24 February 2016).
  5. Allarakhia, M.; Wensley, A. Innovation and intellectual property rights in systems biology. Nat. Biotechnol. 2005, 23, 1485–1488. [Google Scholar] [CrossRef] [PubMed]
  6. Organization for Economic Development and Cooperation (OECD). A Framework for Biotechnology Statistics; Organisation for Economic Co-operation and Development: Paris, France, 2005; pp. 1–52. [Google Scholar]
  7. Oldham, P.D. Biodiversity and the Patent System: Towards International Indicators, 2007. Global Status and Trends in Intellectual Property Claims. Issue No. 3. Available online: http://dx.doi.org/10.2139/ssrn.1088134 (accessed on 24 February 2016).
  8. Oldham, P.; Hall, S.; Forero, O. Biological diversity in the patent system. PLoS ONE 2013, 8, e78737. [Google Scholar] [CrossRef] [PubMed]
  9. Magerman, T.; Van Looy, B.V.; Debackere, K. Does involvement in patenting jeopardize one’s academic footprint? An analysis of patent-paper pairs in biotechnology. Res. Policy 2015, 44, 1702–1713. [Google Scholar] [CrossRef]
  10. Lawson, C. The role of patents in biodiversity conservation. Nat. Biotechnol. 2009, 27, 994–995. [Google Scholar] [CrossRef] [PubMed]
  11. Arnaud-Haond, S.; Arrieta, J.M.; Duarte, C.M. Marine biodiversity and gene patents. Science 2011, 331, 1521–1522. [Google Scholar] [CrossRef] [PubMed]
  12. Hall, L.A.; Bagchi-Sen, S. An analysis of firm-level innovation strategies in the US biotechnology industry. Technovation 2007, 27, 4–14. [Google Scholar] [CrossRef]
  13. Kang, K.; Park, H. Influence of government R&D support and inter-firm collaborations on innovation in Korean biotechnology SMEs. Technovation 2012, 32, 68–78. [Google Scholar]
  14. Messeni Petruzzelli, A.; Rotolo, D.; Albino, V. Determinants of patent citations in biotechnology: An analysis of patent influence across the industrial and organizational boundaries. Technol. Forecast. Soc. Chang. 2015, 91, 208–221. [Google Scholar] [CrossRef]
  15. Organization for Economic Development and Cooperation (OECD). Key Biotechnology & Nanotechnology Indicators: A Comparison; Organisation for Economic Co-operation and Development: Paris, France, 2013; pp. 1–7. [Google Scholar]
  16. Gazzola, M. Identifying and mitigating linguistic inequalities in the management of patent information in Europe. World Pat. Inf. 2015, 40, 43–50. [Google Scholar] [CrossRef]
  17. Daly, G.G. Entrepreneurship and business culture in Japan and the U.S. Jpn. World Econ. 1998, 10, 487–494. [Google Scholar] [CrossRef]
  18. Fujii, H.; Kimbara, T.; Kaneko, S.; Gibson, D. Mechanism of corporate environmental management: empirical study for U.S. and Japanese companies. In Energy and Innovation: Structural Change and Policy Implications; van Geenhuizen, M., Nuttall, W., Gibson, D., Oftedal, E., Eds.; Purdue University Press: West Lafayette, IN, USA, 2010; pp. 343–368. [Google Scholar]
  19. Fujii, H. Decomposition analysis of green chemical technology inventions from 1971 to 2010 in Japan. J. Clean. Prod. 2016, 112, 4835–4843. [Google Scholar] [CrossRef]
  20. Allarakhia, M.; Wensley, A. Systems biology: A disruptive biopharmaceutical research paradigm. Technol. Forecast. Soc. Chang. 2007, 74, 1643–1660. [Google Scholar] [CrossRef]
  21. Allarakhia, M.; Walsh, S. Managing knowledge assets under conditions of radical change: the case of the pharmaceutical industry. Technovation 2011, 31, 105–117. [Google Scholar] [CrossRef]
  22. Organization for Economic Development and Cooperation (OECD). Policy Responses to the Economic Crisis: Investing in Innovation for Long-Term Growth; Organisation for Economic Co-operation and Development: Paris, France, 2009; pp. 1–39. [Google Scholar]
  23. Ang, B.W.; Liu, N. Handling zero values in the logarithmic mean Divisia index decomposition approach. Energ. Policy 2007, 35, 238–246. [Google Scholar] [CrossRef]
  24. Ang, B.; Zhang, F.; Choi, K. Factorizing changes in energy and environmental indicators through decomposition. Energy 1998, 23, 489–495. [Google Scholar] [CrossRef]
  25. Ang, B.W. Decomposition analysis for policymaking in energy: Which is the preferred method? Energy Policy 2004, 32, 1131–1139. [Google Scholar] [CrossRef]
  26. Goto, A.; Motohashi, K. Construction of a Japanese Patent Database and a first look at Japanese patenting activities. Res. Policy 2007, 36, 1431–1442. [Google Scholar] [CrossRef]
  27. Kinbara, T.; Fujii, H.; Kaneko, S. Analysis of environmental patents in Japan from 1964 to 2008. Int. Bus. Res. 2013, 6, 145–152. [Google Scholar]
  28. Fujii, H.; Assaf, A.G.; Managi, S.; Matousek, R. Did the financial crisis affect environmental efficiency? Evidence from the Japanese manufacturing sector. Environ. Econ. Policy Stud. 2016, 18, 159–168. [Google Scholar] [CrossRef]
  29. Jargosch, R.E.; Jurich, J. Pfizer Inc Patent Landscape Analysis—1 January 1994 to 31 December 2013; IPGenix LLC: Pensacola, FL, USA, 2014. [Google Scholar]
  30. Kao Corporation. Kao to Launch Healthya Coffee for Enhancing Body Fat Utilization as Energy. Corporate Communications Department, Kao. 2013. Available online: http://www.kao.com/jp/en/corp_news/2013/20130327_001.html (accessed on 24 February 2016).
  31. Singh, A.; Hallihosur, S.; Rangan, L. Changing landscape in biotechnology patenting. World Pat. Inf. 2009, 31, 219–225. [Google Scholar] [CrossRef]
  32. Umeda, S. Restrictions on Genetically Modified Organisms: Japan, Legal Reports, The Law Library of Congress, 2014. Available online: http://www.loc.gov/law/help/restrictions-on-gmos/japan.php (accessed on 24 February 2016).
  33. Fischer, K.; Ekener-Petersen, E.; Rydhmer, L.; Björnberg, K. Social impacts of GM crops in agriculture: A systematic literature review. Sustainability 2015, 7, 8598–8620. [Google Scholar] [CrossRef]
  34. Thoma, G. Composite value index of patent indicators: Factor analysis combining bibliographic and survey datasets. World Pat. Inf. 2014, 38, 19–26. [Google Scholar] [CrossRef]
  35. Wu, J.; Chang, P.; Tsao, C.; Fan, C. A patent quality analysis and classification system using self-organizing maps with support vector machine. Appl. Soft Comput. 2016, 41, 305–316. [Google Scholar] [CrossRef]
  36. Kang, K.; Sohn, S.Y. Evaluating the patenting activities of pharmaceutical research organizations based on new technology indices. J. Informetr. 2016, 10, 74–81. [Google Scholar] [CrossRef]
  37. Verhoeven, D.; Bakker, J.; Veugelers, R. Measuring technological novelty with patent-based indicators. Res. Policy 2016, 45, 707–723. [Google Scholar] [CrossRef]
Figure 1. Decomposition analysis of biochemistry and biotechnology patent applications. Note: The scores in the columns were standardized by setting the number of changes in patent applications from 1971 to 1975 to zero.
Sustainability 08 00351 g001
Figure 2. Decomposition analysis of medicine and disease patent applications.
Sustainability 08 00351 g002
Figure 3. Decomposition analysis of foodstuff and agriculture patent applications.
Sustainability 08 00351 g003
Table 1. History of laws and events related to biodiversity and biological technology.
YearWorldJapan
before 1990
-
First session of the Ad-Hoc Working Group of Experts on Biological Diversity in Geneva (1988)
-
Beginning of the Human Genome Project (1990)
-
Japan signed the Convention on International Trade in Endangered Species of Wild Fauna and Flora (1980)
-
Japan joined the Ramsar Convention (1980)
1991–1995
-
International Programme of Biodiversity Science (Phase 1 (1991–2001): Biodiversity gains attention on the global scale)
-
The Convention on Biological Diversity enters into force (1993)
-
1st Conference of the Parties to the Convention on Biological Diversity held in Nassau (1994)
-
Publication of red data book in Japan (1991)
-
The Law for the Conservation of Endangered Species of Wild Fauna and Flora (1992)
1996–2000
-
Universal Declaration on the Human Genome and Human Rights (1997)
-
First Meeting of the Panel of Experts on Access to Genetic Resources and Benefit-Sharing (2000)
-
Cartagena Protocol on Biosafety signed (2000)
-
1st National Biodiversity Strategy and Action Plan (1995)
-
Thematic Report on Alien and Invasive Species (2000)
2001–2005
-
First meeting of the Ad-Hoc Open-Ended Working Group on Access and Benefit-Sharing (2001)
-
World Summit on Sustainable Development (2002)
-
International Programme of Biodiversity Science (Phase 2 (2002–2011): An international framework for biodiversity science)
-
International Declaration on Human Genetic Data (2003)
-
Cartagena Protocol on Biosafety enters into force (2003)
-
Universal Declaration on Bioethics and Human Rights (2005)
-
2nd National Strategy for the Conservation and Sustainable Use of Biological Diversity (2002)
-
Act on the Conservation and Sustainable Use of Biological Diversity through Regulations on the Use (2004)
2006–2010
-
Adoption of the Nagoya Protocol (2010)
-
Strategic Plan for Biodiversity 2011–2020, including Aichi Biodiversity Targets (2010)
-
3rd National Strategy for the Conservation and Sustainable Use of Biological Diversity (2007)
-
Basic Act on Biodiversity (2008)
Source: The authors revised the timeline leading to the adoption of the Nagoya Protocol on access to genetic resources and benefit sharing [4].
Table 2. Description of biological patent groups. IPC, International Patent Classification.
Patent GroupDescription of Patent Group
Biochemistry and biotechnologyBiochemistry and biotechnology include microorganisms, biological and genetic material, DNA and genomics and cell and tissue technology. The main categories of this patent classification are IPC = C12P (fermentation- or enzyme-based processes to synthesize chemicals) and IPC = C12Q (measuring or testing processes involving enzymes or microorganisms).
Medicine and disease
Foodstuff and agricultureFoodstuff and agriculture includes technologies related to foodstuff treatment, plant seeds and biocides. The main categories of patent classification are IPC = A23B (food preservation technology, such as ripened or canned products) and IPC = A23C (milk, butter, cheese, milk or cheese substitutes and the process of making such products).
Source: Oldham [7]; note: the IPC code is described in detail in the Appendix Table A1, Table A2 and Table A3.
Table 3. Trend of biologically-related patent applications by industry type.
TechnologyIndustry Type (JSIC Code)1971–19801981–19901991–20002001–20101971–2010Share
Biochemistry and biotechnologyChemical (16)688274125012318824816.6%
Electric products (29)721119112671918509710.3%
Food (9,10)22610891472116139488.0%
Medicine (165)21010661293125738267.7%
Machinery (25)7421284107072338197.7%
Total437111,43415,84417,93749,586100%
Medicine and diseaseChemicals (16)301145422142050601918.0%
Medicine (165)422102620622428593817.8%
Food (9,10)60238873102321946.6%
Electric products (29)7040654164516625.0%
Textile (11)6229546642212453.7%
Total1247471512,73414,65733,353100%
Foodstuff and agricultureChemical (16)4018811368993364322.1%
Food (9,10)2546501254793295117.9%
Machinery (25)952103841728615.2%
Electric products (29)1682821751257504.6%
Medicine (165)152162183245213.2%
Total158832906737484816,463100%
Note: The medicine industry (165) is categorized as a chemical industry (16) in JSIC. However, the medicine industry has many patent applications in several biologically-related technologies. Therefore, we consider the patent application from the medicine industry independently from that of the chemical industry. To avoid double-counting patent applications, patent applications from the chemical industry (16) are excluded from those of the medicine industry (165).
Table 4. Company list of large biological patent application from 1971 to 2010.
TechnologyCompany Name (Industry Type)# of Patent ApplicationShare
Biochemistry and biotechnologyAjinomoto Co., Inc. (Food)14302.88%
Hitachi, Ltd. (Electrical products)12212.46%
Mitsubishi Heavy Industries, Ltd. (Machinery)11062.23%
Toyobo Co., Ltd. (Textile])10442.11%
Panasonic Corp. (Electric products)8741.76%
Medicine and diseaseDaiichi Sankyo Co., Ltd. (Medicine)8072.42%
Kao Corp. (Chemical)7632.29%
Takeda Pharmaceutical Co. Ltd. (Medicine)7632.29%
Panasonic Corp. (Electric products)6772.03%
Sekisui Chemical Co., Ltd. (Chemical)6101.83%
Foodstuff and agricultureAjinomoto Co., Inc. (Food)5133.12%
Megmilk Snow Brand Co., Ltd. (Food)5043.06%
Sumitomo Chemical Co., Ltd. (Chemical)4572.78%
Panasonic Corp. (Electric products)3432.08%
Kewpie Corp. (Food)3412.07%

