1. Introduction
To achieve a global energy-related CO
2 target in 2050 of 50% below current levels and limit global temperature rise by 2050 to 2 °C above pre-industrial levels, photovoltaic (PV) energy has a promising future, with faster deployment than anticipated [
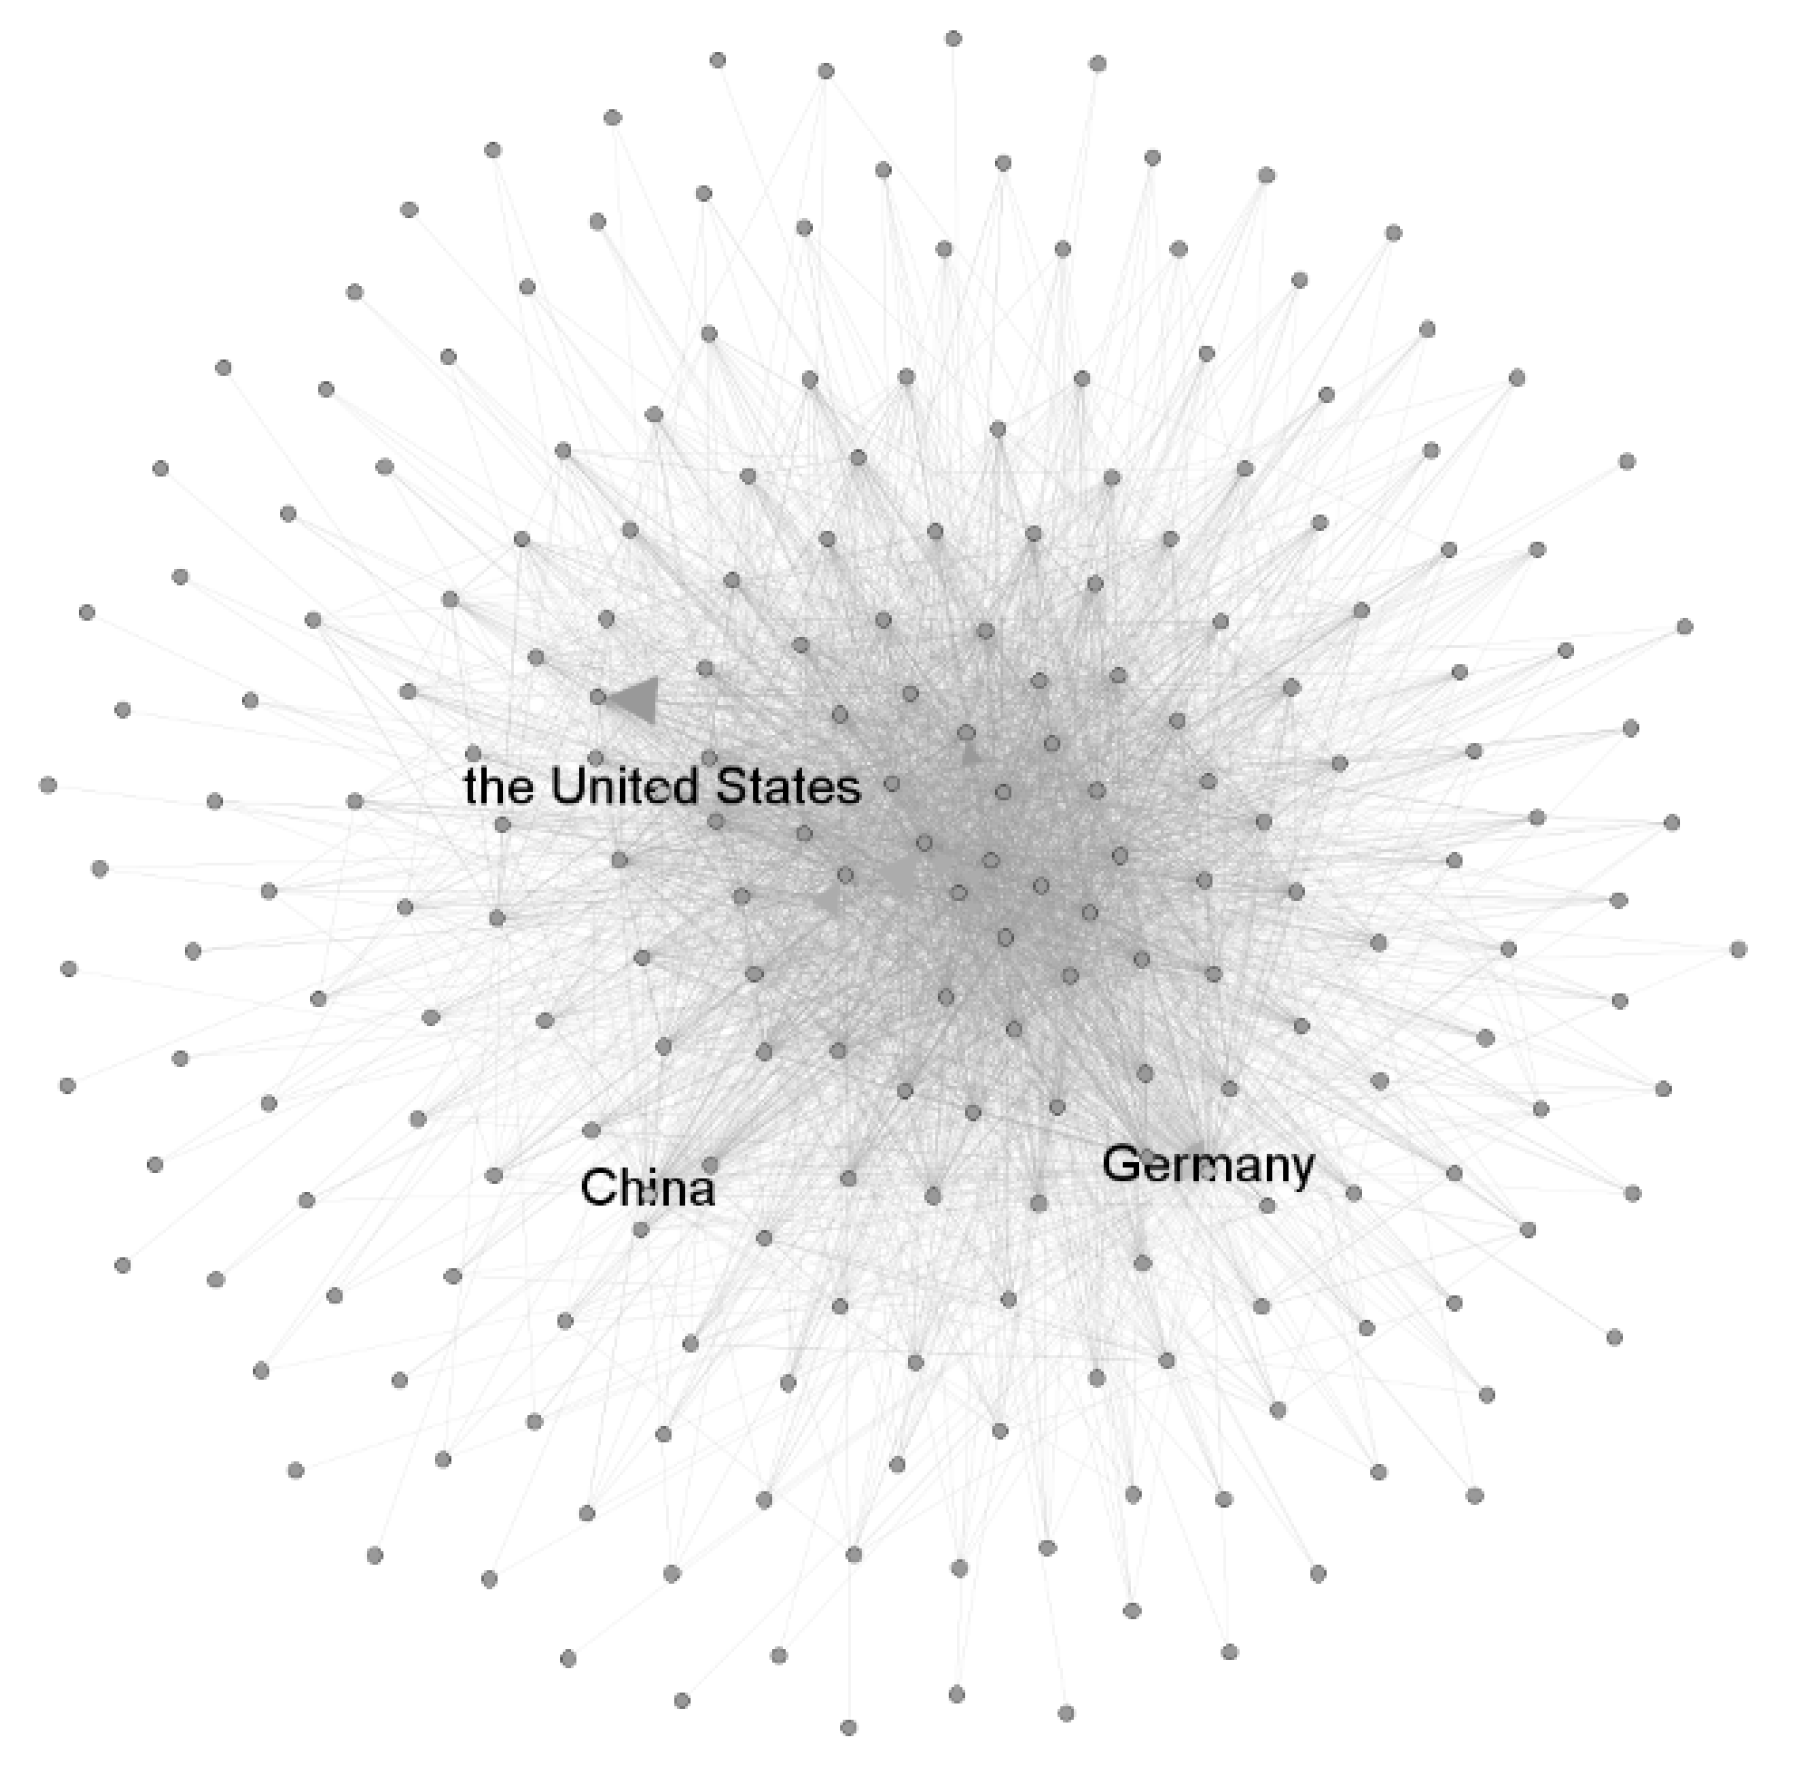
1]. As the essential part of the global economic development of sustainable energy, the international PV trade has engaged hundreds of countries and thousands of trading relations. Thus, the expanding trade pattern encourages countries to seek greater power in the global PV market, which is affected by their trade roles. For example, China, the leading exporter from 2007, has been perceived as an indispensable commodity source, and Germany, the leading importer in most recent years, has always been an important partner for exporters. However, facing a number of economic and non-economic barriers, the fluctuation of global PV trade in the last few years has encouraged governments to reconsider their development strategies, especially their PV trade roles in the international PV market with a lack of proficiency. As a result, exploring the impact of countries’ trade roles on the global PV trade pattern is essential for governments to adjust their development strategies.
Previous studies on PV energy have focused on the need to develop and promote its use in individual countries. Yu assessed cycle sustainability and debated whether PV energy is a sustainable option for Australia [
2]; Zhao evaluated the external benefit of promoting the use of renewable energy in China [
3]; Alboteanu assessed solar irradiation as an important input parameter for Craiova, Romania [
4]. These studies provide information regarding the development and use of PV energy and clarify the relationship between PV energy deployment and economic or social elements. In recent years, the interactions between economic values and PV energy development have gained the attention of researchers. Carceres studied the installation of PV energy in Santiago from the economic perspective [
5], while Yang examined international trade of PV energy to enhance the understanding of the environmental consequences of the Chinese PV industry [
6]. However, studies on the exporting and importing of PV among countries have not had much attention from researchers, which is an essential part from the economic perspective [
7,
8,
9]. In fact, for example, Chinese PV firms have seen obstacles in exporting PV devices in recent years, which has an indirect impact on the country’s solar energy development. As a result, it is necessary to study the trade pattern of the global PV trade pattern. In particular, exploring top traders that have the greatest impact on the trade pattern provides a better understanding of the international PV trade, and the analysis on the reasons for their influence is a valuable reference for governments to adjust their strategies.
During the last decade, complex network theory was widely applied to the studies of international trade. Early studies focus on the topological properties of international trade patterns to measure the dynamic evolution [
10,
11,
12,
13,
14,
15,
16,
17]. During the development of network theory and the increase of trade complexity, improved network modeling was adopted to explore the global or local trading feature with the comparison with original network, including the conduction of null models for network models by Fagiolo [
18] and Saracco [
19], the definition of the notion of extinction analysis by Foti [
20], the establishment of residual international trade network by Fagiolo [
21], the comparison with international financial network by Schiavo [
22], the introduction of energy concept to measure then energy flow by Hao [
23], and the improvement network into a weighted multilayer one by Gao [
24]. Moreover, indirect relations in the competition among countries was analyzed by An [
8] and Zhang [
25], and the concept of community was studied by Tzekina [
26], Barigozzi [
27], and Zhong [
9] to measure close connections within each group of trade partners. In particular, during the last five years of studies, researchers have provided abundant, meaningful, and interesting debate on the trade pattern, influential traders [
7,
25,
28], and the evolution mechanism [
29,
30,
31,
32]. For example, Ji has found that geopolitics and diplomatic relations are the two main reasons for the regional oil trade structure [
30]; Fagiolo has confirmed the weak trade links among countries by studying the evolution of the world trade web-based on a weighted-network analysis [
29]; Guan explored potential crude oil trade links and confirmed that common trade partners is essential for the dynamic evolution [
32]; Hoppe confirmed that fluctuations occur mostly between countries with strong dissimilarities of fitness and connectivity [
31]; Zhang found that non-OECD countries have become the main driving force for the increase in global competition intensity [
25]; Fan engaged in the issue of countries’ roles and positions in international trade, and found that the EU, the USA and Japan have highest importance [
7]; Ermann introduce the google matrix into the modeling to show the leading role of China and other BRICS countries in world trade [
28]. However, there are also some questions that need further debate. Firstly, few previous studies have focused on the global PV trade but the modeling of fossil fuel trading or comprehensive commodities. PV trading is an emergent but uncertain and imbalance market with abundant output source, which is the most significant difference with fossil fuel markets. Secondly, there are some conflicts among different research results about countries’ roles and status, which confirms that the studies on this should get further development and is still necessary. Last but not least, few studies have combined the research on both trading mechanisms and the countries’ trade roles. As a result, our works pay attention to the dynamic evolution of international PV trade pattern with the analysis of countries’ trade roles and corresponding explanation from the perspective of structural mechanism, which would be explored based on the complex network theory [
33,
34] and the link prediction theory respectively [
35,
36,
37,
38,
39], both of which have confirmed the feasibility of their application on various networks.
In this study, we aim to explore the impact of countries’ roles on the international PV trade by answering following four questions. (1) What is the general evolution of the international PV trade? (2) Of the top trading countries, whose exit would result in the collapse of global PV trade? (3) How do top traders have an impact on the international trade pattern? (4) Why are these groups of countries top traders? To answer these questions, we first analyze the evolution of the network structure to determine and understand the changes in the trading environment. Then, to assess the most influential countries, we compare the structure differences between the original network and the default networks of certain continents. Furthermore, our study uses topological indices to evaluate countries’ roles from three different perspectives, import volume, export volume, and the core degree in the local trade area. Finally, we study unweighted and weighted PV networks from the link prediction perspective to explore whether high trade volume is primarily responsible for becoming a top trader and to reveal trade promoters in the PV market. This study has extensive applications for studies of various commodities or multi-commodities’ international trade, their influential traders, and their pushers. Such research can provide more practical suggestions for governments.
The contribution of our paper is as follows: (1) An analysis of the international PV trade is necessary because of its emerging and disparate fluctuation trade pattern; (2) further verification of countries’ PV trade roles is studied from the perspective of import, export, and local importance; (3) the reason for countries’ PV trade status is explained according to its structural trading mechanism; (4) a weak tie is further confirmed.
The remainder of this paper is organized as follows.
Section 2 introduces the data source, structural indices of the complex network, and the algorithm for the link prediction.
Section 3 explores the top traders, their influence, and the reasons for their influence.
Section 4 discusses the findings, and
Section 5 offers conclusions.
3. Results
3.1. The Evolution of Trade Patterns
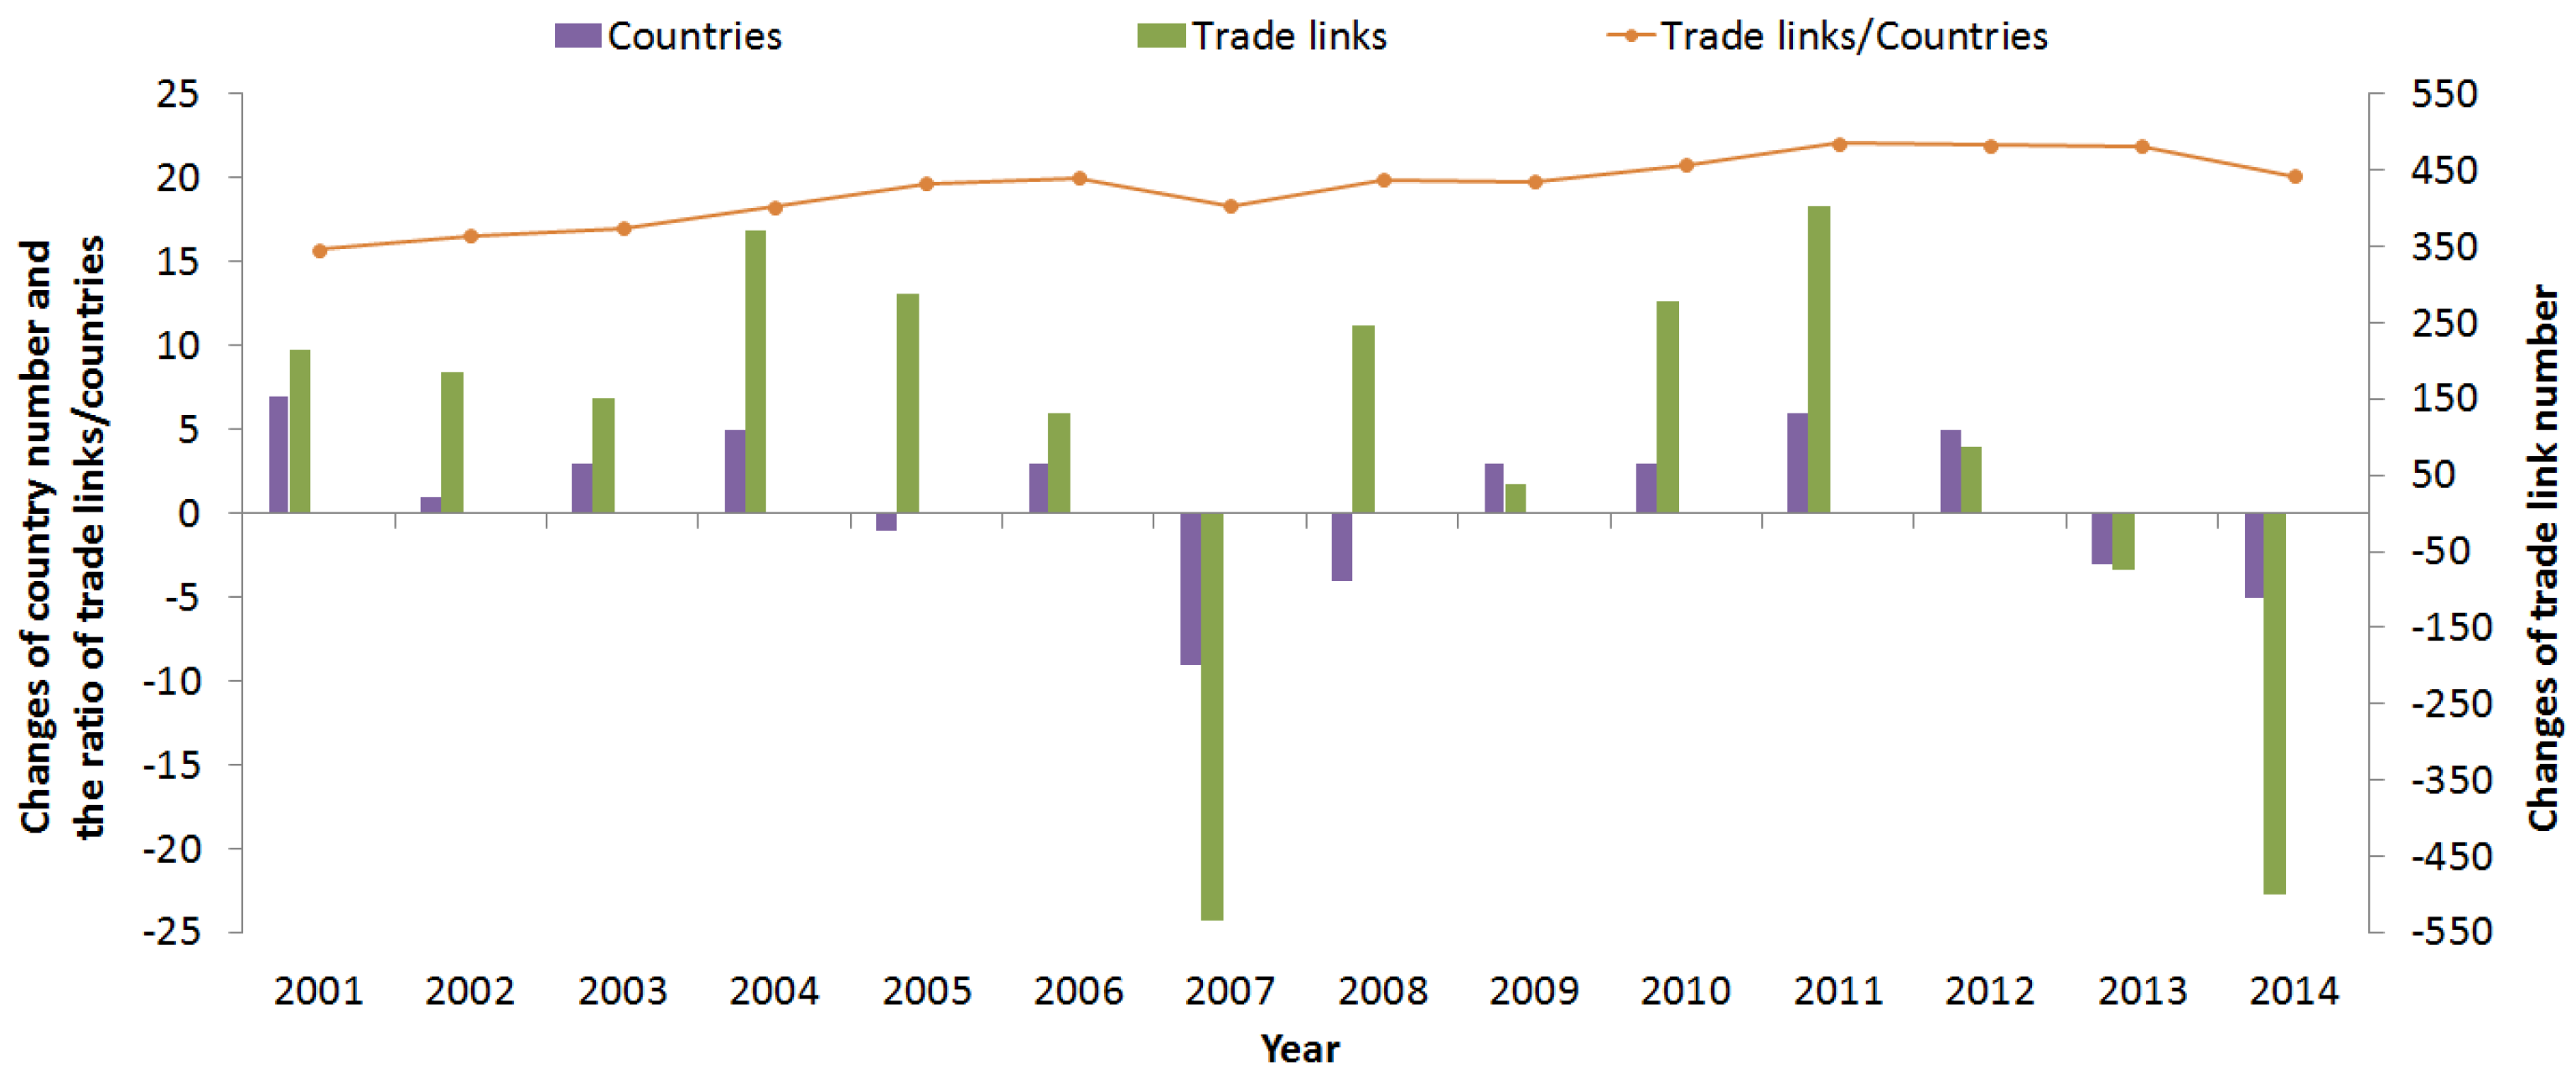
To explore the dynamic evolution of international PV trade pattern, we measured the trade scale from the fluctuation of both countries and trade relations. For each year from 2001 to 2014, we counted the fluctuations in the number of nodes and edges and compared them to the previous year’s data (
Figure 2). The evolution of the ratios between edges and nodes is also presented in
Figure 2.
With the exception of 2007 and 2014, the ratios of edges and nodes continuously increase with the homonymous fluctuation of nodes and edges in most years, excluding 2005 and 2008. The numbers of nodes and edges have grown, respectively, from 205 and 3123 in 2000 to 219 and 4412 in 2014. Although a small portion of countries exited the international PV trade market in 2005 and 2008, the trade relations continue to rise, suggesting that the trade patterns are becoming increasingly more complex with the expansion of countries and multiple trade relations.
However, the number of nodes and edges in 2014 was actually met early in 2006, indicating that the trade pattern has fluctuated and expanded slowly since 2006. This is especially evident in 2007, 2013, and 2014, the three years when international PV trade suffered global shocks regardless of the decrease in the number of nodes or edges. Our statistical results indicate that Canada, Australia, the United States, China, Singapore, and a wide range of other countries impeded a substantial amount of PV trade relations in 2007; that Sweden, Greece, and other European countries reduced dozens of trade links in 2013; and that China, Austria, Korea, and other countries negatively impacted hundreds of trade cooperation in 2014. It is evident that the three stages spanned the three continents, respectively. In the first stage, fluctuations occurred mainly in North America partly because the United States began to decrease their import and export volume. In 2013, European countries led the fluctuation in trade links; however, in the following year, China and other Asian countries lost a large number of trade partners. The reason for this is the PV trade has conflicted between European Union (EU) countries and China in recent years. Furthermore, the anti-dumping duties imposed by the EU created obstacles for China’s PV enterprises, resulting in lower export volume than in previous years.
The general evolution of the international PV trade pattern continues to expand other than when it faces certain crises. According to this pattern, countries would have their own roles and positions, which would fluctuate over time.
3.2. Countries’ Influence on Trade Patterns
Under the fluctuant evolution period, we tried to explore countries’ influence on the trade pattern. This helped us learn which groups of countries have most importance on both local and global trade pattern. We sought to identify which countries exert a significant impact on the structure of the whole trade pattern in 2014. This means that the absence of an influential country would cause changes in the network, such as fluctuating values of indices. Therefore, we eliminated the group of countries that belong to the same continent and that are among the top 10 rated importers or exporters and among the 10 countries with the highest EC in 2014. We then compared five indicators of the original network with networks without specific continent countries. These five indicators, AD, AWD, ND, AWCC, and APL, were used to comprehensively measure the differences between local and global perspectives.
Table 1 indicates that the network without any major European countries exhibits the most apparent changes. Accordingly, the absence of these countries results in much lower AD, AWD, and AWCC, but higher APL and ND. This is especially true for the ND index, as European countries are the only ones that destroy the original structure, which indicates that, because of their strong connective force, their default or absence will disrupt the network, leading to the uncontrollability of the trade patterns. It also demonstrates that the entire trade pattern is composed of many groups of countries that have almost no links among them and that the relations among different groups of countries often serve as indirect links through other countries. Similar to ND, the increase in APL and the decrease in AWCC suggest that European countries are important in bridging the trade links among different groups of countries and in compacting the trade pattern. Moreover, the decrease in AD and AWD proves that European countries not only have a high number of trade partners, but they also have a high trade volume. Similar to European countries, countries from North America are also core traders, though they have much less influence on the trade pattern.
Other bridging traders include countries from South America. The default or absence of these countries leads to an increase in AWD, but a decrease in APL, which means that they have many cooperating partners and that their target is to transfer PV without engaging in a high degree of importing or exporting. This explains why their corresponding default network has low AWCC.
However, only the absence of Asian countries causes an increase in AWCC, suggesting that there is a relatively low number of relations among Asian countries’ trade partners [
51]. That is, these countries tend to export PV energy to other countries, but their partners do not engage in further cooperation with each other.
It is concluded that the default of countries from these five continents will exert a different collapsing force on the international PV trade pattern where European countries are the most influential ones, followed by countries from North America and Australia. On the other hand, Asian countries always have more unidirectional trade cooperation, while South America countries tend to serve as bridging countries.
3.3. The Evolution of Countries’ Roles
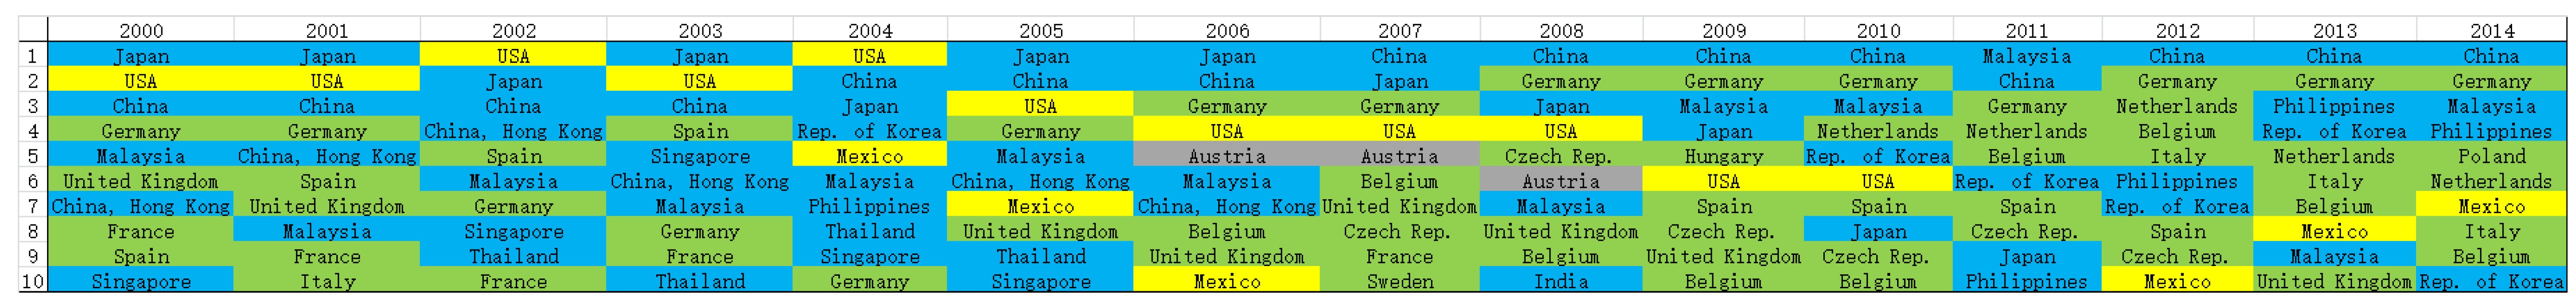
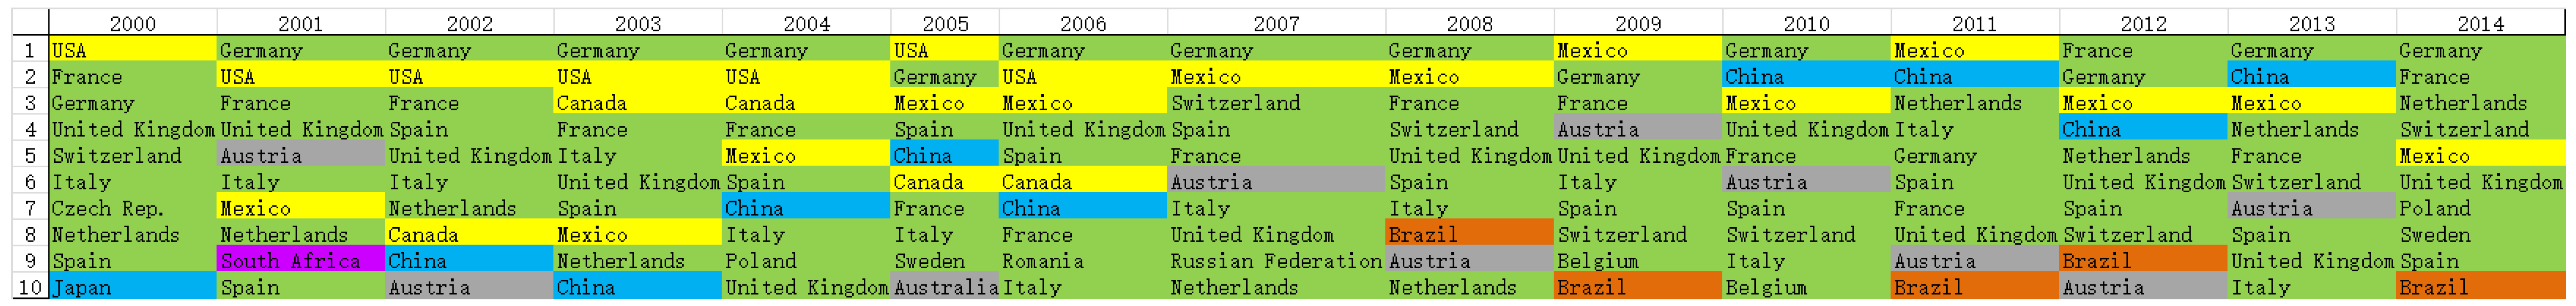
It is acknowledged that the group of European countries is the most influential group and that their absence would cause the collapse of the global PV trade pattern. Thus, it is important to understand how countries impact the trade patterns. As the trade role of each country differs, their influence on the evolution of international PV trade also differs. Similarly and simultaneously, the fluctuations in the trade pattern encourage countries to change their trading roles. Thus, by examining countries’ trade roles from a global and local perspective, governments will be better prepared to adjust their PV trade strategies. We adopt WID, WOD, and EC as the indices that describe countries’ roles from three perspectives. WID is used to describe importers, WOD describes exporters, and EC is used to identify those countries that are core traders and thus important hubs. We select the leading 10 countries for each index and analyze the most powerful importers (
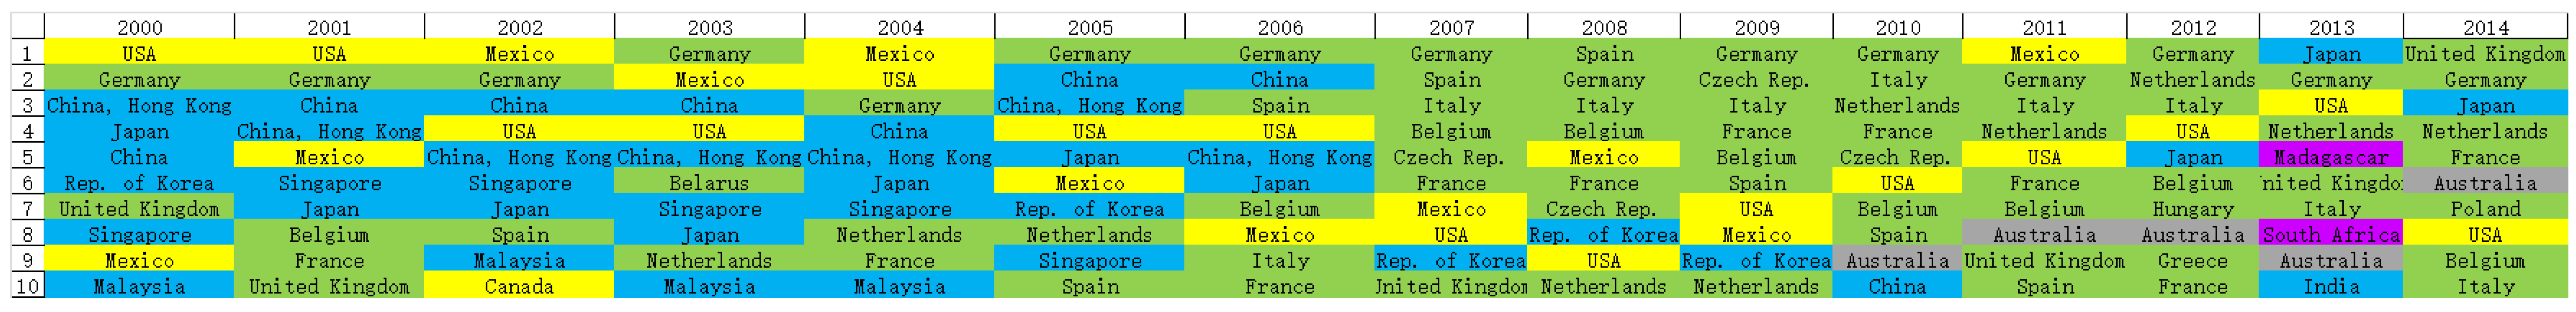
Figure 3), exporters (
Figure 4), and core traders (
Figure 5). To avoid trivial analysis of our results, we divide the countries by continent. Yellow represents countries from North America; green represents countries from Europe; blue represents countries from Asia; orange represents countries from South America; purple represents countries from Africa; and grey represents countries from Australia. The numbers in the figures are the country’s rank in the corresponding year.
From the evolution of the 10 leading importers, we find that (1) the continent with the most number of importers has changed from Asia to Europe; (2) the country with the largest number of imports has changed from the United States and Mexico to Germany; (3) North America has gradually recovered its import status in recent years; (4) countries from Africa and Australia have evolved as a team of importers in recent years; and (5) Japan has recovered its near-top importation in the last three years.
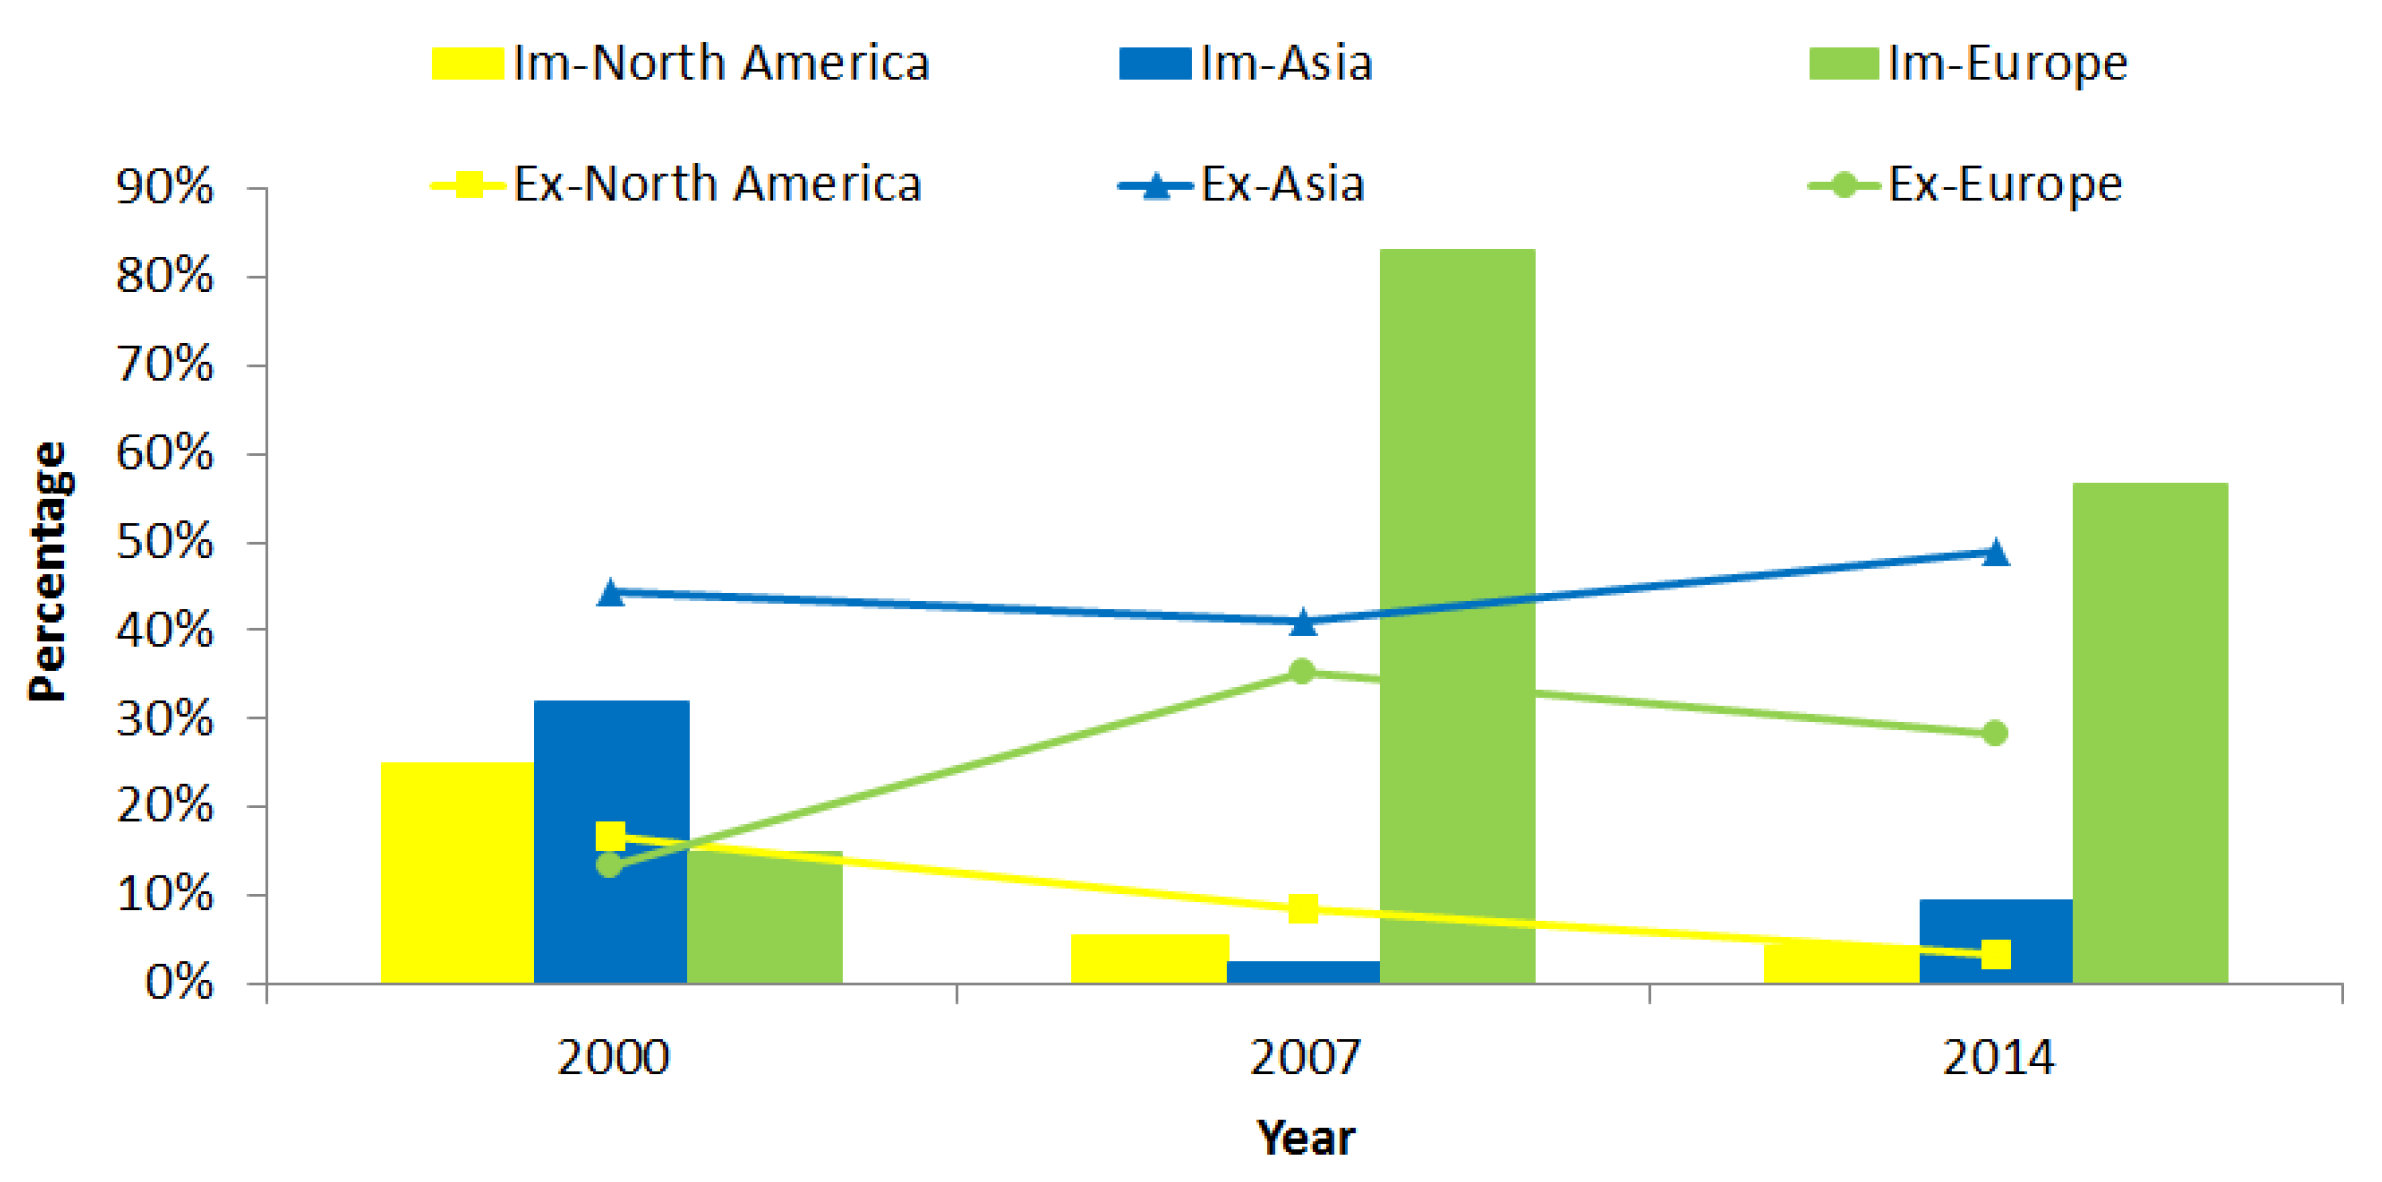
Figure 6 indicates that, in 2000, countries from Asia accounted for 31.89% of the global imports, which was only slightly more than North America’s 24.81% and Europe’s 14.71%. Especially, the United States and Germany accounted for 21.63% and 10.68%, respectively, of the global imports. However, in 2007, Europe accounted for 83% of the global PV imports, which is far greater than any other continent, and this trend continues until 2014 when Europe accounted for 56.62% of the total imports. In other words, it is evident that European countries have become major importers of global PV trade.
The evolution of the 10 leading exporters reveals that (1) an increasing number of European countries have become important PV exporters; (2) Asian countries are the main exporters, but they have gradually been reduced to include China, Malaysia, Philippines, and Rep. of Korea; (3) since 2007, Japan and United States have decreased their exports, and China has replaced them; and (4) Germany is both a leading importer and exporter in Europe.
Figure 6 also reveals detailed information regarding countries’ export behaviors. From 2000 to 2014, Asian countries have accounted for half of the global exports; European countries gradually reduced this difference in 2007, but then increased the gap in 2014. At the same time, the total export amount of North America was decreasing from 16.74% to 3.21%, which is mainly affected by the USA’s apparent PV export drop, while the results show that Asian countries, especially China, Malaysia, Philippines, and the Rep. of Korea, are the main exporters. Countries from Europe, especially Germany and the Netherlands, are also important sources of global exports.
Interestingly, the results from the perspective of a countries’ importance indicate that (1) North America and Europe are the two most important continents from 2000 to 2014; (2) the leading core trader in North America is the United States before 2007 and Mexico after 2007; (3) there is a wide range of European countries that promote the strong influence of the EU; (4) Brazil represents South America as the critical trader with both low import and export volumes; and (5) China is the only Asian country that appears to be significant in the trade market in the past five years. To our surprise, Asian countries do not have a substantial influence on global trading cooperation. Unlike the trade of traditional energy and resources, such as crude oil, natural gas, and coal, the trade of PV energy reveals that exporters are more dependent on importers and that the opposite does not hold. Accordingly, major importing and exporting countries from Europe and North America are the core international PV traders.
These three perspectives allow us to assess the roles that various countries play in influencing the international trade pattern. European countries are both major exporters and importers; as such, they are important core traders that bridge cooperation among countries. Asian countries, especially since 2007, export significantly more than they import. While North American countries have decreased their exports, they have exhibited growth in imports in recent years. Moreover, Australia, Africa, and South America have shown growth and involvement in recent years with respect to the trade pattern and have thus increased their position in the trade market. Because the roles of these traders differ, their influence on the evolution of the trade pattern also differs.
3.4. Structural Characteristics of Global PV Trade Links
To understand why European countries have such a major influence on the international PV trade pattern and why the European countries are the major trade pushers, this section explores the linking mechanism to explain these trade issues.
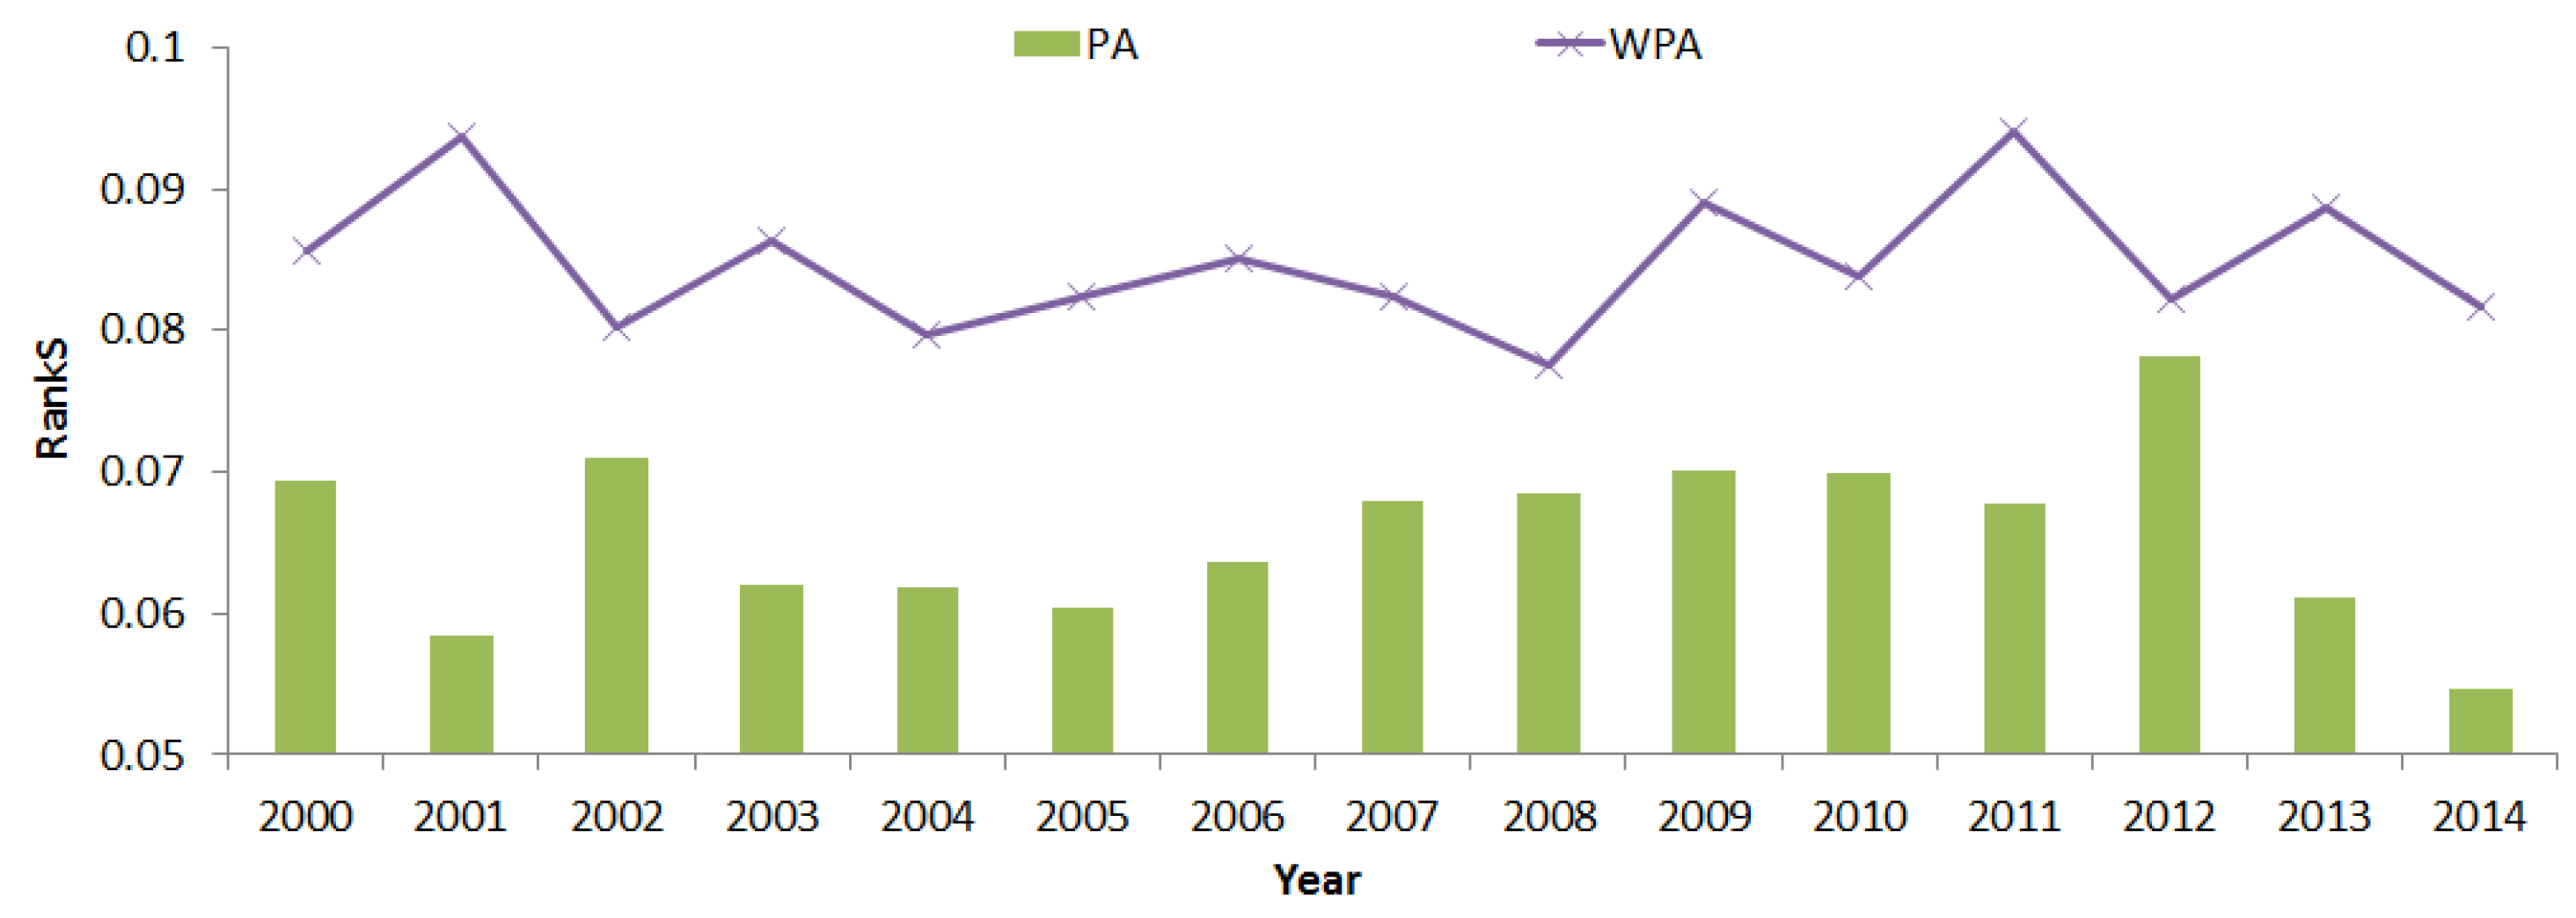
Figure 7 provides the RankS values of PA and WPA from 2000 to 2014. The comparison with previous studies confirms that the RankS values in our research are relative low, which entails a high precision of describing the real trade links. As a result, PA and WPA have the ability to describe the distribution of real trade links. However, it is apparent that, no matter which year is examined, the RankS of PA is lower than that of WPA, which confirms that the global PV trade pattern exhibits weak ties. This classic theory states that countries expand their trade cooperation through countries that exhibit a medium-level trading volume rather than through countries that are characterized by one of the highest volume of trading. Accordingly, this explains why the pushers or promoters of international PV trade are the European countries rather than the Asian countries.
Specifically, from our statistical results, in 2014, 75% of 20 countries that have the highest number of trade partners are from Europe. For example, Germany had $387 million worth of PV trading volume, which is similar to China’s trading volume ($384 million). However, there are 272 trade partners for Germany, which is twice the amount of China’s (123). Moreover, some European countries with low trade volume also have a high number of trade partners. For example, Sweden only has $6.44 million worth of trading volume, but its number of trade cooperation is 163, which is even higher than China’s. It can be seen that this is a general phenomenon for most European countries that have high trading universality. Apart from countries from Europe, Mexico, Australia, Brazil, China, and the USA are another five countries among top 20 countries with the highest number of trade partners. In addition, the trading universality of Brazil with its low trade volume enables its status in local trading area. As a result, our results confirm that, for the international PV trade, being the local core trader is influenced by countries’ extensive trading cooperation.
Based on the link prediction from unweighted and weighted indicators, we understand why the European countries serve as bridges and why they have a greater impact on the structure of the trade pattern. Their medium volume combined with their high universality leads the European countries to act as the drivers behind the evolution of international PV trade.
4. Discussion
Based on the analysis of international PV trade between 2000 and 2014, we explored countries’ trade roles and their impact on the global PV trade pattern. First, we studied the general evolution of countries with respect to their trade relations by analyzing changes of the trade pattern scale. Then, we identified top traders that have most influence on trade pattern by studying the impact of their collapse when they default. Furthermore, the roles the countries play in the trade market were explored by considering their importation, exportation, and their local trading status. Finally, we explain the reason that European countries with medium trade volume are the most influential ones from the perspective of structural linking characteristics. Based on our results, we offer the following discussions and conclusions.
- (1)
Expanding global PV trade pattern and significant changes of countries’ trade roles
The increasing number of countries and trade links indicates that the international PV trade pattern has expanded and become increasingly more complex, while also suffering shocks in 2007, 2013, and 2014.
Under this trade pattern, the trade roles of countries, which are their way of impacting global trade, are always evolving. European countries are the main importers, with approximately 83% of the world imports in 2007 and 56.62% in 2014. Moreover, they are also important exporters, with approximately 30% of the world export market in recent years. However, the major exporters are Asian countries, with nearly half of the global export market, while their share of the import market has been decreasing since 2007. On the other hand, North American countries have reduced their levels of both importing and exporting since approximately 2007, while Mexico has increased its role in the export market in the last five years. In addition, countries from the continents of Africa, South America, and Australia are also part of the trade pattern, which leads to increased trade competition.
No matter for importers or exporters, 2007 is the year that most countries’ PV trade roles begin to change significantly. For this phenomenon, the financial crisis in this period is probably the best explanation, which involves a high number of countries like the USA, Japan, and European countries. For the USA and Japan, they cannot invest a similar amount of fund on sustainable energy development under the financial pressure. However, for European countries, their high attention on the solar energy development encourages the maintenance of PV importation to fulfill their PV deployment targets. At the same time, a relatively low impact from global financial crisis and the low labor costs helped Asian countries acquire the opportunity to develop their PV production, which leads to the recovery of the exportation gap between European countries and Asian countries.
The interactions between the trade roles of the countries and the global trade pattern are worth considering, as the solar energy development strategies impact the countries’ choice of trade roles, and a corresponding change would cause a fluctuation in the global trade pattern. At the same time, changes of the trade pattern pushes countries to adjust their solar energy development strategies. As a result, the trade pattern is likely to evolve with changing various trade links and the fluctuant number of participating countries.
- (2)
European countries’ top impact on the international PV trade pattern
Because of their trading universality and the weak-tie characteristics of the global trade pattern, European countries are the most influential traders; as such, they are aggressively promoting the expansion of trade relations.
Our results indicate that during the evolution of the international PV trade pattern, the production capacity could not equal the level of international influence on trade patterns. In other words, high-volume export countries do not always have status and power in the PV energy market. Although countries from Asia are among the high-volume export countries, it is the European countries that have the greatest influence on and control of the international PV trade. This may explain why China decreased its exports from 1.73 billion dollars in 2012 to 0.38 billion dollars in 2014. European countries hold greater power, and this power helps them to promote their anti-dumping taxes, which are huge obstacles for China’s PV energy enterprises.
Results also show that global PV trade tends to be a buyer’s market, which means that the EU has more control on the global trading pattern. On the one hand, there is oversupply in this market, which leads to the imbalance of supply and demand. On the other hand, the EU’s development policies of renewable energy encourage it to be the main import trader and to compose main demand market [
41]. Unlike the fossil fuel energy market, the low supply risk stops the PV market from having a fixed export source. This is because the fluctuation of PV price can easily promote demand sides to select other import sources. As a result, the EU get higher discourse power than Asian countries, and the competition among exporters is higher than that among importers [
7,
42].
- (3)
Suggestions for trade strategies
From our results, we extract three suggestions for the policy design. Firstly, as the expanding of global PV trade pattern, the subsidy stimulation is still necessary for promoting more companies involved in the international PV development. Secondly, countries should realize their status of different trade roles, which would be good for their policy adjustment. Last but not least, while it is acknowledged that the European countries are the most influential in international PV trade, Asian countries have a far greater trade volume. Based on the results herein, we proffer the bold suggestion that countries should focus on enhancing their number of trade cooperation rather than on merely increasing their volume of exportation, as the country with expanded trade relations will become the core trader in the local trading area and serve as the essential bridge for the entire trade pattern. As a result, policies should not only focus on the subsidies for electricity generating or the production capacity, but also for the cooperation with countries that were not common before. In this way, governments will increase their influence and their position in dialogues, both of which are significant for future development.
Due to the limits of the data, future studies will analyze the international trade of more renewable energy-related commodities. Additionally, economic factors, policies, and other elements will be analyzed with respect to international trade and renewable energy related commodities.


