Article

Women on Boards and Corporate Social Responsibility

1
College of Business, Hongik University, Seoul 121-791, Korea
2
Department of Business Administration, Kyung Hee University, Seoul 02447, Korea
*
Author to whom correspondence should be addressed.
Sustainability 2016, 8(4), 300; https://doi.org/10.3390/su8040300
Submission received: 22 December 2015 / Revised: 14 March 2016 / Accepted: 22 March 2016 / Published: 24 March 2016
(This article belongs to the Special Issue Sustainable Leadership and Management)

Abstract

:
A growing body of research suggests that having more women in the boardroom leads to better corporate social responsibility (CSR) performance. However, much of this work views the CSR-enhancing effect of women directors as largely driven by their moral orientations and rarely considers other underlying mechanisms. Moreover, less explored are the firm-specific conditions under which such CSR-promoting roles of female directors might be performed more (or less) effectively. In this paper, we seek to bridge this gap in the literature by (1) proposing an additional account for the positive influence of female independent directors on the firm’s CSR and (2) illuminating the organizational context in which female directorship is likely to translate into good CSR performance. We argue that women independent directors might take CSR issues more seriously than their male counterparts not only because of their stronger moral orientations, but also because they have reputational reasons to do so. Further, we suggest that female directors’ concerns about CSR-relevant matters are more (less) likely to gain support from other members of the organization when their company is doing more (less) business in the product markets where reputation for CSR is more (less) vital for success. Using a sample of Standard & Poor’s (S&P) 1500 index firms (2000–2009) and the data on their board composition and CSR ratings, we find strong support for our argument. We find that the number (or proportion) of women independent directors is positively associated with a firm’s CSR ratings and that the strength of this relationship depends on the level of the firm’s consumer market orientation.

1. Introduction

In recent years, corporate social responsibility (CSR) has become one of the major concerns for many companies and their managers [1,2,3]. Such a trend is well evidenced by the fact that numerous for-profit organizations now regularly report a wide array of social and environmental initiatives that they have taken to improve their CSR performance [2,3]. Further, the CSR activity profiles and track records of a large number of firms have increasingly been tracked and compared by independent third-party ratings agencies [4]. There are even sets of self-regulatory measures devised and collectively taken by members of industry-level associations [5]. All of these observations suggest that, at least on the surface level, CSR has emerged as an important theme of management in the contemporary corporate boardroom.
Nevertheless, not all companies care equally about the matters pertaining to non-shareholding stakeholders—such as employees, consumers, and the community—and voluntarily dedicate their resources to social and environmental initiatives intended to promote those parties’ welfare. What explains this variation in CSR efforts and performance among firms? Over the past years, scholars from diverse disciplines and theoretical perspectives have sought to address this question [6,7,8,9,10]. In particular, research suggests that firms having more women in their boardroom tend to do better in CSR relative to their peers with fewer female directors [11,12,13,14,15,16,17]. This finding is perhaps not very surprising, primarily because it speaks to our intuition that women are often more empathetic and caring than men. Far less clear, however, is how such qualities of women, in general, and female leaders (i.e., independent board of directors), in particular, might transform into organization-level effort toward CSR, thereby generating differences in CSR performance across firms.
Much of the prior research typically theorizes about the CSR-enhancing impact of female directors deriving predominantly from a literature on gender differences in moral and communal orientations [11,12,13,14,15,16,17]. Yet, it is also possible that the positive influence of women board members on a firm’s CSR may be driven by their reputational concerns. Further, a more nuanced understanding of the CSR-promoting role of female directors requires paying attention to the specific organizational context in which such a role is likely to be performed more (or less) effectively. Moving one step further from previous studies on the linkage between women on boards and firms’ CSR, this paper offers an additional, and perhaps complementary, explanation for the impact of female directorship on the firm’s CSR, exploring firm-specific conditions that affect such a relationship.
We suggest that, apart from the intrinsic propensity of women (leaders) to care about moral and social issues, reputational concerns of women independent directors can influence how actively and thoroughly they will perform their board role pertaining to CSR. We further argue that one important aspect of an organization that is likely to foster or suppress effective board role performance by female directors is the degree to which the organization in question is oriented towards individual consumers. A firm’s market orientation matters here because those selling their products directly to individual consumers are more inclined to pay attention to their CSR performance. Good CSR performance often boosts firm reputation [18]. Better reputation, in turn, will likely generate more sales [19,20,21,22,23]. Under such circumstances, women board members will more likely voice their concerns about non-shareholding stakeholders—including existing and potential consumers—and such opinions are more likely to be listened to and to receive support from other key decision-makers.
Empirically, we are concerned with, first, identifying the effect of the number (or proportion) of female independent board members on a firm’s CSR performance and, second, specifying those features of organizations that moderate this relationship. We conducted our empirical analyses in the context of large U.S. companies operating across diverse industries through multivariate regression analyses. To this end, we compiled a dataset comprised of Standard & Poor’s (S&P) 1500 index firms, combining the detailed information on all of their individual board members (executives and non-executives), company financials and CSR ratings given by a third-party agency during the period of 2000–2009.
Our firm fixed-effect results show that the number (or proportion) of women independent directors is positively associated with a firm’s CSR ratings, corroborating the idea that female directorship increases a firm’s CSR performance. Furthermore, the results from our interaction effect models show that the female directorship-CSR performance relationship strengthens (or weakens) for firms with more (or less) orientation toward individual consumers, as indicated by firm-level advertising spending or whether the firm is doing business in consumer product market categories. We also conducted several robustness checks to ensure that these results are not sensitive to different measurements of CSR performance and that they are stable with different model specifications. Particularly, using the inverse probability treatment weight (IPTW) approach [24], we statistically addressed concerns about self-selection that, if existing, can pose a severe problem in causally interpreting our results.
Overall, a series of results reported in this article lend strong support to our argument. Findings show that the more independent female directors on the board, the better the firm’s CSR ratings and that the level of the firm’s consumer market orientation influences such a relationship. In particular, the interaction effect we identify constitutes evidence for our argument that, when firm reputation for CSR is important for product market success, women independent directors play their board role (i.e., monitoring in CSR-relevant areas) more effectively. Taken together, theory and findings presented in this paper further advance our understanding of the relationship between women on the board and a firm’s CSR by demonstrating the contingent role of female independent directors in CSR and highlighting the firm’s consumer market orientation as a critical feature of the organizational context in which such contingency arises.
The rest of this article is structured as follows. First, we briefly review prior research on CSR. Then, we move on to develop our hypotheses about the relationship between women on boards and CSR and the moderating influence of a firm’s consumer market orientation on such a relationship. Next, we provide descriptions of our methodology, followed by interpretations of the empirical results. Finally, we discuss the contributions and limitations of the current study and implications for future research.

2. Background

Although the precise definition and scope of corporate social responsibility (CSR), as well as its relations to other cognate concepts, such as sustainability, is still the subject of much debate, in this paper, we follow the common conceptualization of the term and use the term to denote the responsibilities of the firm that extend beyond duties to shareholders [1,2,3,6,9,10,25]. Stakeholders refer to individuals or groups who are affected by, or whose actions can directly, or sometimes indirectly, affect the firm’s operation in the economic and social realm [1,2,3,6,9,10]. As such, stakeholders include employees, consumers, suppliers and related organizations, the local community and the general public [1,2,3,6,9,10,25]. A firm’s CSR performance, thus, largely reflects the extent to which it engages in company-wide initiatives as a response to a wide range of interests of those non-shareholding stakeholders [17,18,19,20].

2.1. The Ascendancy of CSR

Over the past decade or two, we have witnessed that CSR rose to its prominence, becoming a more or less legitimate element of management philosophy. Frequently appearing in news reports and business magazines are accounts by senior executives of well-known companies boasting their company’s commitment to CSR. Some observers view them as reflecting genuine commitment. Others see them as mere rhetoric. To be sure, the precise degree to which those firms substantively implement CSR policies and practices in order to fulfill their commitment is subject to further empirical scrutiny, but such a question is beyond the scope of the current inquiry.
Despite ongoing debates about the nature and extent of CSR for the 21st century firm, it has been commonly acknowledged that, in general, firms take CSR much more seriously nowadays than they used to [2,3,19,26]. While corporate philanthropy has a long history, until recently, the notion that corporations ought to care about the welfare of employees, consumers, the local community and wider societal sectors (i.e., the environment and humanitarian concerns) did not gain broad support from the business world. To be sure, ethics scholars and leading thinkers in the business world had long advocated for the idea that even for-profit organizations have, and ought to assume, social responsibilities beyond obligations to their shareholders. Yet, for many firm owners and managers, their interests and those of other stakeholders had often been perceived to be difficult to align and even irreconcilable with one another [1,26]. Consequently, many for-profit organizations had long subscribed to the managerial logics and practices that are focused more on achieving (short-term) profits, sometimes at the expense of other stakeholders. Such a profit imperative had almost been taken for granted especially among those companies firmly adhering to the Anglo-Saxon model of corporate governance [1,3,7,8,26]. Diverting a company’s resources by managers to uses other than those designed to protect and increase shareholder wealth was often viewed suspicious and as a sign of managerial opportunism.

2.2. Two Perspectives on CSR

What explains this seemingly drastic shift in attitudes toward CSR among firms? One way to tackle this puzzle is to track firms’ CSR activities over many decades and examine their antecedents. While such an analysis would be desirable, the CSR data that span a long time horizon are often difficult to obtain. Instead, researchers have typically investigated antecedents, and consequences, of CSR using the data on contemporary firms over a relatively short span of time [6,7,8,9,10,19,20,21,22,23]. Although these studies differ markedly in their analytical approaches (i.e., the level of analysis, method and research context), two broad theoretical perspectives underlie much of the extant literature on CSR.
First, the value-based perspective emphasizes the role of normative values and beliefs held by key decision-makers of organizations in firms’ CSR efforts and performance. This view posits that company-wide efforts toward CSR will be engendered by firm owners, managers and other organizational members who strongly subscribe to the view that privileges ethical duties to a host of stakeholder communities over relentless pursuit of profits [9,23]. In other words, these individuals and thus their companies are seen as intrinsically motivated by their moral or social concerns, thereby dedicating more resources to CSR endeavors and other social causes, regardless of the implications for profits. For example, companies, such as Ben and Jerry’s Ice Cream, Tom’s Shoes and Body Shop, are all widely known for their seemingly authentic engagement in CSR activities.
Second, the instrumental or strategic perspective highlights economic incentives as a key driver of a firm’s involvement in CSR activities. This perspective suggests that organizations invest in CSR endeavors, not necessarily because they are internally motivated by concerns for others, but because they have instrumental or strategic motivations: that is, CSR is good for business. Put differently, firms have incentives to do good given the increasing importance of CSR for the product and financial market success. Such a view is unequivocally echoed below in an excerpt from the remarks of the CEO of McDonald’s in the company CSR reports:
“This notion of ‘good’ has always been an important part of our heritage—and it’s an equally important part of our future. We are committed to working toward a tomorrow where quality food and balanced choices are accessible and affordable to all. Where the food we serve is sustainably sourced from thriving farms. Where environmental protection and efficiency are universal. Where people from all walks of life are valued for their unique contributions to a shared global community. And, where every restaurant is more than an address on a map—it’s part of the local neighborhood… We realize that our business and our responsibilities to society are inextricably linked. Now more than ever, customers care about where products come from, how they are sourced, and the environmental, ethical and economic impact of purchase decisions they make each day… the ways we choose to address these challenges will change the world for the better and ensure we maintain an enduring, sustainable and profitable business model.” ([27], (p. 5), emphasis added)

2.3. CSR as Business as Usual?

Compared to the value-based perspective, the instrumental or strategic perspective has gained much broader empirical support [28,29,30,31,32,33]. Among others, Flammer (2015) showed that intensifying competition from foreign firms triggers companies to increase their investments in CSR [28]. Researchers further discovered that firms sometimes use CSR as insurance to hedge against reputational risk [32,33]. These findings are consistent with the view of CSR as driven by economic incentives and strategic motivations, illustrating that managers increasingly see CSR as a source of competitive advantage and a useful tool to ensure their success and survival in the market [28,29,30,31,32,33]. Moreover, sizable evidence reveals that doing-good firms also do well both in the product market and in the factor market [19,20,21,22,23,28,29,30,31]. For example, Lev, Petrovits and Radhakrishnan (2010) found that charity donations boost firm sales [29]. Cheng, Ioannou and Serafeim (2014) found that CSR engagement allows firms to better access financial resources from outside parties [31].
Clearly, evidence corroborating the instrumental or strategic perspective on CSR remains strong. However, it is also important to note that the shortage of systematic evidence for the value-based perspective does not mean that intrinsic motivations based on moral values and beliefs have no influence on firms’ CSR efforts and performance. The lack of large-scale empirical studies related to the value-based perspective might just reflect the difficulty of collecting large datasets on the values and beliefs of organizational members. In the discussion that follows, we show how a balanced consideration of both perspectives on CSR can help us to better understand the factors behind firms’ CSR efforts and performance.

3. Theory and Hypotheses

Management scholars have also taken interest in antecedents of CSR, linking various characteristics of key decision-making entities within organizations to firms’ CSR efforts and performance. One stream of research focuses primarily on individuals belonging to the so-called top management team (TMT), arguing that firm-level differences in CSR endeavors are attributed to differences in certain characteristics of those individuals [34,35,36]. In particular, researchers contended that psychological traits of high-level officers affect companies’ involvement in CSR-enhancing practices. For example, Petrenko and his associates (2015) demonstrated that chief executive officers (CEOs) more exposed in the media, hence, presumably, more narcissistic and more arrogant, are likely to allocate more resources to the projects designed to raise their firm’s CSR profiles. Overall, this line of research further suggests that firms’ CSR efforts are, at least in part, driven by such instrumental or strategic motivations of individual TMT members, as they desire for more external attention, better reputational standing and higher labor market value [34,35,36].

3.1. Board of Directors and CSR

Instead of focusing on personal attributes of decision-makers, other researchers in the management field have turned their attention to the group-level characteristics of decision-making bodies within an organization to shed further light on antecedents of CSR [37,38,39,40,41]. In particular, they have examined how certain features of the board of directors (BOD) affect a company’s involvement in CSR activities, finding that differences in CSR efforts and performance are partly explained by differences in the structure and composition of the BOD. For example, it was shown that the size of the board matters. In particular, the number of independent directors was considered an important element in this [37,39]. This is perhaps because not only do independent directors have fiduciary duties to shareholders, as a guardian of shareholder interests preventing the use of firm resources for purposes other than increasing shareholder wealth, but also, they are expected to perform other kinds of monitoring roles, namely ensuring the firm’s compliance with regulatory standards, which are often related to CSR issues. Consequently, increased board capacity, which is likely to be attributed to the increase in the number of independent directors, tends to improve the firm’s CSR performance.
Another set of findings that has attracted much attention concerns the impacts of board-level diversity, particularly gender diversity, on firms’ CSR efforts and performance. While an increasing number of studies has documented that female directorship affects CSR [11,12,13,14,15,16,17], less understood is how the presence of women independent directors on the board can affect the CSR performance of a firm. Combining research on the role of independent directors and the role of women directors, the current paper considers two potential mechanisms behind the CSR-promoting effect of women independent directors.

3.2. Women on Boards and CSR

The conventional explanation for the CSR-promoting role of women leaders (i.e., board of directors) is rooted in the long-standing idea that women, in general, are more ethically sensitive and empathetic than men [11,12,13,14,15,16,17]. Gender socialization theory, a prominent theory on gender differences, posits that men and women are different in their orientation toward moral principle, largely because women have better internalized ethical and communal values through their social roles. Ample support was found for this conjecture, indicating that women tend to have stronger moral standards and ethical stance than men. For example, Eagly and Carli (2003), in their attempt to link social role theory to the theory of leadership, suggested that communal orientation—including aspirations and values of being helpful, kind, sympathetic, interpersonally sensitive and nurturing—are more frequently found in women [42]. The authors continued to argue that such differences are likely to be reflected in women’s various leadership roles. Similarly, Ibrahim, Angelidis and Tomic (2009) showed that female managers tend to exhibit more positive attitudes toward the adoption of an ethics code in their organization and hold more confidence that the ethics code will raise moral standards in their business operations [43]. Together, this stream of research suggests that female leaders are more likely to have concerns for other stakeholder groups. As such, it is reasonable to expect that female independent directors will embrace their company’s CSR more strongly than male directors, actively engaging in issues corresponding to the welfare of non-shareholding stakeholders.
However, it is also possible that women independent directors are compelled to pay more attention to their firm’s CSR due to reputational concerns. First, women independent directors can establish or improve their reputational standing within the organization through their expertise in CSR-relevant issues. Research suggests that women managers are known for their in-depth knowledge and competence in such areas as marketing or human resource management [44,45,46]. These so-called soft-issue areas have much overlap with CSR issue areas. Research also suggests that women leaders typically experience difficulty in establishing credibility and influencing others in areas of technical issues [45,46]. Given this, they might view exhibiting their expertise and competence in CSR issue areas as an opportunity to enhance their reputational position within the organization. Accordingly, we expect that women independent directors are likely to show greater enthusiasm and concerns about CSR issues in boardroom meetings and committee-level activities.
Second, the performance of one’s role as independent director affects his/her reputation in the external labor market. Often, executives and independent directors associated with wrongdoing companies suffer damaged reputation and encounter labor market penalty. Given this, it is important for independent directors to do their job thoroughly, especially with respect to those concerning the firm’ ethical or social compliance. In addition, research uncovered that female independent directors are often more sensitive to the possibility of rule violations and thus tend to be more vigilant upon signs of improprieties. For instance, Cumming, Leung and Rui (2015) showed that as female representation on boards increased, the level of corruption in their sample companies declined [47]. Together, this discussion suggests that career-related incentives, combined with women’s high level of vigilance, might result in their paying more attention to the firm’s compliance with CSR-related standards [21]. Thus, we predict:
Hypothesis 1
The greater the number (or proportion) of women independent directors, the better a firm’s CSR performance.

3.3. The Role of Consumer Market Orientation in the Women Directorship-CSR Linkage

So far, we have suggested that female independent directors are likely to take a leading role in CSR-relevant domains because these domains are where they can exhibit their expertise and competence and because their firm’s reputation for CSR can affect their labor market value (as independent directors). However, as with other corporate-level decision-making, decision-making concerning CSR-related policies and practices requires some level of consensus in boardroom discussion. Consensus is most likely to arise when the majority of those occupying board seats have shared interest in a given agenda. To summarize, for a firm to form and implement effective CSR policies and practices, concerns about non-shareholding stakeholder issues should be broadly shared among board members and other members of the organization.
We argue that one important aspect of an organization that might affect the level of such consensus and, hence, the strength of the female directorship-CSR linkage is the extent to which the organization in question is oriented towards individual consumers. Consumer market orientation is defined, in this paper, as the extent to which the company is doing business directly with individual consumers. Studies showed that buying decisions of individual consumers are influenced by the ethical reputations of selling firms, amongst other things. Therefore, how actively women board members voice their CSR concerns and how thoroughly they engage in compliance-related monitoring activities can be influenced by the extent to which the idea that good CSR boosts corporate reputation and better reputation generates more business is broadly shared within an organization. For example, in organizations with greater levels of consumer market orientation, women directors, keenly aware of the importance of their firm’s CSR on market success, might more readily voice their concerns about non-shareholding stakeholders. Such opinions, in turn, are more likely to garner support from other decision-makers and members of the organization insofar as they care about their company’s product market success [48], thereby resulting in better CSR performance. Similarly, women directors, knowing the importance of their firm’s CSR on market success, are likely to do their compliance-related monitoring job more thoroughly, and such performance will positively contribute to their reputation, thereby setting in motion a positively-reinforcing cycle. By contrast, in organizations with lesser levels of consumer market orientation, female directors’ concerns about the matters relevant to non-shareholding stakeholders are less likely to gain buy-in and garner recognition from the male majority on the board. Based on this reasoning, we expect that the effect of the number (or proportion) of women independent directors on firms’ CSR efforts and performance would be more pronounced for firms more strongly oriented towards consumer markets. Formally:
Hypothesis 2
The effect hypothesized in H1 increases (decreases) for firms with more (less) consumer market orientation.

4. Methods

4.1. Data and Sample

We built a dataset for this study from multiple sources. Four databases were used, including: (1) BoardEx, which contains detailed information on the activities of the board and the profiles of individual directors of a large portion of the firms listed in the U.S., covering S&P 1500 index firms; (2) Kinder, Lydenberg, & Domini (KLD) STATS (Statistical Tool for Analyzing Trends in Social and Environmental Performance), provided by RiskMetrics Group, which compiles CSR-related ratings of the majority of S&P 1500 index firms; (3) COMPUSTAT North America, which keeps track of industry affiliations and financials of almost all publicly-traded U.S. firms; and (4) Audit Analytics, which has the data we need for the construction of one of our control variables, shareholder activism.
To arrive at the sample for the analysis of the relationship between female board representation and firms’ CSR ratings, we first identified S&P 1500 firms for the period from 2000–2009, and then, we merged the data needed to construct the variables for these firms using CUSIP (Committee on Uniform Security Identification Procedures) codes across all of the above four sources. The starting year of 2000 was chosen because BoardEx began to track board-related information from 2000. All of the right-hand side variables, including our board-level variables, are lagged one year in the regression models in order to prevent the possibility of reverse causality. We removed those observations with missing data. We also removed a few observations with extremely abnormal values that were found in some of our control variables, such as sales growth and revenues. Including these outliers in the analyses did not change our results. This procedure yielded an unbalanced panel of 7151 firm-year observations with 1102 unique firms during our study period: the number of firms captured in each of the ten years of our study ranges from 39 in 2000 to 1007 in 2009.

4.2. Dependent Variables

Following the conventional approach, we used KLD ratings to measure firms’ CSR performance. KLD is the most commonly-used data source in the CSR literature [49]. KLD ratings are derived from ratings given by independent analysts, KLD Research & Analytics, to the rated firms’ CSR states across a broad range of stakeholder issue domains, including community, diversity, employee relations, environment, corporate governance, product and human rights. Along these seven dimensions, KLD groups CSR-relevant items into two categories of strengths and concerns. KLD assigns a 1 or 0 based on whether or not a firm meets the criteria set for each category [49].
Our dependent variable CSR score is created to measure a firm’s CSR performance at year t. The CSR score is computed as an aggregate net score of ratings—total strength ratings minus total concern ratings—along the six dimensions we chose. Out of KLD’s seven issue areas mentioned above, we left out corporate governance, because it is not exclusive to non-shareholding stakeholders and speaks more directly to the issues concerning shareholders. The rest of the stakeholder issue domains were used to calculate a firm’s CSR score, and they include community, diversity, employee relations, environment, human rights and product [4,50]. We assumed that a firm’s CSR score represents its efforts at CSR, which is reflected in its CSR ratings.

4.3. Hypothesis-Testing Variables

Our independent variables of interest are the number and the proportion of female independent directors on a firm’s BOD. This measure was derived from BoardEx, which classifies directors into two groups: executive directors (ED) and supervisory directors (SD). We considered directors indicated as ED as inside directors. SD includes both non-executive (or affiliated directors), such as retired CEOs and independent directors (also known as outside directors). We defined independent directors as those who belong to the category of SD, but who are not affiliated directors. With this coding scheme, we counted the number of women independent directors for each firm in our sample. We also computed an alternative, ratio measure of female board representation by dividing the number of female independent directors by the total number of independent directors at each company.
Our moderating variable is a firm’s orientation toward consumer sales, which determines its sensitivity to consumer perceptions. We used two proxies that capture a firm’s orientation toward consumer sales. First, we constructed a firm’s advertising intensity, which is the ratio of advertising expenditure over sales. As an alternative to advertising intensity, we also created a dummy variable for those companies operating in consumer industries. We coded a 1 for the firms belonging to the following four-digit SIC codes: 0000–0999, 2000–2399, 2500–2599, 2700–2799, 2830–2869, 3000–3219, 3420–3429, 3523, 3600–3669, 3700–3719, 3751, 3850–3879, 3880–3999, 4813, 4830–4899, 5000–5079, 5090–5099, 5130–5159, 5220–5999, 7000–7299, 7400–9999.

4.4. Control Variables

We included four sets of financial and other business-operational variables at the firm level that might influence a firm’s involvement in CSR. First, firm size might be associated with CSR because larger firms are more salient and, thus, tend to attract more attention from consumers, the media and the general public, which may compel them to look good. Accordingly, large firms might care more about their CSR performance relative to small firms. Firm size is measured using the value of total assets: that is, the book value of a firm’s assets. We report the results using the unlogged value for total assets, and the use of the logged value did not change the results. Firm sales might be associated with CSR for a similar reason. Firm sales are measured using the revenues earned during the previous year. We report the results using the unlogged value for revenues, and the use of the logged value did not change the results.
Second, more successful firms have greater resources to dedicate to CSR endeavors relative to their less successful counterparts. At the same time, better-performing firms might get readily complacent and even arrogant about their success, and hence, they are less likely to pay attention to the issues involving non-shareholders. Both logics are equally plausible, and hence, the effect of financial and market success on CSR needs to be empirically investigated. Accordingly, we included several indicators of a firm’s market and financial performance: that is, sales growth, return on equity (ROE) and Tobin’s Q. Sales growth is measured as the change in sales over the previous year. ROE is measured using the ratio of net income to shareholders’ equity. Tobin’s Q is measured as the ratio of the market value of a firm’s assets to their replacement value. The market value of assets is taken as the book value of assets, the net of the book value of common equity, plus the market value of equity, defined as closing share price at the end of the fiscal year multiplied by the number of common shares outstanding.
Third, it is possible that financially-distressed firms are likely to have less resources to invest in CSR activities, and thus, we controlled for the level of financial distress a firm is experiencing during a given year. We used market leverage as the first indicator for a firm’s financial difficulty, which is often used to measure its financial health. It is calculated as the ratio of debt to the market value of the firm’s assets. We also used the Altman Z-score to gauge a firm’s financial distress. The Altman Z-score indicates how close or far a company is from bankruptcy. The Altman Z-score is computed as follows: Z = 0.012X1 + 0.014X2 + 0.033X3 + 0.006X4 +0.999X5, where X1 = working capital/total assets, X2 = retained earnings/total assets, X3 = earnings before interest and taxes/total assets, X4 = market value equity/book value of total liabilities, X5 = sales/total assets and Z = overall index [51].
Fourth, we included a variable measuring a firm’s research and development (R&D) intensity, which is computed as the ratio of R&D expenditure over sales, because some scholars suggested that a firm’s research orientation might be associated with CSR. The level of labor intensity might also be associated with a firm’s effort at CSR and, thus, was controlled for. Labor intensity is computed as capital expenditure over sales.
We also controlled for several board-level variables, some of which were shown to predict a firm’s level of CSR efforts and performance. We included in the models three variables relevant to the size of the board: the number of executive directors, the number of non-independent, but affiliated directors, and the number of independent directors. Using the size of the overall board, instead of the three separate variables, did not change our main results. Further, we controlled for the presence of a stakeholder-oriented board committee or board committees dedicated to environmental and social issues [52]. We used keyword search (i.e., environment, sustainability, health, safety, compliance, social, etc.) to code this variable.
In an attempt to clearly separate out the effect of the number (or proportion) of women independent directors from other board diversity variables, we included the tenure, function and age diversity of a firm’s BOD [11,12,13,14,15,16,17]. Research suggests that group members with high levels of overlap in the time spent together, in functional backgrounds, and in age range tend to exhibit opinion conformity or group thinking, which can affect their attitudes toward CSR in certain ways. By contrast, groups with high levels of diversity along those dimensions are likely to take more time and effort in deliberation, which might be crucial when making decisions on matters pertaining to CSR. BoardEx reports details of individual directors that include their age, title, gender, number of years worked at the current company and career histories, except for ethnicity information, and thus, we were unable to control for board-level ethnic diversity, which might be associated with a firm’s CSR. Three board-level diversity variables were constructed as follows. Directors’ tenure diversity is computed as the standard deviation in the directors’ years in a company. Second, to construct the diversity of the board along the functional dimension, we first classified each director’s dominant functional background into one of the following eight tracks: production-operations; R&D and engineering; accounting and finance; management and administration; marketing and sales; law; human resources; other. Next, we used a version of the Herfindahl index to capture functional diversity at the board level. The index can vary between 0 and 1, with values close to 1 indicating higher diversity and values close to 0 indicating that the board is dominated by a single category. Third, in order to compute the age diversity of directors, we first determined each director’s age as belonging to one of the following three ranges: below forty, from forty-one to sixty and above sixty-one. Then, as with board functional diversity, we used a version of the Herfindahl index to capture age diversity at the board level. The index can vary between 0 and 1, with values close to 1 indicating higher diversity and values close to 0 indicating that a board is dominated by one age category.
We also controlled for the percentage of directors with finance or accounting background, as it may predict a firm’s investment pattern in shareholder vs. non-shareholding stakeholder issues. We included other TMT-level variables, which might be related to a firm’s level of effort toward CSR. CEO power can affect much of a firm’s important decision-making. As a proxy for CEO power, we used the CEO/chair duality, a dummy variable that takes the value of a 1 if the chairperson and CEO are the same, and a 0 otherwise. To separate out the effect on the CSR of women independent directors from that of other women leaders, we controlled for the number of executives who are women.
Finally, we adjusted for two factors related to corporate governance of the firm that might influence firms’ involvement in CSR activities [53]. We created a dummy variable to indicate the years after the enactment of Sarbanes-Oxley Act of 2002. Firms might be compelled to pay more attention to their CSR during the post-Sarbanes-Oxley period. Additionally, firms more prone to shareholder activism might take a more conservative stance in their spending on projects that do not immediately contribute to shareholder wealth. We retrieved information about shareholder activism of our sample companies from Audit Analytics. Audit Analytics has been tracking beneficial ownership reports filed with SEC (Securities and Exchange Commission) by shareholders, which record their acquisition of more than 5% of the voting class of a company’s securities and their purpose for such transactions. Among various reasons for such transactions, Audit Analytics identifies those aiming to control the management of the company (i.e., intent to acquire control of the company, intent to change or nominate the board, intent to replace management, intent to control the board and intent to maintain control). We coded the number of such shareholders’ actions during a given year.

4.5. Summary Statistics

Table 1 displays descriptive statistics of the variables used in our regression analyses. Among our sample firms, the total CSR score ranges from 9–15, and the mean level of the CSR score is slightly negative. Our average firm has one female independent director on its board. There are firms in which women occupy as many as six independent board seats. Table 2 presents correlations for the variables entered in the regression models. The pairwise correlations among the independent variables are not particularly strong. The variance inflation factors (VIF) test confirms that there is no serious multicollinearity problem among our right-hand side variables.

5. Results

5.1. Main Effects

Table 3 summarizes the results of our firm fixed-effects OLS regression analyses that test the direct effect of the number (Models 1–4) and percentage (Models 5–8) of women independent directors on firms’ CSR scores. Though most prior studies have not used firm fixed-effects specification, it is important to control for firm-specific unobservable factors that might be time-invariant affecting a firm’s level of effort toward CSR, like founding philosophy. The Hausman test confirms that fixed-effect models are more appropriate to use in these data. Throughout the models, we also include year fixed-effects and the lagged dependent variable to control for macro-economic influences that invariantly affect firms’ CSR and within-firm path dependency, respectively.
We first estimated a baseline model that has only firm-level control variables and the post Sarbanes-Oxley dummy variable. In this baseline model estimated with firm fixed-effects (Model 1, Model 5), we find a positive influence of firm size (total assets) and a negative effect of firm sales on CSR score. Firms are also shown to have generally increased their efforts in CSR in the aftermath of the enactment of Sarbanes-Oxley Act of 2002. Some prior studies reported that board size is positively related to firms’ CSR score. However, our fixed-effects models suggest that this relationship might be spurious. As shown by the positive coefficients on the lagged dependent variable, firms’ CSR scores are strongly path-dependent.
Model 2 and Model 5 report our main effect results, suggesting a significant positive relationship between the number (or proportion) of women independent directors and a firm’s CSR score (Model 2, b = 0.122; Model 5, b = 0.989). These effects are robust even after controlling for other BOD-level, TMT-level variables. Curiously, our results show that the level of functional diversity of the board is strongly related to a firm’s CSR score, whereas age diversity among board members has little effect. Further, the number of female top executives is shown to have a positive impact on CSR score, but this fails to reach the significance level. This result confirms the importance of separating out the variables for female executives and for female independent directors in the estimation. Notably, the effect of board-level committee dedicated to making decisions on CSR-related issues is consistently positive and statistically significant across all models. Shareholder activism is marginally associated with a firm’s CSR score. Overall, these findings suggest that, when firms have more women independent directors on their boards, they are more likely to do better in CSR-relevant issues, compared to others with fewer or no female directors, lending strong support to our Hypothesis 1.

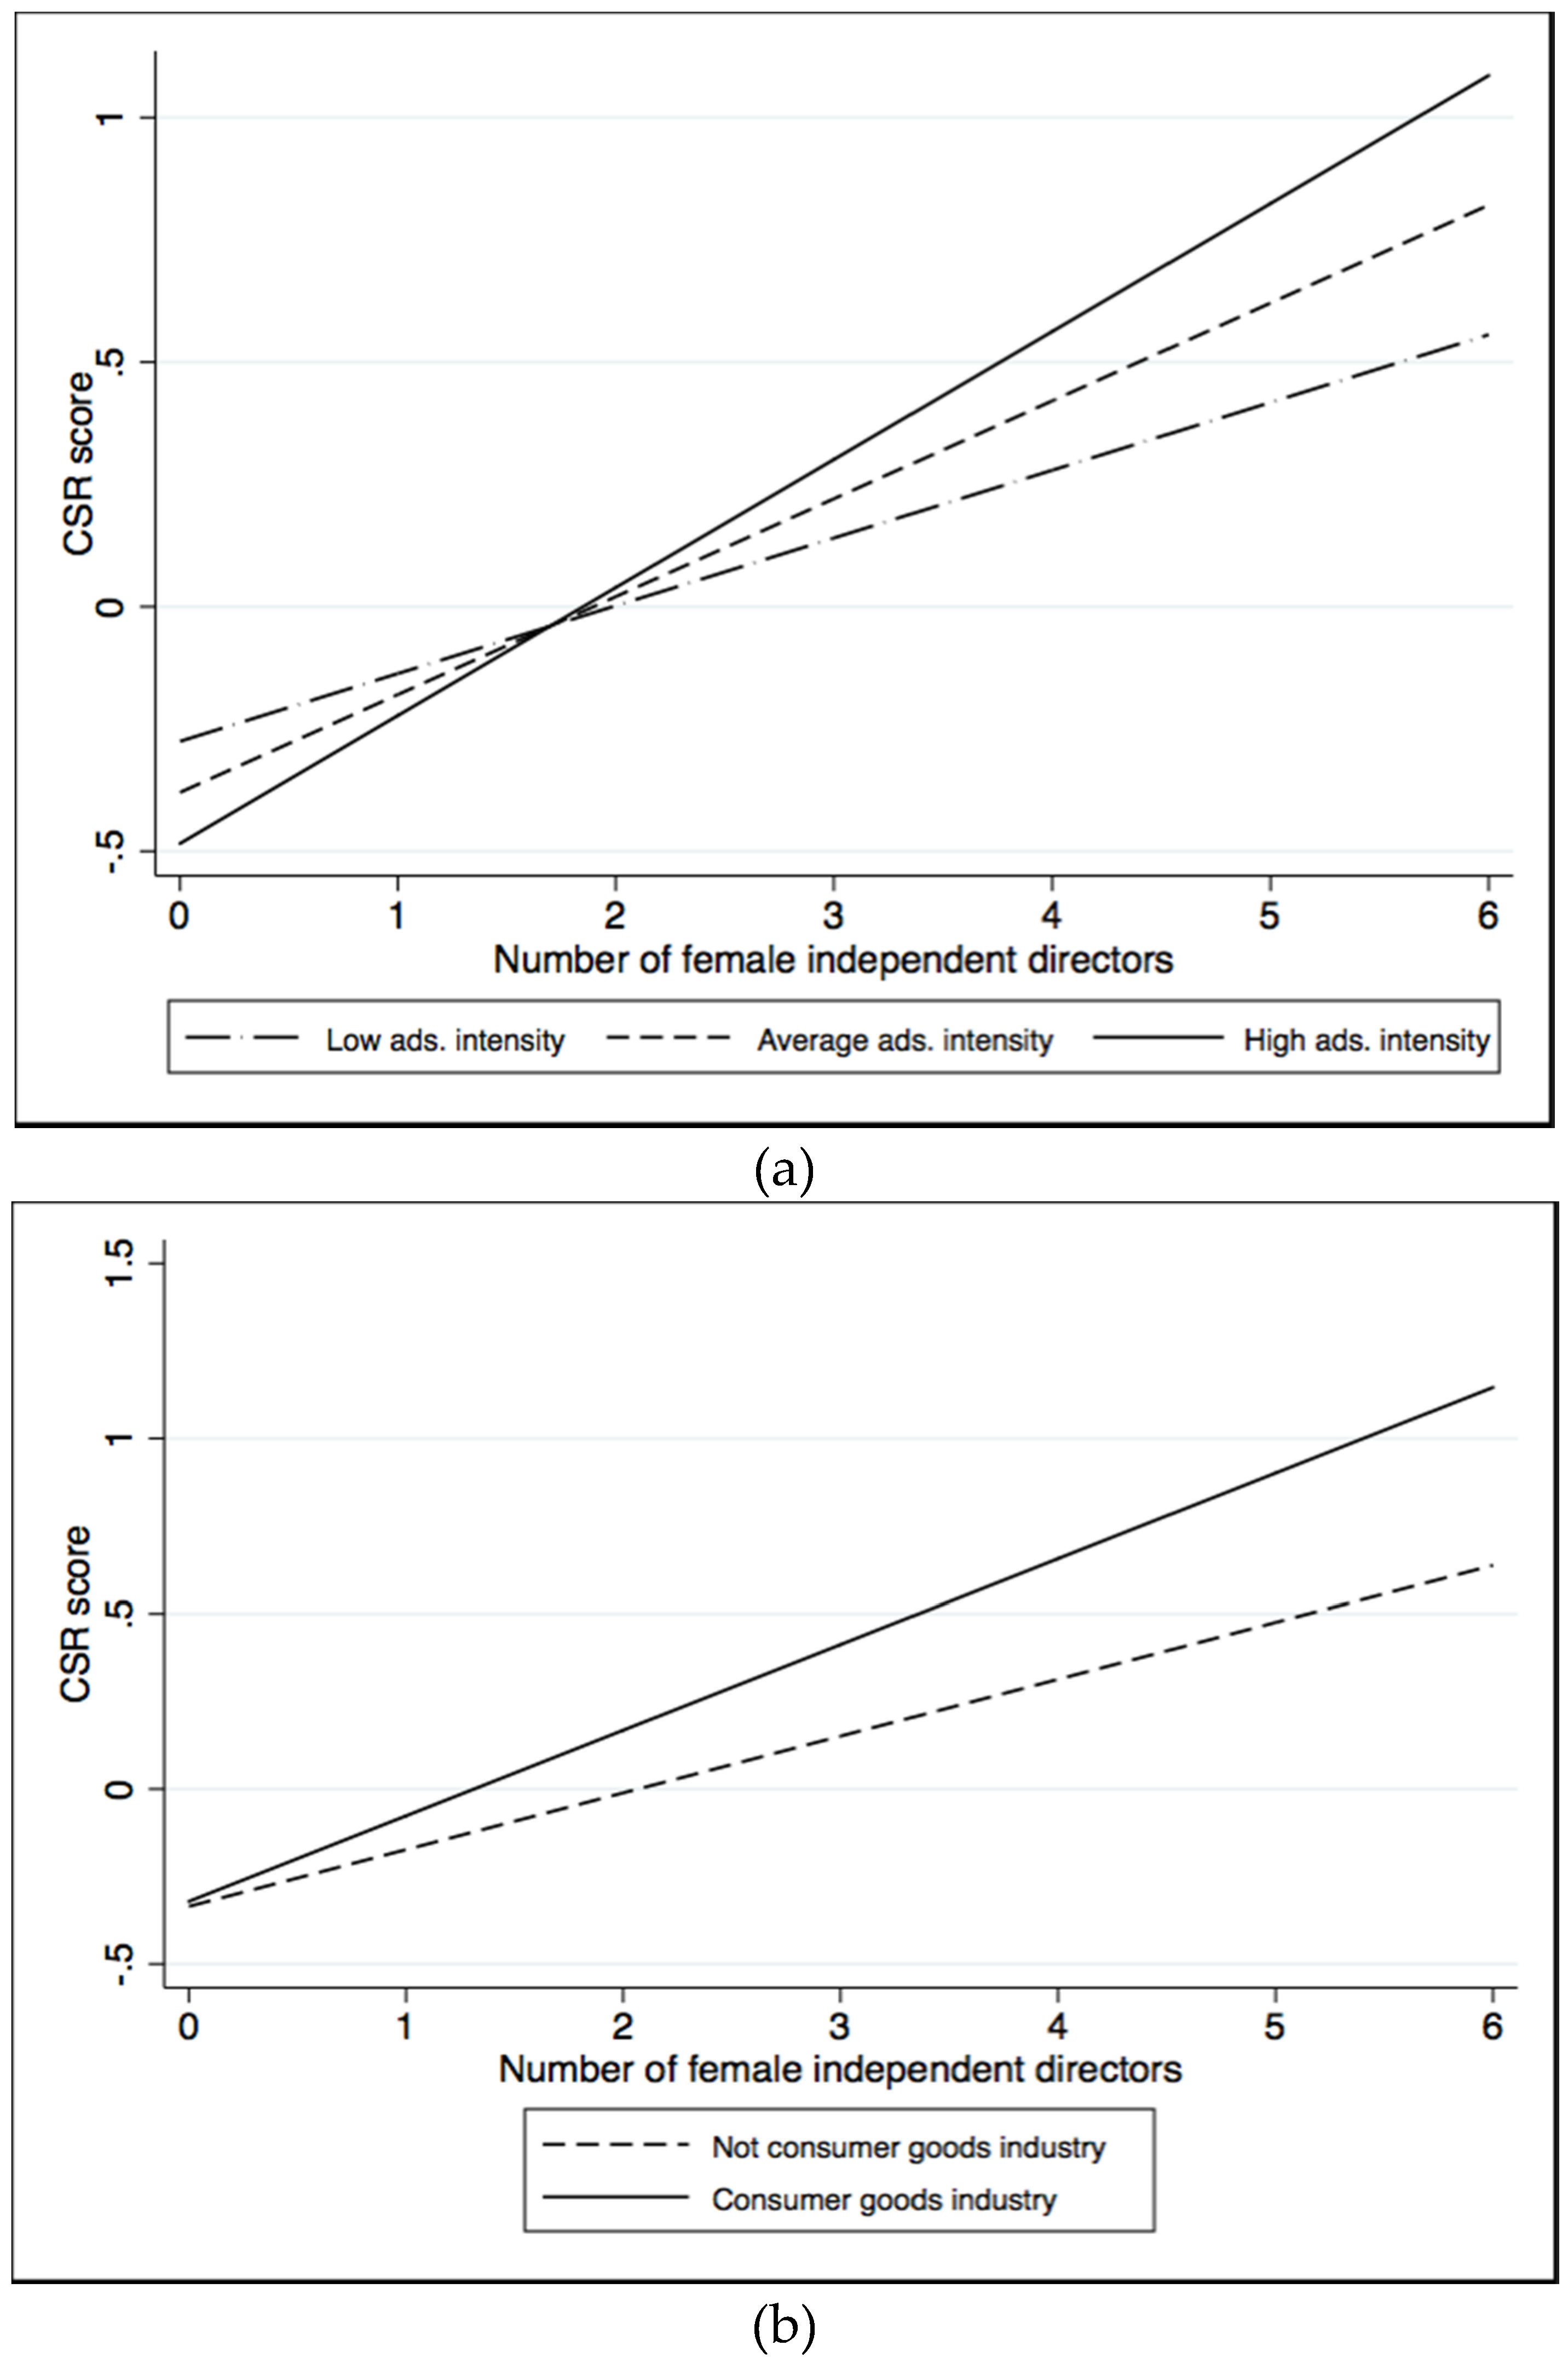
5.2. Interaction Effects

Hypothesis 2 predicts that the positive effect of women independent directors on firms’ CSR score will weaken (strengthen) among those with less (more) consumer market orientations. We test this hypothesis by interacting the main variable, the number (or percentage) of women independent directors, with two firm-level indicators of consumer market orientation, advertising intensity and consumer goods industry. In Model 3 and Model 7, the interaction effect between female directors and advertising intensity is positive and statistically significant. In Model 4, the interaction effect between female directors and consumer goods industry is positive, but only marginally significant, and in Model 8, it does not reach the significance level. In untabulated analyses, we also estimated models with all interaction terms being mean-centered to avoid any potential multicollinearity issues and found the results unchanged. Overall, these results are broadly consistent with Hypothesis 2 predicting the moderating role of a firm’s consumer orientation on the women directorship-CSR linkage. In Figure 1a,b, we plotted these interaction effects (Figure 1a at one standard deviation from the mean of advertising intensity).

5.3. Further Analyses

We conducted several robustness checks to ensure the relationship between the number (or proportion) of women independent directors and firms’ CSR score found in the previous regression models remain robust.

5.3.1. Alternative Measurements of CSR Performance

We ran additional regression models using four different measurements of the dependent variable. First, some researchers have questioned the validity of using a composite measure of the KLD ratings, equal to the number of strengths minus the number of concerns. Because the KLD ratings of strengths and concerns are derived from distinct criteria [4,50,54], the composite scores, researchers argue, may not accurately reflect firms’ CSR performance. To respond to this concern, we created a CSR strength variable, as an alternative measure for firms’ CSR performance, by summing the number of strengths across the six dimensions concerned. The effects of the number of women independent directors on CSR strength remain positively significant across all of these specifications (see Table A1, Model 10). Further, the interaction effects between the number of women independent directors and the two indicators of consumer market orientations (i.e., advertising intensity, consumer goods industry) on CSR strength remain positively significant across all of these specifications (see Table A1, Models 11 and 12).
Second, CSR scores tend to vary considerably across industries. We account for these differences by running additional regression models with the newly-constructed dependent variable, namely the net-of-industry average CSR score. This is calculated as a firm’s CSR score less the median CSR score for all firms in the same industry in a given year. We find similar patterns of the results in these models using the industry-adjusted CSR score (see Table A1, Models 13–16).
Third, one evaluation item in the diversity issue domain, board of directors, has a direct bearing on our independent variable of female directorship. KLD states the criteria for receiving a one in diversity strength in the board of directors as “Women, minorities, and/or the disabled hold four seats or more (with no double counting) on the board of directors, or one-third or more of the board seats if the board numbers less than 12” [49]. We redid all our analyses with the omission of the rating a firm receives regarding this item to ensure that the effect on the CSR score of women directors is not attributed to the firm’s rating on this particular item. We find that our results remain almost intact with this exclusion (results untabulated).
Finally, we re-estimated regression models using the CSR strength ratings a firm receives in each of the six CSR issue domains. We summarize the results in Table A2, which reveals that the strength of the female directorship-CSR association varies widely by specific stakeholder issue domain. This suggests that the interrelationships among female directorship, firms’ market orientation and firms’ CSR performance might be more complex than we initially thought and, thus, tend to vary by issue area. Thus, some cautions are needed in generalizing our results across all CSR issue domains. Nonetheless, the positive interaction effect between the number of women independent directors and consumer goods industry remains in such CSR issue domains as community, employee relations and product, whereas the interaction effect with advertising spending remains only in the results using CSR strength in community as the dependent variable. These findings are broadly consistent with our idea that women directors’ expertise and competence in marketing and human resource management areas enable them to garner more support from other decision-makers insofar as the firm has a stronger consumer market orientation.

5.3.2. Self-Selection Issues

Although we used firm fixed-effects models to account for the influence of time-invariant, unobservable firm attributes, our study might still be exposed to another, possibly more formidable threat to causal inference. The essence of this issue is that our explanatory (treatment) variable, gender-diverse board, as indicated by the number (or percentage) of women independent directors, is not randomly assigned across firms. For example, some firms may bring more women on their board, or self-select into a gender-diverse board, for reasons that are unobserved by researchers, but may still be related to their CSR performance. To mitigate concerns about this problem of self-selection, that is the potential of firms’ self-selecting into boards with more women, we adopted the inverse probability treatment weight (IPTW) model.
IPTW corrects for the possibility that only certain types of firms have a high number (or proportion) of female independent directors by generating a quasi-random sample, assigning more weight to atypical observations and less weight to typical ones. Following prior research [25,55], we thus implemented the IPTW estimation procedure in two steps. First, we estimated each subject’s (firm) probability of receiving its treatment by fitting a probit regression model that predicts the probability of a firm’s self-selecting into having a board with a higher female representation (above the mean). We used a variety of firm characteristics as explanatory variables in this probit model, including other board diversity indicators, as well as the number of women independent directors present in other firms in the same industry, an instrument not related to a focal firm’s CSR score. Next, in the models predicting CSR score, we weighted observations by the inverse of these predicted probabilities computed with the results from the first procedure; that is, we weighted observations in our main regression in inverse proportion to the estimated probability of the treatment actually observed.
The result (untabulated) shows that our main effect (H1) remains robust to the IPTW estimation and that the moderating effect using consumer goods industry (H2) also remains positively significant. Yet, the moderating effect using advertising intensity is no longer significant in this specification, though the coefficient is still in the predicted direction. Overall, the IPTW estimation confirms that firms’ CSR performance increases with more women independent directors, and this effect turns stronger for firms with higher consumer market orientations.

6. Discussion and Conclusions

In this paper, we have closely examined the female directors-CSR performance relationship using the longitudinal data on the board composition and KLD ratings of S&P 1500 index firms from 2000–2010. We hypothesized that female independent directors are more likely to express their concerns about CSR, and such concerns will gain more support from other members of the organization, especially when their company is doing more business in the product markets where reputation for CSR matters for their market and financial success. We found evidence consistent with these ideas and confirmed that these results remain largely unchanged against different measurements of CSR performance and after addressing concerns about self-selection issues. Moreover, additional analysis using CSR issue-specific strength ratings shows that the interaction effect of consumer market orientation on the women directorship-CSR relationship is borne out in community, employee relations and product areas, further supporting our argument about the sources of the CSR-promoting role of women independent directors. Overall, these findings corroborate our argument that the importance of reputation at both the individual level and organizational level is one important mechanism behind the observed effect of women directorship on CSR performance.
While we theorized that women independent directors have strategic incentives to improve their firms’ CSR efforts and performance, it is important to note that we do not argue that this alternative logic is incompatible with the value-based account of the role of female directors. Rather, both of these mechanisms are likely to coexist and complement each other, driving the positive impact of women independent directors on their firms’ CSR performance. We hold that a more balanced and nuanced understanding of sources of heterogeneity in firms’ CSR performance can be achieved by considering both moral/communal orientations and reputational concerns of key decision-makers with organizations.
Beyond our findings illuminating reputational mechanisms underlying the women directorship-CSR relationship, our study also makes several methodological contributions to a growing literature on the role of board-level diversity in firms’ CSR performance. First, unlike some prior studies, we sought to more cleanly identify the net effect of gender diversity from those influences that may stem from other dimensions of board diversity. Second, most prior work has ignored the possibility that some unobservable, third factors might be related to both firms’ tendency to have more (or less) gender-diverse boards and their CSR efforts and performance. Though it is not always feasible to address this kind of endogeneity issue perfectly, we have sought to deal with this problem, at least statistically, thereby presenting evidence that is less problematic. Overall, we provide more systematic evidence that is empirically sound and complete.
There are several findings that hint at some future research opportunities. We theorized that both values and career-incentives of women directors predict the CSR-enhancing role of women directors, but were not able to precisely disentangle one from the other due to lack of more fine-grained data. Future studies are needed to untangle these effects using director-level data on values and labor market indicators. Second, we found that the effect of the number of female top executives on the CSR score is not significant in our models. This finding is particularly interesting, because supposedly, women CEOs or other top executives should have more discretion in setting the CSR-related agenda for their company, relative to female independent or outside directors. If women have stronger ethical and communal values and beliefs, this should also be reflected in the effect of women executives on CSR, but we did not find this effect. Researchers of CSR can benefit further from studies investigating the constraints on women CEOs or other top executives in pursuing their CSR agenda. Third, we found consistent and robust effects for the presence of board-level committees dedicated to handling CSR-related issues. It would be interesting to see whether women directors play a larger role in board-level activities regarding stakeholder issues mainly through such committees. For example, if we find the significant effect of women directors who belong to a CSR-related board committee, but find no effect of those not working at a sustainability-related committee, then it is likely that women directors make differences in board decision-making through their participation in committee-level activity.
Taken together, these studies suggest that the long-held notion that the interests of shareholders and those of stakeholders are incompatible is no longer accurate. The new idea is that, while short-term returns to investments in CSR-related activities are not guaranteed, doing good is also good for the long-term value of the firm. Hence, long-term-focused, forward-looking firms have clear incentives to devote their resources to social and environmental initiatives. A dilemma for corporate managers is how to harmonize the expectations held by both shareholders and other stakeholders, rather than focusing exclusively on one or the other. On a practical note, our theory and findings presented in this paper elucidate one of the ways in which having women directors in the corporate boardroom can make a positive difference in firms’ behavior and performance. Given recent calls for enlarging female board representation across various countries, the idea that more women in the boardroom can lead to more socially-responsible corporations has important implications for all of those policy-makers and managers across the world who are interested in the role of women directors.

Acknowledgments

The work of Eunjung Hyun, Hojin Jung, and Kihoon Hong was supported by the Hongik University new faculty research support.

Author Contributions

All authors contribute equally to the paper.

Conflicts of Interest

The authors declare no conflict of interest.

Abbreviations

The following abbreviations are used in this manuscript:
CSR
Corporate Social Responsibility
KLD
Kinder, Lydenberg, & Domini
TMT
Top Management Team
BOD
Board of Directors
CEO
Chief Executive Officer
ROE
Return on Equity
ED
Executive Directors
SD
Supervisory Directors
SIC
Standard Industry Classification
VIF
Variance Inflation Factor
OLS
Ordinary Least Square
IPTW
Inverse Probability Treatment Weighted

Appendix

Table A1. Firm fixed-effect OLS models of antecedents of CSR strength and the industry-adjusted CSR score.
Variable NamesCSR StrengthsIndustry-Adjusted CSR Score
Model 9Model 10Model 11Model 12Model 13Model 14Model 15Model 16
Prior year # of CSR strengths0.627***0.619***0.618***0.618***0.539***0.535***0.534***0.535***
(0.014)(0.014)(0.014)(0.014)(0.013)(0.013)(0.013)(0.013)
Total asset (in $100,000)1.761***1.742***1.761***1.761***0.926*0.929*0.953*0.942*
(0.334)(0.334)(0.334)(0.334)(0.410)(0.410)(0.410)(0.410)
Revenues (in $100,000)0.0660.0330.023−0.013−0.704*−0.757*−0.771*−0.787*
(0.286)(0.285)(0.285)(0.286)(0.350)(0.350)(0.350)(0.351)
Sales growth0.0080.0130.0100.0140.0540.0610.0580.061
(0.040)(0.040)(0.040)(0.040)(0.049)(0.049)(0.049)(0.049)
Tobin’s Q0.0290.0280.0270.0280.0040.0020.0010.002
(0.022)(0.022)(0.022)(0.022)(0.027)(0.027)(0.027)(0.027)
ROE0.0420.0470.0490.0480.0290.0290.0310.030
(0.071)(0.071)(0.071)(0.071)(0.087)(0.087)(0.087)(0.087)
Market leverage−0.025−0.017−0.020−0.0200.0600.0680.0640.067
(0.168)(0.168)(0.168)(0.168)(0.206)(0.206)(0.206)(0.206)
Altman Z-score0.001−0.000−0.0000.000−0.003−0.003−0.003−0.003
(0.004)(0.004)(0.004)(0.004)(0.005)(0.005)(0.005)(0.005)
Labor intensity0.0000.0000.0000.000−0.0000.0000.0000.000
(0.000)(0.000)(0.000)(0.000)(0.000)(0.000)(0.000)(0.000)
Advertising intensity−0.804−0.799−1.648−0.846−0.713−0.748−1.894−0.779
(1.081)(1.078)(1.173)(1.078)(1.325)(1.323)(1.439)(1.323)
R&D intensity−0.767−0.709−0.724−0.655−0.693−0.664−0.686−0.629
(0.694)(0.692)(0.692)(0.693)(0.850)(0.850)(0.849)(0.850)
Post Sarbanes-Oxley Act0.966***0.660***0.664***0.682***0.865***0.591**0.594**0.604**
(0.174)(0.183)(0.183)(0.183)(0.208)(0.223)(0.223)(0.223)
Sustainability committee = 1 0.229*0.224*0.231* 0.1250.1180.126
(0.090)(0.090)(0.090) (0.110)(0.110)(0.110)
Shareholder activism 0.273**0.272**0.273** 0.1900.1900.190
(0.104)(0.104)(0.104) (0.128)(0.128)(0.128)
Board size (executive directors) −0.055+−0.055+−0.053+ −0.074*−0.074*−0.073*
(0.028)(0.028)(0.028) (0.035)(0.035)(0.035)
Board size (non-independent directors) −0.068**−0.068**−0.066** −0.076**−0.077**−0.075**
(0.021)(0.021)(0.021) (0.025)(0.025)(0.026)
Board size (independent directors) −0.008−0.008−0.008 −0.026−0.026−0.026
(0.016)(0.016)(0.016) (0.019)(0.019)(0.019)
Director ensure diversity 0.0030.0040.004 0.0030.0030.003
(0.009)(0.009)(0.009) (0.011)(0.011)(0.011)
Director functional diversity 1.651***1.637***1.656*** 1.392**1.373**1.395**
(0.416)(0.416)(0.416) (0.510)(0.510)(0.510)
Director age diversity −0.020−0.015−0.022 −0.126−0.120−0.127
(0.154)(0.154)(0.154) (0.189)(0.189)(0.189)
% of directors with finance/accounting background −0.052−0.033−0.047 0.5060.5300.508
(0.353)(0.353)(0.353) (0.433)(0.433)(0.433)
CEO power 0.0290.0300.029 −0.018−0.017−0.018
(0.040)(0.040)(0.040) (0.049)(0.049)(0.049)
# of female executive directors 0.1240.0960.117 0.1680.1300.163
(0.122)(0.123)(0.122) (0.149)(0.151)(0.149)
# of female independent directors 0.088**0.070*0.038 0.131***0.106**0.098*
(0.032)(0.033)(0.040) (0.039)(0.041)(0.049)
# of female independent directors × advertising Intensity 1.026+ 1.385*
(0.558) (0.684)
# of female independent directors × consumer goods industry 0.115* 0.076
(0.057) (0.069)
Year fixed-effectYesYesYesYesYesYesYesYes
Firm fixed-effectYesYesYesYesYesYesYesYes
Constant−0.326+−0.059−0.048−0.085−0.855***−0.349−0.335−0.366
(0.182)(0.254)(0.254)(0.254)(0.224)(0.312)(0.312)(0.312)
Observations71517151715171517151715171517151
R-squared0.3950.4000.4010.4010.2350.2400.2410.241
Number of firms11021102110211021102110211021102
Standard errors in parentheses: *** p < 0.001, ** p < 0.01, * p < 0.05, + p < 0.1.
Table A2. Firm fixed-effect OLS models of antecedents of CSR strength by CSR issue domains.
Variable NamesCSR Strengths
EnvironmentCommunityEmployee relationsHuman rightsProductsDiversity
Model 17Model 18Model 19Model 20Model 21Model 22Model 23Model 24Model 25Model 26Model 27Model 28
Prior y # of CSR strengths0.667***0.667***0.565***0.565***0.487***0.488***0.592***0.592***0.531***0.530***0.460***0.459***
(0.017)(0.017)(0.014)(0.014)(0.013)(0.013)(0.014)(0.014)(0.015)(0.015)(0.013)(0.013)
Total asset (in $100,000)1.022***1.013***0.0520.050−0.070−0.0660.292***0.292***0.150*0.154*0.272+0.276+
(0.150)(0.150)(0.095)(0.095)(0.135)(0.135)(0.024)(0.024)(0.063)(0.063)(0.162)(0.162)
Revenues (in $100,000)0.0750.085−0.195*−0.202*0.281*0.263*−0.128***−0.128***−0.057−0.0670.1370.119
(0.128)(0.128)(0.081)(0.082)(0.115)(0.116)(0.021)(0.021)(0.054)(0.054)(0.138)(0.139)
Sales growth0.0200.0210.0080.009−0.011−0.0110.0010.0010.0040.004−0.015−0.014
(0.018)(0.018)(0.011)(0.011)(0.016)(0.016)(0.003)(0.003)(0.008)(0.008)(0.019)(0.019)
Tobin’s Q0.0040.0040.0030.0030.0010.0010.0000.0000.0030.0030.0160.016
(0.010)(0.010)(0.006)(0.006)(0.009)(0.009)(0.002)(0.002)(0.004)(0.004)(0.011)(0.011)
ROE0.0100.0090.0270.0260.0100.010−0.005−0.0050.0120.012−0.013−0.013
(0.032)(0.032)(0.020)(0.020)(0.029)(0.029)(0.005)(0.005)(0.013)(0.013)(0.034)(0.034)
Market leverage−0.038−0.0360.145**0.146**−0.162*−0.162*−0.010−0.0100.0400.040−0.033−0.034
(0.075)(0.075)(0.048)(0.048)(0.068)(0.068)(0.012)(0.012)(0.031)(0.031)(0.081)(0.081)
Altman Z-score0.0010.0010.0000.000−0.0000.0000.0000.000−0.000−0.000−0.001−0.001
(0.002)(0.002)(0.001)(0.001)(0.002)(0.002)(0.000)(0.000)(0.001)(0.001)(0.002)(0.002)
Labor intensity0.0000.0000.0000.000−0.000−0.0000.0000.0000.0000.000−0.0000.000
(0.000)(0.000)(0.000)(0.000)(0.000)(0.000)(0.000)(0.000)(0.000)(0.000)(0.000)(0.000)
Advertising intensity−0.492−0.200−0.458−0.174−1.087*−0.912*0.0520.080−0.135−0.1270.3310.512
(0.525)(0.482)(0.334)(0.307)(0.474)(0.436)(0.085)(0.078)(0.220)(0.202)(0.568)(0.522)
R&D intensity−0.001−0.0040.1110.129−0.612*−0.585*0.0130.0130.1190.131−0.359−0.330
(0.310)(0.310)(0.197)(0.198)(0.280)(0.280)(0.050)(0.050)(0.130)(0.130)(0.335)(0.336)
Post Sarbanes-Oxley Act0.298***0.295***0.0390.0440.206**0.214**−0.013−0.0130.0180.0220.252**0.261**
(0.081)(0.081)(0.052)(0.052)(0.073)(0.073)(0.013)(0.013)(0.034)(0.034)(0.088)(0.088)
Sustainability committee = 10.068+0.069+0.0290.0310.0280.0300.022***0.022***0.041*0.042*0.0390.041
(0.040)(0.040)(0.026)(0.026)(0.036)(0.036)(0.007)(0.007)(0.017)(0.017)(0.043)(0.043)
Shareholder activism0.0270.0270.0100.0100.072+0.072+0.0010.0010.0100.0100.155**0.155**
(0.047)(0.047)(0.030)(0.030)(0.042)(0.042)(0.008)(0.008)(0.020)(0.020)(0.050)(0.050)
Board size (executive directors)−0.017−0.017−0.013−0.013−0.005−0.004−0.001−0.0010.0030.003−0.026+−0.025+
(0.013)(0.013)(0.008)(0.008)(0.011)(0.011)(0.002)(0.002)(0.005)(0.005)(0.014)(0.014)
Board size (non-independent)−0.008−0.008−0.011+−0.011+−0.007−0.006−0.003*−0.003*−0.001−0.000−0.048***−0.047***
(0.009)(0.009)(0.006)(0.006)(0.008)(0.008)(0.002)(0.002)(0.004)(0.004)(0.010)(0.010)
Board size (independent)0.0050.0050.0020.0020.0010.001−0.000−0.0000.0010.001−0.013+−0.013+
(0.007)(0.007)(0.004)(0.004)(0.006)(0.006)(0.001)(0.001)(0.003)(0.003)(0.008)(0.008)
Director tenure diversity0.0010.0010.006*0.006*0.0030.0030.001*0.001*−0.001−0.001−0.007−0.006
(0.004)(0.004)(0.003)(0.003)(0.004)(0.004)(0.001)(0.001)(0.002)(0.002)(0.004)(0.004)
Director functional diversity0.647***0.651***0.240*0.247*0.316+0.322+0.0430.0440.0230.0240.421*0.427*
(0.186)(0.186)(0.119)(0.119)(0.168)(0.168)(0.030)(0.030)(0.078)(0.078)(0.201)(0.201)
Director age diversity0.0560.055−0.038−0.040−0.029−0.0310.0130.013−0.017−0.018−0.014−0.016
(0.069)(0.069)(0.044)(0.044)(0.062)(0.062)(0.011)(0.011)(0.029)(0.029)(0.075)(0.075)
% of directors with finance/accounting−0.078−0.085−0.112−0.1180.1560.1530.0420.0410.0950.096−0.136−0.139
(0.158)(0.158)(0.101)(0.101)(0.143)(0.143)(0.026)(0.026)(0.066)(0.066)(0.171)(0.171)
CEO power0.0280.0280.0120.0120.000−0.0000.0030.0020.0060.006−0.020−0.021
(0.018)(0.018)(0.011)(0.011)(0.016)(0.016)(0.003)(0.003)(0.007)(0.007)(0.019)(0.019)
# of female executive directors−0.0040.0060.0370.045−0.103*−0.100*0.0050.0060.0010.0000.183**0.187**
(0.055)(0.054)(0.035)(0.035)(0.050)(0.049)(0.009)(0.009)(0.023)(0.023)(0.060)(0.059)
# of female independent directors0.0010.0140.004−0.0020.025+0.0070.0020.0020.003−0.0080.049**0.030
(0.015)(0.018)(0.009)(0.011)(0.013)(0.016)(0.002)(0.003)(0.006)(0.008)(0.016)(0.019)
# of female independent director × advertising intensity0.344 0.357* 0.236 0.034 0.021 0.244
(0.249) (0.159) (0.225) (0.040) (0.105) (0.270)
# of female independent. director × consumer goods industry. −0.017 0.027+ 0.051* 0.000 0.026* 0.053+
(0.025) (0.016) (0.023) (0.004) (0.011) (0.027)
Constant−0.363**−0.363**−0.013−0.0230.0610.047−0.018−0.019−0.011−0.0170.353**0.338**
(0.114)(0.114)(0.072)(0.072)(0.103)(0.103)(0.018)(0.018)(0.048)(0.048)(0.123)(0.123)
Year fixed-effectYesYesYesYesYesYesYesYesYesYesYesYes
Observations715171517151715171517151715171517151715171517151
R-squared0.4310.4300.2620.2620.2440.2440.2670.2660.1910.1920.2730.274
Number of firms110211021102110211021102110211021102110211021102
Standard errors in parentheses: *** p < 0.001, ** p < 0.01, * p < 0.05.

References

  1. Carroll, A.B. Corporate social responsibility evolution of a definitional construct. Bus. Soc. 1999, 38, 268–295. [Google Scholar] [CrossRef]
  2. Harrison, J.S.; Freeman, R.E. Stakeholders, social responsibility, and performance: Empirical evidence and theoretical perspectives. Acad. Manag. J. 1999, 42, 479–485. [Google Scholar] [CrossRef]
  3. Hillman, A.J.; Keim, G.D. Shareholder value, stakeholder management, and social issues: What’s the bottom line? Strateg. Manag. J. 2001, 22, 125–139. [Google Scholar] [CrossRef]
  4. Mattingly, J.E. Corporate social performance: A review of empirical research examining the corporation–society relationship using Kinder, Lydenberg, Domini Social Ratings data. Bus. Soc. 2015. [Google Scholar] [CrossRef]
  5. Gond, J.P.; Kang, N.; Moon, J. The government of self-regulation: On the comparative dynamics of corporate social responsibility. Econ. Soc. 2011, 40, 640–671. [Google Scholar] [CrossRef]
  6. Orlitzky, M.; Louche, C.; Gond, J.P.; Chapple, W. Unpacking the drivers of corporate social performance: A multilevel, multistakeholder, and multimethod analysis. J. Bus. Eth. 2015, 126, 1–20. [Google Scholar] [CrossRef]
  7. Chiu, S.C.; Sharfman, M.P. Legitimacy, visibility, and the antecedents of corporate social performance: An investigation of the instrumental perspective. J. Manag. 2011, 37, 1558–1585. [Google Scholar] [CrossRef]
  8. Sharfman, M.P.; Shaft, T.M.; Tihanyi, L. A model of the global and institutional antecedents of high-level corporate environmental performance. Bus. Soc. 2004, 43, 6–36. [Google Scholar] [CrossRef]
  9. Buysse, K.; Verbeke, A. Proactive environmental strategies: A stakeholder management perspective. Strateg. Manag. J. 2003, 24, 453–470. [Google Scholar] [CrossRef]
  10. Kassinis, G.; Vafeas, N. Stakeholder pressures and environmental performance. Acad. Manag. J. 2006, 49, 145–159. [Google Scholar] [CrossRef]
  11. Bear, S.; Rahman, N.; Post, C. The impact of board diversity and gender composition on corporate social responsibility and firm reputation. J. Bus. Eth. 2010, 97, 207–221. [Google Scholar] [CrossRef]
  12. Ali, M.; Ng, Y.L.; Kulik, C.T. Board age and gender diversity: A test of competing linear and curvilinear predictions. J. Bus. Eth. 2014, 125, 497–512. [Google Scholar] [CrossRef] [Green Version]
  13. Boulouta, I. Hidden connections: The link between board gender diversity and corporate social performance. J. Bus. Eth. 2013, 113, 185–197. [Google Scholar] [CrossRef]
  14. Isidro, H.; Sobral, M. The effects of women on corporate boards on firm value, financial performance, and ethical and social compliance. J. Bus. Eth. 2015, 132, 1–19. [Google Scholar] [CrossRef]
  15. Azmat, F.; Rentschler, R. Gender and ethnic diversity on boards and corporate responsibility: The case of the arts sector. J. Bus. Eth. 2015, 126, 1–20. [Google Scholar] [CrossRef]
  16. Rao, K.; Tilt, C. Board composition and corporate social responsibility: The role of diversity, gender, strategy and decision-making. J. Bus. Eth. 2015. [Google Scholar] [CrossRef]
  17. Ben-Amar, W.; Chang, M.; Mcllkenny, P. Board gender diversity and corporate response to sustainability initiatives: Evidence from the carbon disclosure project. J. Bus. Eth. 2015. [Google Scholar] [CrossRef]
  18. Gardberg, N.A.; Fombrun, C.J. Corporate citizenship: Creating intangible assets across institutional environments. Acad. Manag. R. 2006, 31, 329–346. [Google Scholar] [CrossRef]
  19. Harrison, J.S.; Freeman, R.E. Stakeholders, social responsibility, and performance: Empirical evidence and theoretical perspectives. Acad. Manag. J. 1999, 42, 479–485. [Google Scholar] [CrossRef]
  20. Trumpp, C.; Endrikat, J.; Zopf, C.; Guenther, E. Definition, conceptualization, and measurement of corporate environmental performance: a critical examination of a multidimensional construct. J. Bus. Eth. 2015, 126, 185–204. [Google Scholar] [CrossRef]
  21. Waddock, S.A.; Graves, S.B. The corporate social performance-financial performance link. Strateg. Manag. J. 1997, 18, 303–319. [Google Scholar] [CrossRef]
  22. McWilliams, A.; Siegel, D. Corporate social responsibility and financial performance: Correlation or misspecification? Strateg. Manag. J. 2000, 21, 603–609. [Google Scholar] [CrossRef]
  23. Barnett, M.L.; Salomon, R.M. Does it pay to be really good? Addressing the shape of the relationship between social and financial performance. Strateg. Manag. J. 2012, 33, 1304–1320. [Google Scholar] [CrossRef]
  24. Berman, S.L.; Wicks, A.C.; Kotha, S.; Jones, T.M. Does stakeholder orientation matter? The relationship between stakeholder management models and firm financial performance. Acad. Manag. J. 1999, 42, 488–506. [Google Scholar] [CrossRef]
  25. Azoulay, P.; Ding, W.; Stuart, T. The impact of academic patenting on the rate, quality and direction of (public) research output. J. Indus. Econ. 2009, 57, 637–676. [Google Scholar] [CrossRef]
  26. Palazzo, G.; Scherer, A.G. Corporate social responsibility, democracy, and the politicization of the corporation. Acad. Manag. R. 2008, 33, 773–775. [Google Scholar] [CrossRef]
  27. McDonald’s. Our Journey Together for Food. McDonald’s Corporate social responsibility & sustainability reports. 2012–2013. Available online: http://www.aboutmcdonalds.com/content/dam/AboutMcDonalds/2.0/pdfs/2012_2013_csr_report.pdf (accessed on 15 December 2015).
  28. Flammer, C. Does product market competition foster corporate social responsibility? Evidence from trade liberalization. Strateg. Manag. J. 2014, 36, 1469–1485. [Google Scholar] [CrossRef]
  29. Lev, B.; Petrovits, C.; Radhakrishnan, S. Is doing good good for you? How corporate charitable contributions enhance revenue growth. Strateg. Manag. J. 2010, 31, 182–200. [Google Scholar] [CrossRef]
  30. Madsen, P.M.; Zachariah, J.R. Looking good by doing good: The antecedents and consequences of stakeholder attention to corporate disaster relief. Strateg. Manag. J. 2015, 36, 776–794. [Google Scholar] [CrossRef]
  31. Cheng, B.; Ioannou, I.; Serafeim, G. Corporate social responsibility and access to finance. Strateg. Manag. J. 2014, 35, 1–23. [Google Scholar] [CrossRef]
  32. Martínez-Ferrero, J.; Banerjee, S.; García-Sánchez, I.M. Corporate social responsibility as a strategic shield against costs of earnings management practices. J. Bus. Eth. 2016, 133, 305–324. [Google Scholar] [CrossRef]
  33. Strike, V.M.; Gao, J.J.; Bansal, P. Being good while being bad: Social responsibility and the international diversification of U.S. firms. J. Int. Bus. Stud. 2006, 37, 850–862. [Google Scholar] [CrossRef]
  34. Borghesi, R.; Houston, F.; Naranjo, A. Corporate socially responsible investments: CEO altruism, reputation, and shareholder interests. J. Corp. Fin. 2014, 26, 164–181. [Google Scholar] [CrossRef]
  35. Tang, Y.; Qian, C.; Chen, G.; Shen, R. How CEO hubris affects corporate social (ir)responsibility. Strateg. Manag. J. 2015, 36, 1338–1357. [Google Scholar] [CrossRef]
  36. Petrenko, O.V.; Aime, F.; Ridge, J.; Hill, A. Corporate social responsibility or CEO narcissism? CSR motivations and organizational performance. Strateg. Manag. J. 2016, 37, 262–279. [Google Scholar] [CrossRef]
  37. Chang, Y.K.; Oh, W.Y.; Park, Y.H.; Jang, M.G. Exploring the relationship between board characteristics and CSR: Empirical evidence from Korea. J. Bus. Eth. 2015. [Google Scholar] [CrossRef]
  38. Post, C.; Rahman, N.; McQuillen, C. From board composition to corporate environmental performance through sustainability-themed alliances. J. Bus. Eth. 2015, 130, 423–435. [Google Scholar] [CrossRef]
  39. Shaukat, A.; Qiu, Y.; Trojanowski, G. Board attributes, corporate social responsibility strategy, and corporate environmental and social performance. J. Bus. Eth. 2015. [Google Scholar] [CrossRef] [Green Version]
  40. Hafsi, T.; Turgut, G. Boardroom diversity and its effect on social performance: Conceptualization and empirical evidence. J. Bus. Eth. 2013, 112, 463–479. [Google Scholar] [CrossRef]
  41. Harjoto, M.; Laksmana, I.; Lee, R. Board diversity and corporate social responsibility. J. Bus. Eth. 2015, 132, 641–660. [Google Scholar] [CrossRef]
  42. Deloitte Consulting. Women in the boardroom; A global perspective. Available online: http://www2.deloitte.com/global/en/pages/risk/articles/women-in-the-boardroom-a-global-perspective.html (accessed on 15 December 2015).
  43. Huse, M.; Solberg, A. Gender-related boardroom dynamics: How Scandinavian women make and can make contributions on corporate boards. Wom. Manag. R. 2006, 21, 113–130. [Google Scholar]
  44. Eagly, A.H.; Carli, L.L. Finding gender advantage and disadvantage: Systematic research integration is the solution. Lead. Q. 2003, 14, 851–859. [Google Scholar] [CrossRef]
  45. Ibrahim, N.; Angelidis, J.; Tomic, I.M. Managers’ attitudes toward codes of ethics: Are there gender differences? J. Bus. Eth. 2009, 90, 343–353. [Google Scholar] [CrossRef]
  46. Zelechowski, D.; Bilimoria, D. The experience of women corporate inside directors on the boards of Fortune 1,000 firms. Wom. Manag. R. 2003, 18, 376–381. [Google Scholar] [CrossRef]
  47. Cumming, D.; Leung, T.; Rui, O. Gender diversity and securities fraud. Acad. Manag. J. 2015, 58, 1572–1593. [Google Scholar] [CrossRef]
  48. Banerjee, S.B.; Iyer, E.S.; Kashyap, R.K. Corporate environmentalism: Antecedents and influence of industry
type. J. Mark. 2003, 67, 106–122. [Google Scholar] [CrossRef]
  49. RiskMetrics Group. How to use KLD STATS & ESG ratings definitions. Available online: http://cdnete.lib.ncku.edu.tw/93cdnet/english/lib/Getting_Started_With_KLD_STATS.pdf (accessed on 18 March 2016).
  50. Mattingly, J.E.; Berman, S.L. Measurement of corporate social action. Bus. Soc. 2006, 45, 20–46. [Google Scholar] [CrossRef]
  51. Altman, E.I. Predicting financial distress of companies: revisiting the Z-score and ZETA models. In Handbook of Research Methods and Applications in Empirical Finance; Edward Elgar Publishing: Cheltenham, UK; Northampton, MA, USA, 2013. [Google Scholar]
  52. Dixon-Fowler, H.R.; Ellstrand, A.E.; Johnson, J.L. The role of board environmental committees in corporate environmental performance. J. Bus. Eth. 2015, 1–16. [Google Scholar] [CrossRef]
  53. Walls, J.L.; Berrone, P.; Phan, P.H. Corporate governance and environmental performance: Is there really a link? Strateg. Manag. J. 2012, 33, 885–913. [Google Scholar] [CrossRef]
  54. Chatterji, A.K.; Levine, D.I.; Toffel, M.W. How well do social ratings actually measure corporate social responsibility? J. Econ. Manag. Strateg. 2009, 18, 125–169. [Google Scholar] [CrossRef]
  55. Hernán, M.A.; Brumback, B.; Robins, J.M. Marginal structural models to estimate the joint causal effect of nonrandomized treatments. J. Amer. Statist. Ass. 2001, 96, 440–448. [Google Scholar]
Figure 1. Moderating effects of consumer market orientation. (a) Interaction effects of # of female director × advertising intensity on the CSR score. (b) Interaction effects of % of female directors × consumer goods on the CSR score.
Sustainability 08 00300 g001
Table 1. Descriptive statistics for variables of the sample firms. ROE, return on equity.
Variable NamesMeanS.D.MinMax
CSR score−0.142.58−915
Prior year CSR score−0.192.41−915
Total asset (in $100 billion)0.070.1902.76
Revenues (in $100 billion)0.070.2104.25
Sales growth0.120.4−0.8419.31
Tobin’s Q2.11.320.5215.51
ROE0.030.19−4.33.28
Market leverage0.180.1700.93
Altman Z-score5.236.08−55.4202.04
Labor intensity304.31420.860.1672,894.34
Advertising intensity0.010.0400.96
Consumer goods industry0.380.4901
R&D intensity0.030.0500.68
Post Sarbanes-Oxley Act0.890.3201
Sustainability committee = 10.140.3501
Shareholder activism0.010.1202
Board size (executive directors)1.550.8418
Board size (non-independent directors)1.221.11011
Board size (independent directors)6.62.23026
Director tenure diversity6.923.94023.1
Director functional diversity0.040.0600.75
Director age diversity0.580.120.291
% of directors with finance/accounting background0.050.0700.5
CEO power0.610.4901
# of female executive directors0.030.1802
# of female independent directors0.950.9206
Table 2. Correlation coefficients among variables (* p < 0.05).
No.Variable Names12345678910
1CSR score1.000
2Prior year CSR score0.858*1.000
3Total asset (in $100,000)0.072*0.0201.000
4Revenues (in $100,000)0.002−0.036*0.795*1.000
5Sales growth−0.035*−0.025*−0.027*−0.0181.000
6Tobin’s Q0.166*0.179*−0.074*−0.046*0.158*1.000
7ROE0.006−0.0060.034*0.035*0.060*0.054*1.000
8Market leverage−0.174*−0.199*0.118*0.027*−0.067*−0.489*−0.180*1.000
9Altman Z−score0.069*0.086*−0.114*−0.059*0.094*0.627*0.056*−0.464*1.000
10Labor intensity−0.076*−0.088*0.070*0.0160.190*−0.079*0.0100.130*−0.092*1.000
11Advertising intensity0.095*0.090*−0.0210.000−0.0030.122*0.001−0.094*0.083*−0.058*
12Consumer goods industry0.081*0.073*−0.066*−0.001−0.0000.055*−0.007−0.049*0.040*−0.133*
13R&D intensity0.201*0.210*−0.066*−0.079*0.053*0.314*−0.079*−0.294*0.205*−0.095*
14Post Sarbanes−Oxley Act−0.057*−0.089*−0.048*−0.033*0.042*−0.072*0.021−0.067*−0.0070.019
15Sustainability committee = 10.020−0.0190.281*0.215*−0.053*−0.105*0.0050.169*−0.132*0.028*
16Shareholder activism−0.012−0.022−0.021−0.017−0.014−0.040*−0.042*0.053*−0.027*−0.005
17Board size (executive directors)0.045*0.063*0.0090.029*0.0130.069*0.004−0.102*0.090*−0.034*
18Board size (non−independent directors)0.0140.0170.081*0.068*−0.029*−0.048*0.0030.152*−0.086*−0.013
19Board size (independent directors)0.113*0.057*0.373*0.283*−0.079*−0.158*0.029*0.246*−0.230*0.039*
20Director tenure diversity0.062*0.071*−0.024*−0.002−0.074*−0.058*0.015−0.063*0.016−0.053*
21Director functional diversity0.112*0.090*0.0030.008−0.042*0.019−0.017−0.031*−0.037*−0.047*
22Director age diversity−0.082*−0.090*0.029*0.0040.014−0.0070.007−0.024*0.0080.058*
23% of directors with finance/accounting background0.065*0.054*−0.014−0.011−0.025*0.0040.004−0.047*0.031*−0.056*
24CEO power−0.019−0.033*0.100*0.062*0.006−0.0000.0220.067*−0.0080.038*
25# of female executive directors0.097*0.096*−0.010−0.010−0.0010.052*−0.009−0.036*0.041*−0.013
26# of female independent directors0.266*0.216*0.300*0.254*−0.095*−0.085*0.0150.185*−0.168*−0.009
No.Variable Names11121314151617181920
12Consumer goods industry0.294*1.000
13R&D intensity−0.051*−0.095*1.000
14Post Sarbanes−Oxley Act0.0030.010−0.0161.000
15Sustainability committee = 1−0.009−0.047*−0.086*−0.076*1.000
16Shareholder activism−0.0110.018−0.0170.021−0.0061.000
17Board size (executive directors)0.082*0.120*−0.054*−0.150*−0.057*−0.0101.000
18Board size (non−independent directors)0.025*0.047*−0.070*−0.241*0.067*0.021−0.034*1.000
19Board size (independent directors)−0.008−0.039*−0.141*0.027*0.322*0.003−0.153*−0.140*1.000
20Director tenure diversity−0.0100.082*−0.066*−0.022−0.029*0.029*0.234*0.081*−0.0151.000
21Director functional diversity0.044*−0.024*0.072*0.140*0.017−0.002−0.092*−0.048*0.022−0.108*
22Director age diversity−0.042*−0.040*0.0070.056*−0.0100.016−0.069*−0.048*−0.094*0.037*
23% of directors with finance/accounting background0.024*−0.0230.052*0.132*0.038*−0.027*−0.080*−0.039*0.054*−0.059*
24CEO power−0.0210.011−0.086*−0.086*0.101*−0.026*−0.053*−0.126*0.120*−0.050*
25# of female executive directors0.056*0.073*−0.015−0.029*−0.050*0.0090.300*−0.007−0.049*0.097*
26# of female independent directors0.088*0.127*−0.131*−0.0090.259*−0.018−0.029*0.0230.567*0.004
No.Variable Names212223242526
22Director age diversity−0.060*1.000
23% of directors with finance/accounting background0.472*−0.054*1.000
24CEO power−0.071*0.074*−0.067*1.000
25# of female executive directors0.007−0.006−0.033*−0.034*1.000
26# of female independent directors0.073*−0.112*0.028*0.074*−0.027*1.000
Table 3. Firm fixed-effect OLS models of antecedents of the CSR score.
Variable NamesCSR Score
Number of Female DirectorsPercentage of Female Directors
Model 1Model 2Model 3Model 4Model 5Model 6Model 7Model 8
Prior year CSR score0.542***0.539***0.538***0.539***0.542***0.539***0.538***0.539***
(0.014)(0.014)(0.014)(0.014)(0.014)(0.014)(0.014)(0.014)
Total asset (in $100,000)1.637***1.617***1.645***1.638***1.637***1.626***1.629***1.635***
(0.431)(0.431)(0.431)(0.431)(0.431)(0.431)(0.431)(0.431)
Revenues (in $100,000)−1.085**−1.141**−1.158**−1.191**−1.085**−1.134**−1.139**−1.161**
(0.368)(0.368)(0.368)(0.369)(0.368)(0.368)(0.368)(0.369)
Sales growth0.0500.0570.0540.0580.0500.0570.0530.059
(0.052)(0.052)(0.052)(0.052)(0.052)(0.052)(0.052)(0.052)
Tobin’s Q0.0350.0340.0330.0350.0350.0340.0330.035
(0.028)(0.028)(0.028)(0.028)(0.028)(0.028)(0.028)(0.028)
ROE0.0830.0880.0910.0890.0830.0880.0940.089
(0.092)(0.092)(0.092)(0.092)(0.092)(0.092)(0.092)(0.092)
Market leverage0.1150.1240.1180.1210.1150.1290.1230.128
(0.217)(0.216)(0.216)(0.216)(0.217)(0.216)(0.216)(0.216)
Altman Z−score−0.001−0.002−0.002−0.002−0.001−0.002−0.002−0.002
(0.005)(0.005)(0.005)(0.005)(0.005)(0.005)(0.005)(0.005)
Labor intensity0.0000.0000.0000.0000.0000.0000.0000.000
(0.000)(0.000)(0.000)(0.000)(0.000)(0.000)(0.000)(0.000)
Advertising intensity−0.512−0.535−1.891−0.587−0.512−0.523−2.155−0.551
(1.394)(1.392)(1.514)(1.392)(1.394)(1.392)(1.551)(1.392)
R&D intensity−0.799−0.751−0.776−0.692−0.799−0.760−0.793−0.718
(0.894)(0.894)(0.894)(0.894)(0.894)(0.894)(0.894)(0.894)
Post Sarbanes−Oxley Act0.766***0.593*0.595*0.616**0.766***0.602**0.603**0.623**
(0.218)(0.234)(0.234)(0.234)(0.218)(0.234)(0.234)(0.234)
Sustainability committee = 1 0.248*0.239*0.250* 0.251*0.241*0.253*
(0.116)(0.116)(0.116) (0.116)(0.116)(0.116)
Shareholder activism 0.241+0.241+0.241+ 0.242+0.242+0.241+
(0.134)(0.134)(0.134) (0.134)(0.134)(0.134)
Board size (executive directors) −0.055−0.054−0.053 −0.044−0.045−0.041
(0.036)(0.036)(0.036) (0.036)(0.036)(0.036)
Board size (non−independent directors) −0.084**−0.085**−0.083** −0.074**−0.075**−0.073**
(0.027)(0.027)(0.027) (0.027)(0.027)(0.027)
Board size (independent directors) −0.016−0.016−0.017 −0.002−0.003−0.003
(0.020)(0.020)(0.020) (0.019)(0.019)(0.019)
Director tenure diversity 0.0100.0110.011 0.0100.0100.010
(0.012)(0.012)(0.012) (0.012)(0.012)(0.012)
Director functional diversity 1.482**1.460**1.488** 1.489**1.458**1.487**
(0.537)(0.537)(0.537) (0.537)(0.537)(0.537)
Director age diversity −0.098−0.090−0.100 −0.101−0.094−0.104
(0.199)(0.199)(0.199) (0.199)(0.199)(0.199)
% of directors with finance/accounting background 0.1550.1840.159 0.1430.1860.148
(0.456)(0.456)(0.456) (0.456)(0.456)(0.456)
CEO power 0.0110.0130.011 0.0100.0120.009
(0.051)(0.051)(0.051) (0.051)(0.051)(0.051)
# (%) of female executive directors 0.1460.1010.139 1.5951.3261.513
(0.157)(0.158)(0.157) (1.571)(1.574)(1.572)
# (%) of female independent directors 0.122**0.092*0.066 0.989*0.6760.473
(0.041)(0.043)(0.052) (0.390)(0.412)(0.502)
# (%) of female independent directors × advertising intensity 1.637* 20.077*
(0.720) (8.431)
# (%) of female independent directors × consumer goods industry 0.128+ 1.194
(0.073) (0.729)
Year fixed-effectsYesYesYesYesYesYesYesYes
Firm fixed-effectsYesYesYesYesYesYesYesYes
Constant−1.085***−0.738*−0.721*−0.767*−1.085***−0.842*−0.815*−0.867**
(0.235)(0.328)(0.328)(0.328)(0.235)(0.328)(0.328)(0.329)
Observations71517151715171517151715171517151
R−squared0.2300.2350.2350.2350.2300.2340.2350.235
Number of firms11021102110211021102110211021102
Standard errors in parentheses: *** p < 0.001, ** p < 0.01, * p < 0.05, + p < 0.1.

