Article

Using the Sustainability Monitoring and Assessment Routine (SMART) for the Systematic Analysis of Trade-Offs and Synergies between Sustainability Dimensions and Themes at Farm Level

1
Research Institute of Organic Agriculture (FiBL), CH-5070 Frick, Switzerland
2
Institute for Environmental Decisions (IED), Swiss Federal Institute of Technology Zurich (ETHZ), 8092 Zurich, Switzerland
3
Research Institute of Organic Agriculture (FiBL), A-1010 Wien, Austria
4
Institute for Nature Conservation and Landscape Management, Szent István University, Hungary
5
The Organic Research Centre, Elm Farm (ORC), Newbury, Berkshire RG20 0HR, UK
*
Author to whom correspondence should be addressed.
Sustainability 2016, 8(3), 274; https://doi.org/10.3390/su8030274
Submission received: 31 December 2015 / Revised: 9 March 2016 / Accepted: 10 March 2016 / Published: 16 March 2016
(This article belongs to the Special Issue 5th World Sustainability Forum - Selected Papers)

Abstract

:
When trying to optimize the sustainability performance of farms and farming systems, a consideration of trade-offs and synergies between different themes and dimensions is required. The aim of this paper is to perform a systematic analysis of trade-offs and synergies across all dimensions and themes. To achieve this aim we used the Sustainability Monitoring and Assessment Routine (SMART)-Farm Tool which operationalizes the Sustainability Assessment of Food and Agriculture Systems (SAFA) Guidelines by defining science-based indicator sets and assessment procedures. It identifies the degree of goal achievement with respect to the 58 themes defined in the SAFA Guidelines using an impact matrix that defines 327 indicators and 1769 relations between sustainability themes and indicators. We illustrate how the SMART-Farm Tool can be successfully applied to assess the sustainability performance of farms of different types and in different geographic regions. Our analysis revealed important synergies between themes within a sustainability dimension and across dimensions. We found major trade-offs within the environmental dimension and between the environmental and economic dimension. The trade-offs within the environmental dimension were even larger than the trade-offs with other dimensions. The study also underlines the importance of the governance dimension with regard to achieving a good level of performance in the other dimensions.

1. Introduction

Globally, food systems have great deficiencies with respect to sustainability [1,2]. This applies to environmental aspects such as greenhouse gas emissions, soil erosion, biodiversity loss, energy use, nitrogen and phosphorus cycles and other aspects [3,4]. Animal welfare is a further issue that has not been sufficiently considered from an ethical perspective [5]. Social issues, such as poor labor conditions, receive ever greater attention as farming often involves unethical practices that harm humans and society [6]. From an economic standpoint, food systems need to be viable and resilient in order to allow operators in the food chain to make a living from their work. However, this is often not achieved, especially for smallholders and family farmers [7].
As in many other contexts, the notion of sustainability has become a normative guiding principle for the assessment of food systems. In order to promote a sound and consistent assessment approach, the Food and Agriculture Organization of the United Nations (FAO) published the SAFA Guidelines, a universal framework for Sustainability Assessment of Food and Agriculture Systems (SAFA). The SAFA Guidelines provide a hierarchal structure of dimensions, themes and subthemes. For each sub-theme, an absolute objective describes the target state of sustainability [8]. In addition to the economic, social and environmental dimensions, the SAFA Guidelines include governance as a fourth and horizontal dimension that relates to the other three. Governance assesses the ability of an operator (e.g., a farm, a processor, a retailer) to deliver adequate sustainability performance [8].
The farm level is one of the main levers for designing sustainable food systems, as many decisions related to farming practices with the most severe social and environmental impacts are made at farm level [9]. Furthermore, the economic resilience of many farming systems is weak, particularly for smallholders and family farms. At the same time, farming constitutes the backbone of the rural economy and is seen as a main driver for sustainable rural development [10].
In order to enable farmers to make sound decisions, all dimensions of sustainability need to be considered [11]. While there are many different sustainability assessment tools, most of these concentrate either on only one dimension (often the environmental one) or specific themes within a dimension, for instance greenhouse gas emissions or biodiversity within the environmental dimension [12,13,14]. Furthermore, the tools are not harmonized nor do they follow the same framework, which means that results from the assessment of different tools are difficult to compare [15]. This does not allow operators in food chains to make sound decisions about sustainable sourcing, e.g., by providing incentives or establishing targeted advisory services based on specific needs [16]. Also policy makers are not clear about how to design policy measures to be able to differentiate the payment levels, e.g., for Rural Development Plans and Agri-Environmental Schemes, between individual farms for providing public goods in an economically efficient way (i.e., tailored and targeted to address specific areas of sustainability) [17,18]. In addition, trade-offs and synergies have only been looked at within a limited number of case studies (e.g., [19,20,21,22]) or between a limited number of sustainability themes (e.g., [23,24]). So far, there has been no systematic assessment of general trade-offs and synergies across all sustainability dimensions and themes and sub-themes, independent of the geographical context and farm type.
This paper aims to fill this gap by: (a) describing the SMART-Farm Tool, a new method for assessing sustainability at farm level comprehensively in a globally comparable way; (b) presenting results for typical farms to explain how they perform with respect to the objectives formulated in the SAFA Guidelines and to what extent it is possible to distinguish between the farms in terms of degree of goal achievement; and (c) conducting a systematic assessment of trade-offs and synergies between dimensions, themes and sub-themes. The SMART-Farm Tool is complementary to other well-established tools and methods for measuring resource efficiency quantitatively, e.g., via Life Cycle Assessments, or for providing advice for farmers in a didactic way.

2. Materials and Methods

In this section, we explain how the SMART-Farm Tool functions (Section 2.1), explain the application of the SMART-Farm Tool on sample farms (Section 2.2), and set out how the trade-offs and synergies between the sub-themes were calculated (Section 2.3).

2.1. SMART-Farm Tool

The aim of the SMART-Farm Tool is to provide a globally applicable tool, which is comprehensive in terms of what is measured and efficient in data requirements. The SMART-Farm Tool models the performance of a farm with respect to the 58 SAFA sub-themes (Figure 1). For each of these the SAFA Guidelines define an absolute globally applicable objective for operators in food and agriculture supply chains [8]. For instance, for the sub-theme Water Quality the objective is “The release of water pollutants is prevented and water quality is restored”. For application in SMART, some of the objectives had to be further delineated to fit into the farming context for an assessment to be completed at farm-level (Supplementary Material A Table S1). For each objective, there is a number of indicators that in combination allow for an assessment of the level of goal achievement, which is expressed on a scale from 0 to 100%. 0% represents a state where all applicable farm activities are counteracting the goal achievement, while 100% represent a state where the respective sustainability goal have been fully achieved by implementing all relevant beneficial activities on a farm and avoiding all relevant detrimental activities to the greatest extent possible. In total, the SMART-Farm Tool (Version 2.1) is based on 327 indicators for the 58 sub-themes. The following sub-sections describe how these indicators have been derived and how they are used for farm assessments.
SMART explicitly does not draw the system boundaries along the physical boundaries of a farm but considers all sustainability impacts, which the farm and its activities have along the upstream value chain. Thus, impacts from purchased inputs (seeds, feedstuffs, fertilizers, pesticides, etc.) are also considered. This is important to maintain comparability across farms, as farms induce off-farm impacts via these imports to different degrees.
The SMART-Farm Tool can be applied both in a research and a business context. Therefore, end-users of the tool vary. The main focus of the tool is to produce comparable and reproducible results on the environmental, social and economic sustainability performance of a number of farms. The SMART-Farm Tool is usually used by auditors who have passed a formalized training procedure of 5–10 days, depending on the background of the trainee. More information on this training is given in Section 2.2.1.
All assessors using the tool are called “auditors”. These auditors have a different role from an advisor. Auditors are usually checking the farm’s performance, sometimes as a service for the farmer and sometimes as a service for a third party (e.g., in research context or in a business-related application). So, the role of the auditor is explicitly not to advise the farmer in the sense of discussing measures for improvements, e.g., like in the context of a sustainability assessment with RISE (Response-Inducing Sustainability Evaluation). Nevertheless, the SMART report contains valuable information for the farmer on why he/she/they are not performing well, with respect to each of the 58 SAFA sub-themes. This information can be translated into a possible action for improving the sustainability performance of the farm. In our experience it depends on the context whether the farmer needs help in identifying appropriate measures or is able to do this independently. Therefore, it is important to clarify that the SMART-Farm Tool is not a tool which is appropriate for all different end-users for sustainability assessments. We think in the extension context tools like RISE are more appropriate.

2.1.1. Determining the Sustainability Performance

The degree of goal achievement (DGAix) of a farm x with respect to a sub-theme i is defined as the relation between the sum of impacts of all indicators (n = 1 to N) that are relevant for a sub-theme i (IMni) multiplied by the actual performance of a farm x with respect to an indicator n (ISnx) (Equation (1)) and the sum of the impacts multiplied by the maximal performance possible on these indicators (ISmaxn). The impacts thus serve as “weights” for the different indicators in assessing the degree of goal achievement for a sub-theme (see Section 2.1.3 for details).
DGAix = ∑n=1N(IMni × ISnx)/∑n=1N(IMni × ISmaxn) ∀ i and x
where x is the index of farms, i is the index of sub-themes, n is the index for the indicators that are relevant for farms of the farm type of interest and in the geographical context addressed. Thus, the SMART-Farm Tool can be conceptualized as a Multi-Criteria Analysis (MCA) [25] for each sub-theme of the SAFA Guidelines.
The indicators that are relevant for a farm are determined according to Equation (2). All indicators which have an impact IMni ≠ 0 for a sub-theme i and are declared to be relevant for at least one of the farm business branches (arable farming, vegetable production, fruit production, viticulture, permanent grassland, beef cattle, pig production, poultry production, bees, dairy cattle, goats, sheep, tree nursery perennials, pot plants/plant nursery, aquaculture, direct sales). The combination of different farm business branches constitutes the farm type. While the farm type “specialized arable farm” will only have arable farming as a farm type, most farm types will consist of several farm business branches (e.g., combining dairy and arable farming).
This procedure for indicator selection was based on the fuzzy logic approach [26]. As soon as a farm business branch is present at a farm, an indicator will be taken into the subset RI of relevant indicators for the different sub-themes (Equation (2)). The set RI of indicators that are relevant for a farm are determined according to Equation (2): these are all indicators which have an impact IMni ≠ 0 for a sub-theme i and are declared to be relevant for at least one of the farm business branches τ and geographic regions. Where τ = 1,…, T the T different combinations of farm business branches and geographic regions. Ntot denotes the total number of indicators in the SMART-Farm Tool.
RI = { n∈ {1,…,Ntot} ∃ i ∈ {1,…, I} so that IMni ≠ 0 Λ τ ∈ {1,…, T} so that n is relevant for τ

2.1.2. Indicator Selection

The requirement for the SMART-Farm Tool to be globally applicable, requires us to use as many generic indicators as possible and as few case specific indicators as necessary to determine the sustainability performance in a credible way. Indicators for the SMART-Farm Tool have been selected according to the following criteria:
  • Relevance: The indicator needs to have a logical or scientifically justifiable direct impact on at least one of the sub-themes, they may, however, be relevant for several sub-themes. This should not to be confused with the geographic/farm-type relevance-check of indicators in the course of the farm assessment mentioned above.
  • Comprehensiveness: The indicator set should cover the most relevant aspects of the themes and is applicable to all farm types, regions and farming systems (conventional, integrated, organic, etc.).
  • Interpretability: The indicators need to be interpretable and consequences for farm management need to be directly deducible for farmers, scientists and advisors.
  • Data quality: The information gathered on the farm needs to enable the auditor to assess the indicator reliably.
  • Efficiency: The time required for data collection needs to be minimized, therefore, SMART comprises indicators that are straightforward to determine for which data is globally accessible.
The above criteria were applied by a team of experts which consisted of some of the authors in addition to 18 external, theme-specific experts who were consulted in case the impact of an indicator was unclear. Among those were scientists, advisors, farmers and auditors working on farm audits. We used a large number of experts in order to minimize potential biases in the evaluation, being aware of the subjectivity of some aspects of sustainability. In the case of differences of opinion among the experts, a core team of seven scientists made the final decision with respect to indicator selection, formulation and determination of benchmarks.
The maximum performance for each indicator was defined as being the state of an indicator which allows maximum achievement of the sustainability goals that are addressed by this indicator. Vice versa, the minimum performance of an indicator was defined as being the state which will lead to the least degree of improvement of the performance on a sub-theme. The basis for determining these benchmarks was scientific literature where possible. For the remaining indicators expert judgements were made.
The relevance check which works according to Equation (2), determines the maximum performance for a sub-theme. The relevance check ensures that only indicators that are applicable in the context of a specific farm are taken into account for an evaluation. For instance, if a farm does not have a greenhouse, no indicators referring to the management of greenhouses are considered. This ensures that each farm can theoretically achieve a goal of 100%.
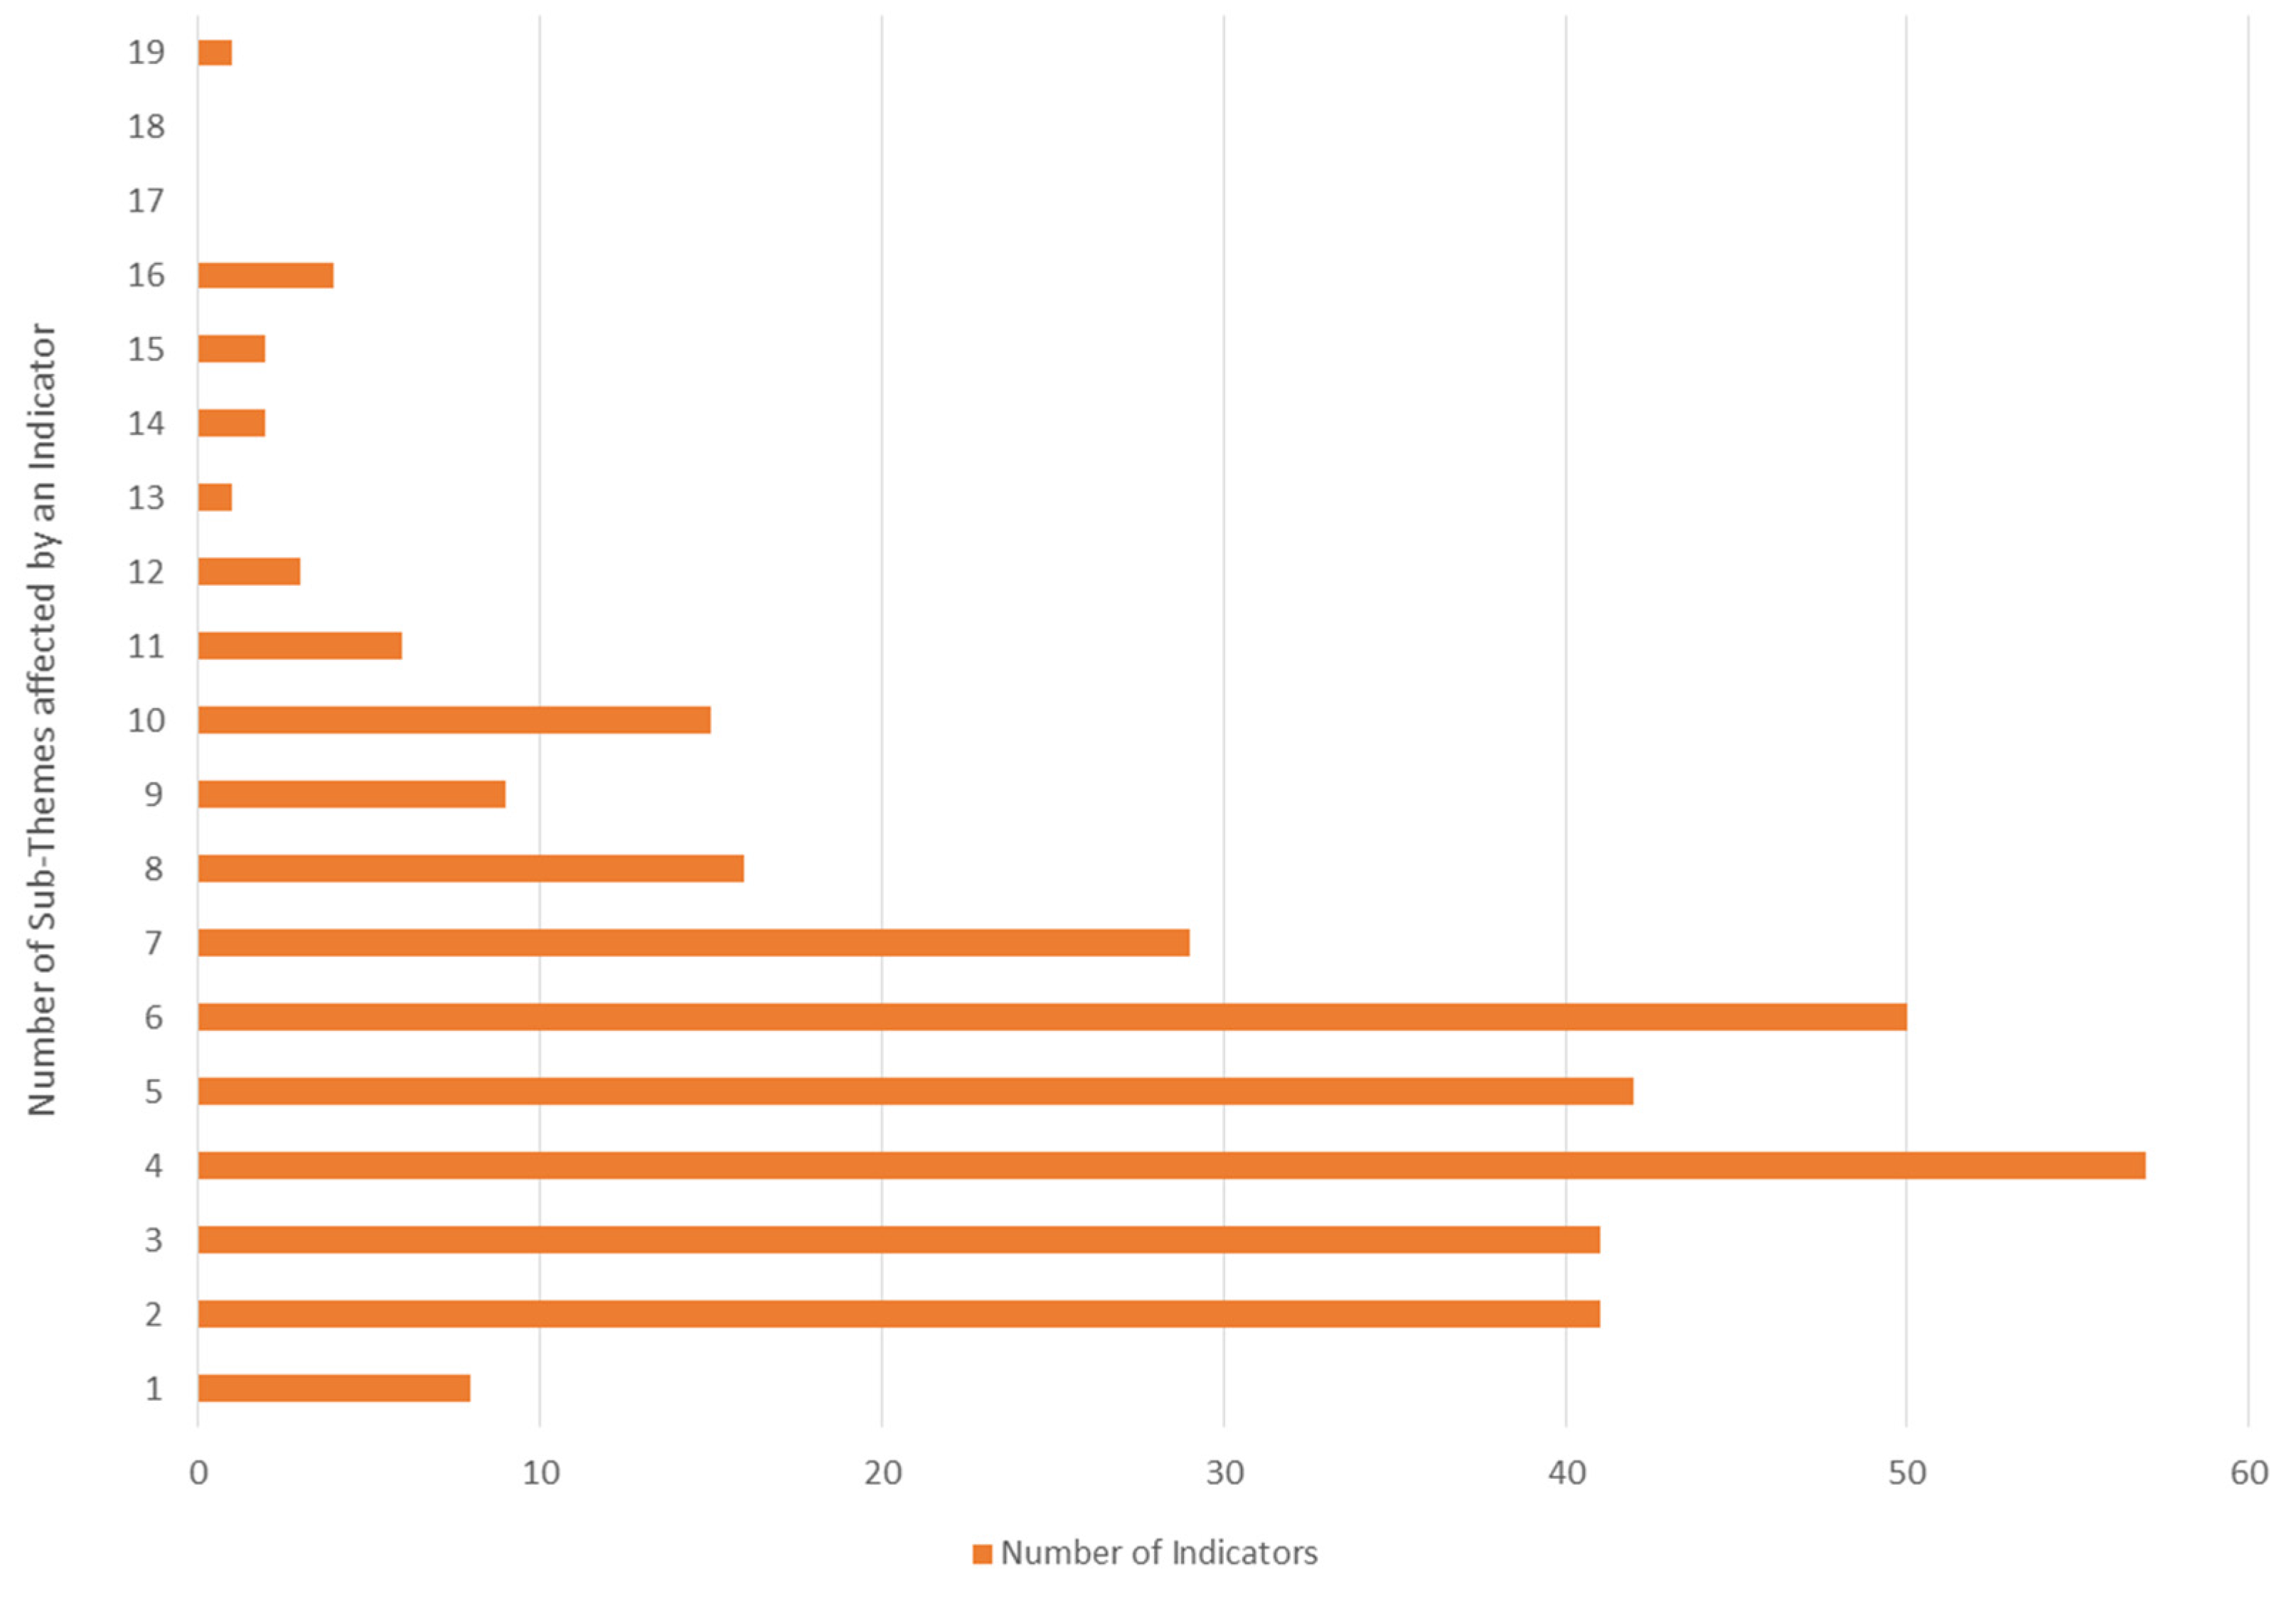
The selection and continuous refinement of the indicators lasted three years with different experts being involved at different stages of the process. Over the three years, different formulations of indicators and different minimum and maximum values and benchmarks were tested before the current versions were identified. Also many partly overlapping indicators were discarded over time. This procedure led to the selection of 327 indicators which are linked to 1 to 19 sub-themes of the SAFA Guidelines. On average 5.4 sub-themes are linked to one indicator. There are only eight indicators which are linked to just one sub-theme and 19 indicators which are linked to more than 10 sub-themes (Figure 2).
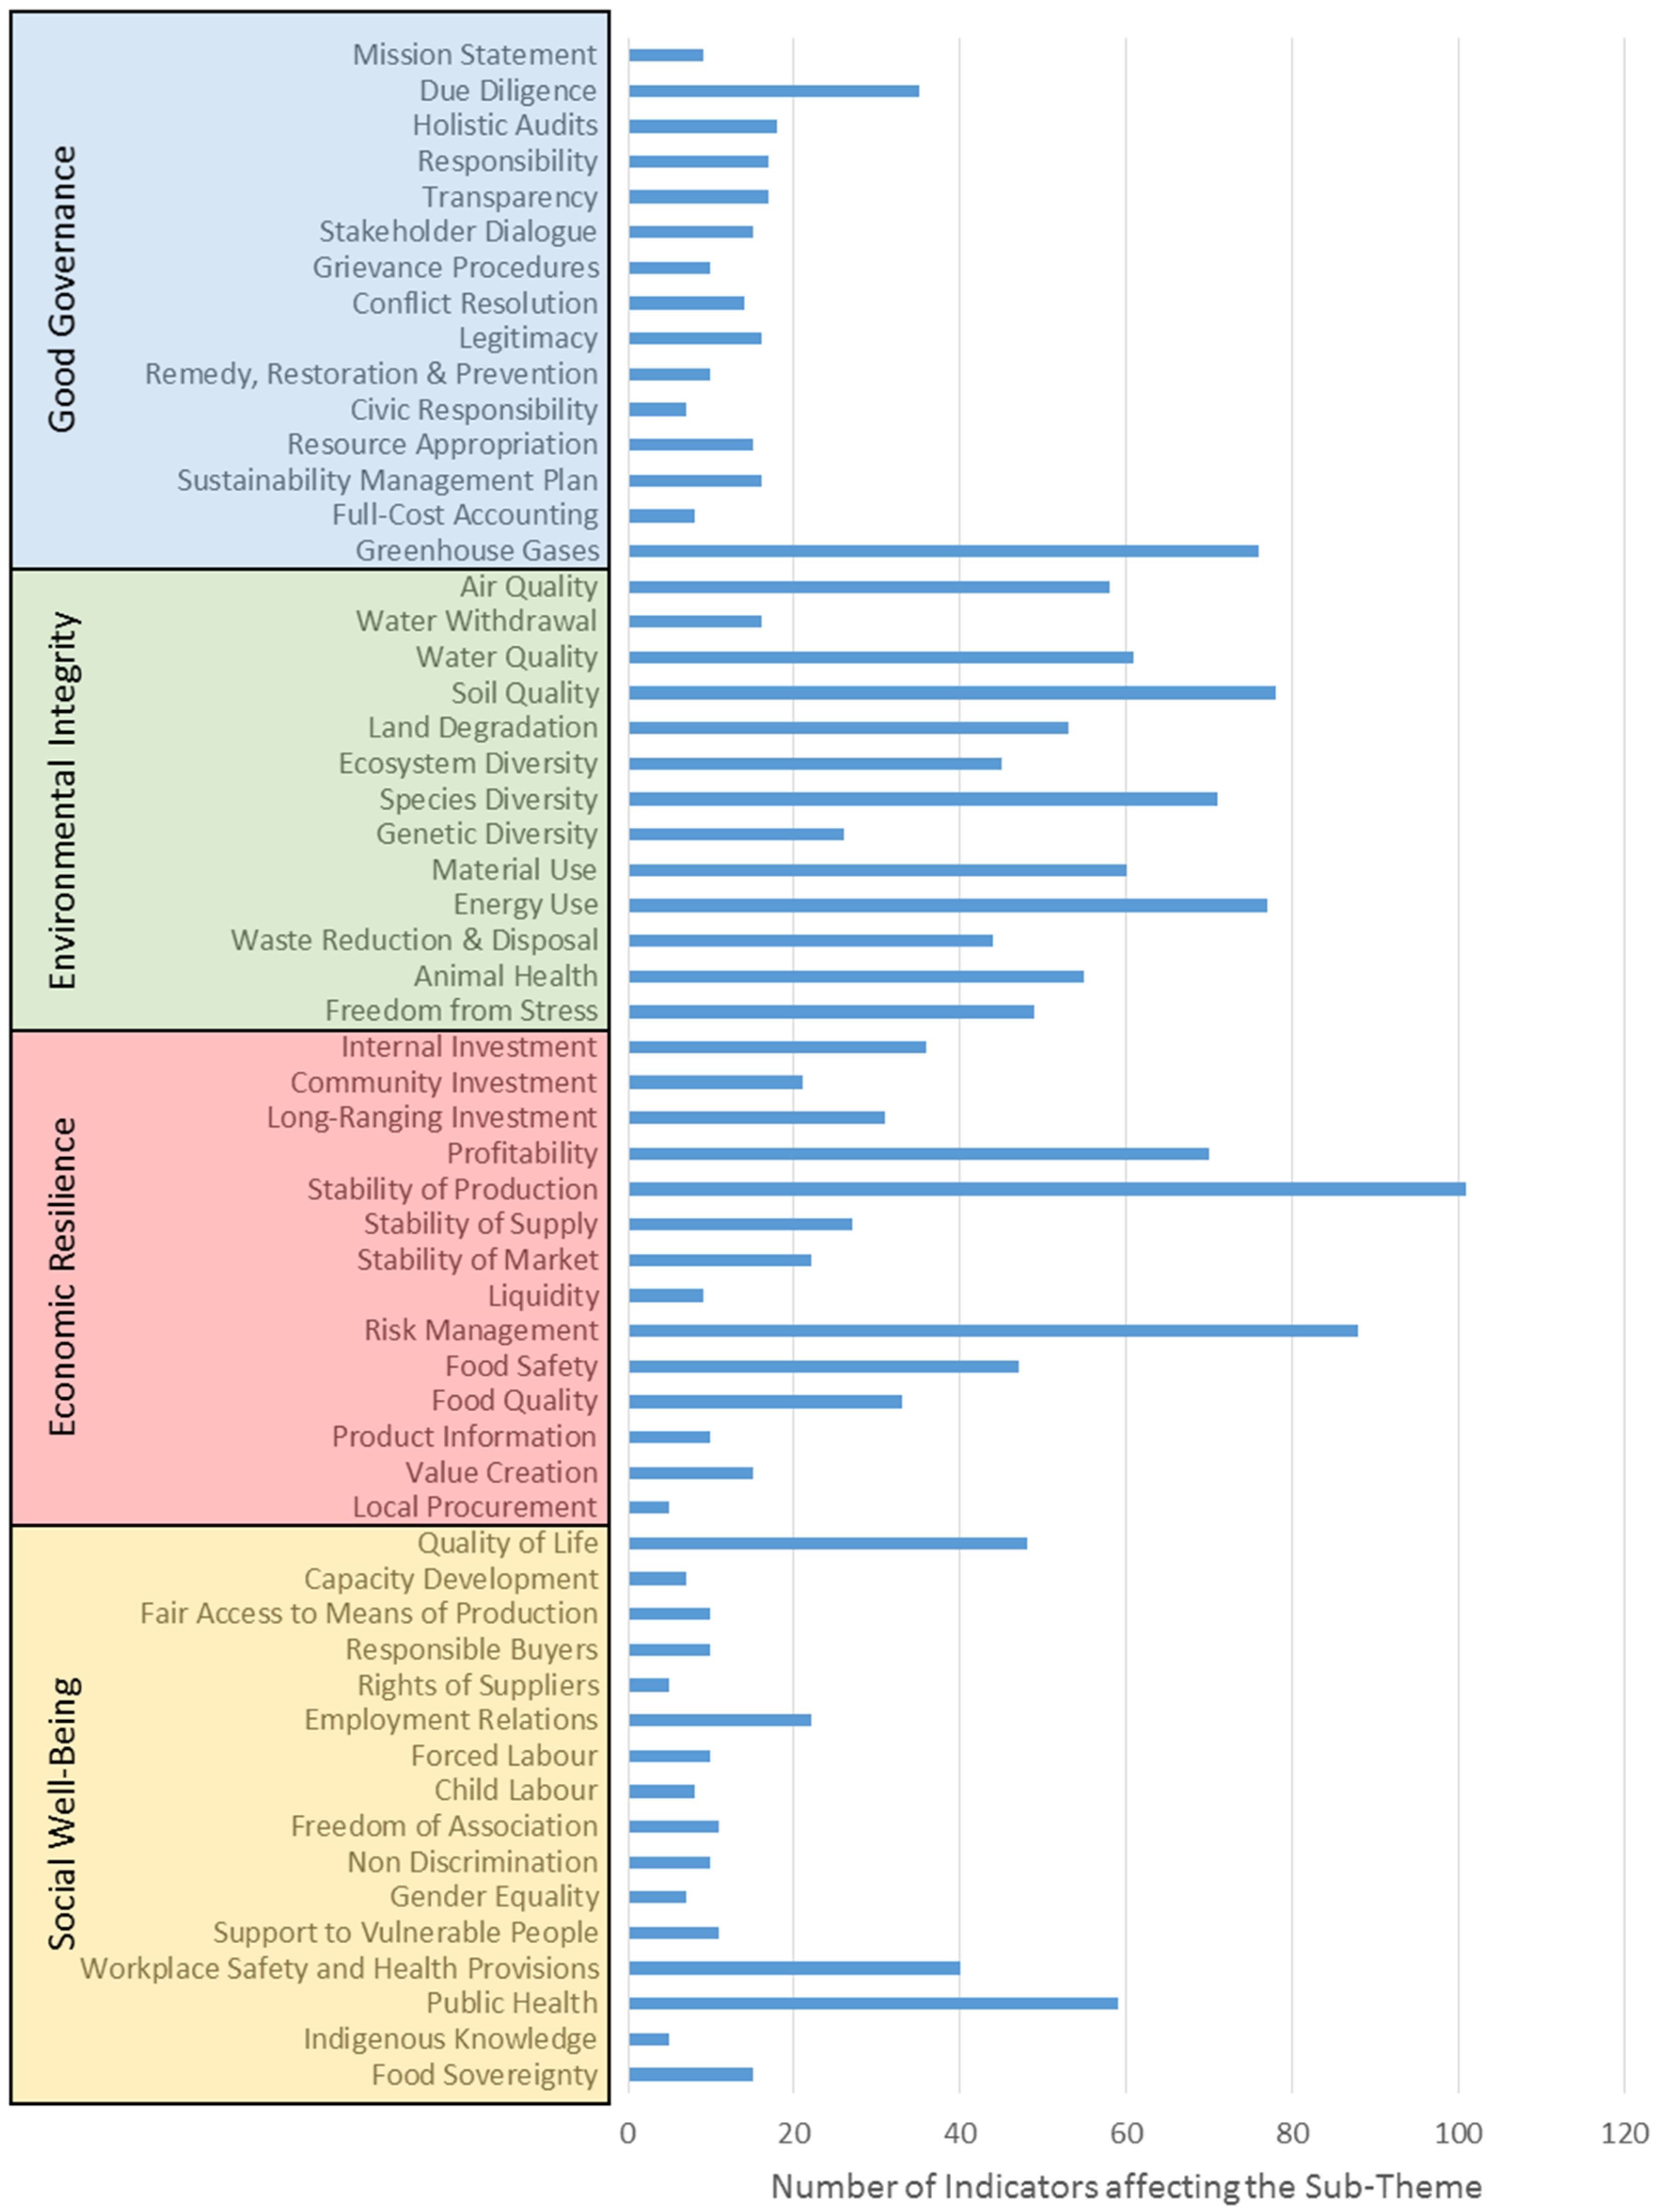
In total 1769 linkages between SMART indicators and SAFA sub-themes were determined. This means, there is an average number of 30.5 indicators per sub-theme (Figure 3). In the Supplementary Material A Tables S2–S59, all indicators and their applicability for each sub-theme are listed. The high variability of the number of indicators for each sub-theme resulted from applying the above-mentioned criteria. For some sub-themes, there is a large number of indicators relevant for influencing the degree of goal achievement (e.g., Species Diversity) while at the same time fulfilling the other criteria, for other sub-themes the degree of goal achievement can be verified using only a few indicators (e.g., Mission Statement).

2.1.3. Determination of Indicator Weights

The indicators that were selected for each sub-theme by the experts according to the criteria described in Section 2.1.2, were rated with respect to the contribution they have for the degree of goal achievement, i.e., the impact (IMni) an indicator i has on sub-theme n. The experts who selected the indicators also judged the strengths of the impacts independently from each other. If different opinions existed, the experts discussed and agreed upon a weight in a Delphi-Process. IMni is determined on a scale between −3 and +3 according to Table 1. An indicator is considered to be irrelevant for a sub-theme either if it does not have a direct impact on the degree of goal achievement of a subtheme or if it has ambiguous impacts. In such a case IMni = 0 and the indicator is dropped from the list of relevant indicators for that sub-theme. Ambiguity means that the experts understood the indicator to have a positive impact in some cases and a negative impact in others. For instance, dehorning of cows was considered to be ambiguous with respect to the sub-theme “Freedom from Stress” as it does have negative impacts on this sub-theme at the time of dehorning but may have positive impacts afterwards. Furthermore, depending on the stocking density or the construction type of the barn, these impacts may be different. Currently, there are no further decision rules implemented in the SMART-Farm Tool, and such ambiguous indicators were thus not considered for a sub-theme as they would not be decisive in one or the other way for all farms. Indicators, which have been rated as ≠ 0, are listed in the Supplementary Materials (Tables S2–S59).
There are different types of scales defined for ISnx as described in Table 2, with 0% being the lowest performance and 100% being the highest performance.

2.2. Application of the SMART-Farm Tool on Sample Farms

2.2.1. Procedure for Assessing Farms with the SMART-Farm Tool

An assessment using the SMART-Farm Tool (Version 2.1) is conducted in the following steps: First, goal and scope of the assessment are clearly defined. Second, the farm sample is selected in a way that the research questions can be answered with minimum bias. Third, data are collected during a visit to each farm including an interview with the farm manager conducted by a trained and qualified auditor. The training curriculum involves theoretical and practical training. The theoretical training includes lessons on how to get the information with respect to a specific indicator. The auditors are trained to ask and verify the answers in a standardised manner. If answers are not plausible, auditors need to clarify. Training is carried out face-to-face only. In practical lessons real farms are visited and in a final test the trainee needs to prove that they are able to use the tool correctly. Online training cannot substitute this procedure. Additionally to the training procedure, the evaluations of auditors are frequently checked for plausibility by another experienced auditor.
These farm visits serve to collect the data that is necessary to evaluate the relevant indicators required for the sustainability assessment. A visit usually takes between 2 and 3 h and consists of a general introduction, a farm tour and the main interview. The number of indicators used for the assessment of a single farm depends on the relevance check, which is an automatic selection of a subset of indicators from the total pool of 327 indicators. The resultant subset contains only indicators that are relevant to the specific farm type and regional context. The compliance check auto-rates indicators, which are compliant, e.g., because of certain types of standards or regional context. While irrelevant indicators are not considered for calculating the sustainability performance, both compliant and non-compliant indicators are considered. For instance, certified organic farms are inspected to check that they do not use any synthetic pesticides [27]. The respective indicators are therefore automatically rated, if a farm is certified-organic, unless the SMART auditor comes across evidence that this assumption does not hold true. The collected data are then used for evaluating each indicator. The algorithms in the SMART-Farm Tool describe the impact of each indicator on the performance of the farm with respect to a sub-theme. The indicators are then used for listing the driving factors influencing the sustainability performance on this farm. The performances with respect to the 58 sub-themes and the driving factors are given as feedback to the farmers and can be used for the comparison of different farms within and across farm types and regions. The 58 sub-themes can be aggregated to 21 themes, applying an equal weighting of all sub-themes but additionally all sub-theme scores have to be made transparent.

2.2.2. Selection of Farms

Section 2.1 described how the SMART indicators have been identified and how they are used for single farm assessments. Here, we explain how SMART assessments are applied to farms for understanding the general degree of achievement of sustainability goals. Methodologically, we seek to understand: (a) whether the SMART-Farm Tool is applicable to farms of different types in different regions; (b) whether the SMART-Farm Tool produces plausible results; and (c) whether it allows us to distinguish between different farms in terms of sustainability performance. For the purpose of this paper, we selected very different farms in terms of farm size and farm business branches, to see whether the characteristics will be reflected well enough in the sustainability performances measures by the SMART-Farm Tool. We did not aim to understand differences between farms in developing and developed countries, organic and conventional farms, large or small farms or between different farm types. For such research questions, a much larger and representative sample would have to be drawn. We thus selected a broad sample of farms with typical farm types from developing and developed countries. We used a qualitative purposeful sampling procedure [28] by selecting the different typical farms in different countries [29]. In total, 11 farms from three developing countries (Ghana, Kenya and Costa Rica) and three developed countries (Germany, Switzerland and Austria) were used. The following farm types were considered: mixed farms, fruit and vegetable farms, dairy farms, arable farms, beef and pig and poultry farms. The farm size in the sample varied from 0.7 to 275 hectares, including both conventional and organic farms (Table 3).
Farm Switzerland_1 is a family farm with seven employees, producing a diverse range of vegetables (different varieties of tomatoes, salad, spinach, etc.) cultivated both in greenhouses and on open fields, which are sold through a local cooperative operating in the region.
Farm Switzerland_2 is a medium-sized family farm, producing a variety of dairy products (milk, yoghurt and cheese) sold both through wholesalers as well as directly from the farm shop. Partially independent in terms of livestock feed supplies, as both a part of the concentrate feed (75%) and the roughage (70%) are produced on the farm.
Farm Austria_1 is a medium-sized family farm, located in the eastern part of Austria, focusing on arable farming, mostly cereals for feed, grassland (incl. some meadow orchards) and forestry. All farm work is done by family members. A major part of the feed supply for the cattle is produced on-farm, the rest is purchased locally. The farm cooperates with other farms nearby (e.g., to access machines).
Farm Austria 2 is a large family farm, located in the eastern part of Austria, specializing in the production of soybean and maize. It has no permanent employees. Laying hens are kept only for own consumption. The whole amount of the farm area has increased in the last few years. Products are sold to other farms, wholesalers and processing companies.
Farm Germany_1 is an organic family run dairy farm (with one employee) located in South Germany. The entire agricultural area is dedicated to grassland that is used as feed for the 20 dairy cows and their offspring. The entire amount of milk produced is sold to a local dairy and generates the main income of the farm.
Farm Germany_2 is a mixed farm run by five members of staff located in South Germany. The 135 dairy cows and offspring are fed with grass (70 ha permanent grass land, 19 ha temporary grassland), clover, maize silage and bought in concentrate feed. The entire amount of milk produced is sold to a local dairy and is the main source of income. Cash crops grown are winter wheat, winter/summer barely and winter rape seed.
Farm Kenya_1 is a typical smallholder farm in the lowlands of the Machakos district growing different fruits and vegetables under semi-arid climate conditions. The farmer is a young motivated entrepreneur who is keen on further developing the farm in terms of economic performance. Pesticide and nutrient management are implemented according to the advice of a private advisory service. Products are predominantly sold at the local market.
Farm Kenya_2 is a smallholder farm in Kiriniaga in the humid zones of Kenya at about 2000 m above sea level. The dominant source of income is from vegetable and fruit production which is sold on the local market. The farm is managed organically but is not certified due to the lack of market for their products. The farm is part of an organic advisory scheme which supports farmers in fertilizer and pest management.
Farm Ghana_1 is located in northern Ghana and operates under a semi-arid climate. The farm is located in a remote area and has adopted organic management. However, the farm sells only at the local market and due to the absence of a local market for organic products, certification is not viable for this farmer. For weeding and harvesting local labor is hired by day, depending on seasonal fluctuations.
Farm Ghana_2 is a typical cocoa farm located in the Western Region of Ghana, operating under humid conditions. Most of the income is generated through cocoa which is sold to and processed by a local cooperative. The farmer invests in a number of inputs (pesticides, fertilisers), while cocoa pest management is organized at national level by COCOBOD. The farmer is strongly committed as an elder in his village. External labor is only rarely employed, mainly for harvesting purposes.
Farm Costa Rica_1 is a family run banana plantation with 109 employees, exporting approximately 350,000 boxes of bananas per year (type: Cavendish, 162 ha; Gros Michel 30 ha (under conversion to organic); Dátil, 10 ha (under conversion to organic)) to a retailer in Europe. Organic certified bananas will be sold after the conversion has been completed. The farm includes 41 ha of forest that was planted for the on-farm production of pallets used to transport the banana boxes. The farm is certified against the following standards: Rainforest Alliance, GlobalGAP, EU-organic (for those parts that are under conversion), ISO 14001, CO2 neutral.

2.3. Determination of Trade-Offs and Synergies

For this study, the 1769 linkages between indicators and sub-themes, which are specified in the SMART-Farm Tool and described in Section 2.1 and listed in the Supplementary Materials (Tables S2–S59), were systematically analyzed considering whether the sub-themes are influenced by similar farm management strategies or conflicting ones.
For instance, the indicator “Proportion of arable land under reduced tillage” will have a strongly positive impact on the sub-theme “Soil Quality” (which links to the objective: “Soil characteristics provide the best conditions for plant growth and soil health, while chemical and biological soil contamination is prevented”). At the same time, the indicator affects the sub-theme greenhouse gas emissions (with the objective: “The emission of GHG is contained”) positively, as it helps to sequester soil organic carbon. So, the same indicator affects several sub-themes positively and thus there is a synergy between those two sub-themes because of this indicator.
At the same time, indicators may affect one sub-theme positively and another one negatively. For instance, a higher cutting frequency of meadows may have negative impacts on the sub-theme species diversity (with the objective: “The diversity of wild species living in natural and semi-natural ecosystems, as well as the diversity of domesticated species living in agricultural, forestry and fisheries ecosystems is conserved and improved”) but it may have positive impacts on the sub-theme profitability (with the objective: “Through its investments and business activities, the enterprise has the capacity to generate a positive net income”). In this case there is a trade-off between the two sub-themes arising from this indicator.
This relation is described mathematically in Equation 3. A correlation coefficient which describes the degree of uniformity of impacts of indicators for each combination of sub-themes i and j was calculated (SYNij). This is calculated by the difference between 1 and the sum of squares of the deviations of the single impacts of the indicators n between two sub-themes (IMni and IMnj) divided by the maximum of the squared deviations between indicators of two sub-themes (MD). Synergies between dimensions and within dimensions were calculated as the arithmetic mean of synergies between the sub-themes within of a dimension (Equation (3)).
SYNij = 1 − ((∑n(IMni – IMnj)2)/MD   ∀ i and j
where n is the index for the indicators and i and j are indices of sub-themes and MD = 665.
The larger the number of indicators that are common to two sub-themes, the stronger synergies between those sub-themes. But this is only true if the impact of the indicators for the sub-themes are both either positive or negative. If an indicator has a positive impact on one sub-theme and a negative impact on another sub-theme, it will decrease the intensity of the synergy between both sub-themes.
Trade-offs (TOij) were calculated according to Equation (4) by summing up the squares of deviations of the single impacts of those indicators between two sub-themes (IMni and IMnj), which did have a positive impact on one sub-theme while having a negative impact on the other sub-theme. For determining the trade-offs between the dimensions the sum of trade-offs in a sub-theme or between two sub-themes, respectively, was calculated. Contrary to SYNij the TOij is not normalized by dividing by MD for readability, as TOij would become very small. The trade-offs in this paper are calculated based on the general relationships between indicators and sub-themes, independently of farm-specific performances. So, there is no implicit assumption about the performance of farms in this trade-off analysis.
TOij = ∑n ∈ {1,…, Ntot} sign(IMni) ≠ sign(IMnj) (IMni – IMnj)2   ∀ combinations of i j

3. Results

This section first reports the results from the SMART assessments on the sample farms for different farm types from different regions. Then, the analysis of trade-offs and synergies between SAFA sub-themes is presented. We emphasize that the first assessment is based on empirical data from real farms, illustrating the concrete application of the SMART-Farm Tool and how such analyses may compare for different farm types and regions. This illustrates on a case-study basis that the SMART-Farm Tool can be successfully applied for all relevant farm-types and regions and is thus a viable approach for sustainability assessments at farm level. The trade-off and synergy analysis, on the other hand, is based on expert assessments of the indicators and sub-themes, without reference to empirical farm data. It is thus of a different quality, describing intrinsic aspects of the SMART-tool in its current form and not of the results of its application to farms, i.e., of farm performance on the SMART indicators.

3.1. Results of Sustainability Assessments in Different Countries and Farm Types

Using the SMART-Farm Tool (see Section 2), we benchmarked farms of different types and in different countries and regions against the objectives formulated in the SAFA Guidelines.
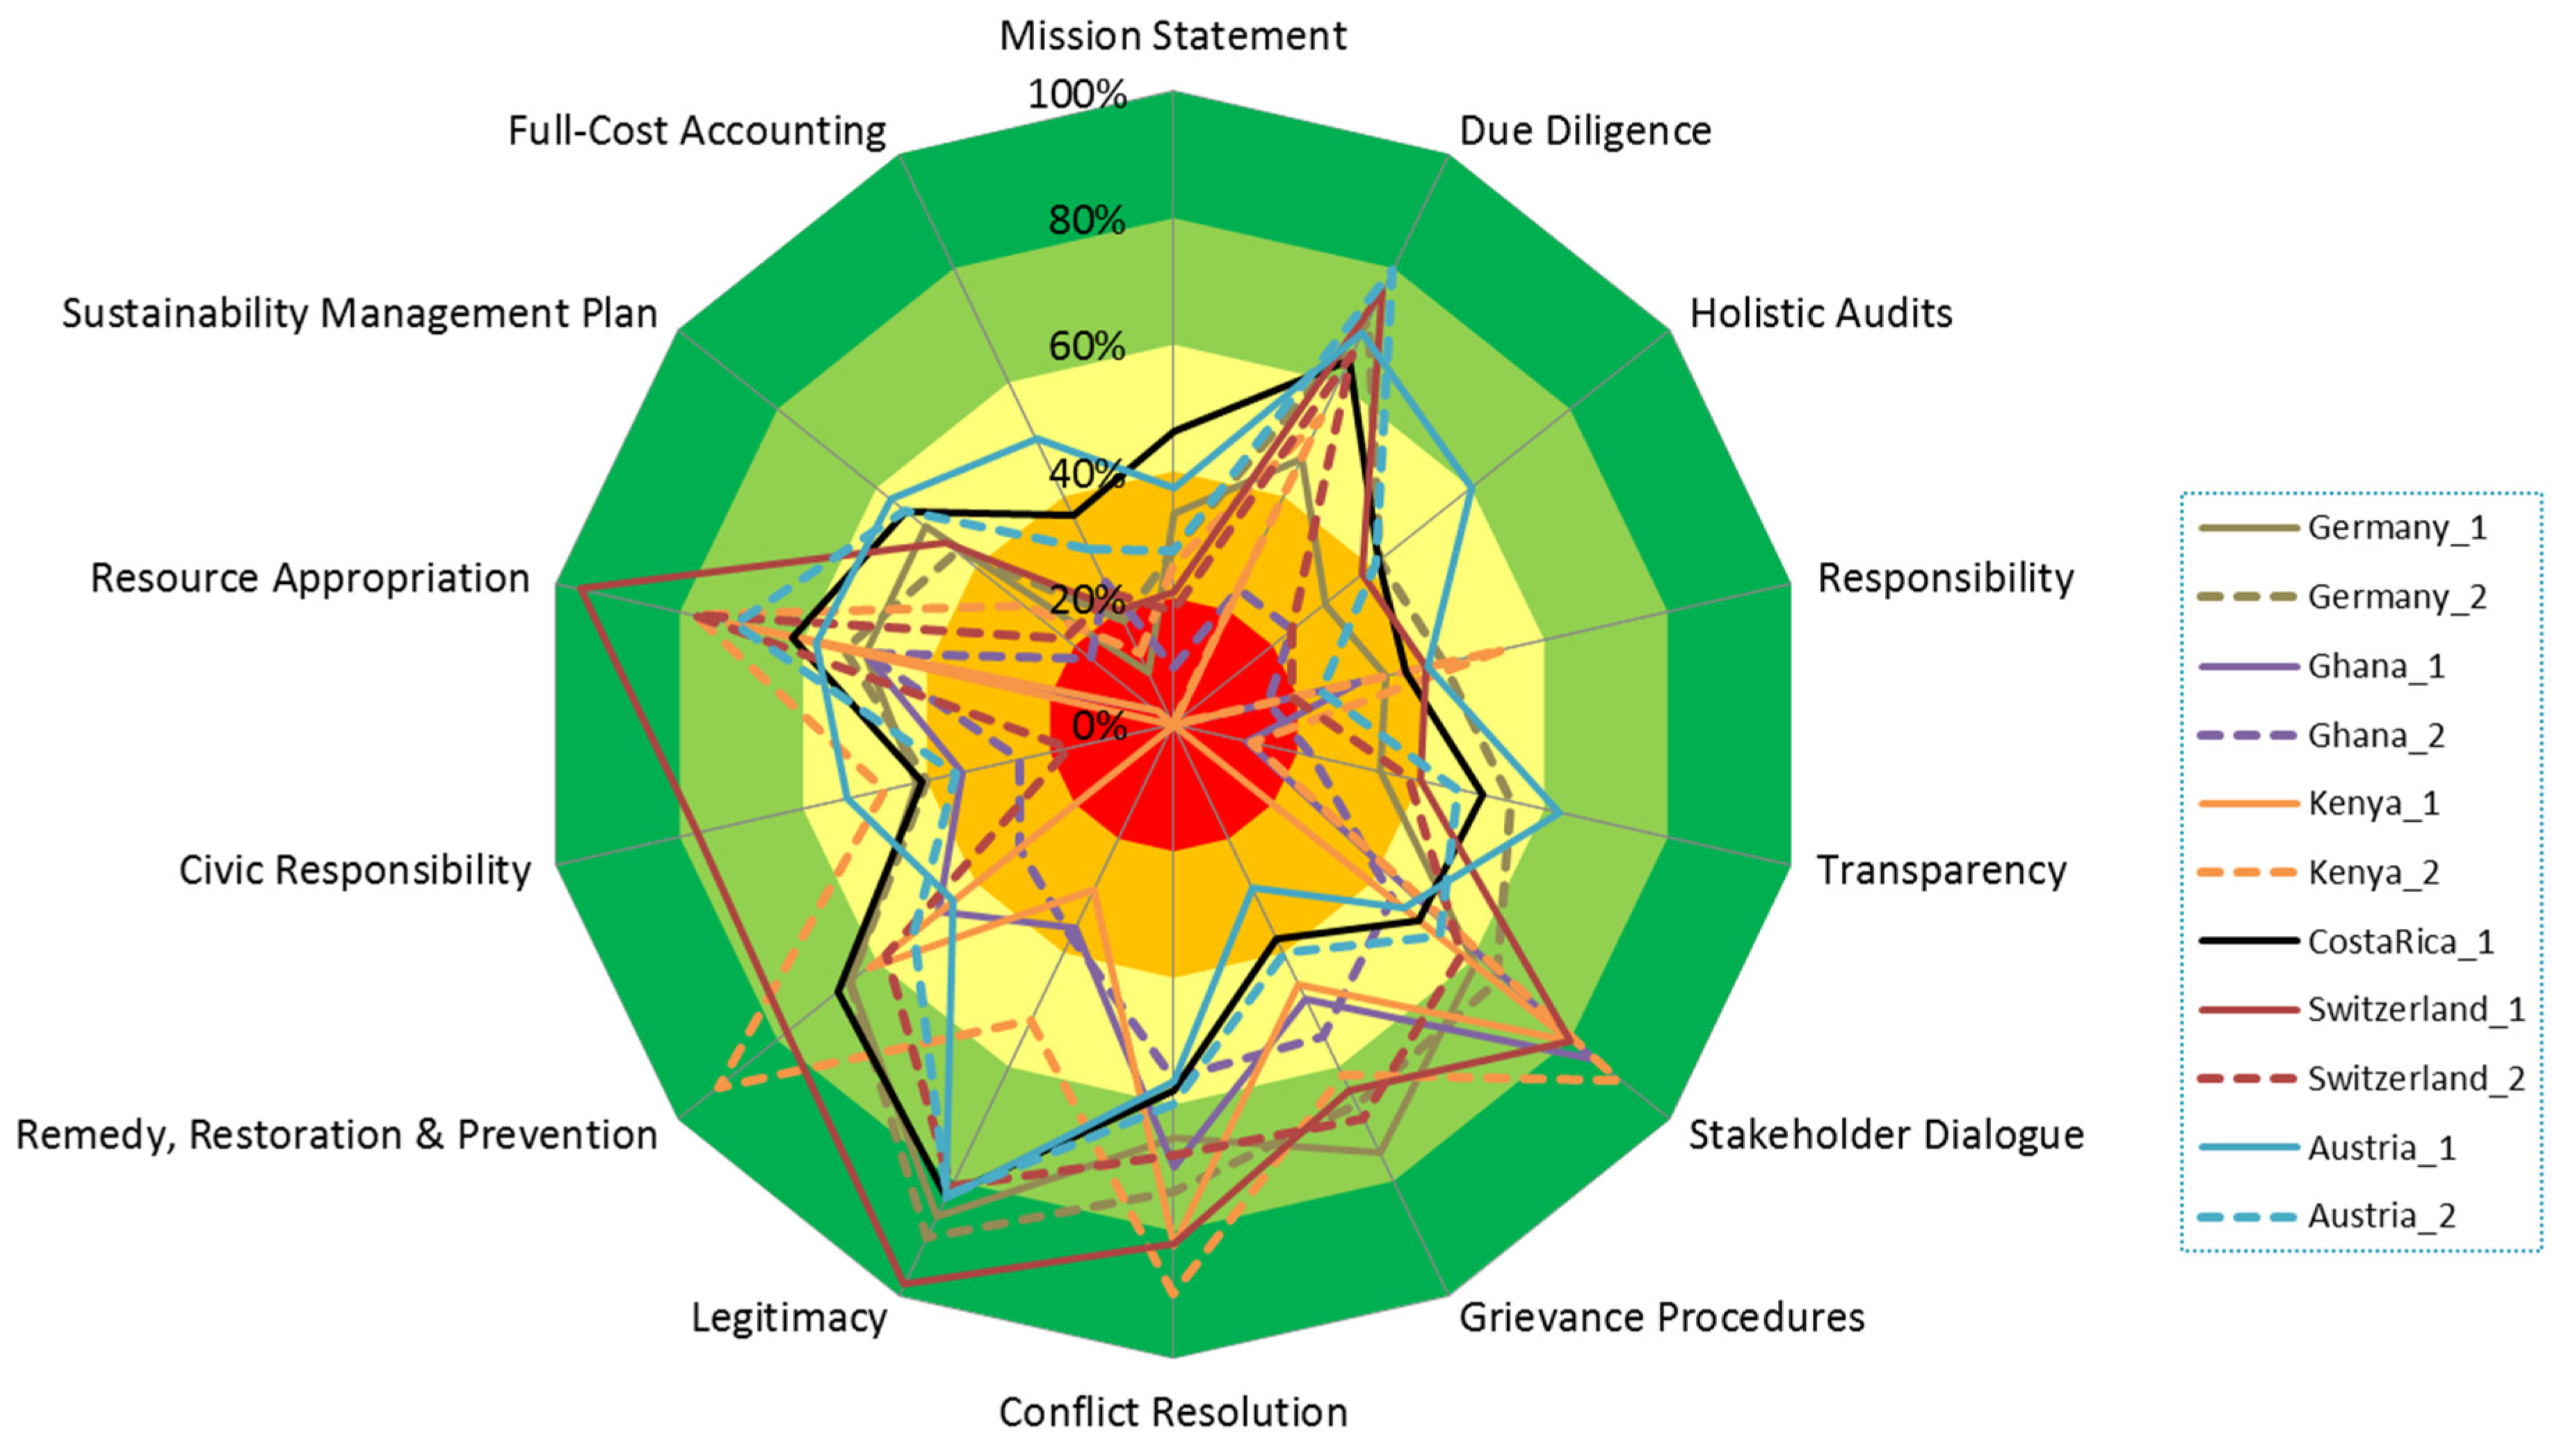
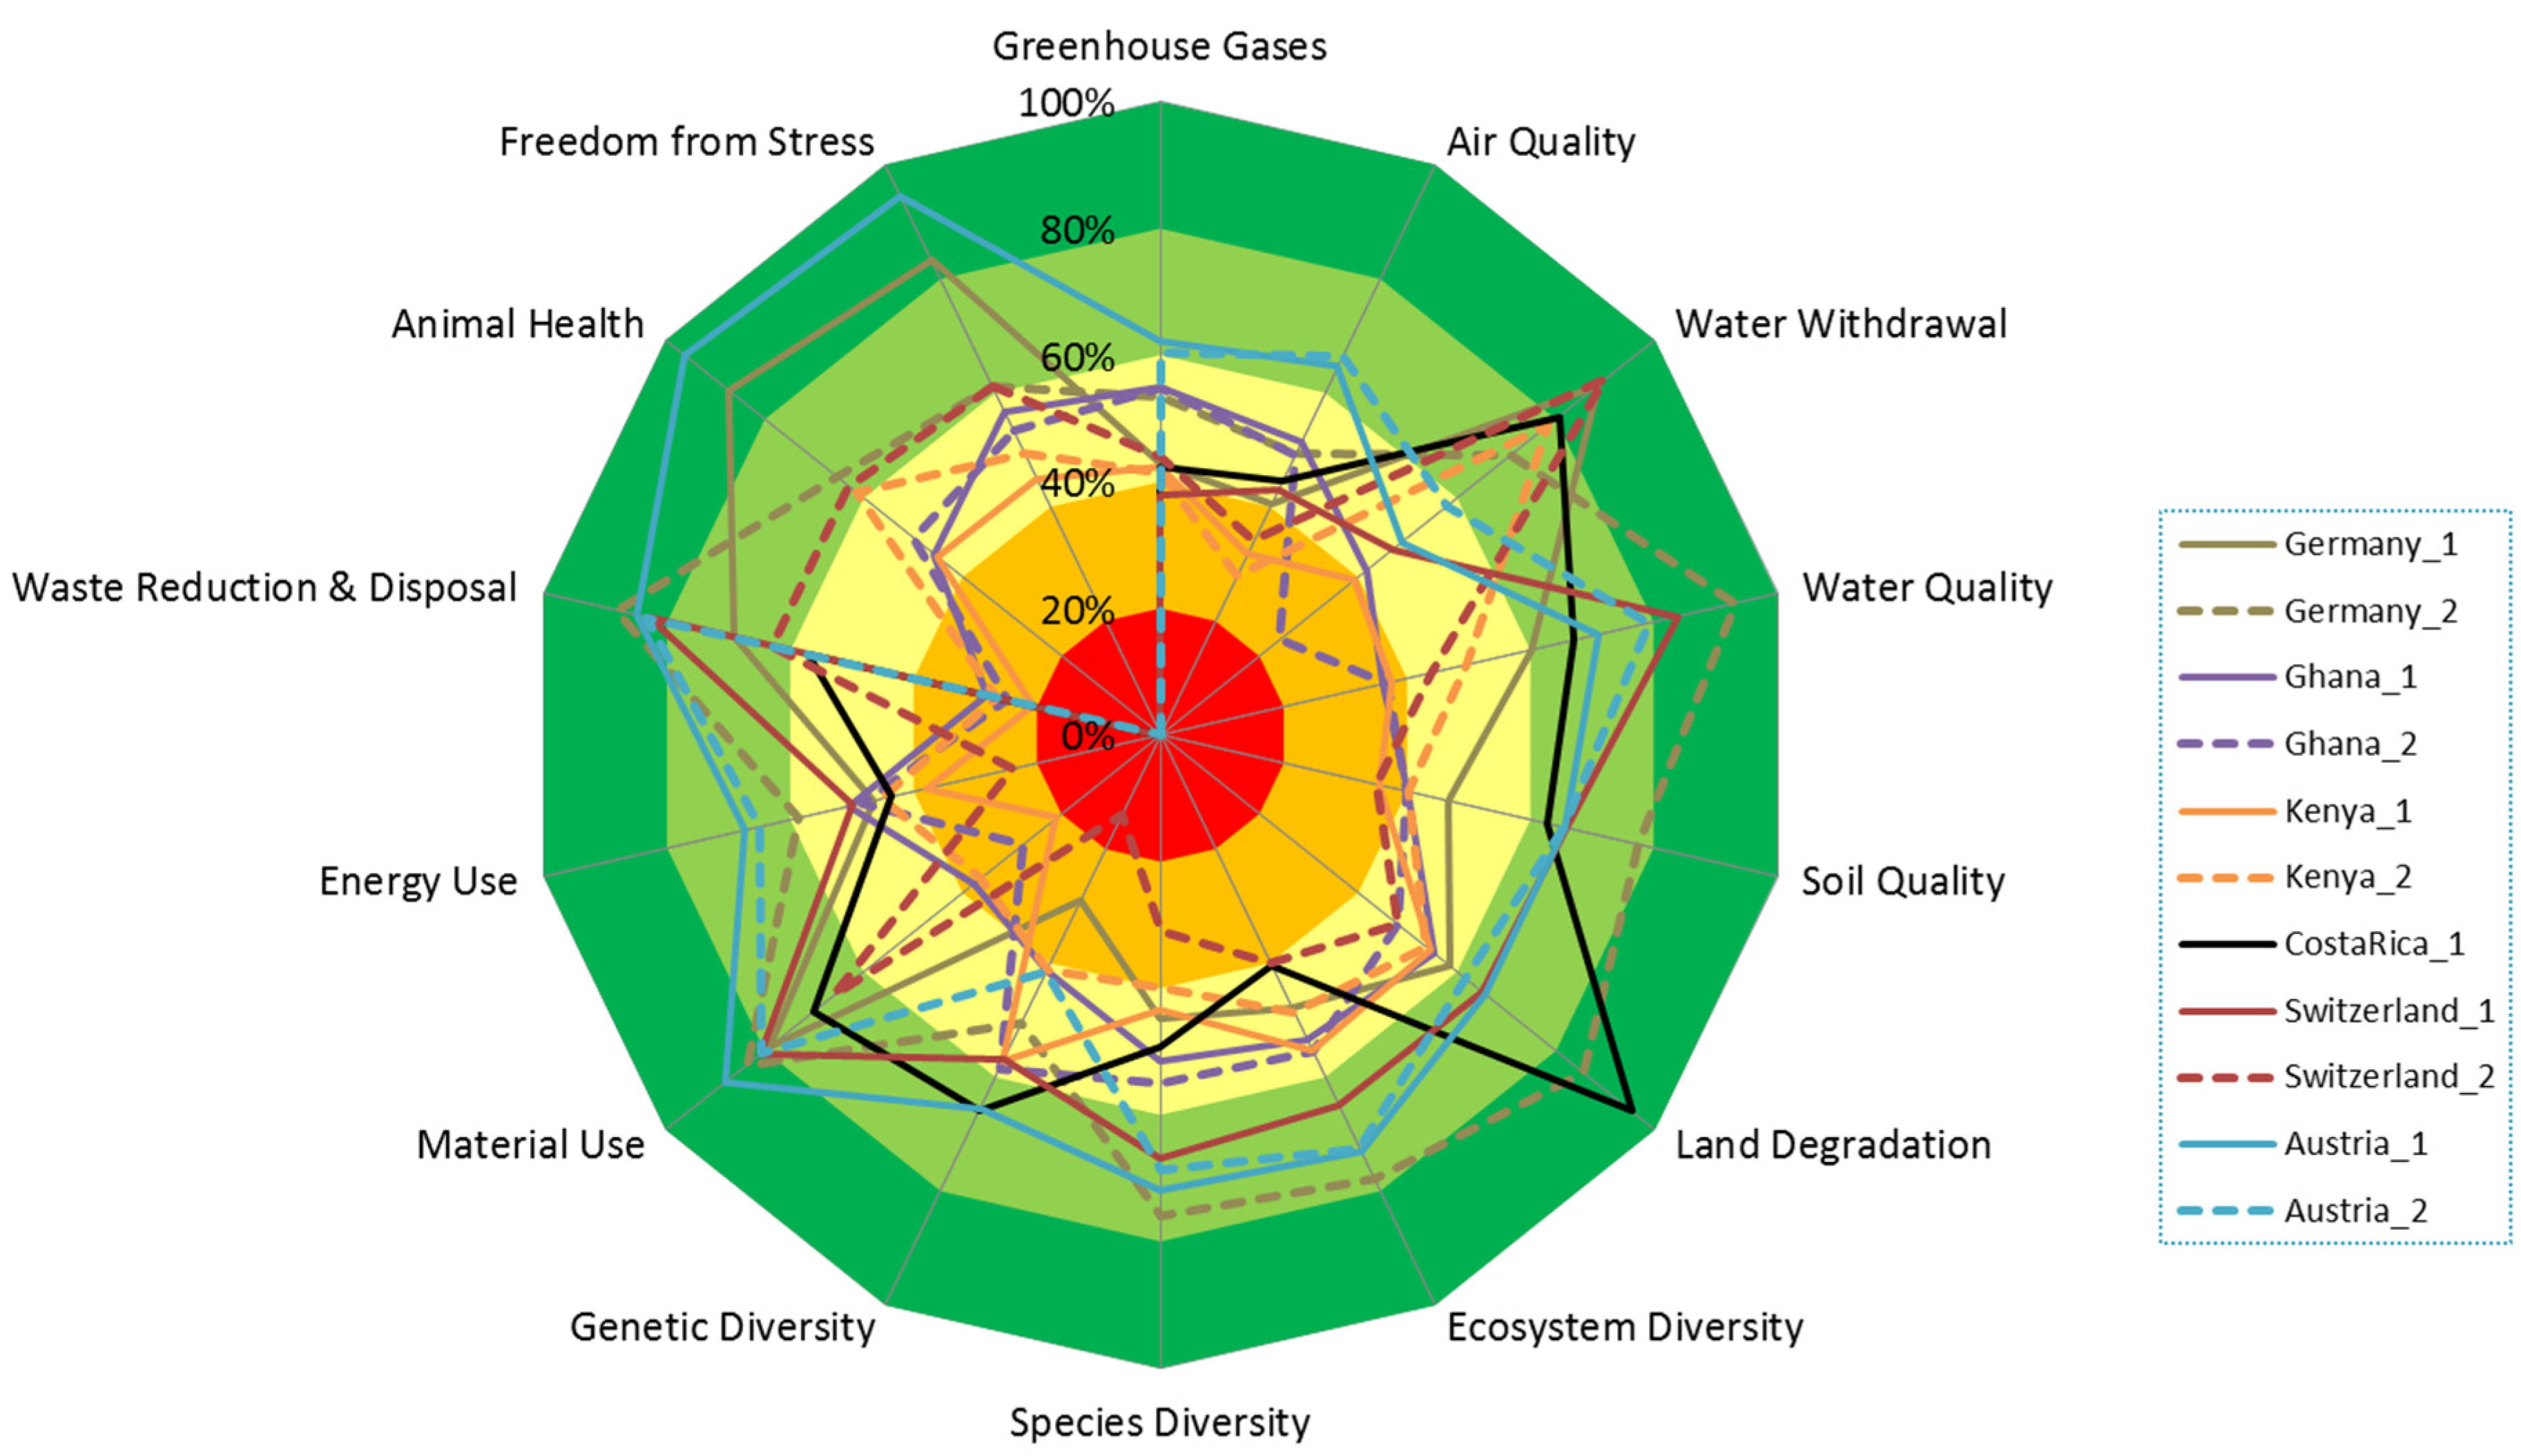
From the methodological standpoint, the SMART-Farm Tool proved to be applicable in humid, arid and temperate zones as well as in developed and developing countries. Data for each farm could be collected in 2–3 h and farmers were willing to provide the data they were asked for, as the auditors confirmed that all data will be communicated in an anonymized way. Figure 4, Figure 5, Figure 6 and Figure 7 show figures from the assessments. Table S60 gives an overview of the key descriptive statistics.

3.1.1. Governance Dimension

In the governance dimension, farms performed worst with respect to Mission Statement and Full-Cost Accounting. Also for Transparency and Holistic Audits it was difficult for farms to come close to a high degree of goal achievement. On the other hand, for the sub-themes Legitimacy, Remedy, Restoration and Prevention, Resource Appropriation and Stakeholder Dialogue high degrees of goal achievement were relatively easy to meet. The distribution was highest for Civic Responsibility and lowest for Conflict Resolution.

3.1.2. Environmental Dimension

In the environmental dimension, farms performed worst with respect to Greenhouse Gases, Air Quality, Genetic diversity and Energy Use. This means that the goals set out in the SAFA Guidelines for these sub-themes were most difficult to achieve for the farms. Water Withdrawal and Water Quality, Material Use, Energy Use and Waste Reduction and Disposal were the themes where single farms performed worst. Some farms do not produce livestock and are depicted with a score of zero for the sub-themes Animal Health and Freedom from Stress in Figure 5. These sub-themes were consequently declared to be irrelevant on these farms.
At the same time, for the sub-themes Animal Health, Freedom from Stress, Land Degradation, Material Use, Water Quality and Water Withdrawal, some farms managed to perform very well. This shows that the highest variability among farms in degree of goal achievement was found for Animal Health, Freedom from Stress, Waste Reduction and Disposal, Material Use and Water Withdrawal.

3.1.3. Economic Dimension

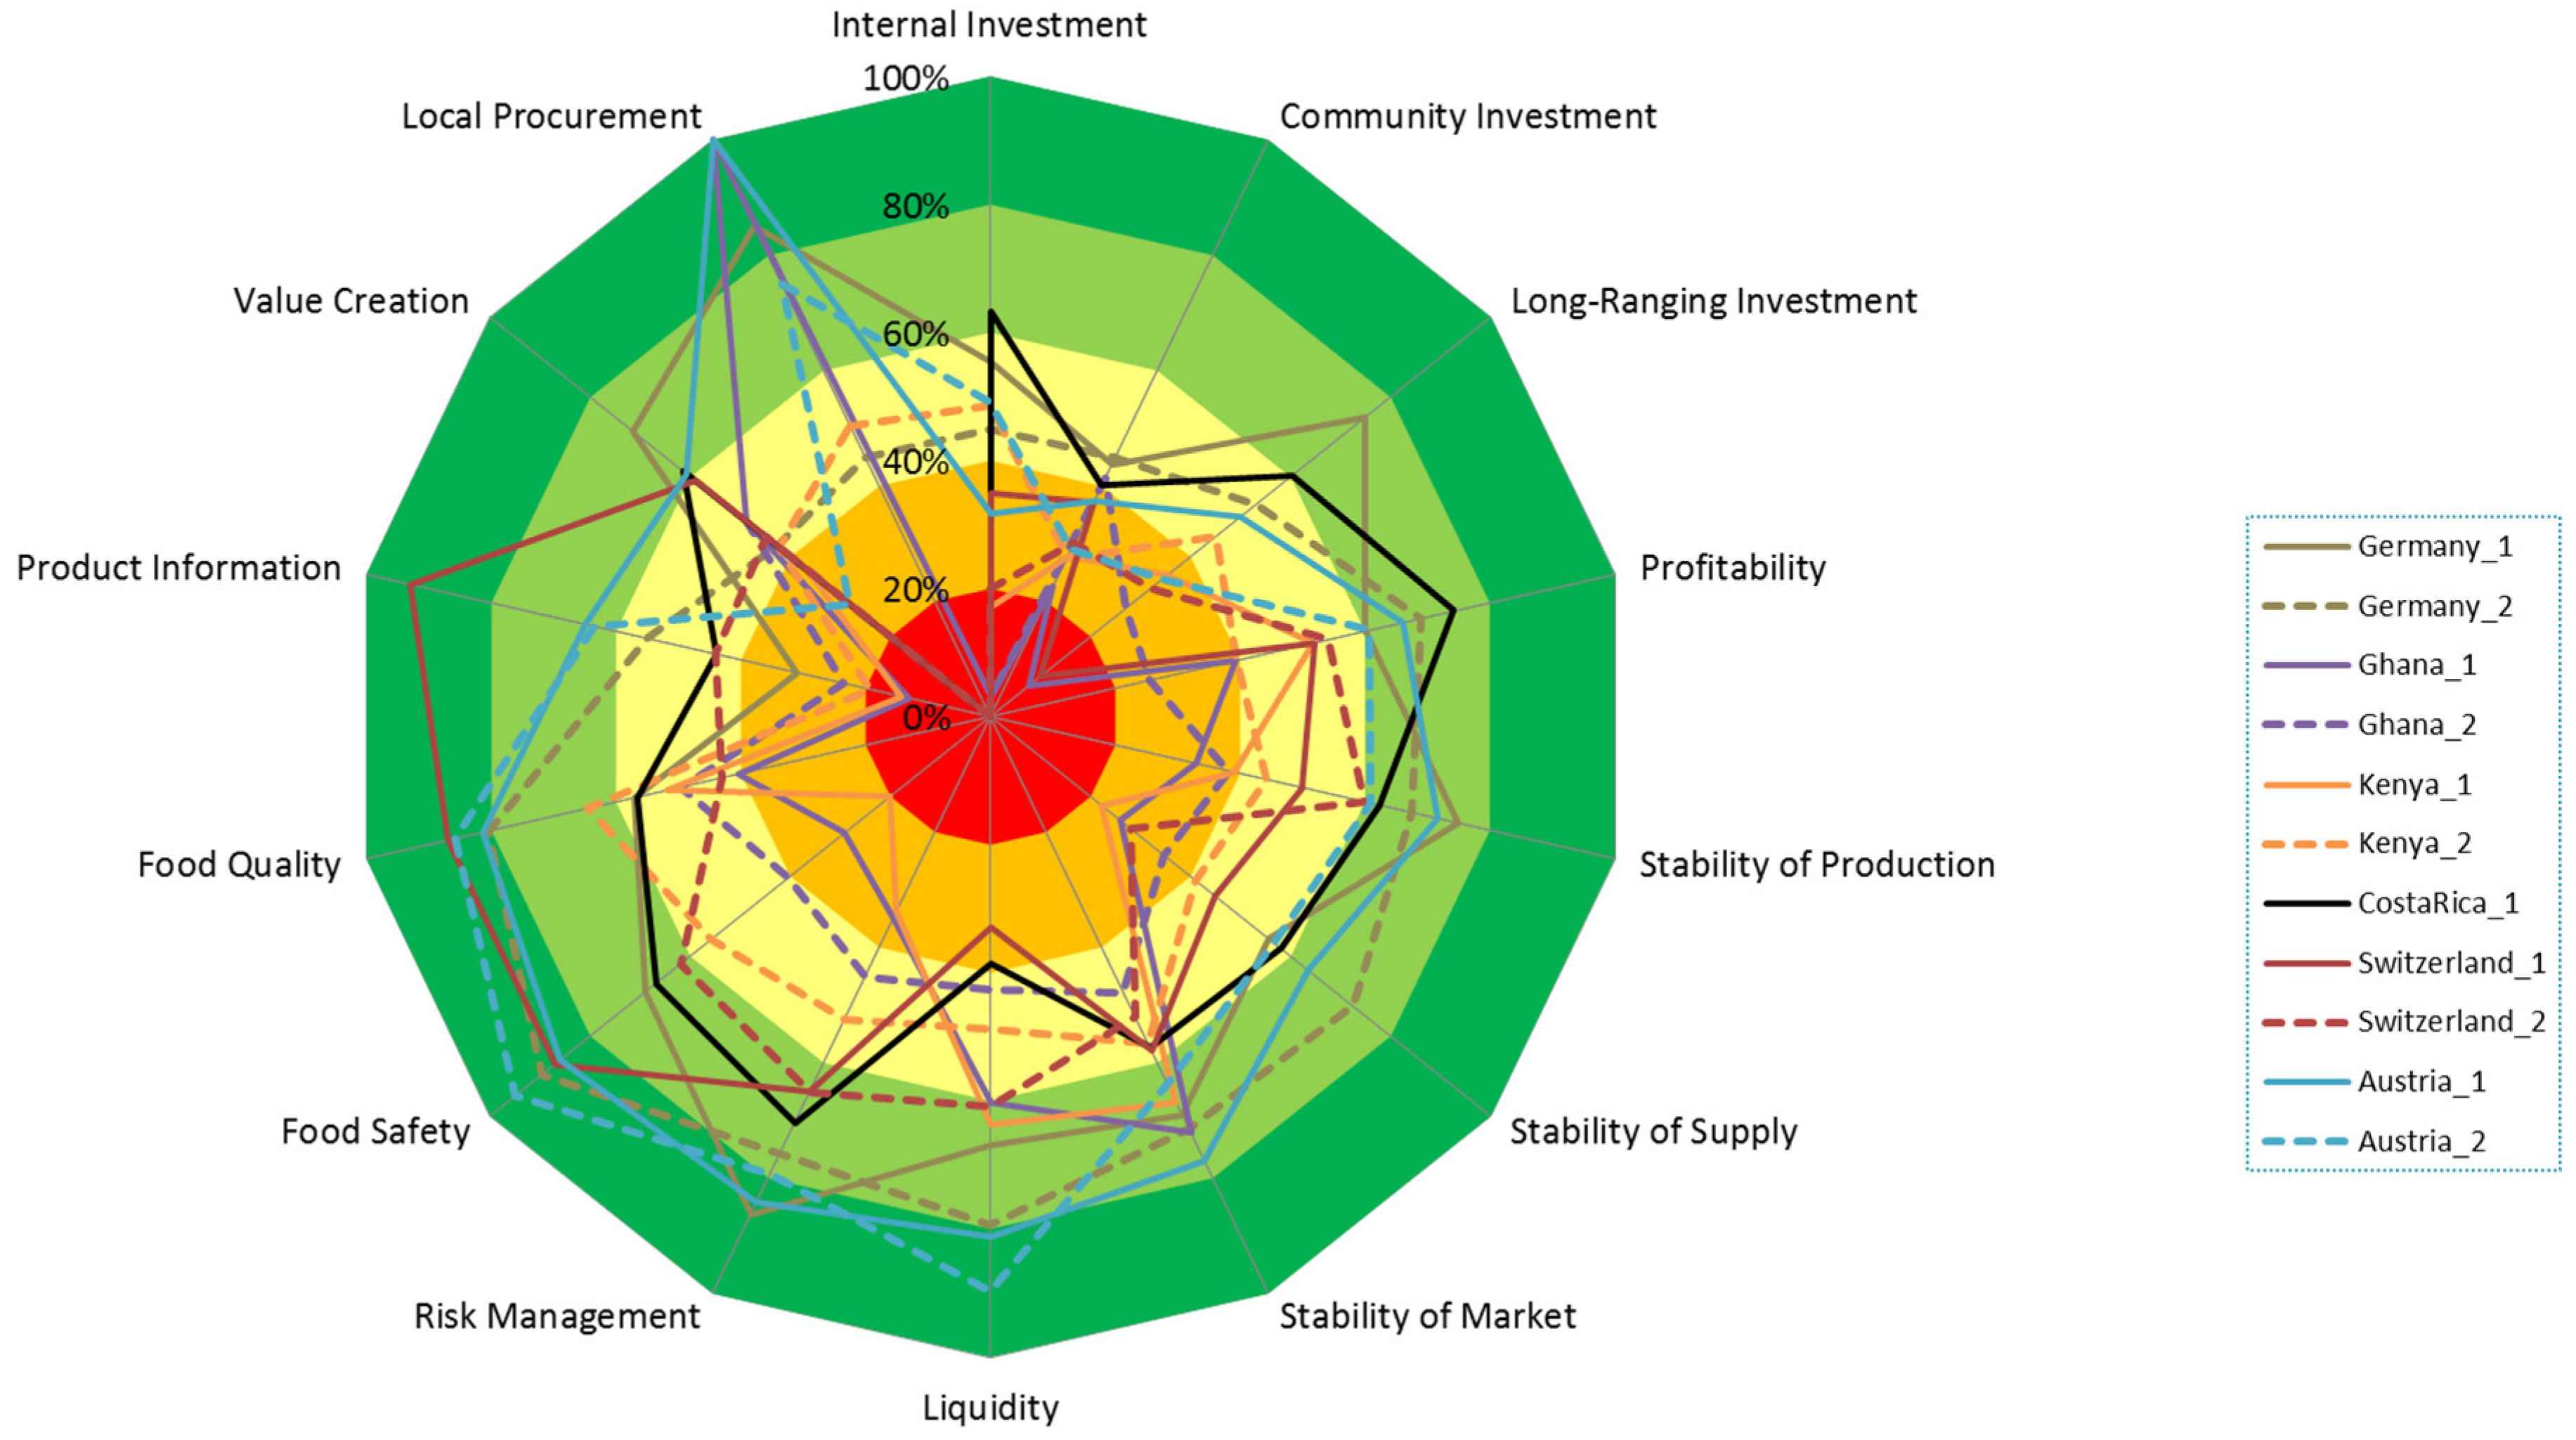
In the economic dimension, farms performed worst with respect to Internal Investment, Long-Ranging Investment and Local Procurement, while the latter indicator was irrelevant for farms which did not purchase any inputs. Also with respect to Product Information, Food Safety, Stability of Supply and Community Investments, for each sub-theme at least a single farm performed below 25%. Lowest median scores were achieved for the sub-themes related to Investments, Stability of Supply, Product Information and Product Quality.
At the same time, there were farms in our sample which performed very well, with more than 90% degree of goal achievement for Local Procurement, Product Information, Food Safety, Liquidity, Food Quality and Risk Management. There was no farm performing better than 45% for Community Investment. This shows that the goal of this sub-theme is particularly difficult to achieve for farmers. For the sub-themes Local Procurement, Product Information, Food Safety and Long-Ranging Investment, the highest ranges of scores were achieved.

3.1.4. Social Dimension

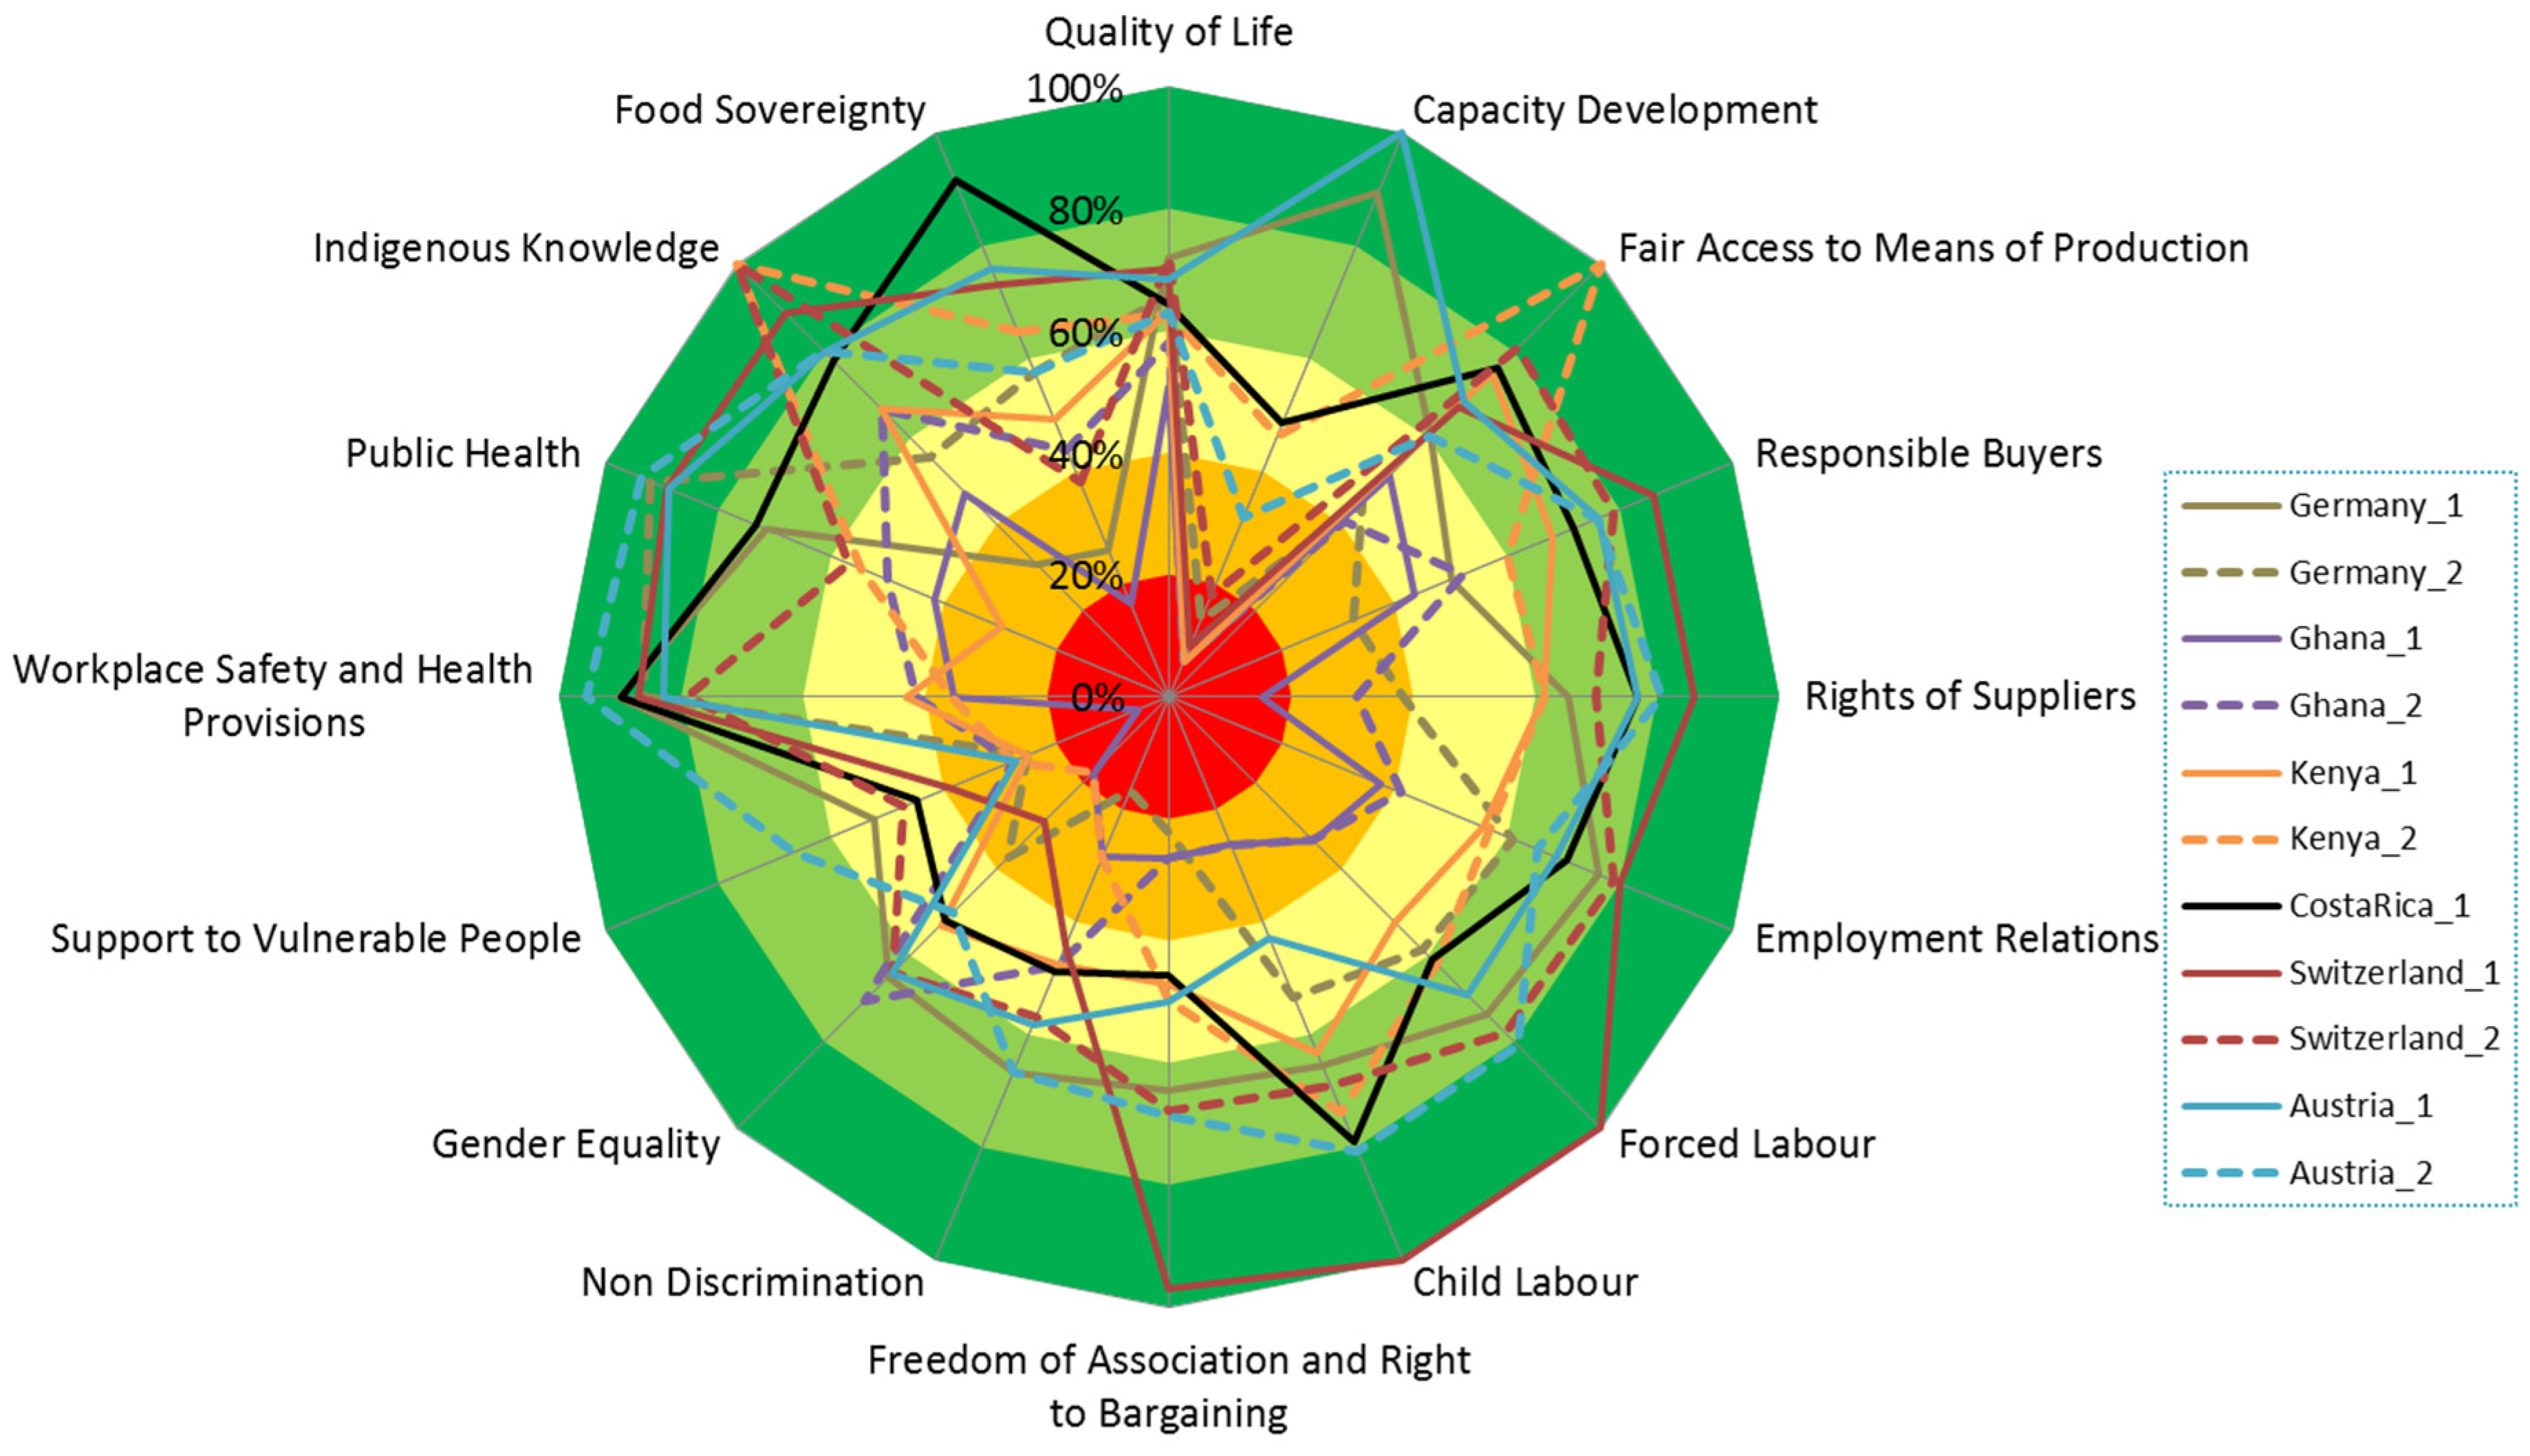
In the social dimension, the lowest median scores were achieved for the sub-themes Capacity Development, Support to Vulnerable People, Non-Discrimination and Freedom of Association and Right to Bargaining. Sub-themes for which single farms received a degree of goal achievement below 25% were Support to Vulnerable People, Capacity Development, Rights of Suppliers and Food Sovereignty.
At the same time, there were farms in our sample which performed with 100% for Forced Labor, Child Labor, Indigenous Knowledge, Fair Access to Means of Production and Capacity Development. Very good scores, with more than 90% degree of goal achievement were also realized by single farms for Workplace Safety and Health Provisions, Public Health and Food Sovereignty. The lowest range of difference in the degree of goal achievement among our sample farms was for Quality of Life, while the highest range was for Capacity Development.

3.2. Trade-Offs and Synergies between Dimensions and Sub-Themes

In Section 3.1, we analyzed the performance of the selected farms with respect to each sub-theme. While there were single farms, which managed to perform well with respect to a large number of sub-themes, no single farm manages to perform well across all sub-themes and dimensions. This finding shows the importance of further analyzing trade-offs and synergies between sub-themes and dimensions. As delineated in Section 2.3, we do not explore this based on the scores of the single farms but based on the interrelations that are specified in the algorithms for determining the degree of goal achievement.
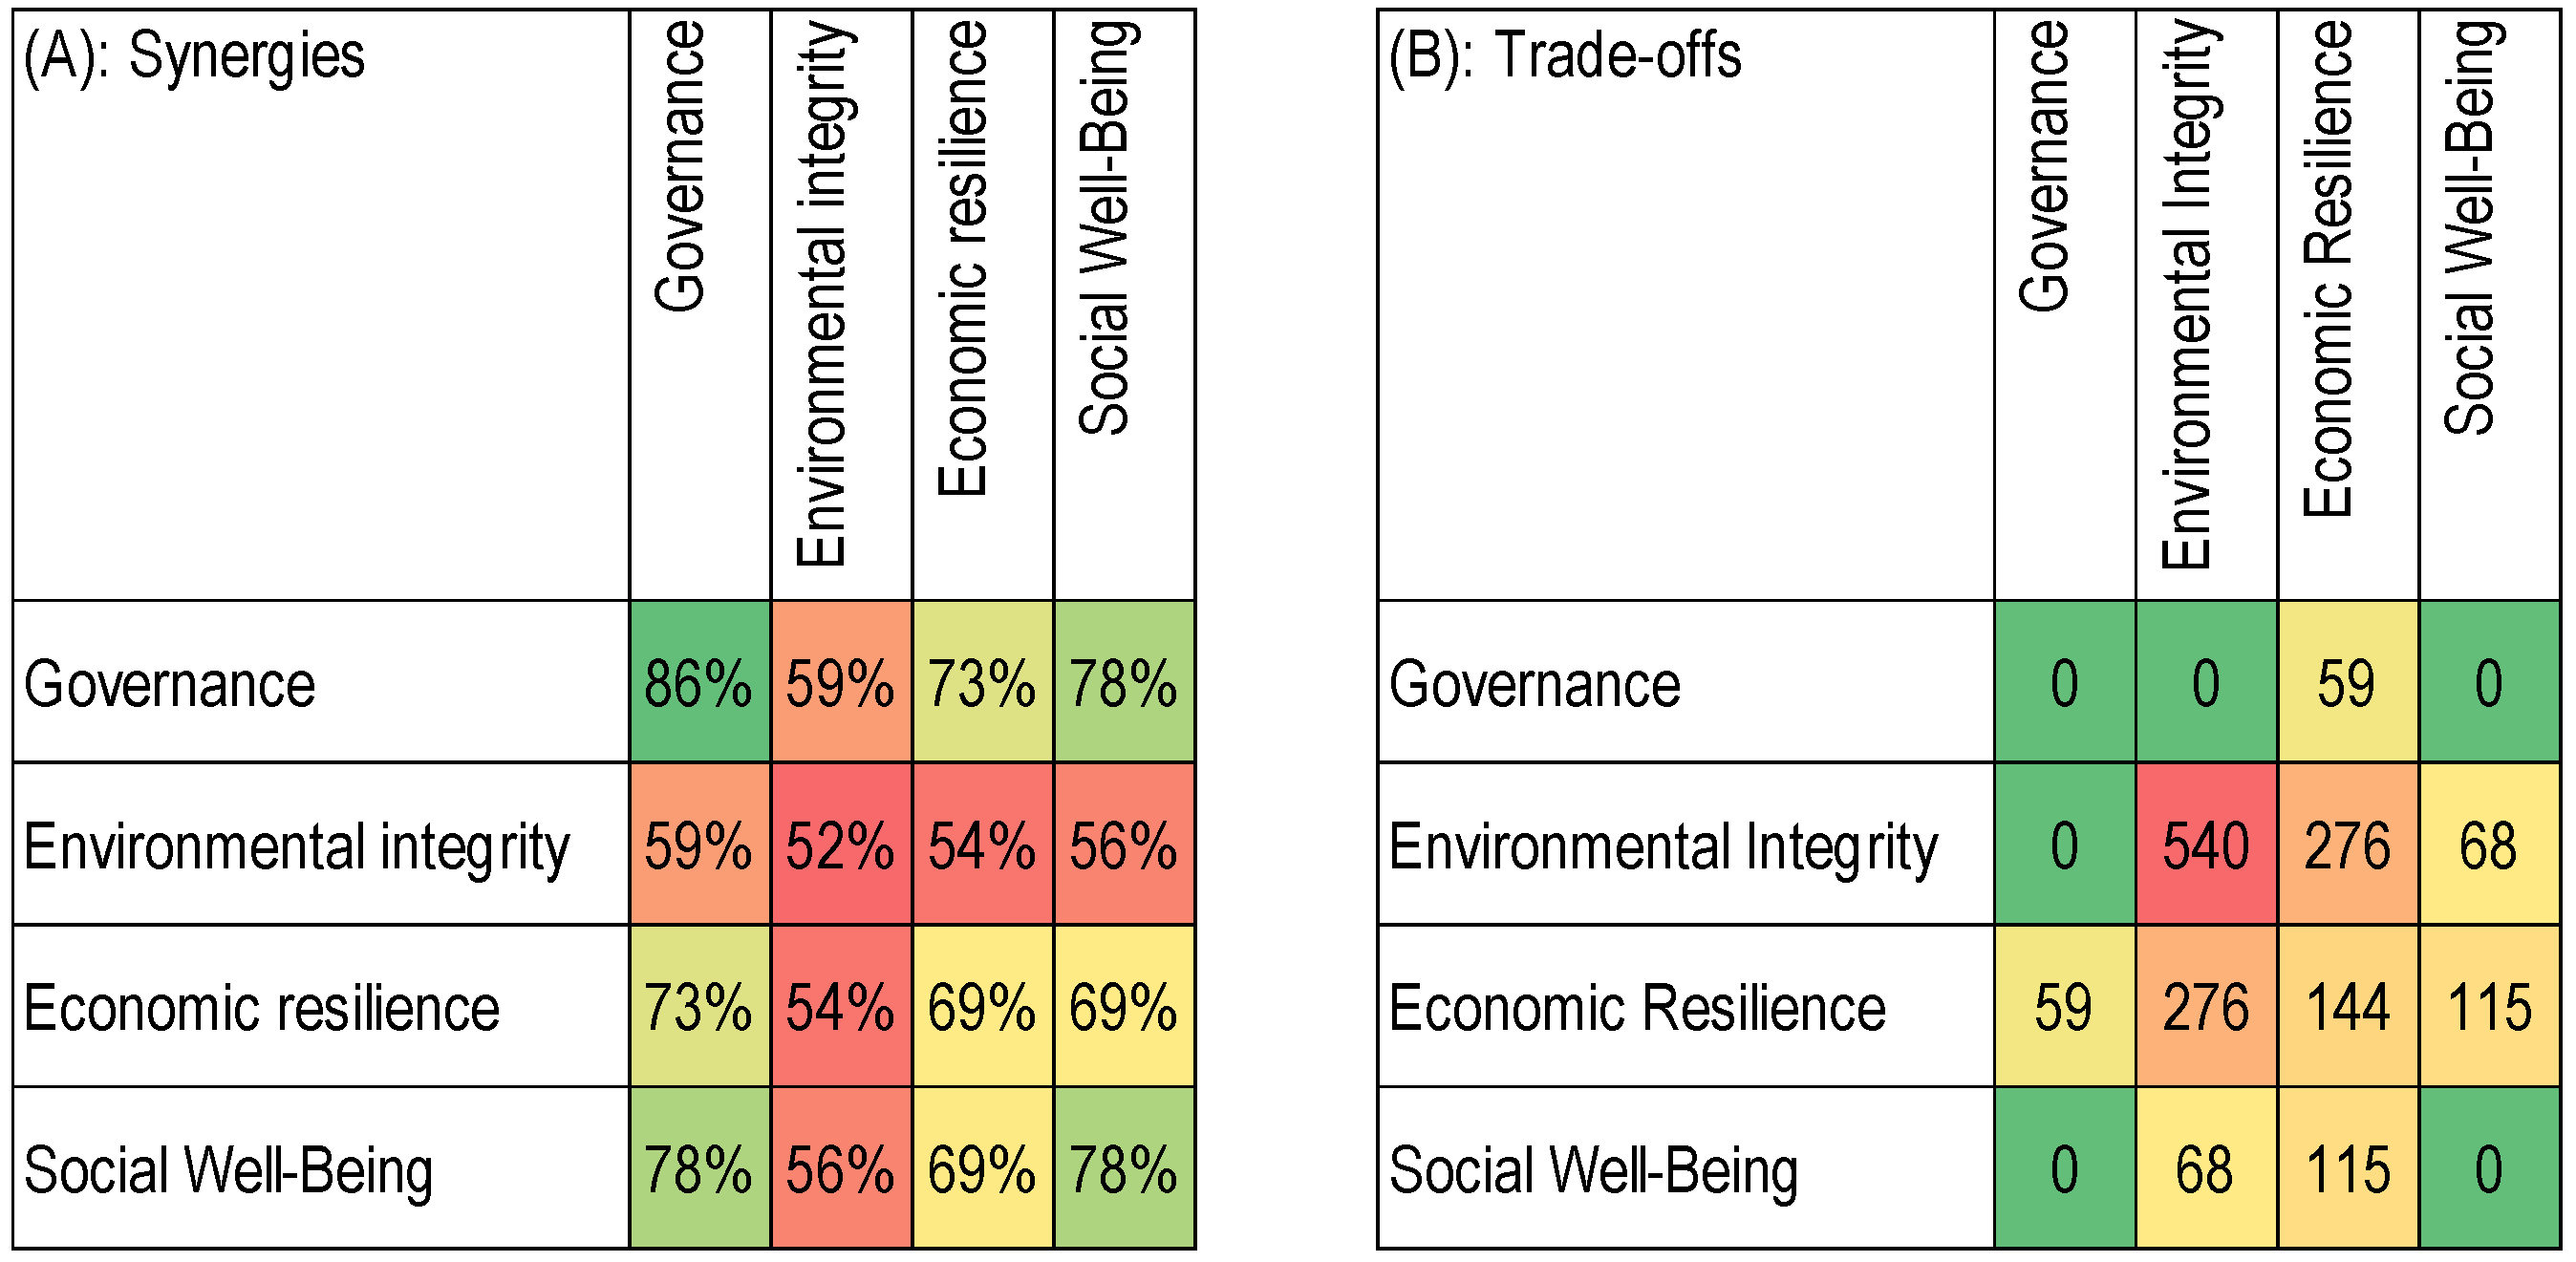
When analyzing the individual dimensions, the most similar and synergistic management strategies could be identified for the themes in the governance (86% of correlation between indicator-theme impact relationships on average for the sub-themes in this dimension) and the social dimensions (78%). The least degree of uniformity in management strategies (i.e., the least synergistic) strategies were identified for the environmental (52%) and economic dimensions (69%).
Between the dimensions, synergies are greatest between the social and the governance dimensions (78%) and the economic and governance dimension (73%). The similarities between the social and economic dimensions (69%) are greater than between the environmental and governance dimensions (59%) (Figure 8A).
At a sub-theme level (see Figures S60 and S61 in the Supplementary Materials C), in the environmental dimension, the least synergies were found between Animal Health and Freedom from Stress on the one hand and the rest of the environmental sub-themes on the other hand. Furthermore, synergies between Material Use and Energy Use on the one hand and Biodiversity, Water Quality, Soil Quality and Land Degradation on the other hand were low. Greatest synergies were found between: (a) Animal health and Freedom from Stress; (b) between Air Quality and Energy Use; and (c) between Ecosystem Diversity and Species Diversity.
In the economic dimension, (a) the sub-themes Product Information, Value Creation and Local Procurement showed the largest synergies as well as (b) Stability of Markets and Stability of Supply and (c) Internal Investment, Community Investment and Long-term Investments. While Risk Management showed the lowest degree of synergies with other economic sub-themes.
In the social dimension, Public Health, Workspace Safety and Quality of Life had the lowest degree of synergies with the other social sub-themes. In the governance dimension only Legitimacy showed a slightly lower degree of synergies with other sub-themes.
The trade-offs (Figure 8B) were classified into three groups: (a) trade-offs between dimensions; (b) trade-offs between sub-themes within one dimension; and (c) trade-offs between sub-themes in different dimensions. It was found that trade-offs between the environmental and the economic dimensions were greatest, mainly due to trade-offs with the sub-theme Stability of Production (Tables S60 and S61 in the Supplementary Materials C). Trade-offs between the social and the economic dimensions were also substantial due to Profitability and Stability of Production on the one hand and Public Health and Workplace Safety on the other hand. To a lower extent there were also trade-offs between the social and the environmental dimensions. The main conflict is between Profitability on the one hand and Legitimacy and Responsibility, as sub-themes in the governance dimension, on the other hand. There are no trade-offs between the governance dimension and the dimensions of environmental integrity and social well-being.
Interestingly the trade-offs within the environmental dimension were even larger than the trade-offs with other dimensions. Most relevant were trade-offs between Greenhouse Gases and Animal Welfare. Also within the economic dimension substantial trade-offs exist. No trade-offs were identified between sub-themes within the social dimension or the governance dimension.

4. Discussion and Conclusions

With respect to the three main objectives of this paper, we conclude that the SMART-Farm Tool is a useful way to benchmark farms across farm types and regions with low time requirements per farm. Data was available for judging the degree of goal achievement, both for the farms in developing and developed countries. The SAFA goals are generally applicable but some goals are difficult to achieve for almost all farms, whereas others don’t show a high range of difference in goal achievement between farms. SMART allows comparability of farm types at sub-theme level. However, it is important to look at the driving factors for the sustainability scores, when interpreting the results and suggesting changes on farms or for farming systems. Furthermore, comparability of results between farm assessments requires a consistent approach over time. Despite the SMART-Farm Tool having been tested in very different geographical contexts and on various farm types, it may be necessary to adapt the indicator set for further applications. Therefore, while changes will be applied to the tool for future applications, upcoming versions need to be downwardly compatible with the former versions. Furthermore, uncertainty in expert assessments needs to be addressed. Therefore, further expert evaluations on the importance of the indicators for different sub-themes will be linked an uncertainty analysis using Monte-Carlo Simulations based on a procedure used in [30]. For some sub-themes (e.g., Energy Use, Greenhouse Gases and Profitability), a more quantitative approach (e.g., life cycle assessment or calculation of gross margins) could be implemented alternatively. However, data collection on farms for such a quantitative approach would induce high costs, if high-quality results need to be achieved [31,32]. Furthermore, some data are hardly available or farms do not want to provide the data, especially for economic variables such as farm income, which would be a quantitative indicator for profitability. On the other hand, some of the sub-themes are much broader than a single number can express, so several indicators would also need to be covered.
The broader MCA-like approach of SMART also helps to make the driving factors for poor or good performance with respect to the 58 sustainability sub-themes transparent. In the SMART-tool, all this information is compiled by using the 327 indicators and provided as a farm-level sustainability report (cf. Supplementary Materials B for an example). Besides analyzing single farms, the SMART-tool can also be applied to groups of farms to analyze their performance and relevant driving factors and to compare different groups in this context. In the coming months the SMART-Farm Tool will be applied to larger samples of up to 2000 farms, which will be compared with each other.
This discussion shows that both types of approaches—semi-quantitative MCA-like approaches and quantitative LCAs have their justification and the choice of tool needs to be evaluated carefully. Furthermore, the advantages and disadvantages of the different approaches confirm that tools should be targeted to specific purposes, such as benchmarking or farm advice, instead of trying to apply a one-size-fits-all solution [15,33]. At the same time it makes sense to harmonize data collection for different purposes in order to reduce costs. This is not limited to sustainability assessment but applies also to inspections of farms for receiving direct payments, inspections of organic farms, economic benchmarking and advice.
Looking at the different farms, the results presented here illustrated that some farms perform very well with respect to some sub-themes and others perform well with respect to others. Also some sub-themes were clearly related to each other and thus obtained a good rating if another sub-theme was also performing well. This emphasizes the importance of understanding the synergies and trade-offs that exist between the sub-themes. As described in Section 2, our sample of farms was not large enough to do this with a statistical approach based on empirical data, therefore we analyzed trade-offs and synergies using the algorithms defined in the SMART-Farm Tool.
The analysis of synergies revealed some space for simplification between some of the themes, especially strong synergies were found between some sub-themes in the governance dimension and the social dimension. Synergies between sub-themes within dimensions were also present between Animal Welfare and Freedom from Stress, between Energy Use and Air Quality, and between Species and Ecosystem Diversity in the environmental dimension. In the economic dimension, the synergies were largely grouped within the themes, for instance between the different investment sub-themes or vulnerability sub-themes. In the social dimension synergies were generally very strong except for the sub-themes Quality of Life, Workplace Safety and Public Health. This shows that the latter sub-themes need to be addressed separately, while other social issues can be addressed via multi-objective measures. Apart from the above-mentioned synergies between the governance dimension and the other dimensions, there were also important synergies identified between the economic sub-themes Investments, Vulnerability and Local Economy and the social dimension.
The trade-offs were classified into three groups: (a) general trade-offs between dimensions; (b) trade-offs between sub-themes in one dimension; and (c) trade-offs between sub-themes in different dimensions. Major trade-offs were found within the environmental dimension and between the environmental and economic dimension. This confirms the current focus on the trade-offs between these themes in scientific literature (e.g., [34]). The trade-offs within the environmental dimension were even larger than the trade-offs with other dimensions. Trade-offs within the governance dimension and between the governance dimension and other sustainability dimensions (except economic resilience) did not exist, which underlines the important role of the governance dimension as a supporting dimension for achieving good performance in the other dimensions. We conclude that farms optimizing the governance dimension will have positive synergies with most of the environmental, social and economic sub-themes.
The environmental dimension is most difficult to optimize as substantial trade-offs exist both within itself and with other dimensions. Priorities need to be set depending on the specific context of the farm. Policy could also play an important role in this respect. The high degree of synergies between governance and the other dimensions reinforces the importance of quality management at farm level with respect to sustainability.
Trade-offs between sub-themes Stability of Production and Profitability cause multiple trade-offs to other sustainability topics. Remarkably, no trade-offs were identified between sub-themes within the social dimension. Trade-offs between the economic dimension on the one hand and the environmental and social dimensions on the other hand, need to be accepted at farm level, but could be addressed by policy makers, to help farmers set the right priorities. Policies can therefore help to support decision making by farmers with respect to trade-offs. An analysis with the SMART-Farm Tool can help to understand the trade-offs and synergies which would be a first step to finding appropriate solutions, as it allows for the identification of difficulties and potentially unsuccessful solutions right from the beginning (e.g., such as those that disregard the presence of specific trade-offs), as well as the most promising solutions (e.g., those that identify and build on specific synergies). The combination of an application of the SMART-Farm Tool with specific tools for extension, such as RISE [35], OCIS PG-Tool [36] or tools targeted to single topics, e.g., biodiversity [30,37] or greenhouse gas emissions [38,39], should be decided based on the performance measures in a status-quo analysis.

Supplementary Materials

The Supplementary Materials can be found at www.mdpi.com/2071-1050/8/3/274/s1.

Acknowledgments

The authors are grateful to Gerling Foundation and Ekhaga Foundation for financially supporting this research work. Furthermore, we are grateful to the following experts for supporting this study with their expertise: Hippolyte Affognon, Paul van den Berge, Richard Bircher, Joseph Clottey, Irene Egyir, Andreas Gattinger, Jan Grenz, Anja Heidenreich, Stefan Hörtenhuber, Beate Huber, Julia Jawtusch, Matthias Meier, John Ndugu, Bernadette Oehen, Lukas Pfiffner, Anet Spengler, Moritz Teriete, Christian Thalmann, Axel Wirz. We are grateful to FAO, in particular Nadia El-Hage Scialabba and Alexander Müller, for fostering the SAFA process, providing valuable inputs and discussing methodological aspects related to SMART and SAFA. Furthermore, we thank the farmers who have been willing to participate in a SMART Audit being performed on their farms and to share their data anonymously. We furthermore thank the two anonymous reviewers whose comments improved comprehensibility of the paper.

Author Contributions

Christian Schader, Lukas Baumgart, Jan Landert, Thomas Lindenthal, Urs Niggli and Matthias Stolze conceived and designed the research; Christian Schader, Lukas Baumgart, Jan Landert, Brian Ssebunya., Johan Blockeel, Rainer Weisshaidinger, Richard Petrasek and Dóra Mészáros collected the data and built the model, Christian Schader, Lukas Baumgart, Adrian Muller, Susanne Padel, Catherine Gerrard and Laurence Smith analyzed the data; Christian Schader, Lukas Baumgart and Jan Landert wrote the paper.

Conflicts of Interest

The authors declare no conflict of interest.

Abbreviations

The following abbreviations are used in this manuscript:
SMARTSustainability Monitoring and Assessment Routine
SAFASustainability Assessment of Food and Agriculture Systems
MCAMulti-Criteria Analysis

References and Notes

  1. Rockström, J.; Steffen, W.; Noone, K.; Persson, Å.; Chapin, F.S., III; Lambin, E.; Lenton, T.M.; Scheffer, M.; Folke, C.; Schellnhuber, H.; et al. Planetary boundaries: Exploring the safe operating space for humanity. Ecol. Soc. 2009, 14. Article 32. [Google Scholar]
  2. Tilman, D.; Balzer, C.; Hill, J.; Befort, B.L. Global food demand and the sustainable intensification of agriculture. Proc. Natl. Acad. Sci. USA 2011, 108, 20260–20264. [Google Scholar] [CrossRef] [PubMed]
  3. Schader, C.; Müller, A.; El-Hage Scialabba, N.; Hecht, J.; Isensee, A.; Erb, K.-H.; Smith, P.; Makkar, H.P.; Klocke, P.; Leiber, F.; et al. Impacts of feeding less food-competing feedstuffs to livestock on global food system sustainability. J. R. Soc. Interface 2015, 12, 1–12. [Google Scholar] [CrossRef] [PubMed]
  4. Godfray, H.C.J.; Garnett, T. Food security and sustainable intensification. Philos. Trans. R. Soc. Lond. B Biol. Sci. 2014, 369, 20120273. [Google Scholar] [CrossRef] [PubMed]
  5. Lagerkvist, C.J.; Hess, S. A meta-analysis of consumer willingness to pay for farm animal welfare. Euro. Rev. Agric. Econ. 2011, 38, 55–78. [Google Scholar] [CrossRef]
  6. Wolford, W.; Borras, S.M.; Hall, R.; Scoones, I.; White, B. Governing global land deals: The role of the state in the rush for land. Dev. Chang. 2013, 44, 189–210. [Google Scholar] [CrossRef] [Green Version]
  7. Alexandratos, N.; Bruinsma, J. World Agriculture towards 2030/2050; The 2012 Revision; FAO: Rome, Italy, 2012. [Google Scholar]
  8. Food and Agriculture Organization of the United Nations (FAO). Sustainability Assessment of Food and Agriculture Systems (SAFA); FAO: Rome, Italy, 2014. Available online: http://www.Fao.Org/nr/sustainability/sustainability-assessments-safa/en/ (accessed on 30 December 2015).
  9. Foley, J.A.; Ramankutty, N.; Brauman, K.A.; Cassidy, E.S.; Gerber, J.S.; Johnston, M.; Mueller, N.D.; O’Connell, C.; Ray, D.K.; West, P.C.; et al. Solutions for a cultivated planet. Nature 2011, 478, 337–342. [Google Scholar] [CrossRef]
  10. Horlings, L.; Marsden, T.K. Towards the real green revolution? Exploring the conceptual dimensions of a new ecological modernisation of agriculture that could ‘feed the world’. Glob. Environ. Chang. 2011, 21, 441–452. [Google Scholar] [CrossRef]
  11. Chhatre, A.; Agrawal, A. Trade-offs and synergies between carbon storage and livelihood benefits from forest commons. Proc. Natl. Acad. Sci. USA 2009, 106, 17667–17670. [Google Scholar] [CrossRef] [PubMed]
  12. Meier, M.S.; Stoessel, F.; Jungbluth, N.; Juraske, R.; Schader, C.; Stolze, M. Environmental impacts of organic and conventional agricultural products–are the differences captured by life cycle assessment? J. Environ. Manag. 2015, 149, 193–208. [Google Scholar] [CrossRef] [PubMed]
  13. Bockstaller, C.; Gaillard, G.; Baumgartner, D.; Freiermuth-Knuchel, R.; Reinsch, M.; Brauner, R.; Unterseher, E. Abschlussbericht zum Projekt 04—“Comete” 2002–2005: Betriebliches Umweltmanagement in der Landwirtschaft: Vergleich der Methoden; INDIGO, KUL/USL, REPRO, SALCA; Grenzüberschreitendes Institut zur Rentablen Umweltgerechten Landbewirtschaftung (ITADA): Colmar, France, 2006. [Google Scholar]
  14. Binder, C.R.; Feola, G.; Steinberger, J.K. Considering the normative, systemic and procedural dimensions in indicator-based sustainability assessments in agriculture. Environ. Impact Assess. Rev. 2010, 30, 71–81. [Google Scholar] [CrossRef]
  15. Schader, C.; Grenz, J.; Meier, M.; Stolze, M. Scope and precision of sustainability assessment approaches to food systems. Ecol. Soc. 2014. [Google Scholar] [CrossRef]
  16. Macfadyen, S.; Tylianakis, J.M.; Letourneau, D.K.; Benton, T.G.; Tittonell, P.; Perring, M.P.; Gómez-Creutzberg, C.; Báldi, A.; Holland, J.M.; Broadhurst, L. The role of food retailers in improving resilience in global food supply. Glob. Food Secur. 2015, 7, 1–8. [Google Scholar] [CrossRef] [Green Version]
  17. Schader, C.; Lampkin, N.; Muller, A.; Stolze, M. The role of multi-target policy instruments in agri-environmental policy mixes. J. Environ. Manag. 2014, 145, 180–190. [Google Scholar] [CrossRef] [PubMed]
  18. Organisation for Economic Co-operation and Development (OECD). Policy Design Characteristics for Effective Targeting; OECD: Paris, France, 2007. [Google Scholar]
  19. Bernués, A.; Ruiz, R.; Olaizola, A.; Villalba, D.; Casasús, I. Sustainability of pasture-based livestock farming systems in the European Mediterranean context: Synergies and trade-offs. Livest. Sci. 2011, 139, 44–57. [Google Scholar] [CrossRef]
  20. Kirchner, M.; Schmidt, J.; Kindermann, G.; Kulmer, V.; Mitter, H.; Prettenthaler, F.; Rüdisser, J.; Schauppenlehner, T.; Schönhart, M.; Strauss, F. Ecosystem services and economic development in Austrian agricultural landscapes—The impact of policy and climate change scenarios on trade-offs and synergies. Ecol. Econ. 2015, 109, 161–174. [Google Scholar] [CrossRef]
  21. Groot, J.C.; Rossing, W.A.; Jellema, A.; Stobbelaar, D.J.; Renting, H.; van Ittersum, M.K. Exploring multi-scale trade-offs between nature conservation, agricultural profits and landscape quality—A methodology to support discussions on land-use perspectives. Agric. Ecosyst. Environ. 2007, 120, 58–69. [Google Scholar] [CrossRef]
  22. Groot, J.C.; Jellema, A.; Rossing, W.A. Designing a hedgerow network in a multifunctional agricultural landscape: Balancing trade-offs among ecological quality, landscape character and implementation costs. Eur. J. Agron. 2010, 32, 112–119. [Google Scholar] [CrossRef]
  23. Valin, H.; Havlík, P.; Mosnier, A.; Herrero, M.; Schmid, E.; Obersteiner, M. Agricultural productivity and greenhouse gas emissions: Trade-offs or synergies between mitigation and food security? Environ. Res. Lett. 2013, 8, 035019. [Google Scholar] [CrossRef]
  24. Maes, J.; Paracchini, M.; Zulian, G.; Dunbar, M.; Alkemade, R. Synergies and trade-offs between ecosystem service supply, biodiversity, and habitat conservation status in Europe. Biol. Conserv. 2012, 155, 1–12. [Google Scholar] [CrossRef]
  25. Dodgson, J.; Spackman, M.; Pearman, A.; Phillips, L. Dtlr Multi-Criteria Analysis Manual; National Economic Research Associates (NERA): London, UK, 2001. [Google Scholar]
  26. Zadeh, L.A. Toward a theory of fuzzy information granulation and its centrality in human reasoning and fuzzy logic. Fuzzy Sets Syst. 1997, 90, 111–127. [Google Scholar] [CrossRef]
  27. European Commission. Council regulation (ec) no 834/2007 of 28 june 2007 on organic production and labelling of organic products and repealing regulation (eec) no 2092/91; 2007
  28. Patton, M.Q. Qualitative Research; Wiley: Hoboken, NJ, USA, 2005. [Google Scholar]
  29. Hemme, T.; Isermeyer, F.; Deblitz, C. Tipi-Cal Version 1.0: Ein Modell zur Politik-und Technikfolgenabschätzung für Typische Betriebe im Internationalen Vergleich; Institut für Betriebswirtschaft, FAL: Braunschweig, Germany, 1997. [Google Scholar]
  30. Schader, C.; Drapela, T.; Markut, T.; Meier, M.; Lindenthal, T.; Hörtenhuber, S.; Pfiffner, L. Farm- and product-level biodiversity assessment of conventional and organic dairy production in austria. Int. J. Biodivers. Sci. Ecosyst. Serv. Manag. 2014, 10, 20–39. [Google Scholar] [CrossRef]
  31. International Organization for Standardization (ISO). Environmental Management—Life Cycle Assessment—Principles and Framework; ISO: Geneva, Switzerland, 2006. [Google Scholar]
  32. International Organization for Standardization (ISO). Environmental Management—Life Cycle Assessment—Requirements and Guidelines; ISO: Geneva, Switzerland, 2006. [Google Scholar]
  33. Padel, S.; Gerrard, C.L.; Smith, L.; Schader, C.; Baumgart, L.; Stolze, M.; Pearce, B. Further Development of Methodologies for Sustainability Assessment and Monitoring in Organic/ecological Agriculture; Organic Research Centre (ORC), Research Institute of Organic Agriculture (FiBL): Berkshire, UK; Frick, Switzerland, 2015. [Google Scholar]
  34. Kremen, C.; Miles, A. Ecosystem services in biologically diversified versus conventional farming systems: Benefits, externalities, and trade-offs. Ecol. Soc. 2012, 17. Article 40. [Google Scholar] [CrossRef]
  35. Grenz, J.; Thalmann, C.; Stämpfli, A.; Studer, C.; Häni, F. Rise, a method for assessing the sustainability of agricultural production at farm level. Available online: https://www.hafl.bfh.ch/fileadmin/docs/Forschung_Dienstleistungen/Agrarwissenschaften/Nachhaltigkeitsbeurteilung/RISE/Publikationen/E_RDN_1_2009.pdf (accessed on 14 March 2016).
  36. Gerrard, C.L.; Smith, L.; Padel, S.; Pearce, B.; Hitchings, R.; Cooper, N. Ocis Public Goods Tool Development; The Organic Research Centre, Elm Farm: Newbury, UK, 2011. [Google Scholar]
  37. Jenny, M.; Zellweger-Fischer, J.; Balmer, O.; Birrer, S.; Pfiffner, L. The credit point system: An innovative approach to enhance biodiversity on farmland. Asp. Appl. Biol. 2013, 118, 23–30. [Google Scholar]
  38. Schader, C.; Jud, K.; Meier, M.S.; Kuhn, T.; Oehen, B.; Gattinger, A. Quantification of the effectiveness of greenhouse gas mitigation measures in swiss organic milk production using a life cycle assessment approach. J. Clean. Prod. 2014, 73, 227–235. [Google Scholar] [CrossRef]
  39. Hillier, J. Cool Farm Tool; University of Aberdeen: Aberdeen, UK, 2012. [Google Scholar]
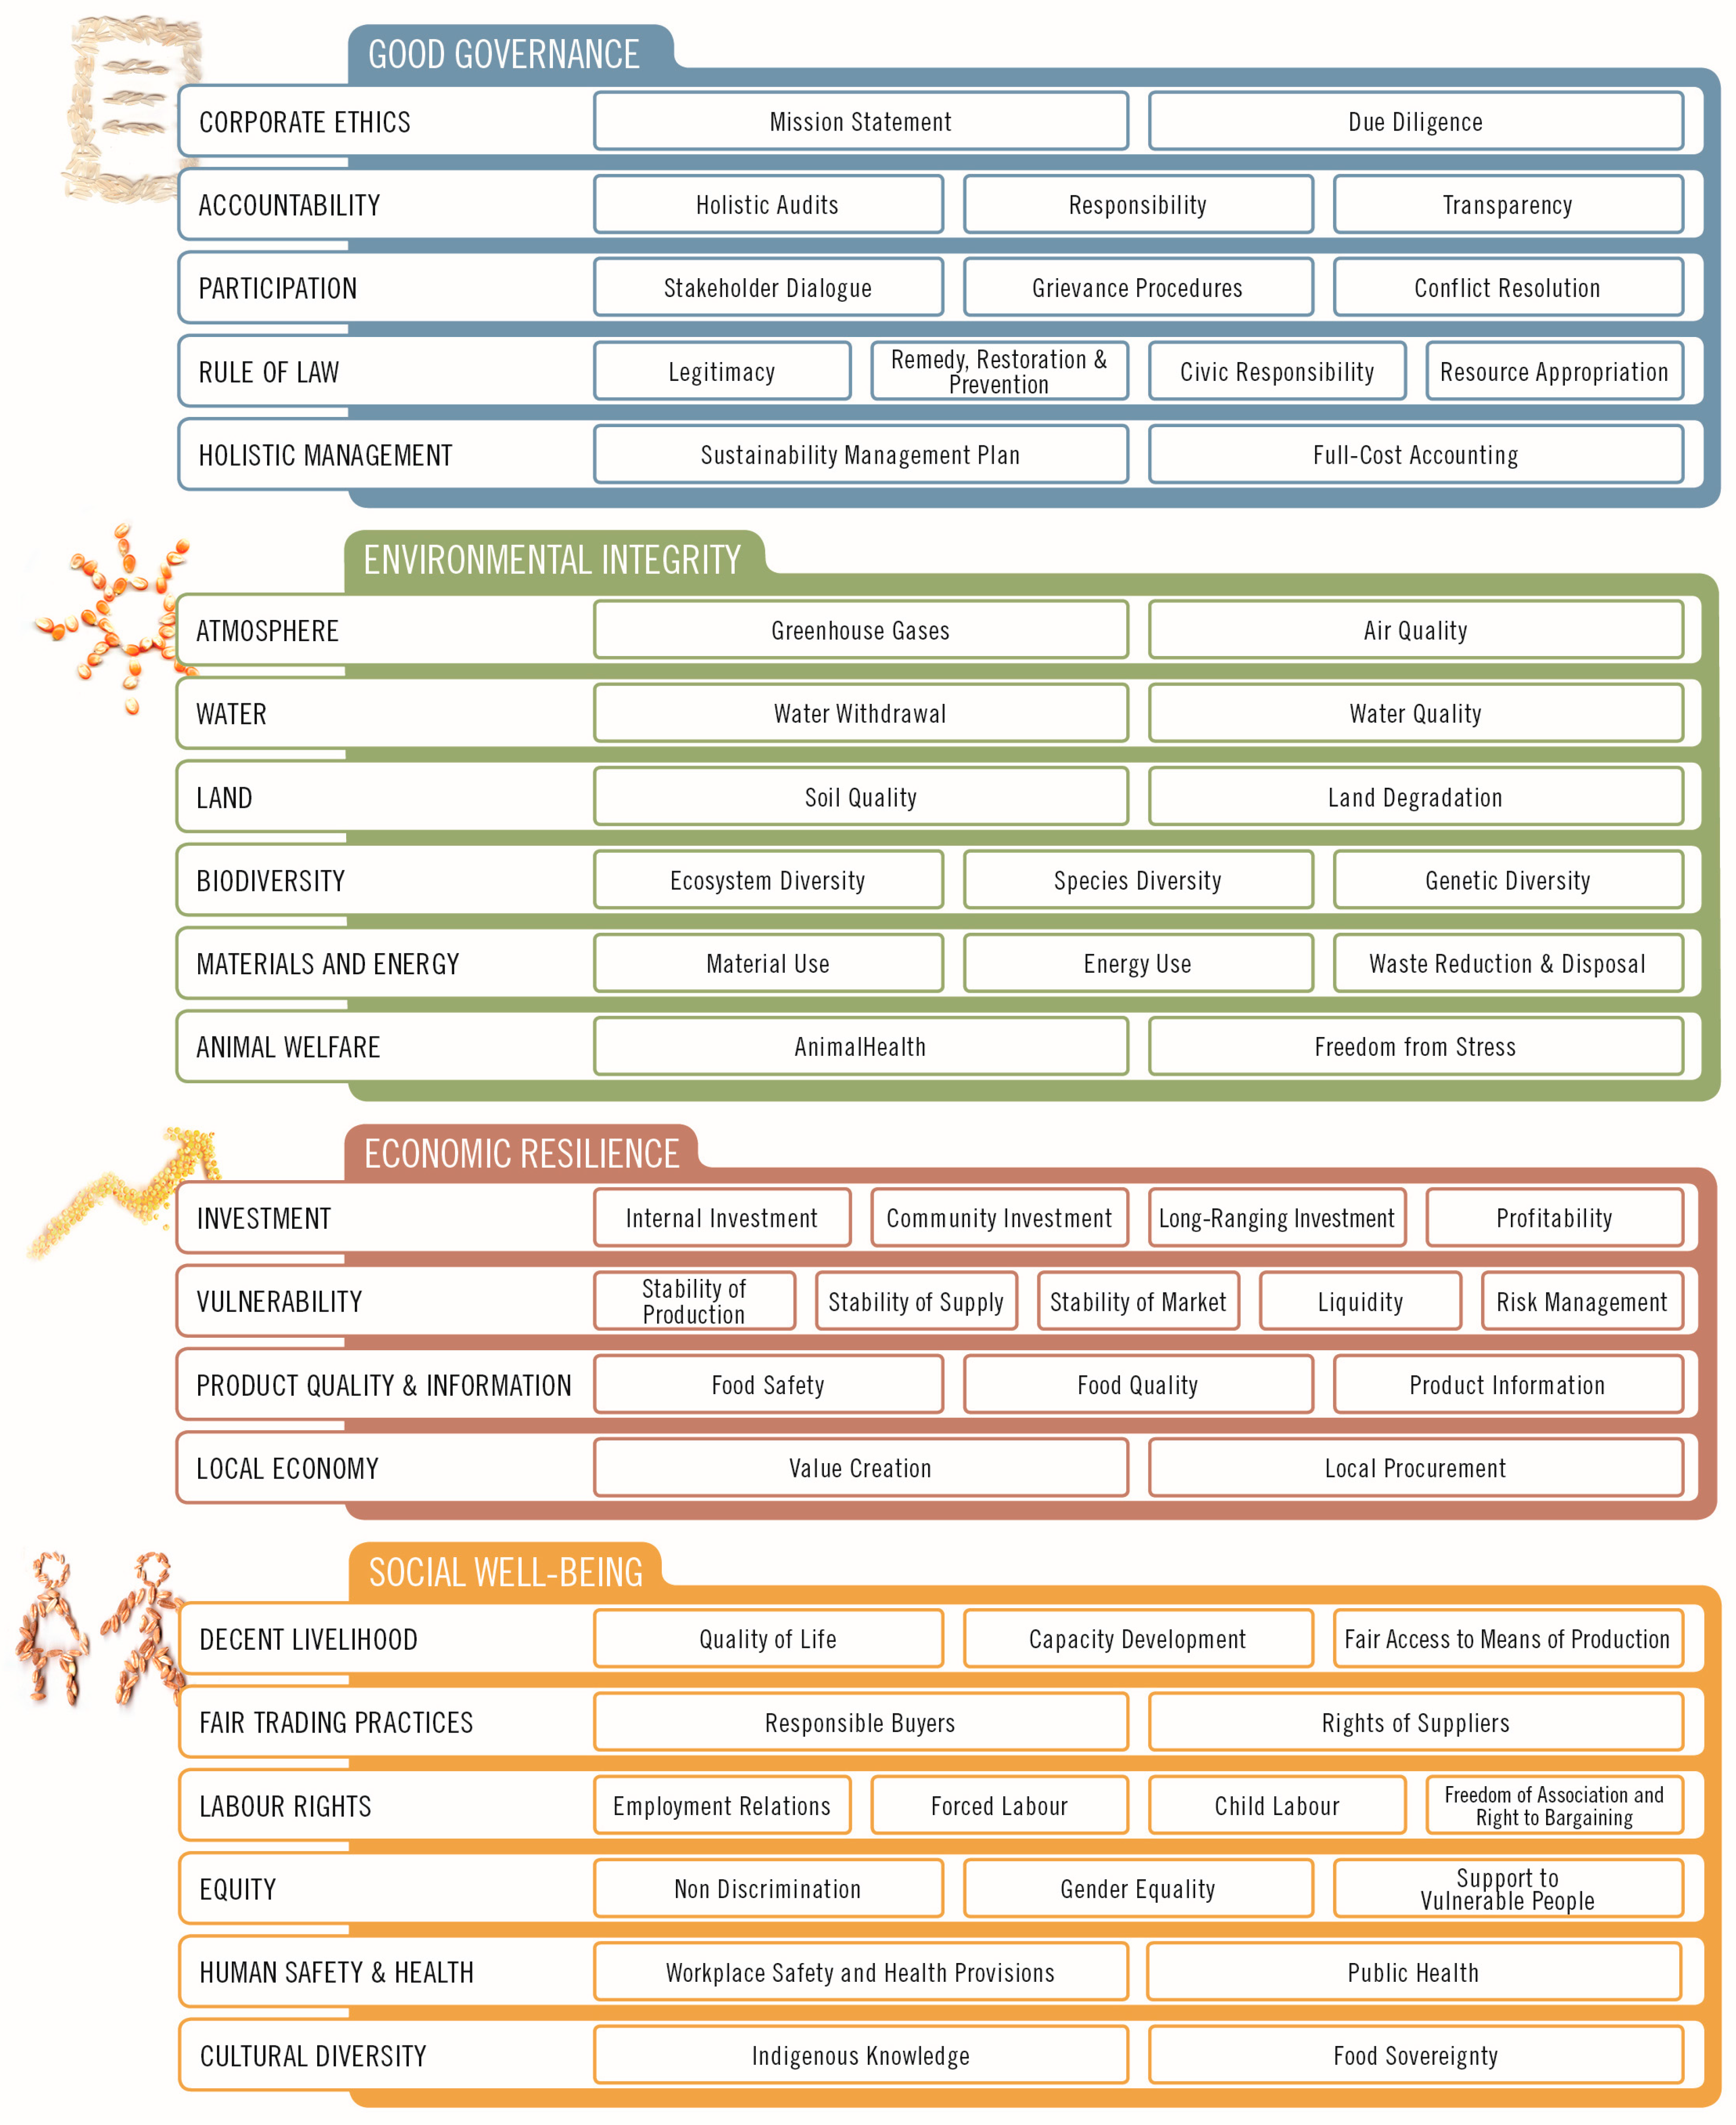
Figure 1. Overview of Sustainability Assessment of Food and Agriculture Systems (SAFA) dimensions, themes and sub-themes. Source: Food and Agriculture Organization of the United Nations (FAO) 2014.
Sustainability 08 00274 g001
Figure 2. Number of indicators in SMART addressing a certain number of SAFA sub-themes.
Sustainability 08 00274 g002
Figure 3. Number of indicators in SMART linked to the SAFA sub-themes.
Sustainability 08 00274 g003
Figure 4. Performance of the selected farms with respect to the sustainability themes in the governance dimension.
Sustainability 08 00274 g004
Figure 5. Performance of the selected farms with respect to the sustainability themes in the environmental dimension.
Sustainability 08 00274 g005
Figure 6. Performance of the selected farms with respect to the sustainability themes in the economic dimension.
Sustainability 08 00274 g006
Figure 7. Performance of the selected farms with respect to the sustainability themes in the social dimension.
Sustainability 08 00274 g007
Figure 8. (A) Overview of synergies between sustainability dimensions. Green color indicates strong, yellow medium and red color weak synergies; (B) Overview of trade-offs between sustainability dimensions. Green color indicates absence of trade-offs, yellow medium trade-offs and red color strong trade-offs.
Sustainability 08 00274 g008
Table 1. Scale for impact factors (IMni) of indicator i with respect to sub-theme n.
ScaleDescription: This indicator has…
+3…a strong positive impact on the degree of goal achievement of the subtheme
+2…a medium positive impact on the degree of goal achievement of the subtheme
+1…a slight positive impact on the degree of goal achievement of the subtheme
0…neither a positive nor a negative impact on the degree of goal achievement of the subtheme or is ambiguous
−1…a slight negative impact on the degree of goal achievement of the subtheme
−2…a medium negative impact on the degree of goal achievement of the subtheme
−3…a strong negative impact on the degree of goal achievement of the subtheme
Table 2. Examples of scales for assessing performances of different indicator types.
Type of scaleIndicator Example
Yes/NoIs overtime compensated at this farm (in terms of time off or overtime pay)? (Indicator 437)
NumberHow many active substances of pesticides are used per year? (Indicator 377.1)
PercentageWhat proportion of the electricity consumed is derived from renewable resources? (Indicator 185)
Rating Scale 1–5How many days of further education or training (per person) were taken during the last year (including farm manager and employees)? Further training: External person on the farm or participation in external, thematic events (excluding trade shows). Total number of days spent for further training during last year on average per person “1 ≤ 0.5 days per year/person 2 = 0.5–1 day per year/person, 3 = 1 day per year/person, 4 = 2 days per year/person, 5 ≥ 2 days per year/person” (Indicator 72)
Table 3. Overview of the selected farms.
CountryFarm SizeFarming SystemCropsLivestock
Switzerland11.7OrganicVegetables (greenhouse), grasslandno
Switzerland52.1ConventionalGrassland, pasture, maizeCattle
Austria27.7OrganicBarley, wheat, rye, spelt, triticale, peas/oat, grassland, potatoesCattle, chicken
Austria160.0OrganicMaize, tuberous vetchling, triticale, wheat, vetchCattle
Germany172.7ConventionalRapeseed, wheat, barley, maize, clover grassCattle
Germany46.0OrganicGrassland, orchardsCattle
Kenya2.4ConventionalBananas, avocados, mangos, french beans, spinach, tomatoes, kale, custard apple, pastureChicken, sheep, goats, cattle
Kenya0.7ConventionalTea, tree tomatoes, cabbage, carrots, chamomile, arabicum flowers, maize, napier grass, eucalyptusChicken, goats
Ghana2.4ConventionalMaize, water melon, sweet potatoes, soybeans, rice, onion, millet, spinachChicken, Guinee fowls, sheep, goats
Ghana4.6ConventionalCocoa, plantain, pepper, cassava, maize, fallow, grasslandChicken, sheep, goats
Costa Rica275.7ConventionalBananasno