1. Introduction
Sustainable wastewater management requires effective and efficient treatment systems. Optimal treatment technologies are able to ensure high quality effluent as well as low environmental impacts.
In the light of the sustainability paradigm, the application of Life Cycle Assessment (LCA) is particularly useful because it allows comparing the environmental performance of different treatment systems throughout their entire life cycle [
1].
In the current literature, there are several scientific contributions on the application of LCA to the wastewater sector. They are focused on many different features.
One aspect concerns the environmental performance assessment of decentralized wastewater treatment systems. In most countries, there are many sparsely populated areas, where it is not convenient to realize a unique centralized wastewater treatment plant due to the difficulties in terms of sewerage connections [
2].
Furthermore, in many cases, the construction of sewer infrastructures could generate significant environmental impacts, which could considerably contribute to total environmental loads of centralized wastewater treatment plants [
3,
4]. For this reason, it is important to compare WWTPs decentralized alternatives with LCA studies.
There are few studies dealing with the application of LCA to small treatment systems (˂200 PE). The majority of studies are based on a comparative LCA between extensive treatment system (such as constructed wetlands) and decentralized conventional intensive systems [
5,
6,
7,
8,
9,
10].
These studies suggest that natural treatments cause minor environmental impacts for all impact categories, considering the whole life cycle when compared to conventional activated sludge systems. The main limitation for the application of extensive treatment systems is the need of large areas to assure an efficient treatment. Therefore, this technology can be a valuable treatment option in areas where there is an adequate areal availability for implementation [
5,
6,
7,
8,
9,
10].
In other studies, LCA was utilized to compare the environmental performances of conventional and source separating systems where there is an upstream separation of wastewater flows after, after which they are conveyed to different treatment alternatives [
11,
12,
13,
14,
15,
16,
17].
On the one hand, some studies conclude that the separative systems have environmental advantages when compared with conventional systems by improving opportunities for nutrient recycling and avoiding their direct release into the aquatic environment [
12,
13,
15,
17]. On the other hand, Thibodeau
et al. point out that the best environmental choice is the conventional treatment system and that separative system technical improvements are needed in order to achieve better environmental performance [
16]. Finally, other studies show that the better environmental choice could vary depending on the system scale and local site-specific conditions [
2,
11].
To the best of our knowledge, in LCA application to small treatment systems, there are no studies comparing different decentralized intensive treatment systems with a capacity of less than hundred PE.
One of the key factors of the application of LCA to the wastewater sector concerns the choice to include or not all the stages of the life cycle of treatment systems (construction, use and disposal) within the system boundaries.
Some authors do not consider the construction and disposal phases. They assume that the contributions of these phases in terms of impacts are negligible if compared with the operational phase, especially in the light of a relatively long lifetime. However, this assumption is not always valid since it is possible to show that, for some treatment technologies, the contributions to the impacts of the construction phase are very significant, sometimes even higher than those of the operational phase. Some examples are constructed wetland systems, sand filtration processes, conventional treatments with the addition of microfiltration and ozonation processes [
18,
19].
The incidence of the construction phase on the total of impacts also depends on the scale of the treatment plants, usually expressed in terms of the maximum number of population equivalent (PE) that the system is able to treat. In this regard, the study of Lundin and Morrison [
13] shows that the environmental burdens of the construction phase of wastewater treatment systems are much lower for large-scale systems than small-scale systems. These scale economies are also applicable to the operational phase [
13].
Analogously, Doka [
20] points out that the smaller the wastewater treatment plant (WWTP) is, the more the environmental impacts per inhabitant in terms of construction, operation and management activities increase. In addition, sewerage system utilization becomes less efficient [
20].
Lorenzo-Toja
et al. [
21] obtained similar conclusions. The authors report that the size is the factor that influences the efficiency of WWTPs the most. In fact, in terms of per capita contribution, smaller WWTPs generate higher impacts [
21].
Finally, it results that it is not always correct to neglect the phases of construction and disposal when compared to the phase of use, because this strongly depends on the specific case.
The main aim of this study is to perform a comparative LCA of two on-site small-scale activated sludge total oxidation systems in plastic and vibrated reinforced concrete in order to evaluate the incidence of construction, disposal and operation on the total impacts evaluated with three different methods.
2. Material and Methods
2.1. Goal and Scope Definition
The main goal of the LCA study was to compare the environmental performance of the life cycle of two on-site small-scale activated sludge total oxidation systems in linear low-density polyethylene (LLDPE) and vibrated reinforced concrete (VRC). Both systems were sized to treat the wastewater of 5, 10, 20, and 30 equivalent inhabitants (PE, population equivalent). They were able to produce effluents complying with the emission limits for urban wastewater discharging into surface water bodies provided by the Italian law [
22] in accordance with the EU Water Framework Directive [
23].
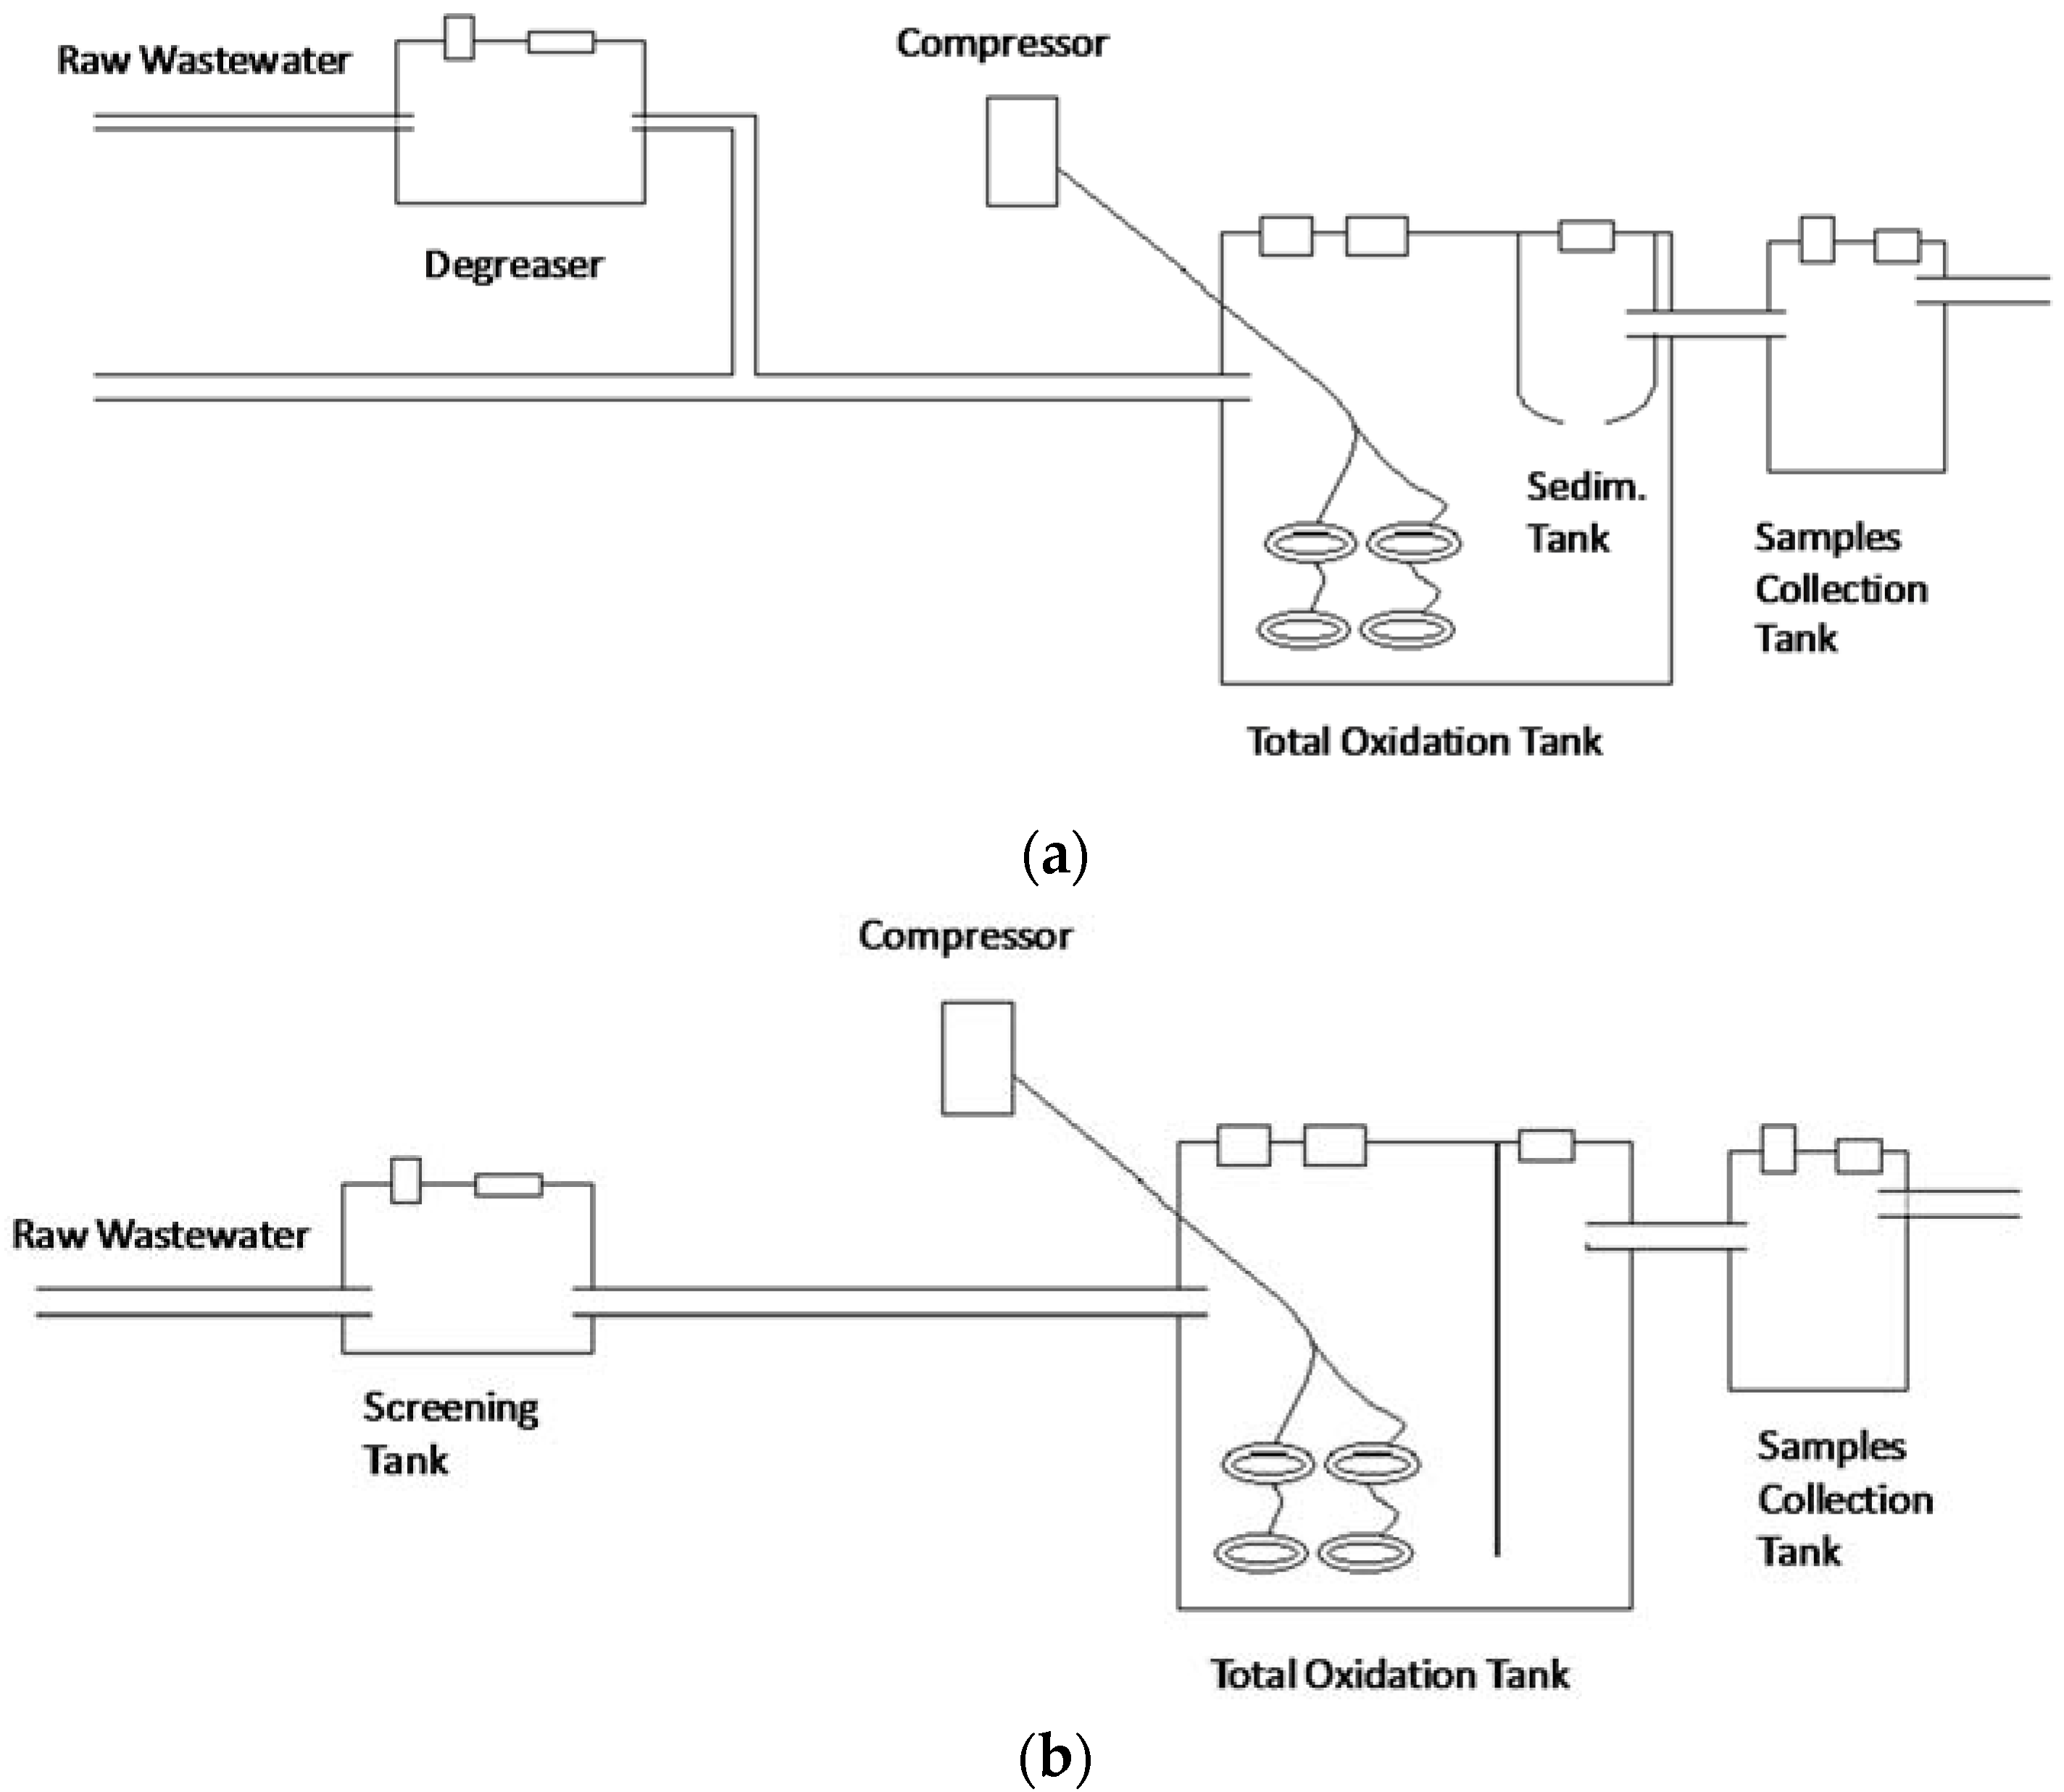
The following units were part of the LLDPE total oxidation treatment line (see
Figure 1a):
The following units were part of the VRC total oxidation treatment line (see
Figure 1b):
The functional unit of the study was “the treatment of wastewater corresponding to 5, 10, 20 and 30 equivalent inhabitants per year considering a time horizon of 20 years”.
The system boundaries included the following phases of the life cycle treatments: construction, use and disposal.
The construction phase considered the environmental loads related to the use of raw materials for the realization of all the components of the systems, the production processes of such components and all the accessory materials required for operating the plant. Moreover, the environmental loads of excavation and backfilling were also considered.
The operational phase considered the environmental burdens related to energy consumption for the systems operation, disposal of sludge produced in the total oxidation tanks and, finally, required management and maintenance activities.
The disposal stage considered the environmental loads of disposal processes relating to each component of the treatment lines. A landfill scenario for the disposal of the materials of each treatment unit was assumed, while the produced sludge was sent to a large wastewater treatment plant.
During all stages of the life cycle of the systems, the environmental loads related to all the needed transports were considered.
2.2. Life Cycle Inventory (LCI)
The software tool SimaPro 7.0 (PRè Consultans, Amersfoort, The Netherlands) made it possible to realize the treatment systems models.
Technical catalogues of companies producing treatment systems for municipal wastewater were the source for foreground inventory data, both for the construction phase of all the system components as well as the excavation and backfilling techniques.
Two companies (Caccia Engineering S.P.A., Samarate Italy; Polivinil Rotomachinery S.P.A., Cerano, Italy) dealing with the construction of rotational molding machines provided the process data about the rotomolding process for the LLDPE components production. The data on the thickness of the tanks and the geometrical dimensions of the several complementary components of the treatment units are the result of calculations made on the basis of the manufacturers technical drawings.
With regard to the inventory concerning the use phase of the treatment systems, the manufacturer technical manuals were the source of the main data of all the operations related to the management and maintenance of the plants. Additional data required for the modeling (e.g., sludge production and electricity consumption) are the result of assumptions made after interviews with technicians, builders and operators of small wastewater treatment plants operating in the Campania region of Southern Italy. All of these assumptions are reported in
Table 1 and
Table 2 for both the treatment lines.
Combining the disposal processes available from the SimaPro databases allowed modeling the disposal phase of the treatment systems by means of disposal scenarios constructed for each component of the plant.
Ecoinvent 2 system processes was the source of background data, such as data relating to the Italian energy mix, production of raw materials, soil excavation and backfilling, wastewater treatment plant for sludge disposal and vehicles.
Table 1,
Table 2 and
Table 3 show the main inventory data used to model the treatment systems.
Table 4 reports the Ecoinvent 2 system processes used for modeling the main study items.
The Campus of the University of Salerno, in the Campania region of Southern Italy, was the hypothetical location of the treatment systems. The following are the distances considered for the transport phase: 500 km for the production site of the system materials and components (the distance takes into account where the manufacturer headquarters is effectively located related to the technical catalogue taken into consideration), 20 km for the sludge disposal, 10 km for the service center, and 50 km for the disposal site.
2.3. Life Cycle Impact Assessment
The environmental impacts of two treatment systems were evaluated with three different methods: ReCiPe 2008 (H/H), Ecological Footprint and IPCC 2007 GWP 100 years.
ReCiPe and Ecological Footprint are multi-parametric methods; thus, they provide an integrated vision that takes into account many environmental aspects in the calculation of the impacts. ReCiPe combines a midpoint level approach (problem-oriented) with an endpoint approach (damage-oriented) considering 18 midpoint impact categories grouped into three endpoint categories: damage to human health, damage to ecosystems and resource consumption [
25]. The Ecological footprint method calculates the amount of biologically productive land and water required by a population to produce the resources it consumes and to dispose of the waste generated by the consumption of fossil and nuclear fuel [
24]. The IPCC 2007 GWP 100 years indicator is based on the factors of climate change over a period of 100 years considering the gaseous emissions of a potential greenhouse effect [
26].
The results obtained with the use of three impact assessment methods allowed comparing the environmental performance of the two considered systems as a function of different treatment capacities in terms of the number of PE as well as for both the total life cycle and each single phase.
3. Results
3.1. Result of Study
The results of the potential environmental impacts of the two treatment lines are shown in
Table 5 in terms of ReCiPe 2008 (H/H), in
Table 6 in terms Ecological Footprint, and, finally, in
Table 7 in terms of 2007 IPCC 100 years. The three tables show the values of the impacts both for the entire life cycle as well as for each phase of the life cycle of the two wastewater treatment systems as a function of the treatment capacity in terms of number of PE. The results are shown both in absolute value and in terms of percentage contribution that each phase provides to the total impact of the entire life cycle.
Table 8 presents the per capita impacts obtained by dividing the absolute values of
Table 5,
Table 6 and
Table 7 by the corresponding number of PE.
The obtained results confirm the obvious expected result that the greater the treatment capacity (in terms of PE), the greater the environmental impacts on both the total life cycle as well as each single phase (
Table 5,
Table 6 and
Table 7). On the other hand, there is a beneficial scale factor in terms of per capita impacts. In fact, the greater the treatment capacity, the lower the per capita impacts are (
Table 8). The VRC for 10 PE was the unique exception to the previous stated general rule, because the technical catalogue used for the designing of the treatment system suggested the same dimensions for both 5 and 10 PE.
Use is the most significant phase of the life cycle for both treatment systems (independently by their size) as well as the three impact assessment methods. For the LLDPE treatment system, the use percentage incidence was 89.8% in terms of ReCiPe, 93.6% in terms of Ecological Footprint and 93.7% in terms of IPCC 2007, while, for the VRC treatment system, the use percentage incidence was 83.8% in terms of ReCiPe, 85.3% in terms of Ecological Footprint and 86.4% in terms of IPCC 2007.
Construction is the second most significant phase of the life cycle for both treatment systems (independently by their size) as well as the three impact assessment methods. For the LLDPE treatment system, the construction percentage incidence was 10.0% in terms of ReCiPe, 6.3% in terms of Ecological Footprint and 6.0% in terms of IPCC 2007, while, for the VRC treatment system, the use percentage incidence was 16.1% in terms of ReCiPe, 14.6% in terms of Ecological Footprint and 13.5% in terms of IPCC 2007.
The disposal phase, compared with the incidence of use and construction phases, was negligible for both treatment systems (independently by their size) as well as the three impact assessment methods. Overall, it averaged around 0.15%.
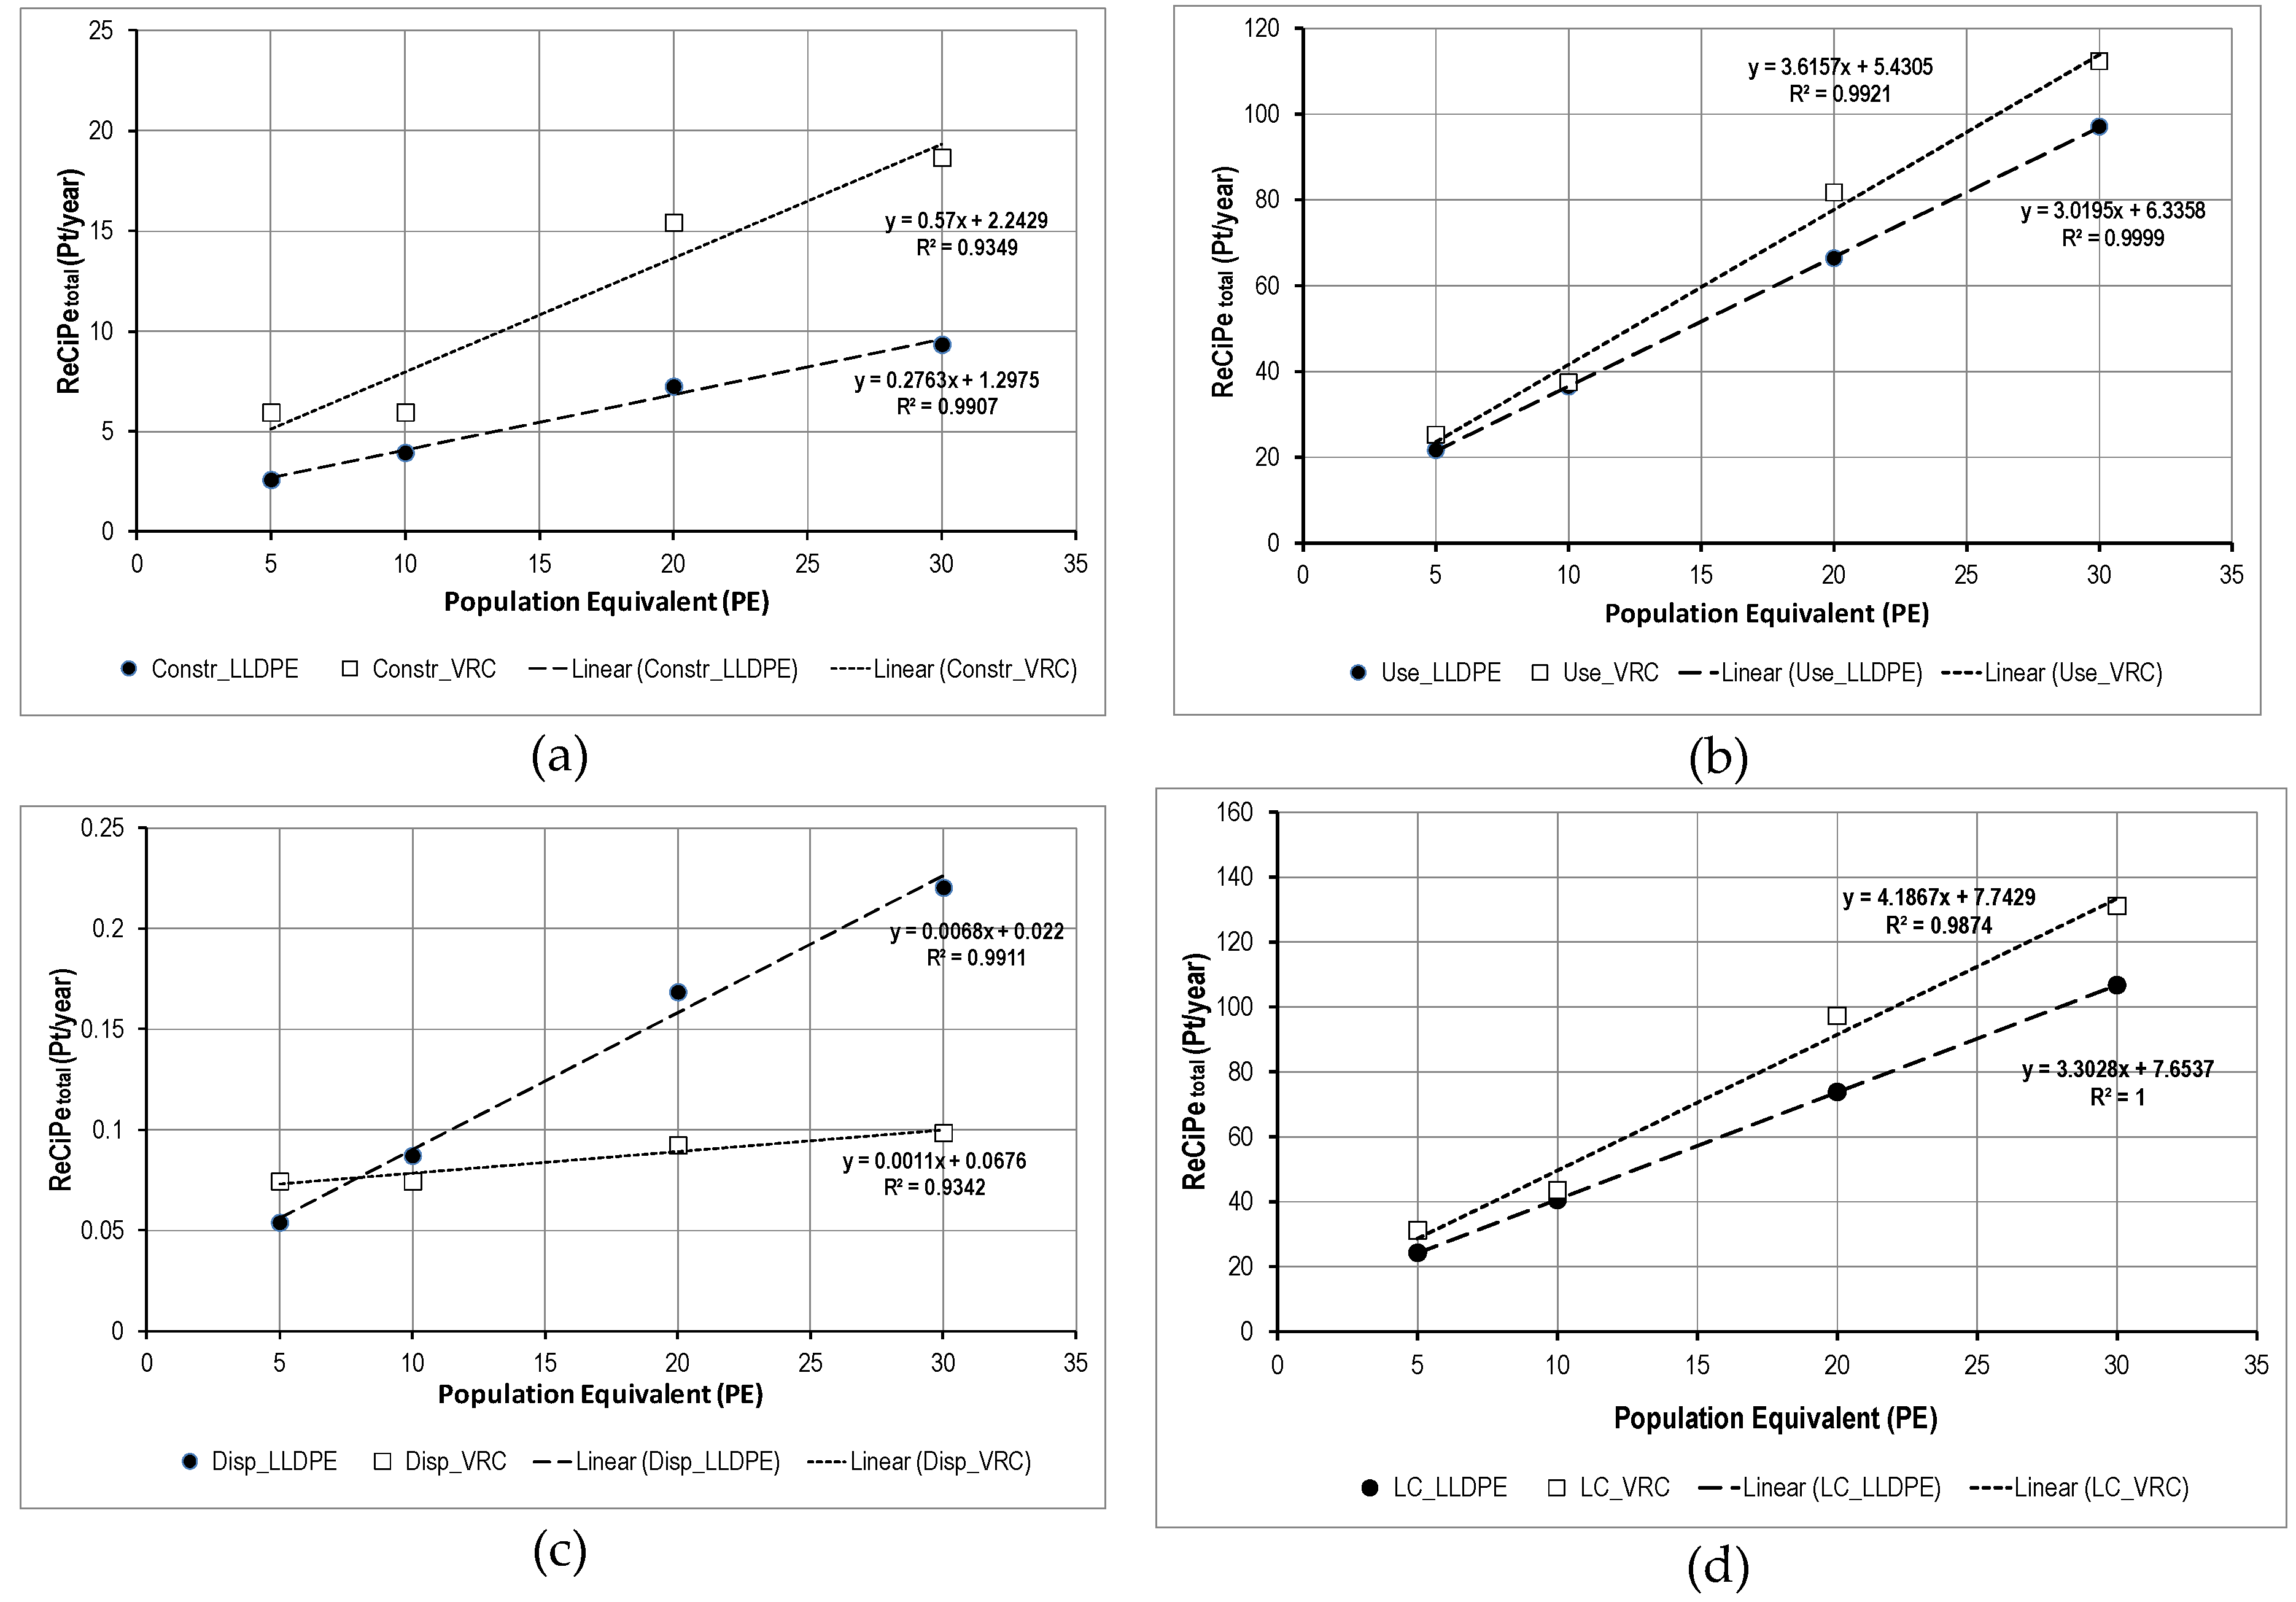
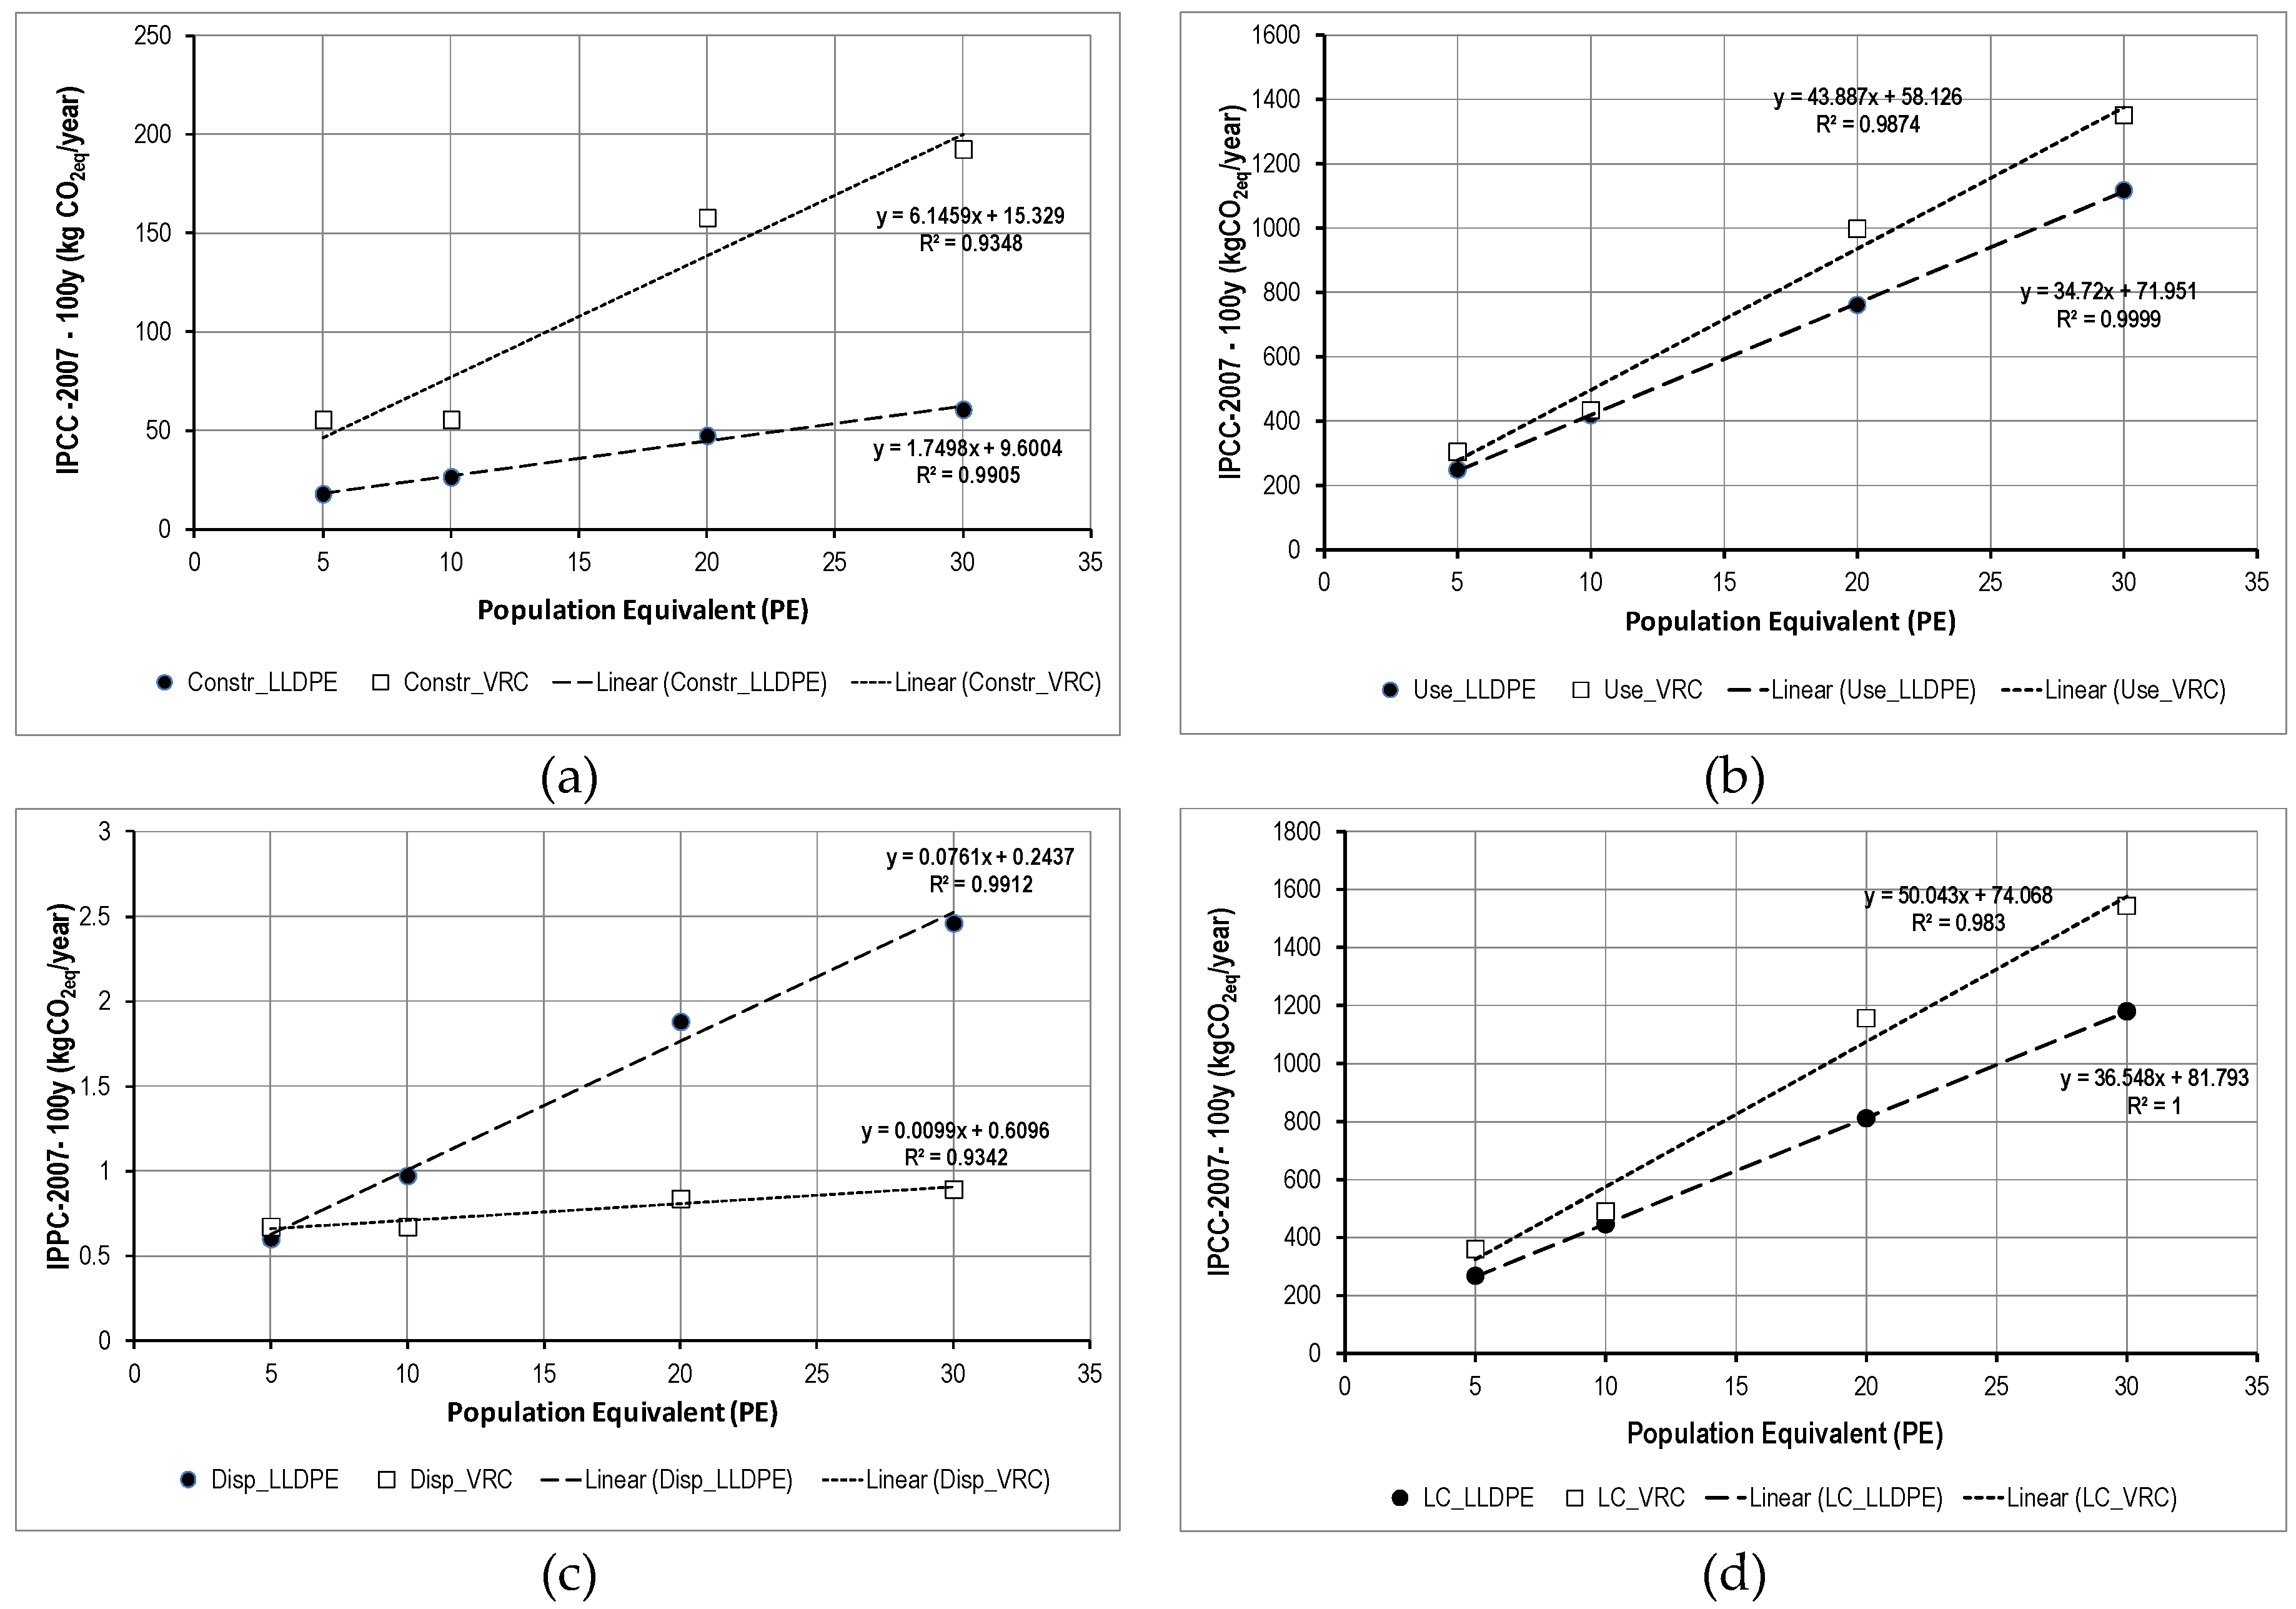
Figure 2,
Figure 3 and
Figure 4 show the correlation between impacts and PE for LLDPE and VRC systems in terms of construction, use, disposal and total life cycle, respectively, for ReCiPe, Ecological Footprint and IPCC 2007. The correlation lines of VRC are always above those of LLDE, with two exceptions: disposal in terms of ReCiPe (
Figure 2c) and disposal in terms of IPCC (
Figure 4c).
3.2. Alternative Scenarios
On the basis of the obtained results, it is clear that use is the most impactful phase of the whole life cycle, in both treatment plants. The parameters of the operational phase that contribute the most to these results are consumption of electric power for the total oxidation tank as well as sludge production and disposal.
Besides the two main parameters identified for the use phase, there was a parameter relative to the construction phase, which presented a not negligible source of uncertainty: the methane gas consumption during the rotational molding process for the production of LLDPE plant components. For each of the three sensitive parameters, a variation interval around the central value used in the study was chosen, and the lower bound and the upper bound of that range was selected.
The variation interval for energy consumption and sludge production have been provided by experts in the field (technicians and operators) operating in the Campania region of Southern Italy (
Table 9). The variation interval for gas consumption during the rotational molding process has been defined according to data provided by companies dealing with the construction of rotational molding machines (Caccia Engineering S.P.A., Samarate, Italy; Polivinil Rotomachinery S.P.A., Cerano, Italy) (
Table 9).The three parameters were combined in order to obtain two different scenarios to compare with the main study scenario (
Table 9): a Best scenario (with the lower bound values), a Worst scenario (with the upper bound values), and a Medium scenario corresponding to the model used for the study (with the mean values).
The three scenarios have been compared in order to determine if the variation of the sensitive parameters might significantly influence the results in terms of percentage contribution of each phase to the total impacts for all the considered impact assessment methods.
Table 10,
Table 11 and
Table 12 present the potential environmental impacts as well as the percentage contribution of each phase to the total impacts of the Worst scenario for the two treatment systems calculated with ReCiPe 2008, Ecological Footprint and IPPCC 2007.
Table 13,
Table 14 and
Table 15 present the potential environmental impacts as well as the percentage contribution of each phase to the total impacts of the Best scenario for the two treatment systems calculated with ReCiPe 2008, Ecological Footprint and IPCC 2007.
3.3. Sensitivity Analysis
A sensitivity analysis was conducted by changing one parameter at a time to see what effect this produces on the total environmental impact in terms of percentage increasing. One variable was increased by 33% while keeping the other two at their baseline values (the value of the Medium scenario). After that, the increased variable was returned to its baseline value while the procedure was repeated for the other two variables.
Table 16 shows the values adopted in order to conduct the sensitivity analysis. This was only conducted for 20 PE because similar results were achieved for the other cases considered.
Table 17 and
Table 18 show the percentage increase of environmental impact of the three Cases developed with the sensitivity analysis (see
Table 15) for 20 PE, and for LLDPE and VRC systems, respectively. Note that there are only Case 2 and Case 3 for VRC treatment line because the sensitive parameter related to gas consumption in rotomolding process affects only LLDPE treatment line.
4. Discussion
The VRC system was always more impactful than the LLDPE system (
Figure 2,
Figure 3 and
Figure 4) for all the treatment capacities (5, 10, 20 and 30 PE) and impact assessment methods (ReCiPe 2008, Ecological Footprint and IPCC 2007 100 years) considered in the Medium scenario. Furthermore, the environmental impacts of the system in concrete were higher than that in LLDPE for all the phases of the life cycle.
On the one hand, the greater the treatment capacity (in terms of PE), the greater the environmental impacts were, for each phase of the life cycle (
Table 5,
Table 6 and
Table 7). On the other hand, there was a beneficial scale factor. In fact, the per capita values of impacts decreased with increasing plant sizes, and this trend was valid for both the treatment systems as well as each single phase of their life cycle (
Table 6). For the VRC plant, there were two exceptions to this trend for the cases of construction and use phases of 10 PE. In fact, in these cases, the per capita impact values for the VRC plant were lower than the corresponding values for the treatment capacity of 20 and 30 PE.
In terms of construction, the anomaly occurred because the considered VRC technical catalogue suggested the same dimensions for tanks with a treatment capacity of 5 and 10 PE; while the size of the tanks for 20 PE were significantly greater. In other words, the size of the VRC tank for the wastewater treatment of 10 PE was much lower than the corresponding size for 20 PE that this avoided the scale factor effect for the construction phase.
In terms of use, the anomaly was due to the assumption made for the quantity of sludge produced in the total oxidation tank, assumed as a percentage of the tank volume on the base of interviews with operators of wastewater treatment plants located in the Campania region of Southern Italy. Obviously, the more the tank volume the more the quantity of sludge was. The great difference in the sludge quantity associated with the two systems in VRC designed for 10 and 20 PE influenced the results to avoid the scale effect also for the use phase. The scale factor effects on the impacts of treatment systems have also been discussed by other authors [
20,
21] whose conclusions agree with the results presented in this study.
Use was the most significant phase, with an incidence greater than 80% on the total impacts for both the treatment lines as well as all the impact assessment methods considered (
Table 5,
Table 6 and
Table 7). The two main sources of impacts generated by the use phase were the electricity consumption for the aeration of the total oxidation tanks and sludge disposal. The comparison among the case study (Medium Scenario) and the other two alternative Scenarios (Best Scenario and Worst Scenario) allowed pointing out the importance of the influence of these parameters on the environmental performance of both treatment systems.
The percentage incidence of the use phase on the total impacts was even greater than 95% for the system in LLDPE. In addition, the values of the impacts obtained for the Worst scenario were almost double those for the Best Scenario and this occurred both for the LLDPE and VRC systems.
The environmental impacts of the use phase for VRC were higher than LLDPE, and this occurs in all scenarios evaluated, due to the greater quantity of sludge to dispose of in the VRC as a consequence of the greater volume of the tanks.
The high incidence of electricity consumption (in the use phase) and sludge disposal on the environmental performance of the intensive treatment technologies have already been shown in other studies [
9,
27,
28,
29].
In this study, the obtained results showed that the construction phase has a percentage incidence on the total impacts variable with the considered system. The construction generated impacts significantly higher for the treatment line in concrete than LLDPE.
For the Medium Scenario, the percentage incidence of this phase never exceeded 20% of the total impact for both systems as well as all the impacts assessment methods considered (
Table 5,
Table 6 and
Table 7).
The results obtained with the other alternative scenarios showed some differences but the overall trend did not change.
The percentage incidence of the construction phase on total impacts for the Best Scenario was greater than that obtained in the Medium Scenario for both treatment systems (
Table 13,
Table 14 and
Table 15). In particular, in the Best Scenario, there was the maximum percentage contribution equal to 25.4% (relative to the plant in concrete with a treatment capacity of 5 PE with ReCiPe 2008) (
Table 13). The percentage incidence of the construction phase on the total impacts for the Worst Scenario was less than that obtained in the Medium Scenario for both treatment systems (
Table 10,
Table 11 and
Table 12).
For the Best scenario, the sensitive parameters relating to the use phase corresponded to the minimum value adopted. Therefore, the operative phase of the plants generated lower potential environmental impacts, compared to impacts of the operative phase of Medium Scenario, and consequently increased the percentage contribution of the construction phase to total impacts (
Table 13,
Table 14 and
Table 15). On the other hand, for the Worst scenario, the parameters related to the operational phase assumed the maximum value adopted. Therefore, the impacts of this phase were higher and consequently the percentage contribution of the construction to the total was lower (
Table 10,
Table 11 and
Table 12).
The variation of the third sensitive parameter, i.e., the gas consumption for the rotational molding process, it must be emphasized that its variation affected only the treatment system in LLDPE. Comparing the results obtained for the construction phase of such system for the Best scenario and Worst scenario, it is possible to note that the variation of this parameter was negligible. Consequently, it had no effect in the comparison between the construction phases of the two treatment systems. In fact, even in the Worst scenario (with the maximum value of gas consumption), the construction phase of the concrete system was the most significant in terms of environmental impacts.
The results obtained with the two alternative scenarios (Best and Worst) did not change the general conclusions of Medium Scenario (i.e., LLDPE was the best alternative in all scenarios; the use was the most impactful phase for both lines and for all scenarios). However, there were significant differences in numerical terms between the results obtained with the three different scenarios.
It is worth nothing that, taking into account the results of the entire life cycle of the Worst Scenario for LLDPE treatment line and Best Scenario for VRC treatment line, there is a reversal of the trend: the treatment system in VRC is less impactful than that in LLDPE. This occurs with all the evaluation methods considered.
The performed sensitivity analysis showed that the electricity consumption for the aeration of the total oxidation tanks was the sensitive parameter playing the major role, for both treatment lines (see Case 2 in
Table 17 and
Table 18).
Usually, the disposal phase of wastewater treatment plants is completely ignored in current literature and consequently its impacts are not evaluated. In the performed study, the disposal phase presented, in all cases, negligible environmental impacts as deducible from the percentage contribution that this phase provided to the total impacts for both treatment lines (
Table 5,
Table 6 and
Table 7).
The results obtained with the three impacts assessment methods taken into consideration (ReCiPe 2008, Ecological Footprint and IPCC 2007 100 years) were uniform and coherent. Therefore, in this study the choice of the evaluation method did not influence the results.
5. Conclusions
The performed study proposed a comparison of the environmental impacts calculated with the LCA methodology of two on-site small-scale activated sludge total oxidation systems in linear low-density polyethylene (LLDPE) and VRC. Both plants were appropriately sized to ensure a treatment capacity of 5, 10, 20 and 30 equivalent inhabitants (PE).
The main aim of the study was to evaluate the incidence of construction, disposal and operation on the total impacts evaluated with three different methods: ReCiPe 2008, Ecological Footprint and IPCC 2007 100 years.
The most significant phase for both treatment lines was the use phase, which contributed more than 80% of the total impacts. The construction phase was the second major phase with an incidence less than 25% for both systems and for all the considered impacts assessment methods. For the activated sludge total oxidation systems, use is the most weighted phase due to the high consumption of energy and resources required for its operation.
Obviously, the results cannot be generalized because they were obtained for a specific type of technology. For instance, for extensive treatment systems,
i.e., constructed wetlands, the life cycle phase with the greatest impact could be the construction phase [
5,
7,
8,
9].
Comparing the environmental performance of the two treatment systems considered in this study, it is possible to conclude that the plant designed in LLDPE was more eco-friendly than that designed in VRC. The plant in concrete was always most impactful, even comparing each single phase of the life cycle as well as all the treatment capacities taken into consideration.
Finally, the obtained results were not dependent on the impact assessment method considered.


