
A Comprehensive Quantitative Evaluation of New Sustainable Urbanization Level in 20 Chinese Urban Agglomerations

Abstract
:1. Introduction
2. Two New Characteristics of NNUP
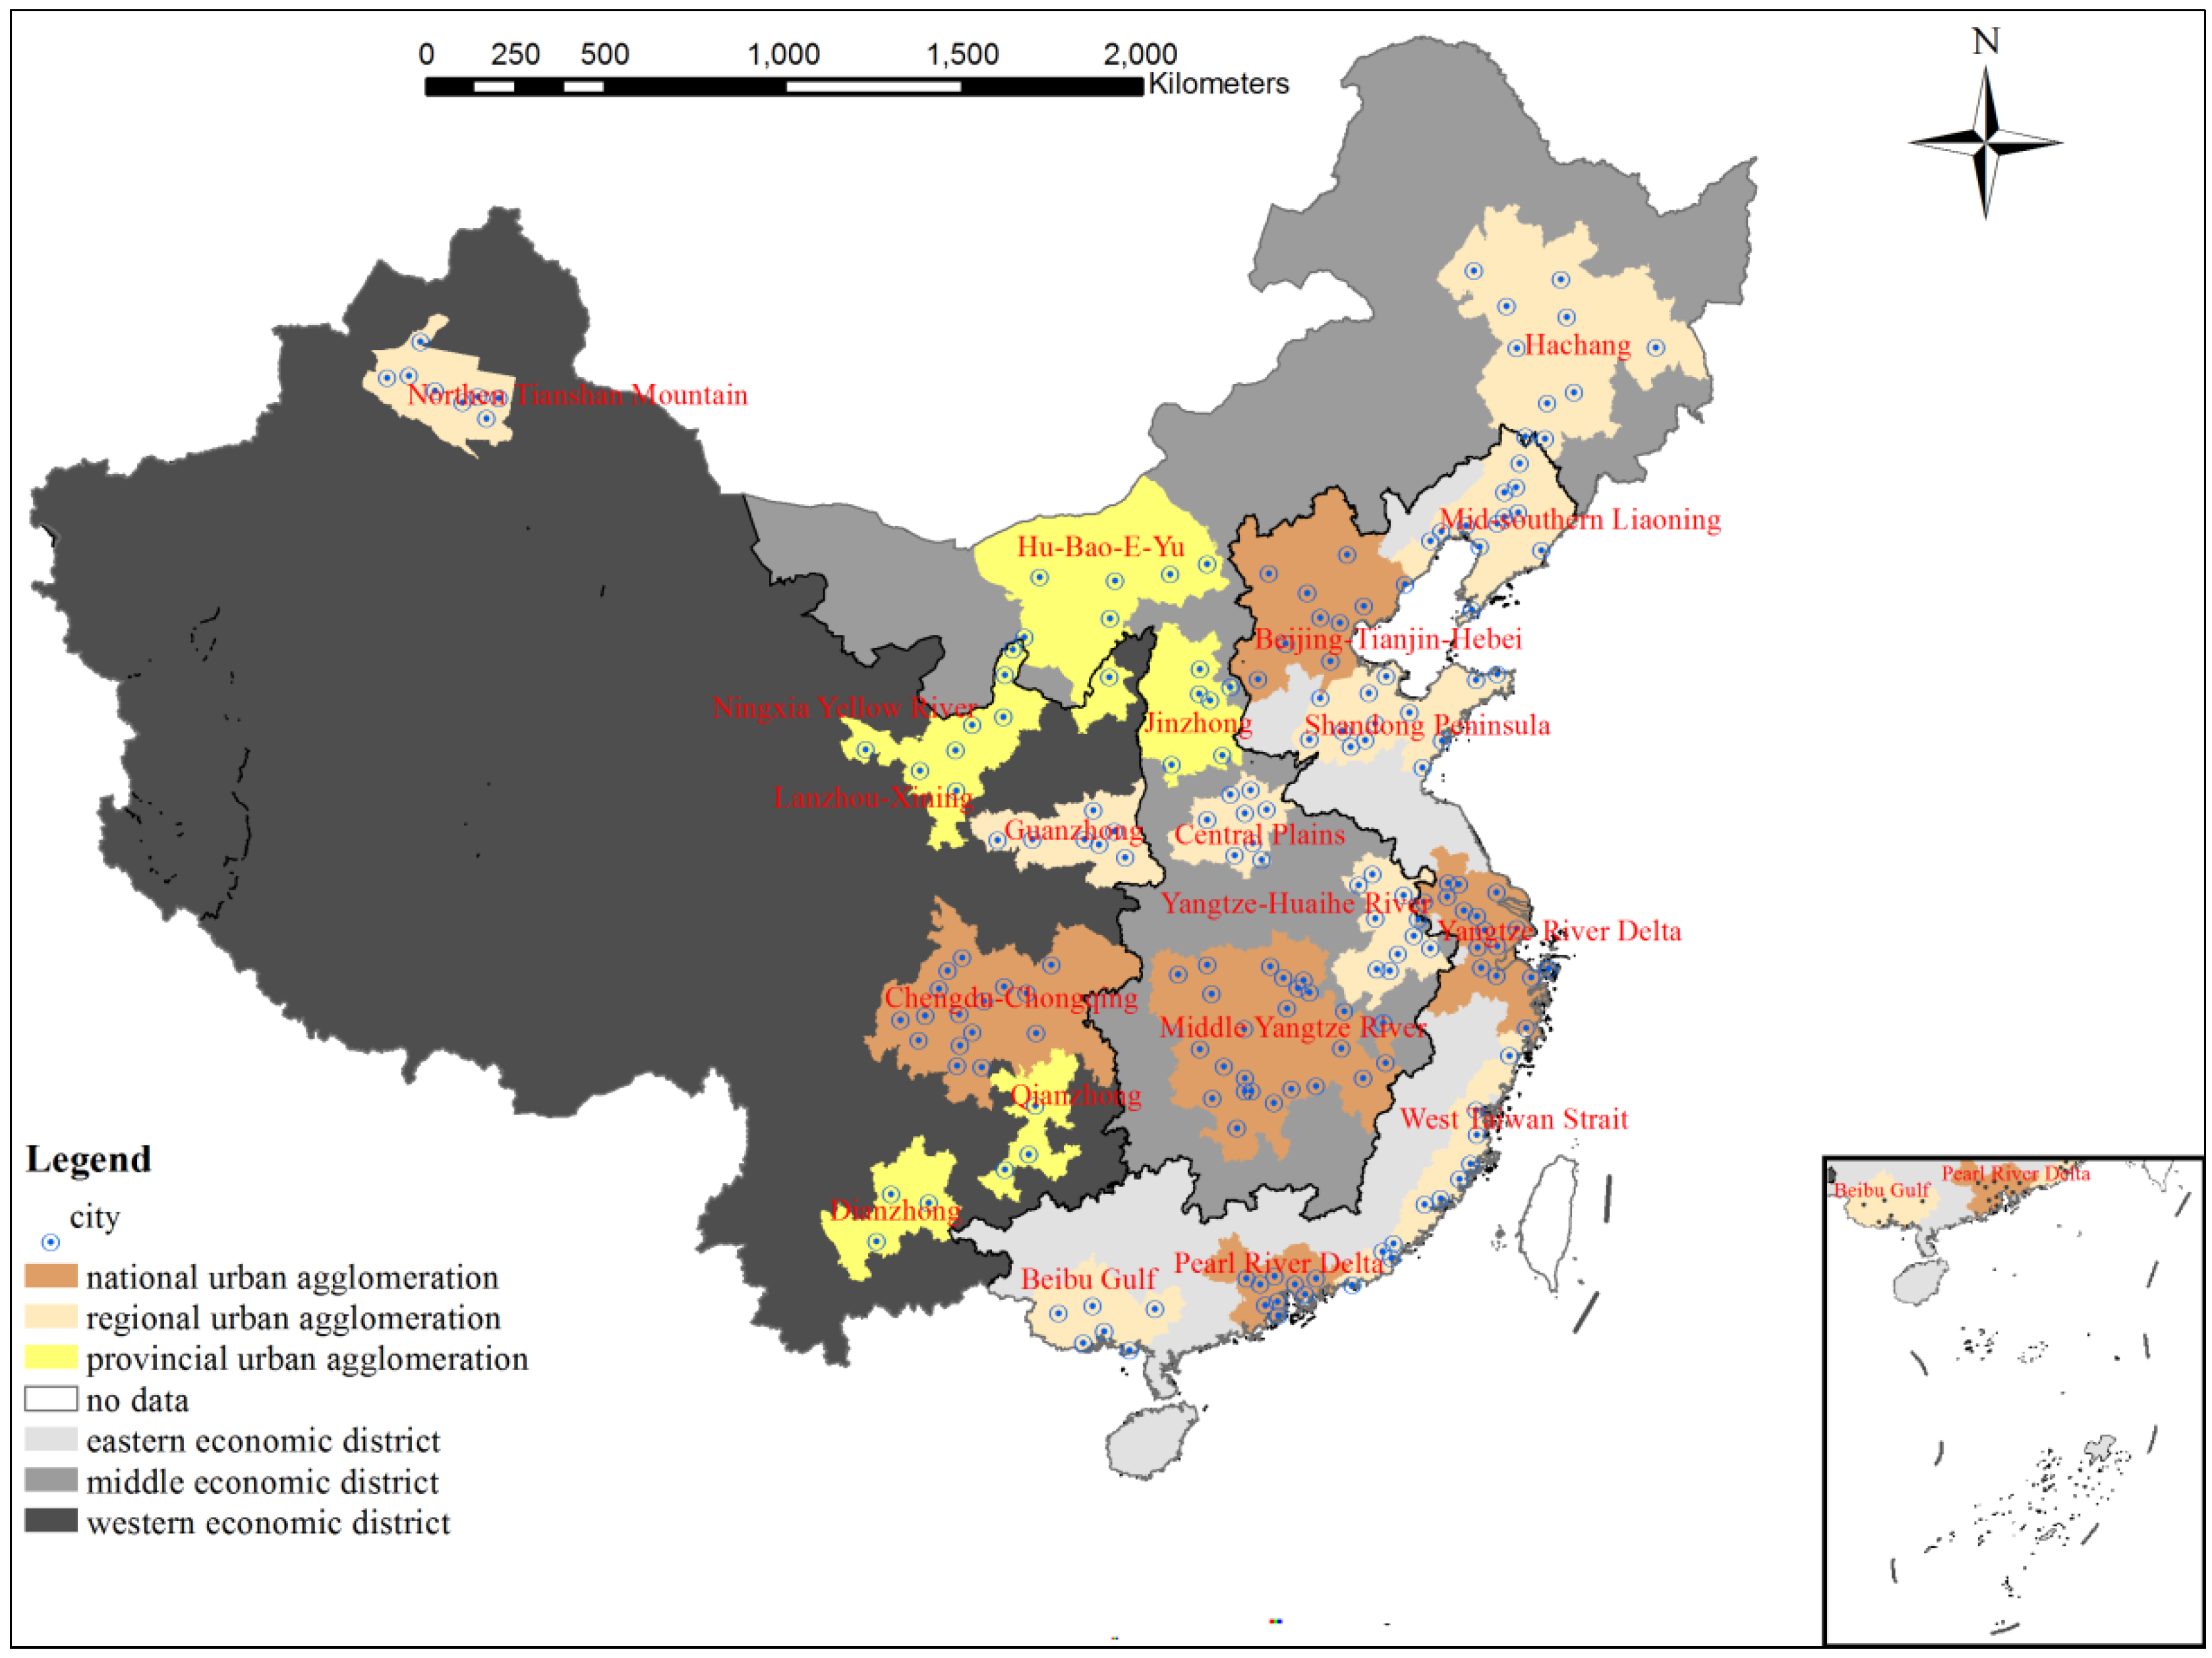
2.1. Putting forward 20 Urban Agglomerations as the Development Focus of Chinese New Urbanization
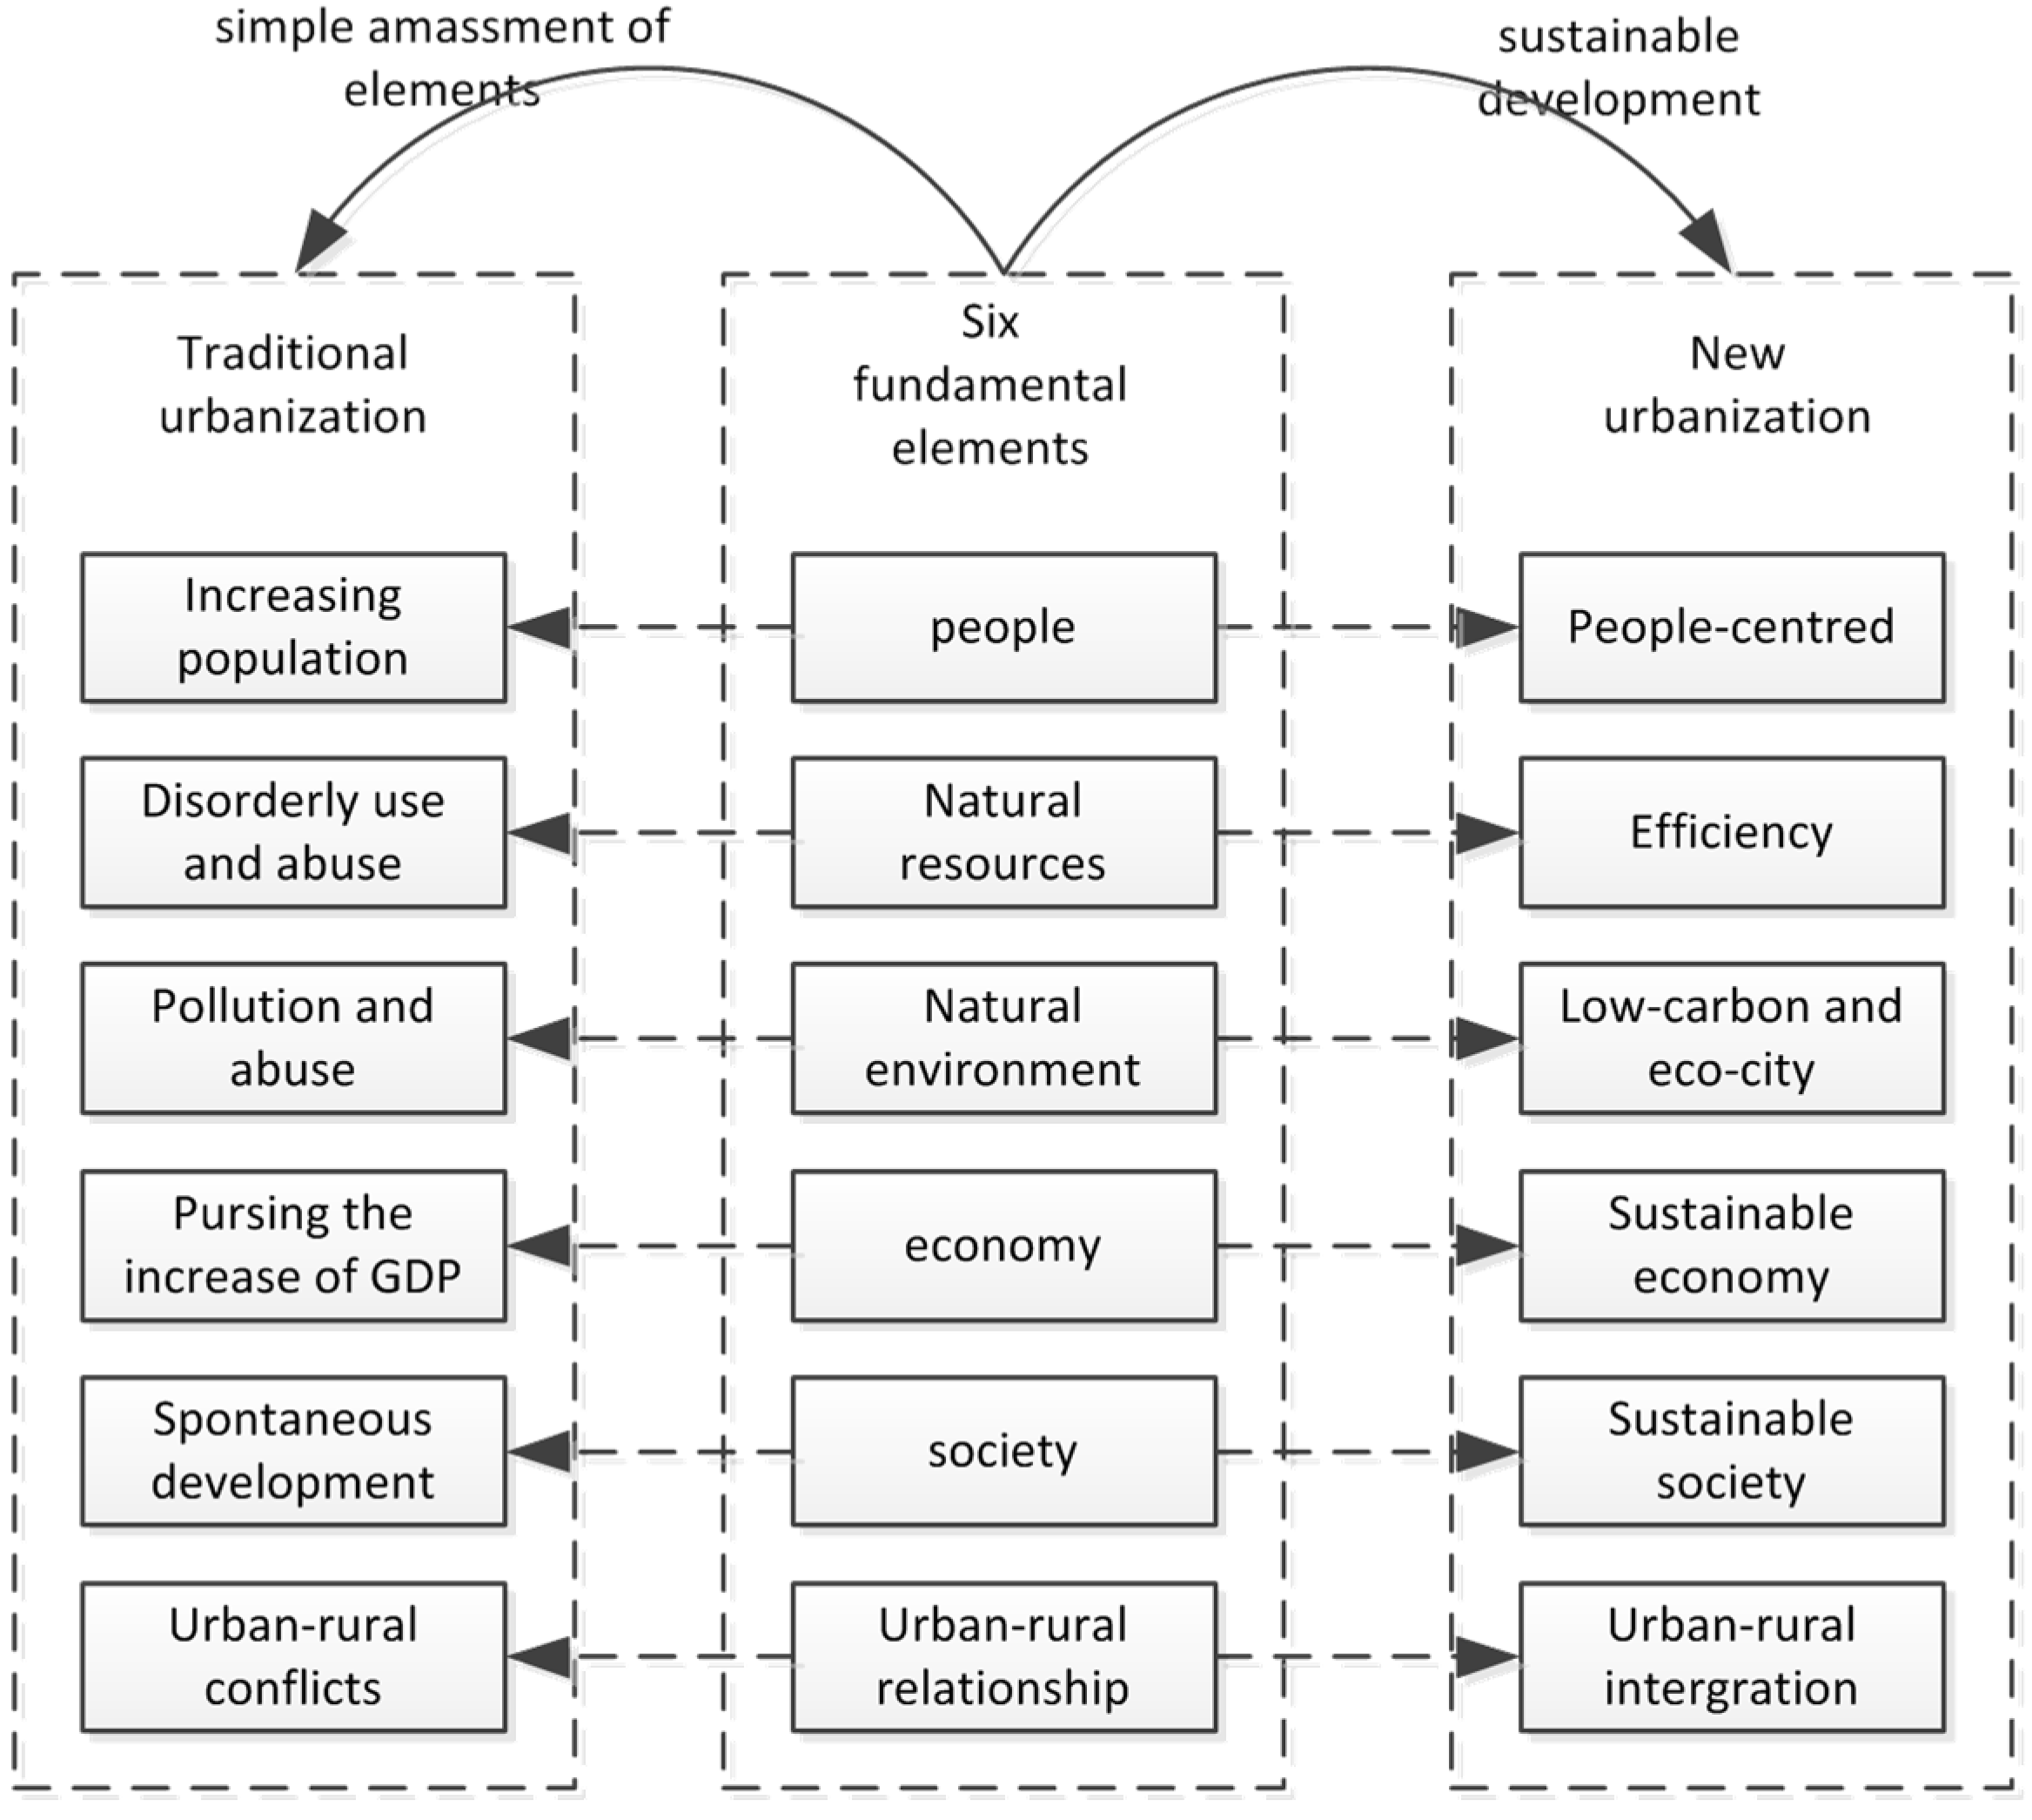
2.2. Giving Chinese New Urbanization a Core and Scientific Guiding Principle—Sustainable Development
3. Materials and Methods
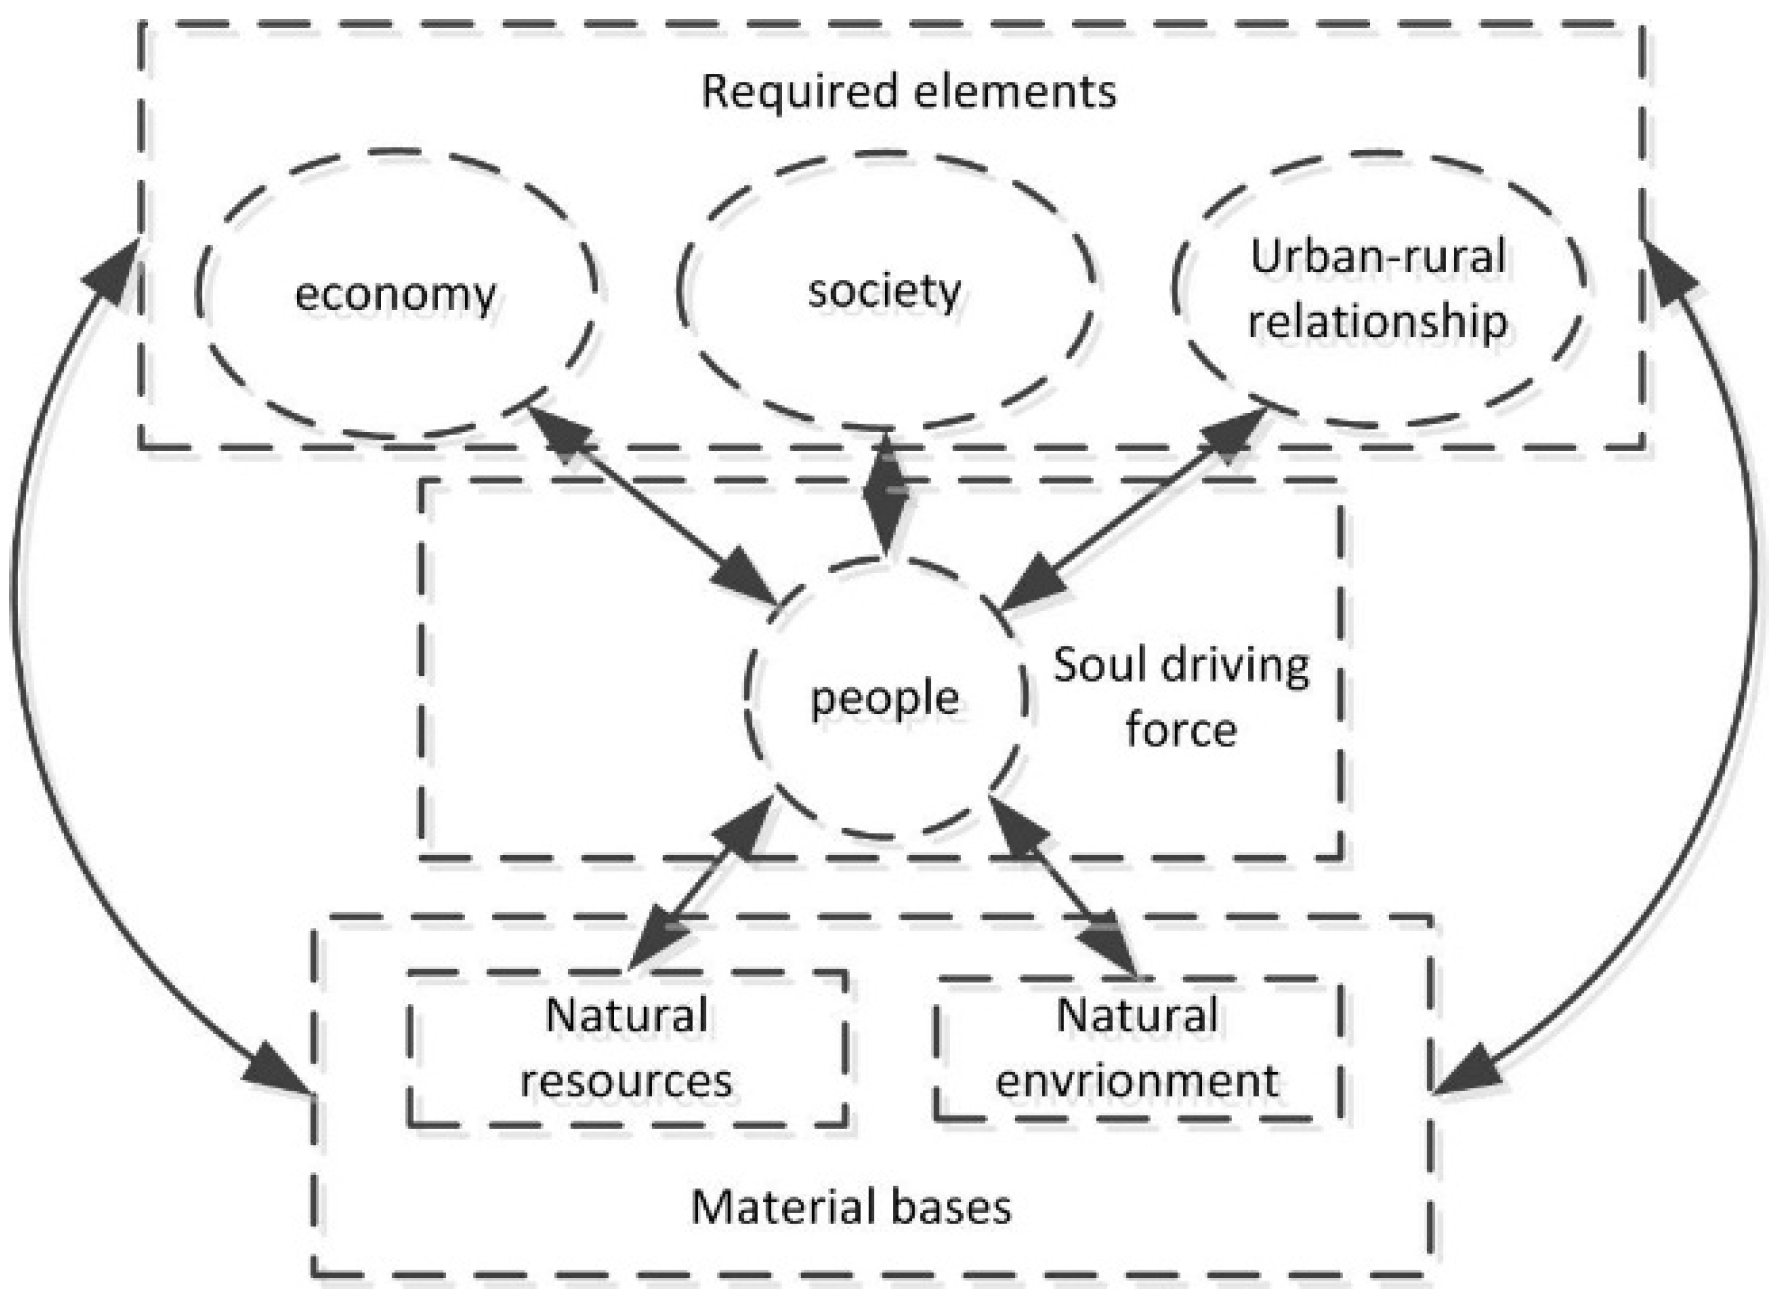
3.1. Index System

| Comprehensive indicator—sustainable new urbanization level | First Level Indicators | Basic Level Indicators |
| Comfort of life (C) | C1 The registered urban unemployment rate | |
| C2 Per capita building space of urban household | ||
| C3 The proportion of urban per capita consumption expenditure and urban per capita disposable income | ||
| Development efficiency (D) | D1 Daily water consumption per capita | |
| D2 Electricity consumption per unit of GDP | ||
| D3 Area of urban construction land per capita | ||
| D4 Density of water supply and drainage pipelines in built district | ||
| D5 Density of road network in built district | ||
| Environment protection (E) | E1 Ratio of waste water centralized treated of sewage work | |
| E2 Ratio of consumption wastes treated | ||
| E3 Green coverage rate of built district | ||
| E4 Annual average concentration of PM 2.5 | ||
| Sustainable economy (Se) | Se1 Per capita GDP | |
| Se2 The average wages of workers | ||
| Se3 Retail sales of consumer goods per capita | ||
| Se4 The proportion of tertiary industrial output-value | ||
| Sustainable society (Ss) | Ss1 The proportion of public financial expenditure on science and technology | |
| Ss2 The proportion of public financial expenditure on education | ||
| Ss3 Collections of public libraries per 100 Persons | ||
| Ss4 Number of public transportation vehicles per 10,000 population | ||
| Ss5 Number of beds of hospitals and health centers per 10,000 population | ||
| Ss6 Water coverage rate | ||
| Ss7 Gas coverage rate | ||
| Urban–rural integration (U) | U1 Urban–rural income ratio | |
| U2 Urban–rural consumption ratio |
3.2. Data Sources
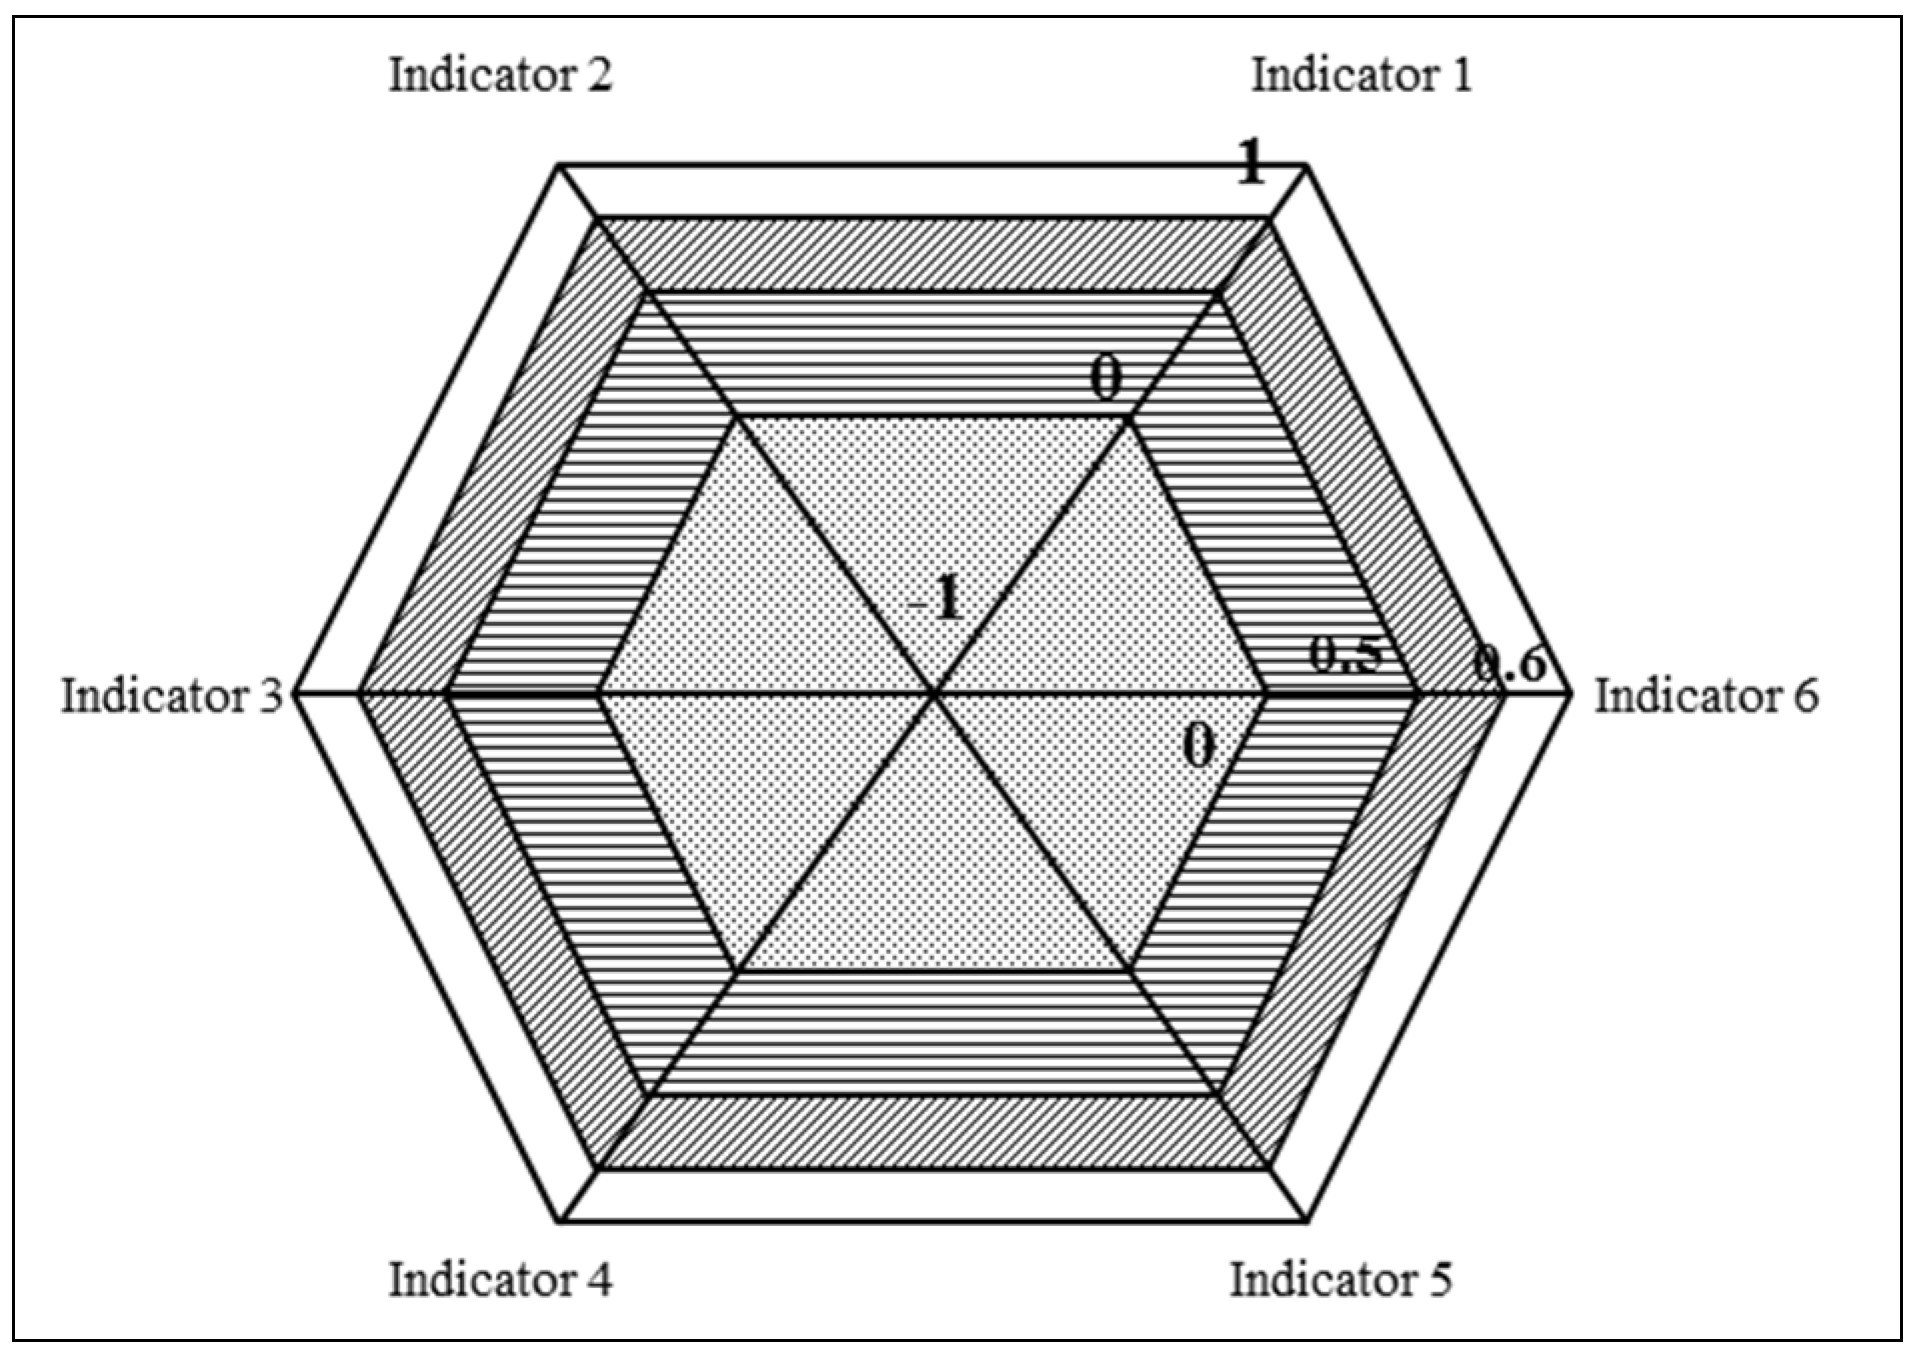
3.3. A Full Permutation Polygon Synthetic Indicator Method
4. Results
4.1. Analyses Based on Comprehensive Indicator
| Rank | Agglomeration Name | Score of Comprehensive Indicator | Level | District |
|---|---|---|---|---|
| 1 | Yangtze River Delta | 0.489 | National | Eastern |
| 2 | Pearl River Delta | 0.457 | National | Eastern |
| 3 | Shandong Peninsula | 0.447 | Regional | Eastern |
| 4 | Beijing-Tianjin-Hebei | 0.439 | National | Eastern |
| 5 | West Taiwan Strait | 0.425 | Regional | Eastern |
| 6 | Mid-southern Liaoning | 0.419 | Regional | Eastern |
| 7 | Jinzhong | 0.403 | Provincial | Middle |
| 8 | Northern Tianshan Mountain | 0.402 | Regional | Middle |
| 9 | Middle Yangtze River | 0.400 | National | Middle |
| 10 | Hu-Bao-E-Yu | 0.400 | Provincial | Middle |
| 11 | Dianzhong | 0.397 | Provincial | Western |
| 12 | Yangtze-Huaihe River | 0.395 | Regional | Middle |
| 13 | Hachang | 0.381 | Regional | Middle |
| 14 | Beibu Gulf | 0.374 | Regional | Eastern |
| 15 | Central Plains | 0.366 | Regional | Middle |
| 16 | Guanzhong | 0.359 | Regional | Western |
| 17 | Lanzhou-Xining | 0.357 | Provincial | Western |
| 18 | Chengdu-Chongqing | 0.348 | National | Western |
| 19 | Qianzhong | 0.344 | Provincial | Western |
| 20 | Ningxia yellow river | 0.337 | Provincial | Western |
| All | NUA | RUA | PUA | EUA | MUA | WUA | |
|---|---|---|---|---|---|---|---|
| Mean | 0.397 | 0.427 | 0.396 | 0.373 | 0.436 | 0.392 | 0.357 |
| Max/Min | 1.451 | 1.406 | 1.244 | 1.197 | 1.306 | 1.102 | 1.178 |
| CV | 0.102 | 0.128 | 0.074 | 0.081 | 0.082 | 0.035 | 0.059 |
4.2. Analyses Based on Six First Level Indicators
4.2.1. Development of Six First Level Indicators
| Six First Level Indicators | Mean | Max/Min | CV |
|---|---|---|---|
| Comfort of life | 0.393 | 1.571 | 0.147 |
| Development efficiency | 0.391 | 1.468 | 0.086 |
| Environment protection | 0.381 | 1.534 | 0.115 |
| Sustainable economy | 0.377 | 1.576 | 0.138 |
| Sustainable society | 0.439 | 1.716 | 0.159 |
| Urban-rural integration | 0.390 | 2.082 | 0.209 |
4.2.2. Development of 20 Urban Agglomerations for Six First Level Indicators
| The Score of Z | Level | Qualitative Evaluation |
|---|---|---|
| >1 | I | excellently |
| 0~1 | II | well |
| −1~0 | III | poorly |
| <−1 | IV | Very poorly |
| Agglomeration Name | C | D | E | Se | Ss | U |
|---|---|---|---|---|---|---|
| Yangtze River Delta | 1.654 | 1.087 | 0.645 | 2.229 | 2.049 | 1.647 |
| Pearl River Delta | −0.213 | −0.008 | 0.857 | 1.987 | 1.842 | 1.212 |
| Shandong Peninsula | 1.287 | 0.685 | 0.802 | 0.628 | 1.300 | −0.267 |
| Beijing-Tianjin-Hebei | 0.587 | 0.603 | −0.669 | 1.153 | 1.408 | 0.055 |
| West Taiwan Strait | 0.599 | 0.494 | 0.848 | 0.384 | 0.415 | 0.356 |
| Mid-southern Liaoning | −0.536 | 1.417 | 0.667 | 0.090 | 0.306 | 0.614 |
| Jinzhong | 1.020 | 0.460 | −0.097 | −0.302 | −0.036 | −0.552 |
| Northern Tianshan Mountain | −0.995 | −1.151 | 0.942 | −0.639 | 0.169 | 2.727 |
| Middle Yangtze River | 0.106 | 0.215 | 0.598 | −0.577 | −0.090 | 0.358 |
| Hu-Bao-E-Yu | −0.886 | 1.259 | 0.725 | 1.259 | −0.629 | −0.109 |
| Dianzhong | 1.074 | −0.216 | 1.743 | 0.201 | −0.791 | −0.833 |
| Yangtze-Huaihe River | −0.595 | 0.349 | −0.034 | −0.407 | 0.448 | −0.649 |
| Hachang | −1.083 | 0.291 | −0.655 | −0.097 | −0.388 | 0.420 |
| Beibu Gulf | 2.075 | −0.630 | −0.181 | −0.936 | −0.634 | −1.105 |
| Central Plains | −0.115 | −0.850 | −1.879 | −0.731 | −0.440 | 0.037 |
| Guanzhong | −0.249 | 0.478 | −0.410 | −1.205 | −0.865 | −1.183 |
| Lanzhou-Xining | −1.029 | −0.941 | −1.819 | −0.378 | −0.390 | −0.835 |
| Chengdu-Chongqing | −0.557 | 0.380 | −1.419 | −1.230 | −1.154 | −0.605 |
| Qianzhong | −0.989 | −1.172 | −1.066 | −0.590 | −1.092 | −1.169 |
| Ningxia yellow river | −1.156 | −2.749 | 0.403 | −0.839 | −1.428 | −0.118 |

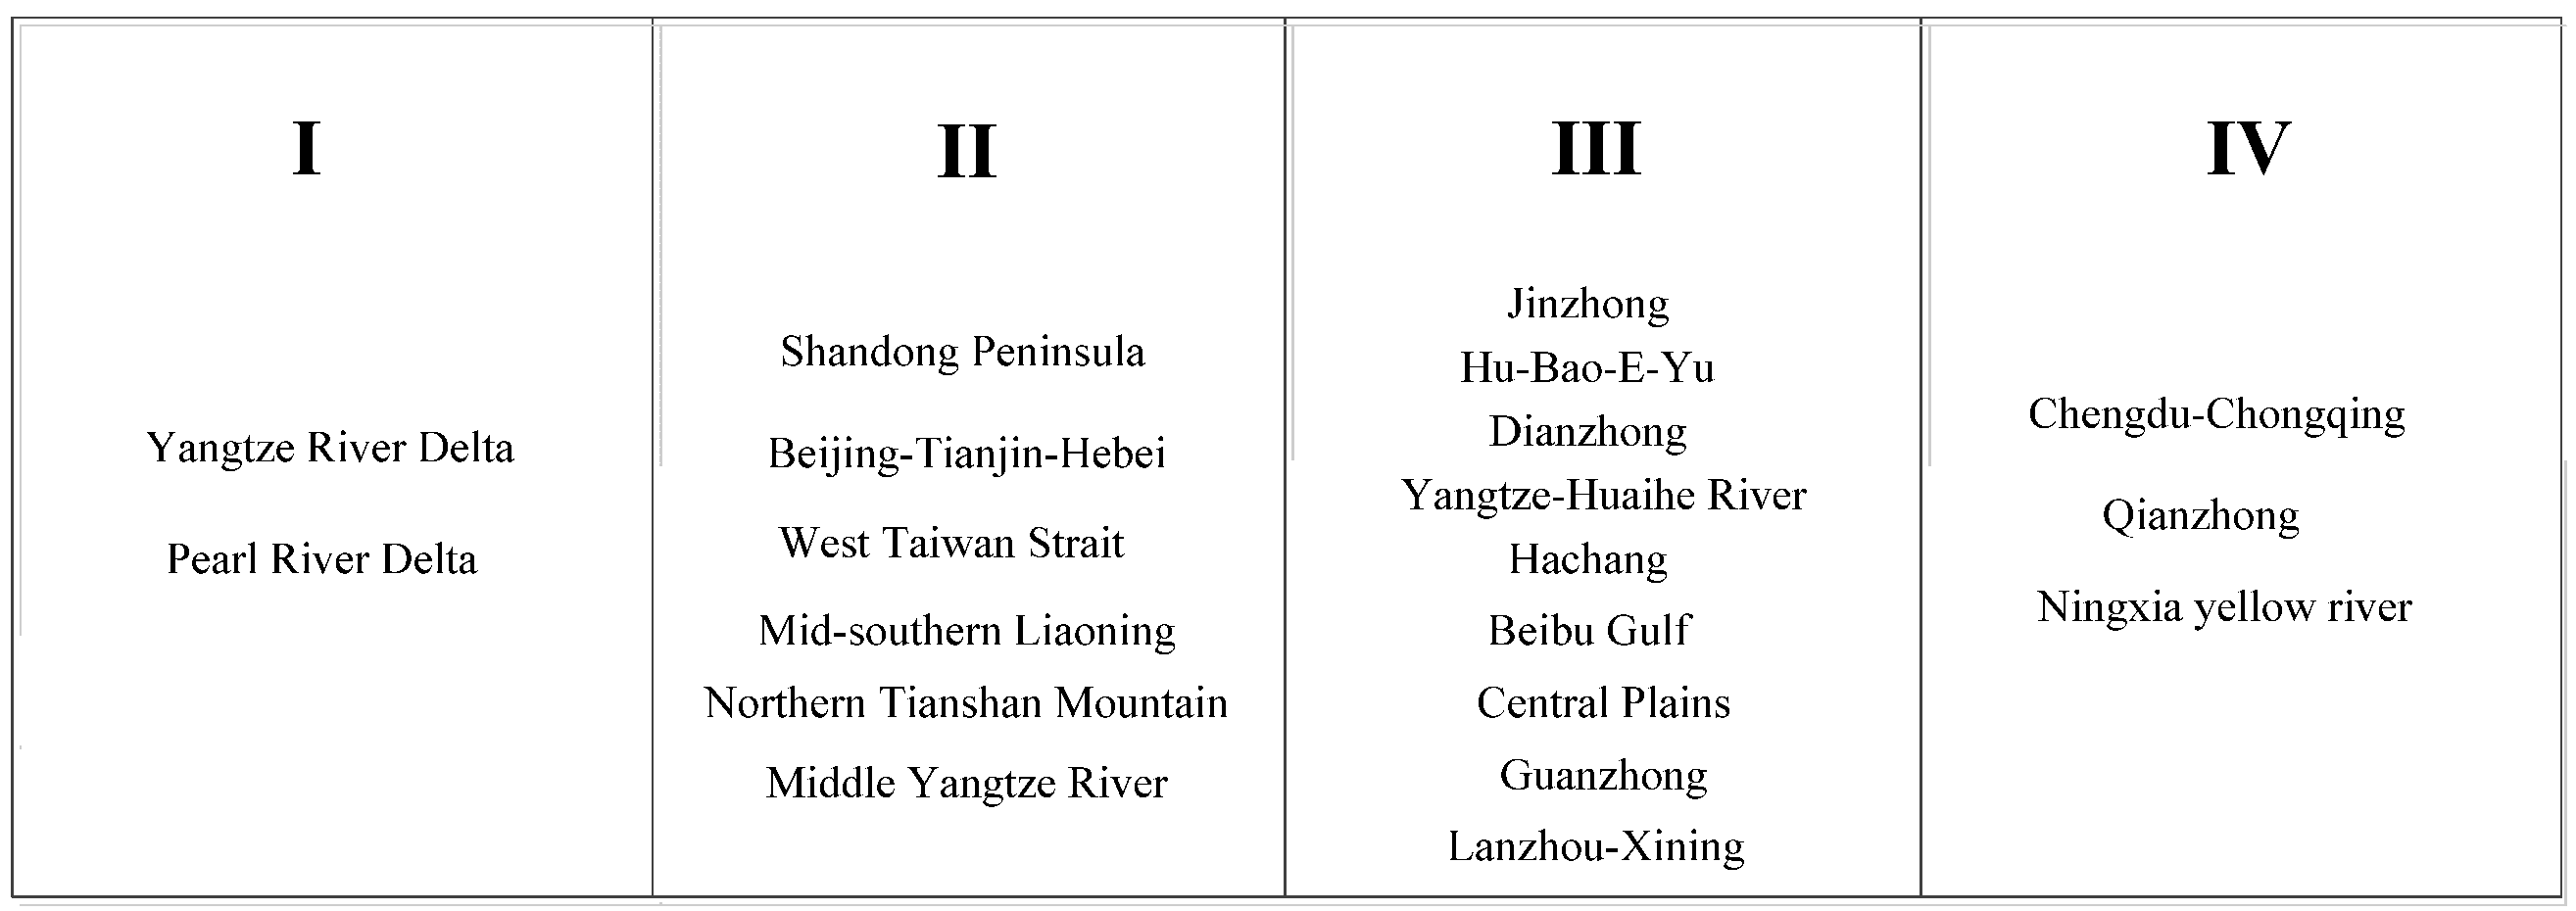
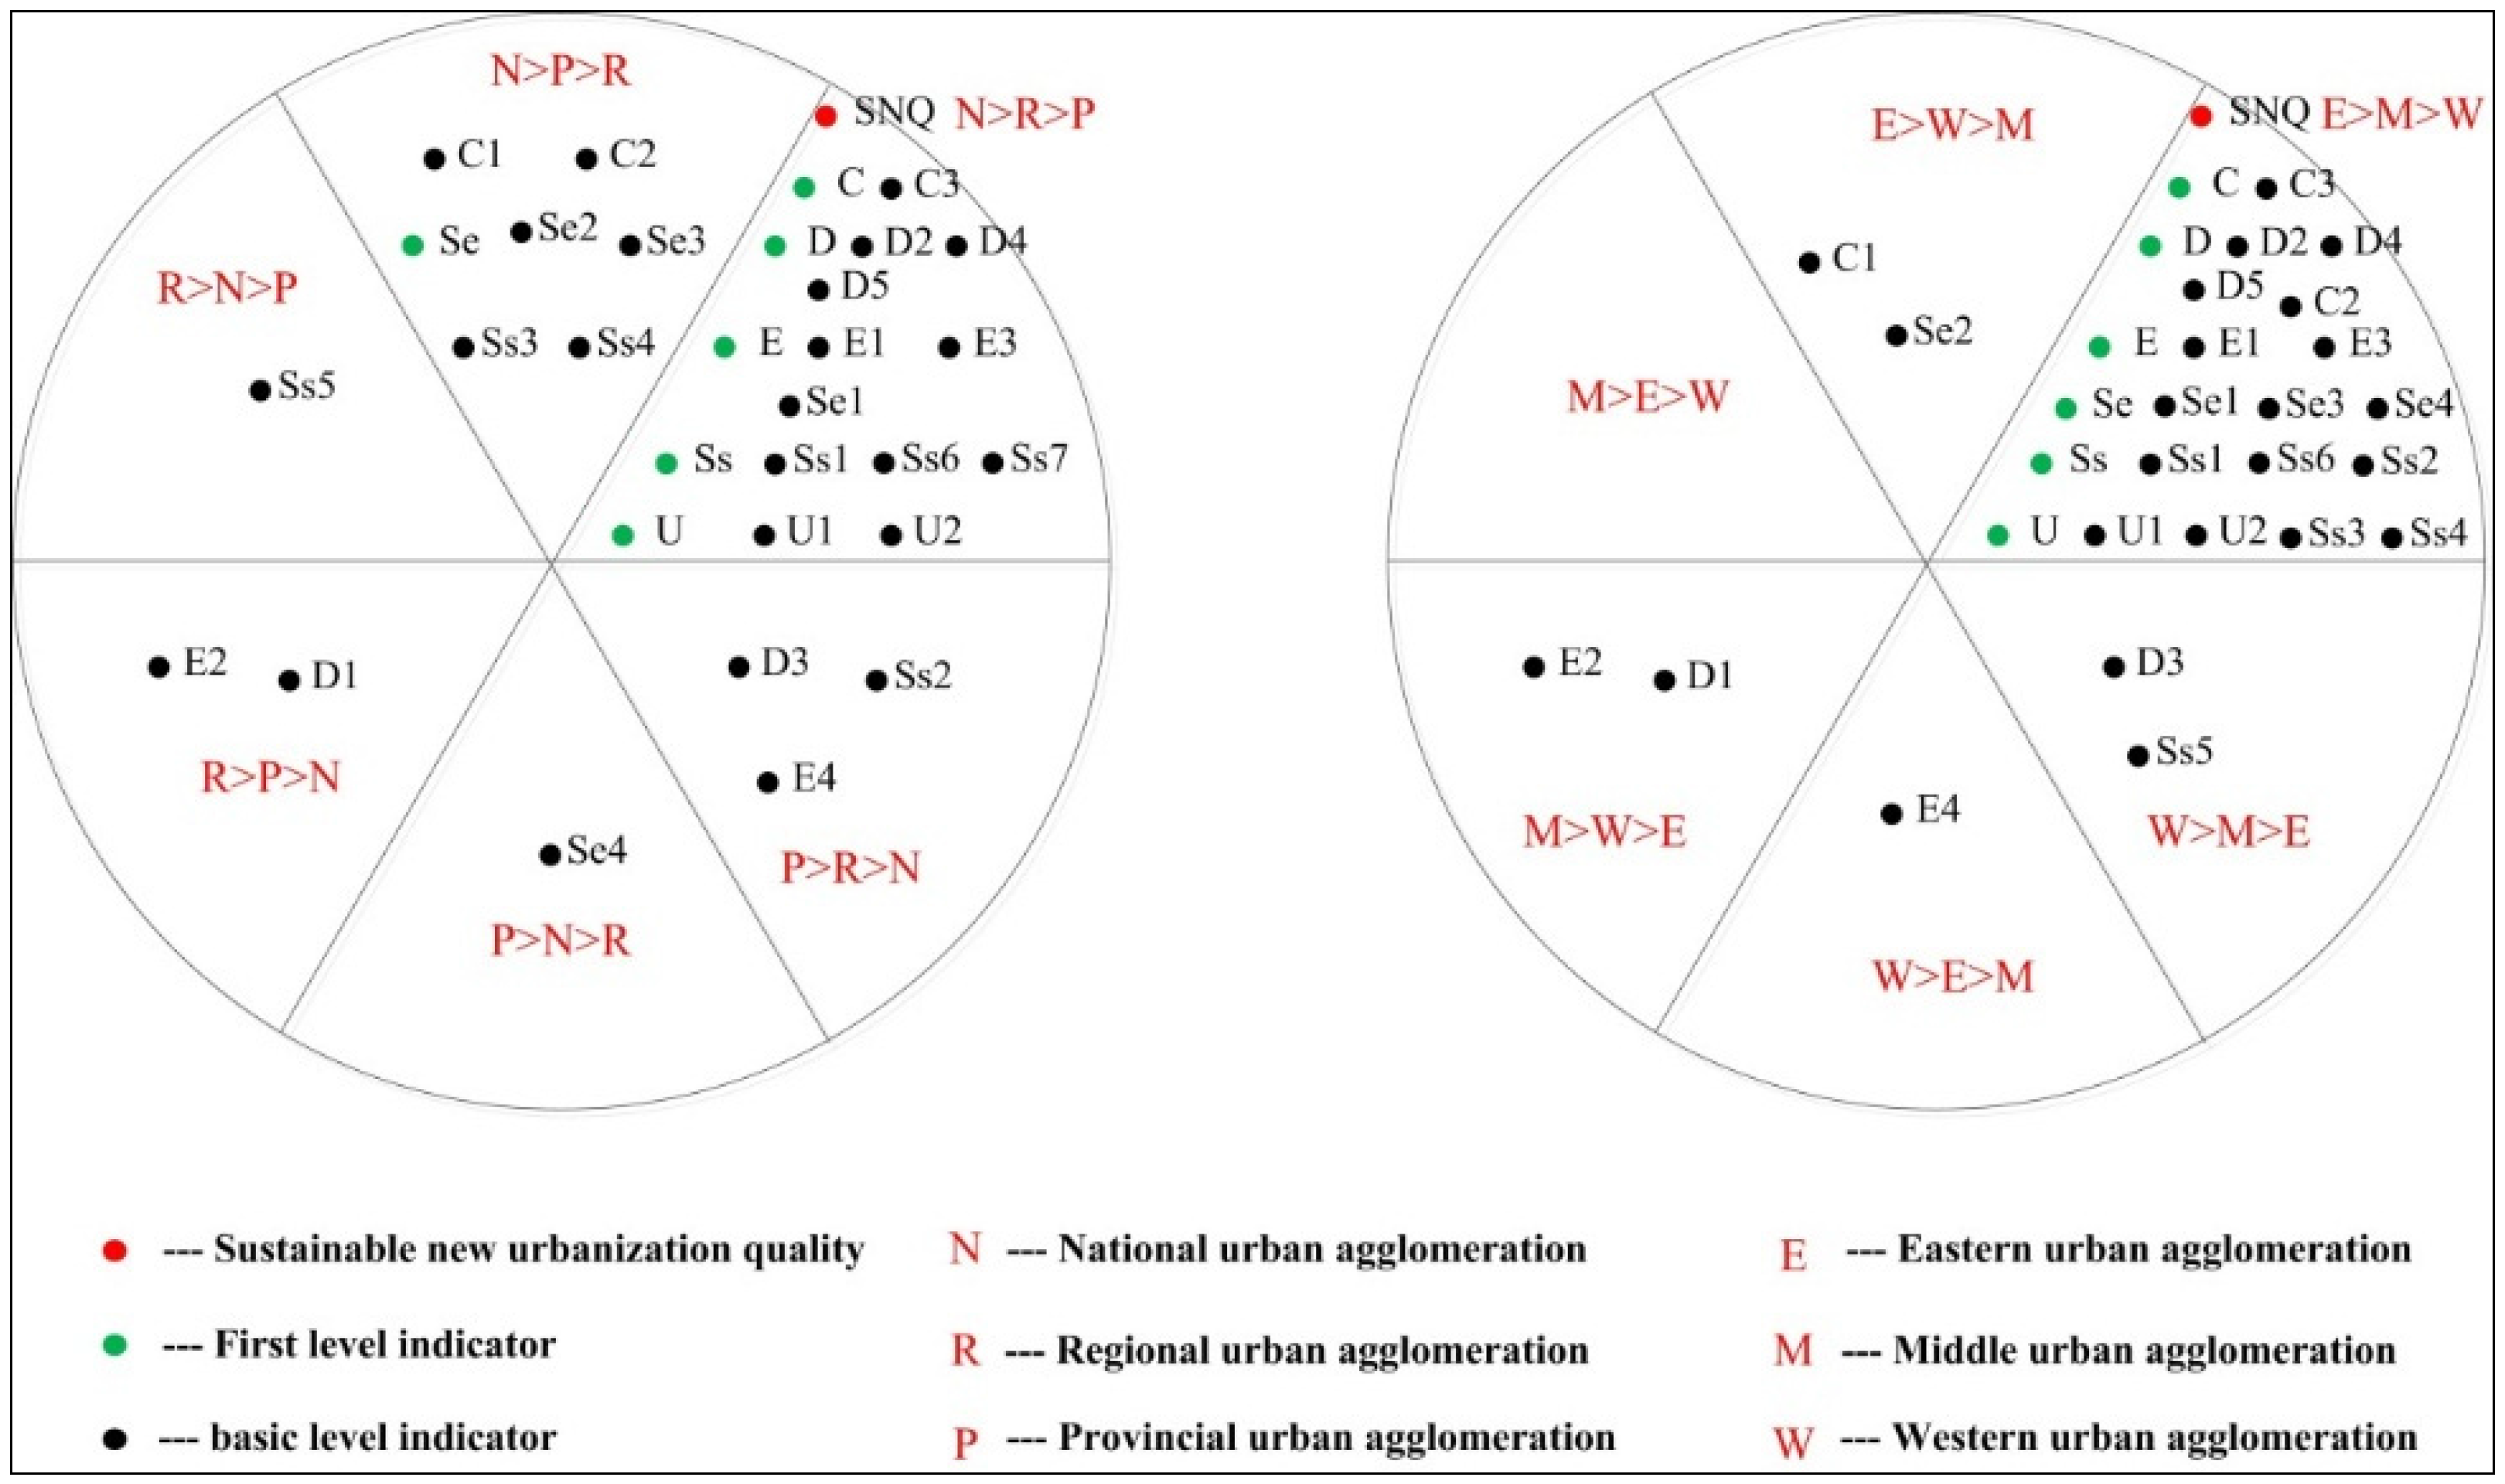
| Category | Agglomeration Name | Z Score Distribution Frequency of Six First Level Indicators in Four Levels | Z Score Distribution Regularity Based on the Z Score Distribution Frequency | |||
|---|---|---|---|---|---|---|
| I | II | III | IV | |||
| 1 | Yangtze River Delta | 5 | 1 | 0 | 0 | all six first level indicators perform excellently or well |
| West Taiwan Strait | 0 | 6 | 0 | 0 | ||
| 2 | Lanzhou-Xining | 0 | 0 | 4 | 2 | all six first level indicators perform poorly or very poorly |
| Qianzhong | 0 | 0 | 2 | 4 | ||
| 3 | Middle Yangtze River | 0 | 4 | 2 | 0 | some indicators perform well and the others perform poorly |
| Yangtze-Huaihe River | 0 | 2 | 4 | 0 | ||
| 4 | Pearl River Delta | 3 | 1 | 2 | 0 | one or two first level indicators perform poorly; the others perform well or excellently |
| Shandong Peninsula | 2 | 3 | 1 | 0 | ||
| Beijing-Tianjin-Hebei | 2 | 3 | 1 | 0 | ||
| Mid-southern Liaoning | 1 | 4 | 1 | 0 | ||
| 5 | Hachang | 0 | 2 | 3 | 1 | one or two first level indicators perform well; the others perform poorly or very poorly |
| Central Plains | 0 | 1 | 4 | 1 | ||
| Guanzhong | 0 | 1 | 3 | 2 | ||
| Chengdu-Chongqing | 0 | 1 | 2 | 3 | ||
| Ningxia yellow river | 0 | 1 | 2 | 3 | ||
| 6 | Beibu Gulf | 1 | 0 | 4 | 1 | one first level indicator performs excellently; one performs very poorly |
| Northern Tianshan Mountain | 1 | 2 | 2 | 1 | ||
| 7 | Jinzhong | 1 | 1 | 4 | 0 | no first level indicators perform very poorly; one or two perform excellently; most perform poorly |
| Hu-Bao-E-Yu | 2 | 1 | 3 | 0 | ||
| Dianzhong | 2 | 1 | 3 | 0 | ||
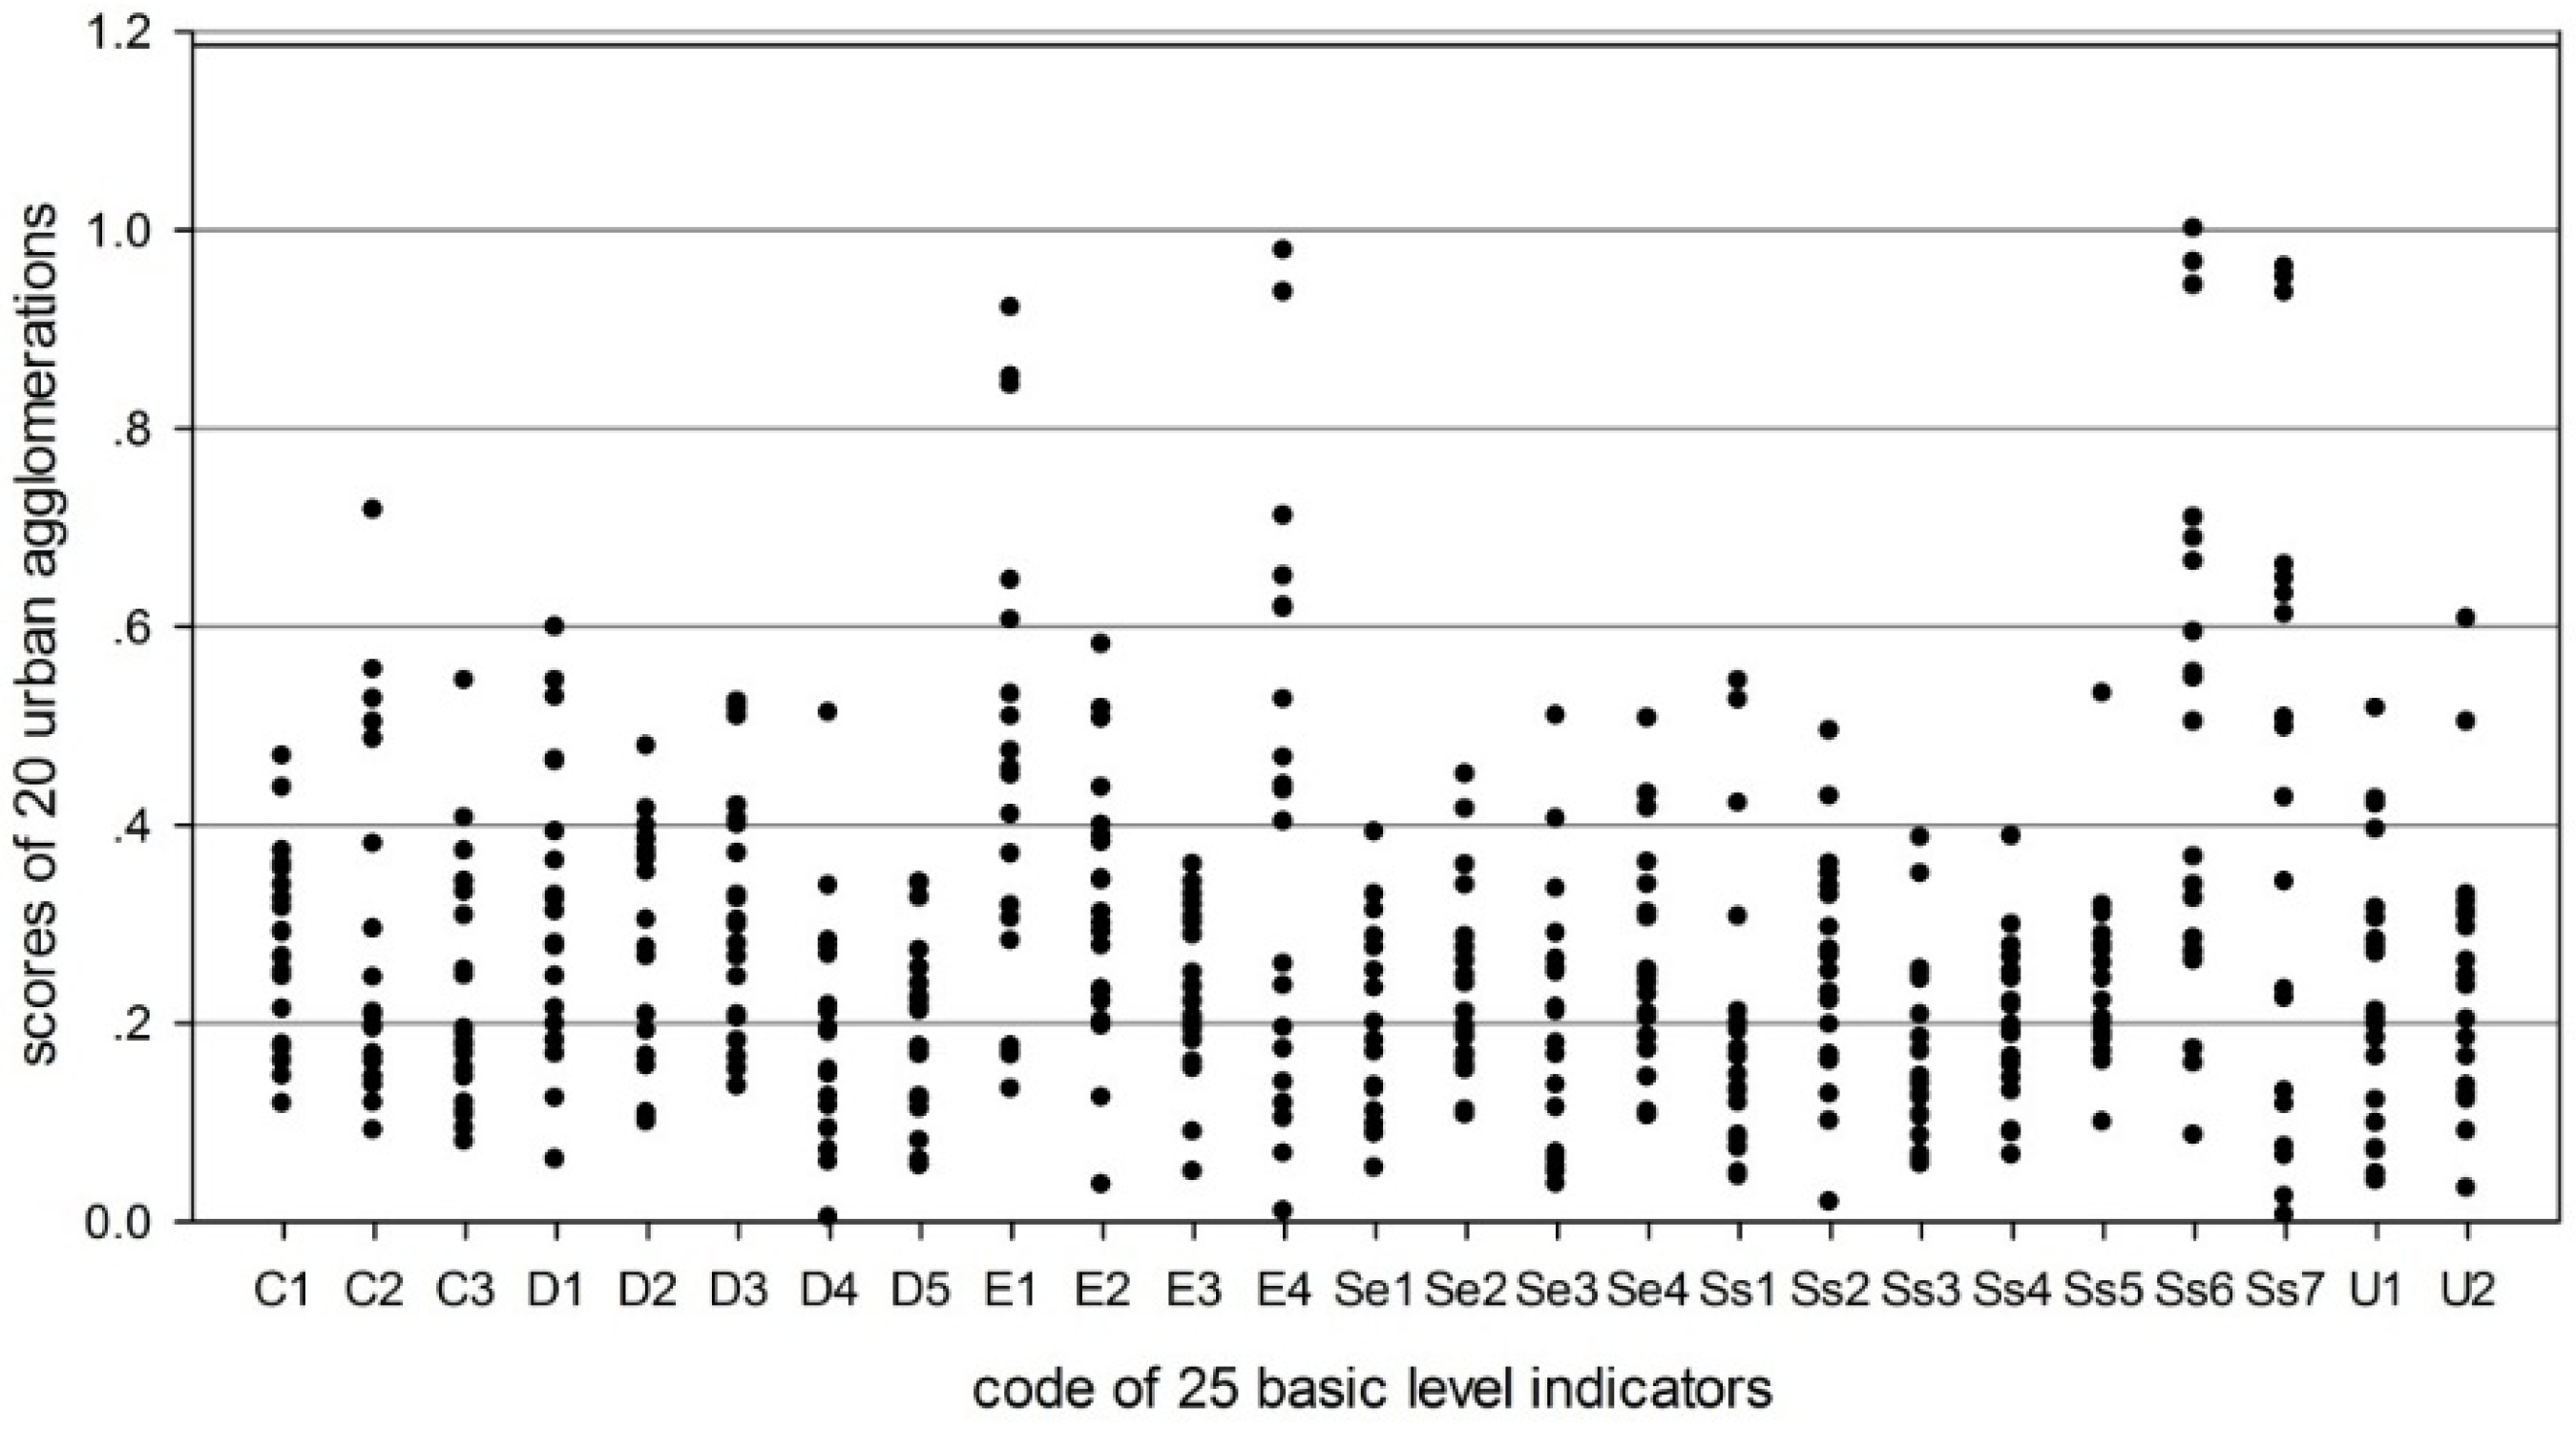
4.3. Analysis Based on Basic Level Indicators
| Twenty-five Basic Level Indicators | Mean | Max/Min | CV |
|---|---|---|---|
| C1 The registered urban unemployment rate | 0.273 | 3.984 | 0.364 |
| C2 Per capita building space of urban household | 0.285 | 7.911 | 0.623 |
| C3 The proportion of urban per capita consumption expenditure and urban per capita disposable income | 0.226 | 6.846 | 0.546 |
| D1 Daily water consumption per capita | 0.326 | 9.779 | 0.457 |
| D2 Electricity consumption per unit of GDP | 0.289 | 4.841 | 0.410 |
| D3 Area of urban construction land per capita | 0.311 | 3.876 | 0.392 |
| D4 Density of water supply and drainage pipelines in built district | 0.193 | 186.993 | 0.615 |
| D5 Density of road network in built district | 0.196 | 6.180 | 0.442 |
| E1 Ratio of waste water centralized treated of sewage work | 0.315 | 7.417 | 0.501 |
| E2 Ratio of consumption wastes treated | 0.236 | 4.235 | 0.399 |
| E3 Green coverage rate of built district | 0.191 | 13.933 | 0.668 |
| E4 Annual average concentration of PM 2.5 | 0.314 | 4.800 | 0.406 |
| Se1 Per capita GDP | 0.201 | 12.289 | 0.760 |
| Se2 The average wages of workers | 0.238 | 26.836 | 0.454 |
| Se3 Retail sales of consumer goods per capita | 0.191 | 6.850 | 0.577 |
| Se4 The proportion of tertiary industrial output-value | 0.263 | 5.870 | 0.397 |
| Ss1 The proportion of public financial expenditure on science and technology | 0.193 | 5.365 | 0.368 |
| Ss2 The proportion of public financial expenditure on education | 0.252 | 11.682 | 0.571 |
| Ss3 Collections of public libraries per 100 persons | 0.163 | 193.128 | 0.736 |
| Ss4 Number of public transportation vehicles per 10000 population | 0.196 | 6.950 | 0.511 |
| Ss5 Number of beds of hospitals and health centers per 10000 population | 0.244 | 16.089 | 0.429 |
| Ss6 Water coverage rate | 0.485 | 7.314 | 0.364 |
| Ss7 Gas coverage rate | 0.427 | 107.138 | 0.705 |
| U1 Urban–rural income ratio | 0.231 | 12.978 | 0.597 |
| U2 Urban–rural consumption ratio | 0.236 | 18.921 | 0.592 |
| P.C. with CI | P.C. with CI | P.C. with CI | P.C. with CI | ||||
|---|---|---|---|---|---|---|---|
| C | 0.529 * | D4 | 0.823 ** | Se1 | 0.823 ** | Ss4 | 0.611 ** |
| C1 | 0.642 ** | D5 | 0.850 ** | Se2 | 0.588 ** | Ss5 | 0.180 |
| C2 | 0.420 | E | 0.561 * | Se3 | 0.837 ** | Ss6 | 0.843 ** |
| C3 | 0.135 | E1 | 0.646 ** | Se4 | 0.196 | Ss7 | 0.805 ** |
| D | 0.608 ** | E2 | 0.207 | Ss | 0.937 ** | U | 0.575 ** |
| D1 | −0.128 | E3 | 0.723 ** | Ss1 | 0.752 ** | U1 | 0.573 ** |
| D2 | 0.245 | E4 | −0.124 | Ss2 | 0.164 | U2 | 0.536 * |
| D3 | −0.314 | Se | 0.860 ** | Ss3 | 0.722 ** | ||
5. Discussions and Suggestions
5.1. Reducing the Development Disparity of Cities Contained within an Urban Agglomeration
5.2. Strengthening Cooperation among Different Types of Urban Agglomerations
5.3. Measures to Improve Low Sustainable Development Level Indicators
- (1)
- Setting up examination and evaluation mechanisms of environmental protection and ecological civilization. Then, imputing the mechanisms into the evaluation system of new urbanization development and establishing sound assessment and reward and punishment measures.
- (2)
- Maintaining reasonable control of the total energy consumption, accelerating the development of clean coal technology, promoting the production of natural gas, developing nuclear energy safely and efficiently, and speeding up the exploration of renewable energy, e.g. wind energy and solar energy.
- (3)
- Making fundamental changes to the economic growth mode and ensuring the efficient use of natural resources to achieve the goal of getting the biggest possible economic and social benefits using the least possible resources and with minimal environmental impact.
- (4)
- Increasing people’s incomes, eliminating excessive income gaps, and enhancing the social security system to stimulate household consumption and boost domestic demand.
5.4. Guaranteeing the Implementation of Policies in NNUP
6. Conclusions
Acknowledgments
Author Contributions
Conflicts of Interest
Appendix
| Basic Level Indicators | Definitions and Calculation | Unit | Data Source |
|---|---|---|---|
| C1 1 | (Registered urban unemployment people)/(Total registered urban unemployment and employment people) | % | RE * [42] |
| C2 1 | (Total building space of urban household)/(The number of total urban population) | m2 | RE * [42] |
| C3 2 | (Urban per capita consumption expenditure) 1/(Urban per capita disposable income) 1 | % | RE * [42] |
| D1 1 | (Total amount of water supply)/(The number of total urban population) | L | UC [40] |
| D2 2 | (Total electricity consumption) 1/(Total GDP) 1 | KWh | CSY * [41] |
| D3 2 | (Total area of urban construction land) 1/(The number of total urban population) 1 | m2 | UC * [40] |
| D4 2 | (Total length of water supply and drainage pipelines in built district) 1/(Total area of built district) 1 | Km−1 | UC [40] |
| D5 2 | (Total length of road network in built district) 1/( Total area of built district) 1 | Km−1 | UC [40] |
| E1 1 | (Total amount of waste water centralized treated of sewage work)/( Total amount of waste water) | % | UC * [40] |
| E2 1 | (Total volume of consumption wastes treated)/(Total volume of consumption wastes) | % | UC * [40] |
| E3 1 | (Total area of green coverage in built district)/(Total area of built district) | % | UC [40] |
| E4 1 | (The sum of daily average concentration of PM 2.5)/(The number of valid days) | μg/m3 | SEDAC of NASA |
| Se1 1 | (Total GDP)/( The number of total urban population) | Yuan | CSY |
| Se2 1 | (Total paid wages of workers)/(The average number of workers) | Yuan | RE * [42] |
| Se3 2 | (Total retail sales of consumer goods) 1/( The number of total urban population) 1 | Yuan | CSY * [41] |
| Se4 1 | (Total output-value of tertiary industry)/(Total GDP) | % | CSY [41] |
| Ss1 2 | (Public financial expenditure on science and technology) 1/(Total public financial expenditure) 1 | % | CSY [41] |
| Ss2 2 | (Public financial expenditure on education) 1/(Total public financial expenditure) 1 | % | CSY [41] |
| Ss3 1 | (Total collections of public libraries×100)/(The number of total urban population) | Piece | CSY [41] |
| Ss4 1 | (Total number of public transportation vehicles × 10000)/(The number of total urban population) | Vehicle | CSY * [41] |
| Ss5 2 | (Total number of beds of hospitals and health centers × 10000)1/(The number of total urban population) 1 | Bed | CSY [41] |
| Ss6 1 | (The number of urban population with water)/(The number of total urban population) | % | UC [40] |
| Ss7 1 | (The number of urban population using gas)/(The number of total urban population) | % | UC [40] |
| U1 2 | (Urban per capita disposable income) 1/(Rural per capita net income) 1 | % | RE * [42] |
| U2 2 | (Urban per capita consumption expenditure) 1/(Rural per capita consumption expenditure) 1 | % | RE * [42] |
References
- Zhang, Z.B.; Liu, R.; Huang, K. Annual Report on the Healthy Development of China’s New Urbanization; Press of Social Science: Beijing, China, 2014. [Google Scholar]
- Shen, L.; Zhou, J. Examining the effectiveness of indicators for guiding sustainable urbanization in China. Habitat Int. 2014, 44, 111–120. [Google Scholar] [CrossRef]
- Ann, T.; Wu, Y.Z.; Zheng, B.B.; Zhang, X.L.; Shen, L.Y. Identifying risk factors of urban-rural conflict in urbanization: A case of China. Habitat Int. 2014, 44, 177–185. [Google Scholar]
- Chen, J.; Guo, F.; Wu, Y. One decade of urban housing reform in China: Urban housing price dynamics and the role of migration and urbanization, 1995–2005. Habitat Int. 2011, 35, 1–8. [Google Scholar] [CrossRef]
- Gong, P.; Song, L.; Elizabeth, J.C.; Jiang, Q.W.; Wu, J.Y.; Justin, V.R. Urbanisation and health in China. Lancet 2012, 379, 843–852. [Google Scholar] [CrossRef]
- He, C.Y.; Liu, Z.F.; Tian, J.; Qun, M. Urban expansion dynamics and natural habitat loss in China: A multiscale landscape perspective. Glob. Change Biol. 2014, 20, 2886–2902. [Google Scholar] [CrossRef] [PubMed]
- Tosics, I. The Chinese urban development dilemma: Heritage and green areas as victims of rapid urbanization. Mazowsze Stud. Reg. 2012, 9, 87–100. [Google Scholar]
- Gu, C.L.; Wu, L.Y.; Ian, C. Progress in research on Chinese urbanization. Front. Archit. Res. 2012, 1, 101–149. [Google Scholar]
- Fang, C. Strategic direction of the transformation of China’s new urbanization development. Resour. Environ. Dev. 2014, 2, 18–26. [Google Scholar]
- Fang, C. Report on New Urbanization Development of China; Press of Social Science: Beijing, China, 2014. [Google Scholar]
- Xu, H. National New Urbanization Planning-Expert Interpretation. Available online: http://www.banyuetan.org/chcontent/zx/yw/2014317/96663.html (accessed on 15 January 2016). (In Chinese)
- Yao, S.-M.; Zhang, P.-Y.; Yu, C.; Li, G.-Y.; Wang, C.-X. The theory and practice of new urbanization in China. Sci. Geogr. Sini. 2014, 34, 641–647. [Google Scholar]
- Yu, L. Low carbon eco-city: New approach for Chinese urbanisation. Habitat Int. 2014, 44, 102–110. [Google Scholar] [CrossRef]
- Chai, H.-H.; Gu, H.-Y.; Zhang, Q.-H. A literature review on the existing research of China’s rural urbanization. J. Econ. Geogr. 2009, 4, 654–661. [Google Scholar]
- Gu, C.-L.; Pang, H.-F. Evolution of Chinese urbanization spaces: Kernel spatial approach. Sci. Geogr. Sin. 2009, 29, 10–14. [Google Scholar]
- Li, Y.K.; Lu, Y.J.; Young Hoon, K.; Dong, S. Developing a city-level multi-project management information system for Chinese urbanization. Int. J. Proj. Manag. 2015, 33, 510–527. [Google Scholar] [CrossRef]
- Yu, T.; Zhang, J.X.; Luo, X.L. The Research on Urbanization Quality of County-Level Cities in Eastern Developed Area of China—A Case Study of Changshu City. Urban Stud. 2010, 11, 7–12. [Google Scholar]
- Ji, Y.H.; Li, J.W. International comparison of Chinese urbanization. Urban Stud. 2004, 3, 1–10. [Google Scholar]
- Zhou, D.; Xu, J.C.; Wang, L.; Lin, Z.L. Assessing urbanization quality using structure and function analyses: A case study of the urban agglomeration around Hangzhou Bay (UAHB), China. Habitat Int. 2015, 49, 165–176. [Google Scholar] [CrossRef]
- Liu, H.M. Comprehensive carrying capacity of the urban agglomeration in the Yangtze River Delta, China. Habitat Int. 2012, 36, 462–470. [Google Scholar] [CrossRef]
- Shen, J.F. Chinese urbanization and urban policy. China Rev. 2000, 1, 455–480. [Google Scholar]
- Niu, W.Y. Essential Points of Strategic Design of Chinese New-Approach Urbanization. Bull. Chin. Acad. Sci. 2009, 2, 005. [Google Scholar]
- Cash, D.W.; Clark, W.C.; Alcock, F.; Dickson, N.M.; Eckley, N.; Guston, D.H.; Jäger, J.; Mitchell, R.B. Knowledge systems for sustainable development. Proc. Natl. Acad. Sci. USA 2003, 100, 8086–8091. [Google Scholar] [CrossRef] [PubMed]
- Hopwood, B.; Mellor, M.; O’Brien, G. Sustainable development: Mapping different approaches. Sustain. Dev. 2005, 13, 38–52. [Google Scholar] [CrossRef]
- Costanza, R.; D’Arge, R.; de Groot, R.; Farber, S.; Grasso, M.; Hannon, B.; Limburg, K.; Naeem, S.; O’Neill, R.V.; Paruelo, J.; et al. The value of the world’s ecosystem services and natural capital. Ecol. Econ. 1998, 1, 3–15. [Google Scholar] [CrossRef]
- Diamantini, C.; Zanon, B. Planning the urban sustainable development The case of the plan for the province of Trento, Italy. Environ. Impact Assess. Rev. 2000, 20, 299–310. [Google Scholar] [CrossRef]
- Nations, U. Indicators of Sustainable Development: Guidelines and Methodologies, 3rd ed.; UNDESA: New York, NY, USA, 2007. [Google Scholar]
- UN Habitat. Urban Indicator Guidelines: Better Information, Better Cities; UN Habitat: Nairobi, Kenya, 2009. [Google Scholar]
- Bank, W. World Development Indicators: 2013; World Bank: Washington, DC, USA, 2013. [Google Scholar]
- Gu, L.J. Low Carbon City: The New Idea of Chinese Urbanization. Future Dev. 2010, 3, 2–5. [Google Scholar]
- Cheng, C.J. Dynamic Quantitative Analysis on Chinese Urbanization and Growth of Service Sector. In LISS 2012; Springer: Berlin, Germany, 2013; pp. 663–670. [Google Scholar]
- Bai, X. The Measurement Analysis and Empirical Research of China’s Urbanization Process; Hohai University: Nanjing, China, 2004. [Google Scholar]
- Fang, C.; Wang, D.L. Comprehensive measures and improvement of Chinese urbanization development quality. Geogr. Res. 2011, 11, 1931–1946. [Google Scholar]
- Tan, R.H.; Liu, Y.L.; Liu, Y.F.; He, Q.S.; Ming, L.C.; Tang, S. Urban growth and its determinants across the Wuhan urban agglomeration, central China. Habitat Int. 2014, 44, 268–281. [Google Scholar] [CrossRef]
- Agency, X.N. China will Build 20 Urban Agglomerations with Three Types, Focusing on the Construction of Pearl River Delta and so on Five Big Urban Agglomeration. Available online: http://news.xinhuanet.com/house/cq/2015-01-15/c_1113997434.htm (accessed on 15 January 2016). (In Chinese)
- Wei, H.K.; Wang, Y.Q.; Su, H.J.; Guo, Y.B. A comprehensive report of Chinese urbanization quality. Rev. Econ. Res. 2013, 31, 3–32. [Google Scholar]
- Zhao, J.J.; Chai, L.H. A novel approach for urbanization level evaluation based on information entropy principle: A case of Beijing. Phys. A Stat. Mech. Its Appl. 2015, 430, 114–125. [Google Scholar] [CrossRef]
- Li, F.; Liu, X.S.; Wang, R.D.; Yang, W.R.; Li, D.; Zhao, D. Measurement indicators and an evaluation approach for assessing urban sustainable development: A case study for China’s Jining City. Landsc. Urban Plan. 2009, 90, 134–142. [Google Scholar] [CrossRef]
- Feng, S.L.; Huang, W.G.; Wang, J.; Wang, M.Q.; Zha, J. Low-carbon City and New-type Urbanization: Proceedings of Chinese Low-carbon City Development International Conference; Springer: Berlin, Germany, 2015. [Google Scholar]
- Ministry of Housing and Urban-Rural Development of the People’s Republic of China. China Urban Construction Statistical Yearbook; China Planning Press: Beijing, China, 2013. [Google Scholar]
- Department of Urban Surveys of National Bureau of Statistics. China City Statistical Yearbook; China Statistics Press: Beijing, China, 2013. [Google Scholar]
- Department of Comprehensive Statistics of National Bureau of Statistics. China Statistical Yearbook for Regional Economy; China Statistics Press: Beijing, China, 2013. [Google Scholar]
- Socioeconomic Data and Applications Center (SEDAC) of National Aeronautics and Space Administration (NASA). Available online: http://sedac.ciesin.columbia.edu/data/set/sdei-global-annual-avg-pm2-5-2001-2010/data-download (accessed on 15 January 2016).
- Gong, Y.B.; Zhang, J.G.; Liang, X.C. Water Quality Assessment of East Route Based on Entire-array-polygon Evaluation Method. China Popul. Resour. Environ. 2011, 9, 26–31. [Google Scholar]
- Cheng, L.; Dong, J. Evalution on intensive land use of Wuhan metropolitan agglomeration based on entire-aggay-polygon evaluation model. Res. Soil Water Conserv. 2014, 1, 183–187. [Google Scholar]
- Chen, M.X.; Huang, Y.B.; Tang, Z.P.; Lu, D.D.; Liu, H.; Ma, L. The provincial pattern of the relationship between urbanization and economic development in China. J. Geogr. Sci. 2014, 24, 33–45. [Google Scholar] [CrossRef]
- Chen, M.X.; Liu, W.D.; Tao, X.L. Evolution and assessment on China’s urbanization 1960–2010: Under-urbanization or over-urbanization? Habitat Int. 2013, 38, 25–33. [Google Scholar] [CrossRef]
© 2016 by the authors; licensee MDPI, Basel, Switzerland. This article is an open access article distributed under the terms and conditions of the Creative Commons by Attribution (CC-BY) license (http://creativecommons.org/licenses/by/4.0/).
Share and Cite
Xu, C.; Wang, S.; Zhou, Y.; Wang, L.; Liu, W. A Comprehensive Quantitative Evaluation of New Sustainable Urbanization Level in 20 Chinese Urban Agglomerations. Sustainability 2016, 8, 91. https://doi.org/10.3390/su8020091
Xu C, Wang S, Zhou Y, Wang L, Liu W. A Comprehensive Quantitative Evaluation of New Sustainable Urbanization Level in 20 Chinese Urban Agglomerations. Sustainability. 2016; 8(2):91. https://doi.org/10.3390/su8020091
Chicago/Turabian StyleXu, Cong, Shixin Wang, Yi Zhou, Litao Wang, and Wenliang Liu. 2016. "A Comprehensive Quantitative Evaluation of New Sustainable Urbanization Level in 20 Chinese Urban Agglomerations" Sustainability 8, no. 2: 91. https://doi.org/10.3390/su8020091
APA StyleXu, C., Wang, S., Zhou, Y., Wang, L., & Liu, W. (2016). A Comprehensive Quantitative Evaluation of New Sustainable Urbanization Level in 20 Chinese Urban Agglomerations. Sustainability, 8(2), 91. https://doi.org/10.3390/su8020091