Abstract
For the purpose of the sustainable development in the global semiconductor industry, emerging three-dimensional integrated circuit (3DIC) integration technologies have demonstrated their importance as potential candidates for extending the lifespan of Moore’s Law. This study aimed to explore a technology selection process involving a three-stage fuzzy multicriteria decision-making (MCDM) approach to facilitate the effective assessment of emerging 3DIC integration technologies. The fuzzy Delphi method was first used to determine the important criteria. The fuzzy analytic hierarchy process (fuzzy AHP) was then adopted to derive the weights of the criteria. The fuzzy technique for order of preference by similarity to ideal solution (fuzzy TOPSIS) was finally deployed to rate the alternatives. Empirical results indicate that market potential, time-to-market, and heterogeneous integration are the top three decision criteria for the selection of 3DIC integration technologies. Furthermore, 2.5D through-silicon interposer (TSI) is of primary interest to the Taiwanese semiconductor industry, followed by 3DIC through-silicon via (TSV), 3D packaging, and 3D silicon TSV (Si TSV). The proposed three-stage fuzzy decision model may potentially assist industry practitioners and government policy-makers in directing research and development investments and allocating resources more strategically.
1. Introduction
1.1. Background and Motive for Study
After six years since the introduction of the first commercial planar transistor in 1959, Moore’s Law has been recognized as a golden rule guiding the technological evolution of the semiconductor industry [1]. However, Moore’s law will cease to work beyond the 7 nanometer geometry in the foreseeable future due to considerable research and development (R and D) spending for the development of disruptive technologies [2]. Conversely, for the purpose of the sustainable development in the global semiconductor industry, emerging three-dimensional integrated circuit (3DIC) integration technologies have demonstrated their importance as potential candidates for extending the lifespan of Moore’s Law [3]. The semiconductor industry has disclosed several alternative 3DIC integration technologies so far, but the prioritization and selection of optimal alternatives among these emerging technologies for Taiwanese semiconductor manufacturing firms remain undetermined. Consequently, effective evaluation and selection of 3DIC integration technologies under resource constraints are critical to the overall success of Taiwanese semiconductor manufacturing firms. In this regard, this study aimed to explore a technology selection process involving a three-stage fuzzy multicriteria decision-making (MCDM) approach to facilitate the effective assessment of emerging 3DIC integration technologies.
1.2. Technology Selection Using Fuzzy MCDM
Several research studies used fuzzy MCDM approaches to evaluate, prioritize, and select the optimal emerging technologies. Tavana, et al. [4] proposed a hybrid fuzzy group decision support framework for technology assessment at the National Aeronautics and Space Administration (NASA). The proposed framework comprised two modules. In the first module, the complicated structure of the assessment criteria and alternatives were represented and evaluated with the fuzzy analytic network process (fuzzy ANP). In the second module, the alternative advanced-technology projects were ranked by using a customized fuzzy technique for order of preference by similarity to ideal solution (fuzzy TOPSIS). Van de Kaa, et al. [5] used a fuzzy MCDM approach to select the optimal alternative from five photovoltaic (PV) technologies. By applying the fuzzy analytic hierarchy process (AHP) method, they determined these factors’ importance and one of these five technologies’ chances of becoming the dominant PV technology. Dat, et al. [6] proposed an extension of the fuzzy MCDM approach for selecting solar PV energy technologies, where the ratings of PV technologies under various criteria and the weights of the criteria were assessed in linguistic terms, represented by triangular fuzzy numbers. Bose [7] used a fuzzy MCDM technique to select significant process parameters of the electrochemical grinding process. Ilangkumaran, et al. [8] used a hybrid fuzzy MCDM approach to select the appropriate waste water treatment technology (WWT) for treating wastewater. The fuzzy AHP method was used to determine the weights of the criteria, and then the ranking of WWT technology alternatives was determined by the hierarchy gray relation analysis (GRA) technique. Demirtaş, et al. [9] used both fuzzy AHP and ANP methods to select the best e-purse smart card technology providing the most customer satisfaction. The fuzzy AHP was used to calculate the priority weights of the criteria, and the ANP was used to select the best e-purse smart card technology. Vinodh, et al. [10] used the fuzzy Vise Kriterijumska Optimizacija I Kompromisno Resenje (VIKOR) method for selecting the appropriate rapid prototyping (RP) technologies in an agile environment.
In consideration of the relevant literature mentioned above, this study’s contribution is the proposal of a technology selection process consisting of a three-stage fuzzy MCDM approach to facilitate the effective assessment of emerging 3DIC integration technologies. Furthermore, none of the research conducted so far has used the fuzzy MCDM to evaluate 3DIC integration technologies. Hence, this study could be a forerunner by using fuzzy MCDM methods to specifically evaluate 3DIC integration technologies. As shown in Figure 1, the proposed fuzzy MCDM model consists of three methods: (1) fuzzy Delphi method; (2) fuzzy AHP method; and (3) fuzzy TOPSIS method. The fuzzy Delphi method is used to determine the important criteria for building a structural hierarchy. The fuzzy AHP is then adopted to derive the weights of the criteria for investigating them. Finally, the fuzzy TOPSIS is deployed to rate these alternatives for making decisions among them.
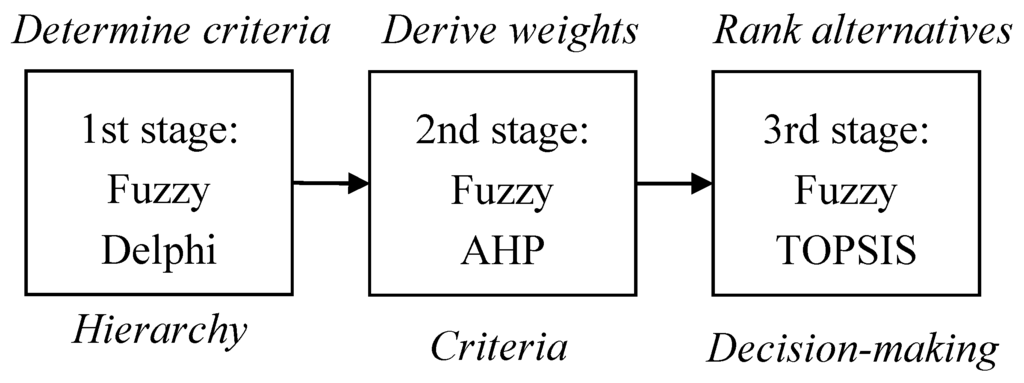
Figure 1.
The three-stage technology selection process.
The rest of this paper was organized as follows. Section 2 described the details of emerging 3DIC integration technologies. Section 3 presented the three-stage fuzzy MCDM approach. Section 4 conducted an empirical analysis of the Taiwanese semiconductor industry. Finally, Section 5 provided the concluding remarks.
2. Perspectives on 3DIC Integration Technologies
While significant R and D efforts have been expended on various planar approaches, 3DIC integration technologies are undoubtedly gaining momentum as potential pioneers in the challenge to meet the demands of the form factor, performance, and cost through this decade and beyond [3,11]. This study conducted expert interviews after reviewing the relevant literature to identify the four alternative 3DIC integration technologies—3DIC packaging, 3DIC through-silicon via (3DIC TSV), 3D silicon TSV (3D Si TSV), and 2.5D through-silicon interposer (2.5D TSI)—that are mostly the concern of the Taiwanese semiconductor industry.
2.1. 3DIC Packaging
The most prevalent technology for 3DIC integration appears to be 3DIC packaging. The 3DIC packaging technologies exploit a z-axis dimension to provide a volumetric packaging solution for higher integration and performance, as well as to save space by stacking either separate chips or separate packages in a single package [11]. The two types of 3DIC packaging technologies are coined as “die stacking” or “package stacking” technologies [12]. Die stacking is the process of mounting multiple chips on top of each other vertically within a single package. Package stacking involves stacking discrete packages on top of each other, where the chips are individually wire-bonded onto the substrate and then connected together at the edge of the package.
2.2. 3DIC TSV
The 3DIC TSV is an innovative interconnection technology that involves stacking individual wafers or individual dies to create customized multilayer multifunctional devices. They are vertically bonded together in either the wafer-to-wafer (W2W) or die-to-wafer form, using metalized pillars as the interconnection matter [12]. The TSV formation process can be divided simply into the following four steps: (1) drilling holes on a silicon wafer through etching or laser techniques; (2) filling these holes with conductive materials; (3) thinning the chips; and (4) bonding the stacked chips. The 3DIC TSV substantially enables shorter electrical paths, smaller footprints, and greater silicon performance than traditional 2D SiP or SoC technologies.
2.3. 3D Si TSV
The 3D Si TSV concept is little different from that of 3DIC TSV. The major distinction is that 3DIC TSV stacks up the chips with TSV and solder bumps, while 3D Si TSV stacks up the wafers with TSV alone (i.e., bump-less) [12]. The advantages of 3D Si integration over 3D IC integration include (1) better electrical performance; (2) less power; (3) smaller profile; (4) less weight; and (5) higher throughput. Generally, the industry favors 3D Si TSV, but tremendous works remain to be done, such as via formation, thin-wafer handling, design and process parameter optimization, W2W bonding alignment, contact reliability, electronic design automation (EDA) readiness, thermal management, and so on.
2.4. 2.5D TSI
The 2.5D TSI uses one layer of either the silicon or glass interposer to connect different dies on the same horizon with package substrates [13]. The silicon interposer provides a feasible way to increase chips’ density with the redistribution of circuitry. The dies are attached to a silicon interposer by using micro-bumps; meanwhile, the silicon interposer is attached to a package substrate by using regular flip-chip bumps. The tracks on the silicon interposer’s topside and backside metal layers are created by using the same processes as those of tracks on the silicon chips. Several industry practitioners think that 2.5D TSI is, perhaps, being too easily dismissed as a stepping stone to true 3DIC TSV designs, but it has the distinct advantage of taking minor adjustments to current design flows and the manufacturing chain [14]. Hence, 2.5D TSI is expected as a potential candidate for 3DIC integration technologies during the transition period.
3. Three-Stage Fuzzy MCDM for Evaluating 3DIC Integration Technologies
Compared to traditional binary sets, fuzzy logic variables may have a membership value that ranges in degree between 0 and 1 [15]. Thus, fuzzy logic offers a more realistic mode for human reasoning than the traditional two-valued logic. In view of the applicability of fuzzy prioritized operators [16,17], this study integrated the fuzzy set theory with three MCDM methods to establish a three-stage technology selection process. This section, therefore, presents the three fuzzy MCDM methods (fuzzy Delphi, fuzzy AHP, and fuzzy TOPSIS) to be applied later to the empirical example.
3.1. Fuzzy Delphi Method
Noorderhaven [18] indicated that applying the fuzzy Delphi method to a group decision can solve the fuzziness of the common understanding of expert opinions. This study applied the double triangular membership function to solve the group decision, as shown in Figure 2, since it could well testify whether the experts’ judgments would reach unanimity by using a gray zone test through the overlapping situation of two triangular fuzzy numbers [19]. One of the two triangular fuzzy numbers, denoted as , represents all of the experts’ most optimistic cognitions for each criterion; the other triangular fuzzy number, denoted as , signifies all of the experts’ most conservative cognitions for each criterion. A gray zone test may reveal three situational types:
- (1)
- No overlap exists between the two triangular fuzzy numbers (). The arithmetic mean is acquired through the geometric mean and .
- (2)
- If , the values of and are first acquired. If the crosspoint of the two triangular fuzzy numbers is equal to the value of the experts’ consensus in the gray zone , the level of membership in the gray zone is , where .
- (3)
- If and , the value of the experts’ consensus cannot be converged, and the tests should be refined again, with the reference value attached.
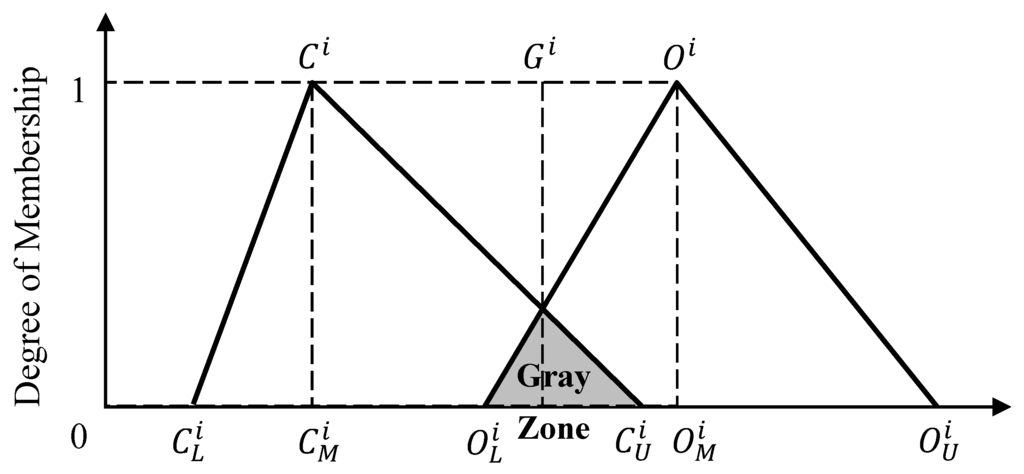
Figure 2.
Double triangular fuzzy numbers.
Finally, the important criteria can be selected if the consensus values are greater than a given threshold value and, hence, can be used for building a structural hierarchy.
3.2. Fuzzy AHP
The AHP is one of the MCDM methods based on an additive weighting process, in which the multi-attribute weight measurements are calculated through pairwise comparisons of the relative importance of every pair of criteria [20]. However, the fuzzy AHP can reflect the human thinking style by converting experts’ crisp values to fuzzy numbers in the paired comparison of matrices; thus, it can solve the hierarchical fuzzy problems. The procedures of the fuzzy AHP were described as follows:
- (1)
- Establish a hierarchical structure.
Determine the important criteria screened by fuzzy Delphi investigations to establish the hierarchical structure.
- (2)
- Construct fuzzy decision matrices.
Compare the relative importance of the criteria in pairs, and convert crisp values to fuzzy numbers for constructing fuzzy decision matrices based on a defined membership function of linguistic variables.
A fuzzy decision matrix can be defined as:
where is the fuzzy decision matrix of evaluator k, is the fuzzy assessments between criterion i and criterion j of evaluator k, and n is the number of criteria at the same level:
- (3)
- Test the consistency.
To verify whether a pairwise comparison matrix is sufficiently consistent, the maximum eigenvalue can be computed as:
where A is a pairwise comparison matrix, and W is a weight matrix.
Saaty [21] defined a consistency index (CI) to test the consistency within the pairwise comparison matrices, as well as that of entire hierarchy. The CI is formulated as follows:
where is the maximum eigenvalue, and n is the dimension of the matrix.
The consistency ratio (CR) is accordingly defined as follows:
where RI is the random consistency index.
The matrix will be considered consistent if the resulting ratio is less than 0.1. Csutora and Buckley [22] further demonstrated that if a crisp decision matrix R was consistent, then the corresponding fuzzy decision matrix would, accordingly, be consistent.
- (4)
- Perform defuzzification.
Adopt the method of converting fuzzy data to crisp scores (CFCS), developed by Opricovic and Tzeng [23] for performing defuzzification. Let indicate the fuzzy assessments between criterion i and criterion j of evaluator k. The steps of CFCS method were described as follows:
Step 1. Perform normalization:
where
Step 2. Compute the lower (ls) and upper (us) normalized value:
and
Step 3. Compute the total normalized crisp value:
Step 4. Compute the crisp value:
where are the crisp assessments between criterion i and criterion j of evaluator k.
Step 5. Integrate the crisp values:
where is the integrated crisp assessment of criterion i and criterion j of total K evaluators.
- (5)
- Establish an aggregate crisp decision matrix.
- (6)
- Calculate criteria weights.
Obtain eigenvector value of the aggregate crisp decision matrix by using a row vector geometric mean technique:
Following the above-mentioned procedures of the fuzzy AHP, the weights of the criteria can be effectively obtained.
3.3. Fuzzy TOPSIS
Hwang and Yoon [24] first proposed the TOPSIS to solve multiple-attribute decision-making (MADM) problems by using the concept of the optimal compromise solution. The algorithm of TOPSIS considers both the positive ideal solution (PIS) and the negative ideal solution (NIS) to determine the optimal solution to a multiple-objective decision-making (MODM) problem [25]. The TOPSIS was then extended to the fuzzy environment, namely the fuzzy TOPSIS, to suit the real world. The procedures of the fuzzy TOPSIS were described as follows:
- (1)
- Obtain the fuzzy weights of the criteria.This study employs the fuzzy AHP to obtain the fuzzy preference weights of the criteria.
- (2)
- Construct the fuzzy decision matrix and determine the appropriate linguistic variables for the alternatives, with respect to criteria:where is the performance rating of alternative , with respect to criterion , evaluated by the kth expert, and K is the total number of experts.
- (3)
- Normalize the fuzzy decision matrix.The normalized fuzzy decision matrix can be expressed as:Then the weighted fuzzy normalized decision matrix can be expressed as:
- (4)
- Determine the fuzzy positive ideal solution (FPIS) and the fuzzy negative ideal solution (FNIS).The FPIS (aspiration levels) and FNIS (worst levels) can be defined as [26,27]:and
- (5)
- Calculate the distance of each alternative from the FPIS and the FNIS.
The distances ( and ) of each alternative from and can be obtained through the following calculations:
and
- (6)
- Obtain the closeness coefficients and improve the gap degrees for achieving the aspiration levels:where is defined as the fuzzy satisfaction degree and is defined as the fuzzy gap degree.
Following the above-mentioned procedures of fuzzy TOPSIS, the alternative 3DIC integration technologies can be effectively prioritized and selected.
4. Empirical Analysis of Taiwanese Semiconductor Industry
The effective selection and investment in 3DIC integration technologies under strategic planning help the Taiwanese semiconductor industry stay competitive in the global market. In this regard, this section formulated and described an empirical analysis on the basis of the aforementioned methodology.
4.1. First Stage: Determine Important Criteria Using Fuzzy Delphi Method
This study first explored 14 criteria associated with technology evaluation themes through the literature review and expert interviews. Sixteen experts—sourced from the entire supply chain of Taiwan’s semiconductor industry—used an interval range (0–10) to evaluate the 14 criteria. The opinions of the 16 experts, as expressed in the fuzzy Delphi questionnaires, were then converted to triangular fuzzy numbers. Next, the consensus value of each criterion was obtained through the fuzzy Delphi calculation, as shown in Table 1. The threshold value (6.33) was then determined by calculating the arithmetic mean of all geometric means of the gray zone. Based on the fuzzy Delphi method, a general consensus among the 16 experts can be reached to select the six important criteria whose consensus values are all greater than 6.33.

Table 1.
Fuzzy Delphi screening results.
| No. | Criteria | Gray Zone | Consensus | Result |
|---|---|---|---|---|
| 1 | Technological innovation | (5, 6) | 5.44 | Ingored |
| 2 | Technical feasibility | (7, 8) | 7.62 | Selected |
| 3 | Manufacturing capability | (7, 8) | 7.37 | Selected |
| 4 | Patent portfolio | (4, 6) | 4.93 | Ingored |
| 5 | Strategic importance | (4, 6) | 5.18 | Ingored |
| 6 | Market potential | No overlap | 9.05 | Selected |
| 7 | Market application | (4, 5) | 4.53 | Ingored |
| 8 | Time-to-market | (8, 9) | 8.86 | Selected |
| 9 | Customer satisfaction | (4, 6) | 5.07 | Ingored |
| 10 | Product performance | (8, 9) | 8.46 | Selected |
| 11 | Cost effectiveness | (4, 6) | 4.89 | Ingored |
| 12 | Heterogeneous integration | (8, 9) | 8.61 | Selected |
| 13 | Supply chain management | (4, 5) | 4.54 | Ingored |
| 14 | Profitability | (3, 5) | 4.12 | Ingored |
4.2. Second Stage: Derive the Weights of Criteria Using Fuzzy AHP
A hierarchical model of the 3DIC integration technology selection was established (as shown in Figure 3), according to the results presented in Table 1, the principle of the fuzzy AHP, and the technology alternatives mentioned in Section 2.
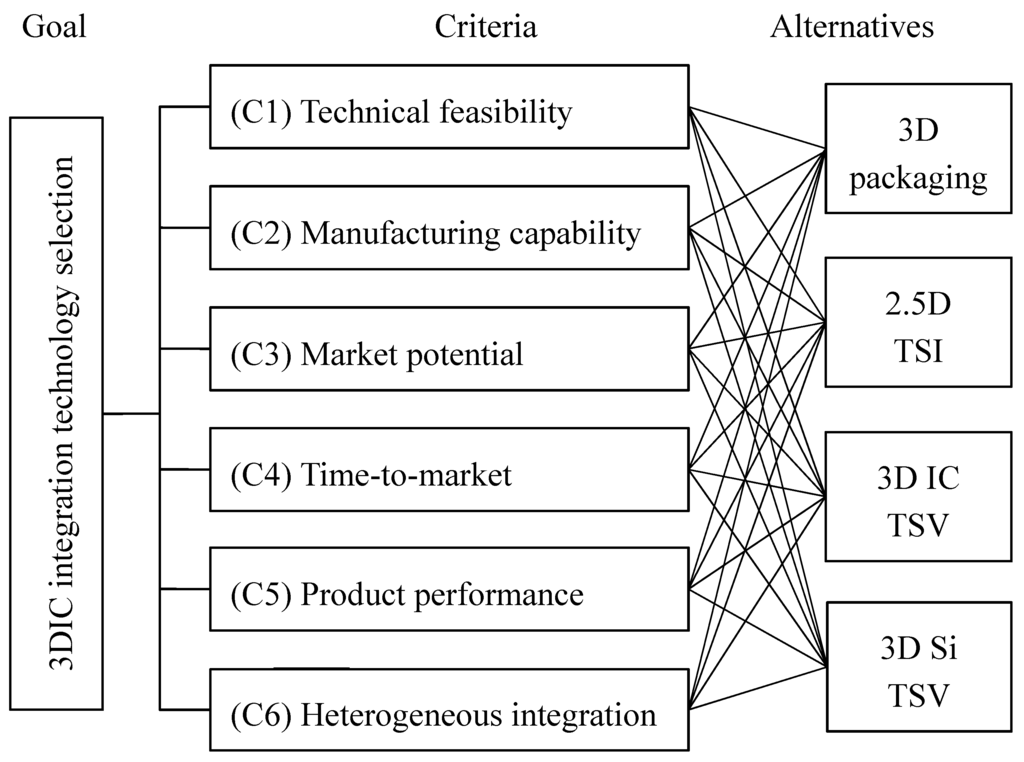
Figure 3.
Hierarchical model of 3DIC integration technology selection.
Next, the weights of the criteria were calculated through the fuzzy AHP steps, as follows:
- (1)
- Design the questionnaire.
A typical AHP questionnaire to obtain the 16 experts’ perceptions was designed in the form of pairwise comparisons based on the hierarchical structure. The questionnaire used a nine-point rating scale representing the relative importance of each criterion in the hierarchical model.
- (2)
- Construct fuzzy decision matrices.
The crisp values sourced from the assessment of relative importance of the criteria in pairs were converted to fuzzy numbers, according to the definition of triangular fuzzy numbers in Table 2. The fuzzy decision matrices for the criteria were then generated by Equation (1). Table 3 shows an example of a fuzzy decision matrix from expert 1’s judgment.
- (3)
- Test the consistency.
The consistency of fuzzy decision matrices was tested by using Equations (5) and (6). If the subjective judgments of the 16 experts were inconsistent, the author asked them to repeat the pairwise comparison processes until the CI and CR values were less than 0.1. Table 3 shows an example of a consistency check from the fuzzy decision matrix of evaluator 1. The CI value is 0.024, and the RI value is 1.25. The CR value is then 0.020 (less than 0.1), indicating the consistency of the collected data in the questionnaires and the robustness of fuzzy decision matrix.
Table 2.
Triangular fuzzy numbers.
| Triangular Fuzzy Numbers | Linguistic Variables |
|---|---|
| = (1, 1, 1) | Equally important |
| = (1, 2, 3) | Intermediate |
| = (2, 3, 4) | Moderately more important |
| = (3, 4, 5) | Intermediate |
| = (4, 5, 6) | Strongly more important |
| = (5, 6, 7) | Intermediate |
| = (6, 7, 8) | Very strongly more important |
| = (7, 8, 9) | Intermediate |
| = (8, 9, 9) | Extremely more important |
Table 3.
Fuzzy decision matrix for evaluator 1.
| Criteria | C1 | C2 | C3 | C4 | C5 | C6 |
|---|---|---|---|---|---|---|
| C1 | (1, 1, 1) | (1, 2, 3) | (1/6, 1/5, 1/4) | (1/5, 1/4, 1/3) | (1/3, 1/2, 1) | (1/4, 1/3, 1/2) |
| C2 | (1/3, 1/2, 1) | (1, 1, 1) | (1/7, 1/6, 1/5) | (1/6, 1/5, 1/4) | (1/4, 1/3, 1/2) | (1/5, 1/4, 1/3) |
| C3 | (4, 5, 6) | (5, 6, 7) | (1, 1, 1) | (1, 2, 3) | (3, 4, 5) | (2, 3, 4) |
| C4 | (3, 4, 5) | (4, 5, 6) | (1/3, 1/2, 1) | (1, 1, 1) | (2, 3, 4) | (1, 2, 3) |
| C5 | (1, 2, 3) | (2, 3, 4) | (1/5, 1/4, 1/3) | (1/4, 1/3, 1/2) | (1, 1, 1) | (1/3, 1/2, 1) |
| C6 | (2, 3, 4) | (3, 4, 5) | (1/4, 1/3, 1/2) | (1/3, 1/2, 1) | (1, 2, 3) | (1, 1, 1) |
λmax = 6.122; CI = 0.024; RI = 1.25; CR = 0.020 ≤ 0.1.
- (4)
- Perform defuzzification.
This study adopted the aforementioned CFCS method to perform defuzzification. Equations (7)–(14) were applied to obtain the crisp decision matrices of the 16 experts. Table 4 presents an example of a crisp decision matrix from expert 1’s judgment. Equations (15) and (16) were then used to obtain the aggregate crisp decision matrix of the 16 experts, as shown in Table 5.
Table 4.
Crisp decision matrix for evaluator 1.
| Criteria | C1 | C2 | C3 | C4 | C5 | C6 |
|---|---|---|---|---|---|---|
| C1 | 1.000 | 1.955 | 0.201 | 0.253 | 0.568 | 0.345 |
| C2 | 0.561 | 1.000 | 0.168 | 0.203 | 0.355 | 0.258 |
| C3 | 4.964 | 5.929 | 1.000 | 2.071 | 4.000 | 3.036 |
| C4 | 3.967 | 4.928 | 0.540 | 1.000 | 3.007 | 2.046 |
| C5 | 2.007 | 2.935 | 0.252 | 0.342 | 1.000 | 0.558 |
| C6 | 2.981 | 3.929 | 0.340 | 0.549 | 2.032 | 1.000 |
Table 5.
Aggregate crisp judgment matrix.
| Criteria | C1 | C2 | C3 | C4 | C5 | C6 |
|---|---|---|---|---|---|---|
| C1 | 1.000 | 1.768 | 0.514 | 0.566 | 0.881 | 0.658 |
| C2 | 0.874 | 1.000 | 0.481 | 0.516 | 0.667 | 0.570 |
| C3 | 4.527 | 5.366 | 1.000 | 1.884 | 3.625 | 2.786 |
| C4 | 3.593 | 4.491 | 0.853 | 1.000 | 2.756 | 1.858 |
| C5 | 1.819 | 2.686 | 0.564 | 0.654 | 1.000 | 0.870 |
| C6 | 2.731 | 3.554 | 0.903 | 0.861 | 1.845 | 1.000 |
- (5)
- Calculate overall criteria weights
Equation (17) was used to calculate the weight of each criterion. Table 6 summarized the overall priority weights and ranking of the criteria for the 3DIC integration technology selection.
Table 6.
Weights of criteria for 3DIC integration technology selection.
| Criteria | Weights | Rank |
|---|---|---|
| (C1) Technical feasibility | 0.092 | 5 |
| (C2) Manufacturing capability | 0.074 | 6 |
| (C3) Market potential | 0.312 | 1 |
| (C4) Time-to-market | 0.228 | 2 |
| (C5) Product performance | 0.121 | 4 |
| (C6) Heterogeneous integration | 0.174 | 3 |
In view of the fuzzy AHP results, the first two important criteria for the 3DIC integration technology selection are market potential (0.312) and time-to-market (0.228). Moreover, the least important criterion is manufacturing capability (0.074).
4.3. Third Stage: Rate the Alternatives Using Fuzzy TOPSIS
The four alternative emerging 3DIC integration technologies formulated in Section 2 were evaluated and prioritized by the fuzzy TOPSIS, as follows.
- (1)
- Determine the appropriate linguistic variables, and construct the fuzzy decision matrix.
The 16 experts were requested to express their perceptions about the rating of every 3DIC integration technology regarding each criterion of linguistic variables, shown in Table 7. This study then used the average value approach to integrate the 16 experts’ fuzzy judgment values with respect to each criterion, as shown in Table 8.
Table 7.
Linguistic scales for the rating of each alternative.
| Linguistic Variables | Triangular Fuzzy Numbers |
|---|---|
| Very low (VL) | = (0, 0, 2) |
| Low (L) | = (0, 2, 4) |
| Medium (M) | = (2, 4, 6) |
| High (H) | = (4, 6, 8) |
| Very high (VH) | = (6, 8, 10) |
| Excellent (E) | = (8, 10, 10) |
Table 8.
The fuzzy decision matrix.
| Criteria | 3D Packaging | 2.5D TSI | 3DIC TSV | 3D Si TSV |
|---|---|---|---|---|
| C1 | (2.80, 4.80, 6.80) | (7.07, 9.07, 10) | (5.33, 7.33, 9.2) | (1.87, 3.87, 5.87) |
| C2 | (2.80, 4.80, 6.80) | (5.87, 7.87, 9.33) | (4.00, 6.00, 8.00) | (2.00, 4.00, 6.00) |
| C3 | (2.80, 4.80, 6.80) | (6.53, 8.53, 9.87) | (4.53, 6.53, 8.4) | (1.73, 3.73, 5.73) |
| C4 | (3.47, 5.47, 7.47) | (4.53, 6.53, 8.4) | (5.47, 7.47, 9.33) | (1.47, 3.47, 5.47) |
| C5 | (2.80, 4.80, 6.80) | (6.80, 8.80, 9.87) | (4.80, 6.80, 8.40) | (1.33, 3.33, 5.33) |
| C6 | (2.80, 4.80, 6.80) | (5.87, 7.87, 9.33) | (3.47, 5.47, 7.47) | (1.60, 3.60, 5.60) |
- (2)
- Check the consistency of the experts’ opinions.
A comparison matrix was established, based on each expert opinion for each alternative, using Saaty’s technique. Table 9 shows an example for the rating of the alternatives with respect to C1. According to Table 9, an example (see Table 10) for the comparison matrix of the alternatives with respect to C1, based on the first three experts’ opinions, were then established. The consistency check of experts’ opinions was tested by using Equations (5) and (6). As can be observed, the CR values of the first three experts’ opinions are less than 0.1; thus, these matrices are consistent, and the judgments about the alternatives with respect to C1 are acceptable.
Table 9.
An example for the rating of the alternatives with respect to C1.
| Expert | 3D Packaging | 2.5D TSI | 3DIC TSV | 3D Si TSV |
|---|---|---|---|---|
| E1 | 6 | 10 | 8 | 4 |
| E2 | 4 | 8 | 6 | 2 |
| E3 | 6 | 10 | 6 | 4 |
| E4 | 8 | 10 | 8 | 6 |
| E5 | 4 | 8 | 8 | 4 |
| E6 | 6 | 10 | 8 | 4 |
| E7 | 4 | 8 | 6 | 2 |
| E8 | 6 | 10 | 6 | 4 |
| E9 | 8 | 10 | 8 | 6 |
| E10 | 4 | 8 | 8 | 4 |
| E11 | 6 | 10 | 8 | 4 |
| E12 | 4 | 8 | 6 | 2 |
| E13 | 6 | 10 | 6 | 4 |
| E14 | 8 | 10 | 8 | 6 |
| E15 | 4 | 8 | 8 | 4 |
| E16 | 6 | 10 | 8 | 4 |
Table 10.
An example for the comparison of the alternatives with respect to C1.
| 3D Packaging | 2.5D TSI | 3DIC TSV | 3D Si TSV | ||
|---|---|---|---|---|---|
| E1 | 3D packaging | 1.00 | 0.60 | 0.75 | 1.50 |
| 2.5D TSI | 1.67 | 1.00 | 1.25 | 2.50 | |
| 3DIC TSV | 1.33 | 0.80 | 1.00 | 2.00 | |
| 3D Si TSV | 0.67 | 0.40 | 0.50 | 1.00 | |
| CR = 0.000 | |||||
| E2 | 3D packaging | 1.00 | 0.50 | 0.67 | 2.00 |
| 2.5D TSI | 2.00 | 1.00 | 1.33 | 4.00 | |
| 3DIC TSV | 1.50 | 0.75 | 1.00 | 3.00 | |
| 3D Si TSV | 0.50 | 0.25 | 0.33 | 1.00 | |
| CR = 0.025 | |||||
| E3 | 3D packaging | 1.00 | 0.60 | 1.00 | 1.50 |
| 2.5D TSI | 1.67 | 1.00 | 1.67 | 2.50 | |
| 3DIC TSV | 1.00 | 0.60 | 1.00 | 1.50 | |
| 3D Si TSV | 0.67 | 0.40 | 0.67 | 1.00 | |
| CR = 0.012 | |||||
- (3)
- Normalize the fuzzy decision matrix.
Using Equations (20) and (21), the fuzzy decision matrix was normalized to eliminate the deviations induced by different measurement units and scales, as shown in Table 11.
Table 11.
The normalized fuzzy decision matrix.
| Criteria | 3D Packaging | 2.5D TSI | 3DIC TSV | 3D Si TSV |
|---|---|---|---|---|
| C1 | (0.28, 0.48, 0.68) | (0.71, 0.91, 1) | (0.53, 0.73, 0.92) | (0.19, 0.39, 0.59) |
| C2 | (0.3, 0.51, 0.73) | (0.63, 0.84, 1) | (0.43, 0.64, 0.86) | (0.21, 0.43, 0.64) |
| C3 | (0.28, 0.49, 0.69) | (0.66, 0.86, 1) | (0.46, 0.66, 0.85) | (0.18, 0.38, 0.58) |
| C4 | (0.37, 0.59, 0.8) | (0.49, 0.7, 0.9) | (0.59, 0.8, 1) | (0.16, 0.37, 0.59) |
| C5 | (0.28, 0.49, 0.69) | (0.69, 0.89, 1) | (0.49, 0.69, 0.85) | (0.14, 0.34, 0.54) |
| C6 | (0.3, 0.51, 0.73) | (0.63, 0.84, 1) | (0.37, 0.59, 0.8) | (0.17, 0.39, 0.6) |
- (4)
- Establish the weighted fuzzy normalized decision matrix.
Using Equations (22) and (23), the weighted fuzzy normalized decision matrix was established, as shown in Table 12.
Table 12.
The weighted fuzzy normalized decision matrix.
| Criteria | 3D Packaging | 2.5D TSI | 3DIC TSV | 3D Si TSV |
|---|---|---|---|---|
| C1 | (0.03, 0.04, 0.06) | (0.06, 0.08, 0.09) | (0.05, 0.07, 0.08) | (0.02, 0.04, 0.05) |
| C2 | (0.02, 0.04, 0.05) | (0.05, 0.06, 0.07) | (0.03, 0.05, 0.06) | (0.02, 0.03, 0.05) |
| C3 | (0.09, 0.15, 0.21) | (0.21, 0.27, 0.31) | (0.14, 0.21, 0.27) | (0.05, 0.12, 0.18) |
| C4 | (0.08, 0.13, 0.18) | (0.11, 0.16, 0.21) | (0.13, 0.18, 0.23) | (0.04, 0.08, 0.13) |
| C5 | (0.03, 0.06, 0.08) | (0.08, 0.11, 0.12) | (0.06, 0.08, 0.1) | (0.02, 0.04, 0.07) |
| C6 | (0.05, 0.09, 0.13) | (0.11, 0.15, 0.17) | (0.06, 0.10, 0.14) | (0.03, 0.07, 0.10) |
- (5)
- Determine the FPIS and FNIS reference points
Using Equations (24) and (25), FPIS (aspiration levels) and FNIS (worst levels) were determined, as shown in Table 13.
Table 13.
FPIS and FNIS.
| Criteria | FPIS A+ | FNIS A− |
|---|---|---|
| C1 | (0.09, 0.09, 0.09) | (0.02, 0.02, 0.02) |
| C2 | (0.07, 0.07, 0.07) | (0.02, 0.02, 0.02) |
| C3 | (0.31, 0.31, 0.31) | (0.05, 0.05, 0.05) |
| C4 | (0.23, 0.23, 0.23) | (0.04, 0.04, 0.04) |
| C5 | (0.12, 0.12, 0.12) | (0.02, 0.02, 0.02) |
| C6 | (0.17, 0.17, 0.17)) | (0.03, 0.03, 0.03) |
- (6)
- Estimate the performance, and rank the alternatives.
The distances of each alternative from the FPIS and FNIS reference points were calculated through Equations (26) and (27). The closeness coefficients of the four alternatives were then obtained by using Equation (28) (as shown in Table 14), after determining the distances from the FPIS and FNIS.
Table 14.
The closeness coefficients for the four alternatives.
| Rank | |||||
|---|---|---|---|---|---|
| 3D packaging | 0.386 | 0.514 | 0.429 | 0.571 | 3 |
| 2.5D TSI | 0.657 | 0.242 | 0.731 | 0.269 | 1 |
| 3DIC TSV | 0.541 | 0.358 | 0.602 | 0.398 | 2 |
| 3D Si TSV | 0.268 | 0.645 | 0.294 | 0.706 | 4 |
According to the results of Table 14, the satisfaction degree values of 3D packaging, 2.5D TSI, 3DIC TSV, and 3D Si TSV are 0.429, 0.731, 0.602, and 0.294, respectively. Therefore, the four alternatives have the following order of priority: 2.5D TSI, 3DIC TSV, 3D packaging, and 3D Si TSV. On the other hand, the gap degree values of 3D packaging, 2.5D TSI, 3DIC TSV, and 3D Si TSV for achieving aspiration levels are 0.571, 0.269, 0.398, and 0.706, respectively.
5. Concluding Remarks
Taiwan is one of the world’s largest suppliers of semiconductors and occupies an important position in the global semiconductor industry. Effective evaluation and selection of emerging 3DIC integration technologies under strategic planning help the Taiwanese semiconductor industry stay competitive in the global market. However, evaluating and selecting appropriate emerging technologies are among the most complex decision-making problems encountered by the top management of semiconductor firms. Several studies indicated that technology evaluation and selection constitute an MCDM issue that can be improved by integrating different methods. In recent years, an increasing number of studies have used either a fuzzy MCDM method or a hybrid fuzzy MCDM approach for selecting appropriate emerging technologies because they could deal with both multiple criteria issues and the linguistic ambiguity of experts’ judgments.
This study has also explored a technology selection process involving a three-stage fuzzy MCDM approach to facilitate the effective assessment of emerging 3DIC integration technologies. Each stage in the technology selection process has deployed a corresponding fuzzy MCDM method to achieve its function. First, the fuzzy Delphi method has been used to determine the six important criteria among 14 options: technical feasibility, manufacturing capability, market potential, time-to-market, product performance, and heterogeneous integration. Next, the fuzzy AHP has been adopted to derive the weights of the criteria. Market potential, time-to-market, and heterogeneous integration are the top three decision criteria with respect to the 3DIC integration technology selection. The empirical results indicated that the most important factor before proceeding with a technology is determining its market potential. Time-to-market is also an essential factor in fast-moving industries where products are quickly available for sale. Heterogeneous integration concerning the fusion degree of multifunctionality can effectively facilitate system miniaturization. Finally, the fuzzy TOPSIS has been deployed to rate these alternatives. The empirical results indicated that 2.5D TSI is of primary interest to the Taiwanese semiconductor industry, followed by 3DIC TSV, 3D packaging, and 3D Si TSV. The proposed three-stage fuzzy decision model can potentially assist industry practitioners and government policy-makers in directing R and D investments and allocating resources more strategically.
Acknowledgments
We are grateful to the experts who are willing to take their time for our questionnaires and interviews.
Author Contributions
Yen-Chun Lee designed and proposed the concept of this research. Both Yen-Chun Lee and C. James Chou performed research, analyzed the data and wrote the paper.
Conflicts of Interest
The authors declare no conflict of interest.
References
- Mack, C.A. Fifty years of Moore’s law. IEEE Trans. Semicond. Manuf. 2011, 24, 202–207. [Google Scholar] [CrossRef]
- Salah, K.; Ismail, Y.; El-Rouby, A. Introduction: Work around Moore’s law. In Arbitrary Modeling of Tsvs for 3D Integrated Circuits; Springer: Heidelberg, Germany, 2015; pp. 1–15. [Google Scholar]
- Kim, A.; Choi, E.; Son, H.; Pyo, S.G. Development and applications of 3-dimensional integration nanotechnologies. J. Nanosci. Nanotechnol. 2014, 14, 2001–2011. [Google Scholar] [CrossRef] [PubMed]
- Tavana, M.; Khalili-Damghani, K.; Abtahi, A.-R. A hybrid fuzzy group decision support framework for advanced-technology prioritization at NASA. Expert Syst. Appl. 2013, 40, 480–491. [Google Scholar] [CrossRef]
- Van de Kaa, G.; Rezaei, J.; Kamp, L.; de Winter, A. Photovoltaic technology selection: A fuzzy mcdm approach. Renew. Sust. Energy Rev. 2014, 32, 662–670. [Google Scholar] [CrossRef]
- Dat, L.Q.; Chou, S.-Y.; Le, N.T.; Wiguna, E.; Yu, T.H.-K.; Phus, P.N.K. Selecting renewable energy technology via a fuzzy mcdm approach. IOS Press 2014. [Google Scholar] [CrossRef]
- Bose, G.K. Selecting significant process parameters of ecg process using Fuzzy-MCDM technique. IJMFMP 2015, 2, 38–53. [Google Scholar] [CrossRef]
- Ilangkumaran, M.; Sakthivel, G.; Sasirekha, V. Waste water treatment technology selection using fahp and gra approaches. Int. J. Environ. Waste Manag. 2014, 14, 392–413. [Google Scholar] [CrossRef]
- Demirtaş, N.; Özgürler, Ş.; Özgürler, M.; Güneri, A.F. Selecting e-purse smart card technology via fuzzy AHP and ANP. J. Appl. Math. 2014, 2014, 1–14. [Google Scholar] [CrossRef]
- Vinodh, S.; Nagaraj, S.; Girubha, J. Application of fuzzy VIKOR for selection of rapid prototyping technologies in an agile environment. Rapid Prototyping J. 2014, 20, 523–532. [Google Scholar] [CrossRef]
- Sadaka, M.; Radu, I.; di Cioccio, L. 3D integration: Advantages, enabling technologies & applications. In Proceedings of the International Conference on IC Design and Technology, Grenoble, France, 2–4 June 2010; pp. 106–109.
- Lau, J.H. Evolution, challenge, and outlook of TSV, 3D IC integration and 3D silicon integration. In Proceedings of the International Symposium on Advanced Packaging Materials, Xiamen, China, 25–28 October 2011; pp. 462–488.
- Lau, J.H.; Chan, Y.; Lee, R. 3D IC Integration with TSV Interposers for High-Performance Applications; Chip Scale Review: San Josa, CA, USA, 2010; pp. 26–29. [Google Scholar]
- Santarini, M. 2.5D ICs Are More than a Stepping Stone to 3D ICs. Available online: http://www.eetimes.com/document.asp?doc_id=1279514 (assessed on 10 October 2015).
- Chand, S.; Singh, V.K. Importance of fuzzy logic in multiple powers generating area over pid. J. Environ. Sci. 2013, 2, 350–355. [Google Scholar]
- Zhao, X.; Lin, R.; Wei, G. Fuzzy prioritized operators and their application to multiple attribute group decision making. Appl. Math. Model. 2013, 37, 4759–4770. [Google Scholar] [CrossRef]
- Wei, G.; Zhao, X.; Wang, H.; Lin, R. Fuzzy power aggregation operators and their application to multiple attribute group decision making. Technol. Econ. Dev. Econ. 2013, 19, 377–396. [Google Scholar] [CrossRef]
- Noorderhaven, N.G. Strategic Decision Making; Addison-Wesley: Boston, USA, 1995; pp. 206–208. [Google Scholar]
- Cheng, J. Indexes of competitive power and core competence in selecting Asia-Pacific ports. J. Chin. Inst. Transp. 2001, 13, 1–25. [Google Scholar]
- Saaty, T.L. The Analytic Hierarchy Process: Planning, Priority Setting, Resources Allocation; RWS: Pennsylvania, PA, USA, 1990; pp. 26–47. [Google Scholar]
- Saaty, T.L. How to make a decision: The analytic hierarchy process. Eur. J. Oper. Res. 1990, 48, 9–26. [Google Scholar] [CrossRef]
- Csutora, R.; Buckley, J.J. Fuzzy hierarchical analysis: The lambda-max method. Fuzzy Set. Syst. 2001, 120, 181–195. [Google Scholar] [CrossRef]
- Opricovic, S.; Tzeng, G.-H. Defuzzification within a multicriteria decision model. Int. J. Uncertain. Fuzz. 2003, 11, 635–652. [Google Scholar] [CrossRef]
- Hwang, C.; Yoon, K. Lecture notes in economics and mathematical systems. In Multiple Attribute Decision Making: Methods and Applications; Springer-Verlag: Berlin, Germany, 1981; pp. 166–186. [Google Scholar]
- Tzeng, G.H.; Huang, J.J. Multiple Attribute Decision Making: Methods and Applications; Taylor & Francis: New York, NY, USA, 2011; pp. 248–260. [Google Scholar]
- Awasthi, A.; Chauhan, S.S.; Goyal, S. A fuzzy multicriteria approach for evaluating environmental performance of suppliers. Int. J. Product. Econ. 2010, 126, 370–378. [Google Scholar] [CrossRef]
- Yazdani, M.; Alidoosti, A.; Basiri, M.H. Risk analysis for critical infrastructures using fuzzy TOPSIS. J. Manag. Res. 2012, 4, 1–19. [Google Scholar] [CrossRef]
© 2016 by the authors; licensee MDPI, Basel, Switzerland. This article is an open access article distributed under the terms and conditions of the Creative Commons by Attribution (CC-BY) license (http://creativecommons.org/licenses/by/4.0/).