Article

Integrated Evaluation Method-Based Technical and Economic Factors for International Oil Exploration Projects

School of Business Administration, China University of Petroleum (Beijing), No. 18, Fuxue Road, Changping District, Beijing 102249, China
*
Author to whom correspondence should be addressed.
Sustainability 2016, 8(2), 188; https://doi.org/10.3390/su8020188
Submission received: 3 January 2016 / Revised: 4 February 2016 / Accepted: 16 February 2016 / Published: 22 February 2016
(This article belongs to the Section Energy Sustainability)

Abstract

:
Optimizing international oil exploration projects is one of the main challenges for oil companies in obtaining investment benefits. This paper establishes an integrated evaluation model to maximize investment benefits within the constraints of technical and economic factors, including geological factors, resource quality, geographic conditions, the investment environment, and oil contracts. The paper also proposes a dynamic calculation method of indicators’ weight associated with oil prices. The analysis describes the effects of contract terms and the investment environment on project value and quantifies the contractor income ratio for different types of contracts and the investment environment of the host country. Oil exploration projects in Africa are illustrated as examples in which the evaluation indicator Adjusted Concept Reserves (ACR) is calculated for each project. The results show that remaining recoverable reserves and contract terms exert tremendous influences on ACR, and remaining recoverable reserves is the essential factor. Simultaneously, changes in oil prices lead to various rates of change in the contractor income ratio, which is determined by different fiscal terms. This study is important in helping oil companies optimize international oil projects and design reasonable investment strategies.

Graphical Abstract

1. Introduction

Because the global distribution of oil resources is extremely unbalanced and levels of regional economic development vary [1], supply and demand for oil often shows a contradictory trend. Thus, international oil companies have adopted global resource strategies to obtain cheap oil and gas resources and ensure long-term and stable business development [2]. The areas with abundant resources and low investment risk have already been exploited by the major oil companies [3]. However, with increasing competition in international oil projects, more oil companies are becoming involved in higher-risk areas, and the competition may become increasingly fierce. There is a wide range of significant risks in oil exploration projects, including resource conditions, the natural environment, and political, economic, and legal risks [4,5,6]. Facing a complicated and changeable international political situation, international oil companies must determine how to grasp opportunities in global exploration and development, how to effectively predict and avoid the global exploration risks, how to develop a reasonable investment strategy, and how to select the best blocks to obtain a high return on investment. Therefore, for mixed international oil exploration projects, it is crucial to create a systematic, scientific and efficient evaluation method to maximize the benefits for investors.
To evaluate international oil projects, several empirical analysis and evaluation methods have been developed by researchers and discussed in the literature. The discounted cash flow method is the most common method used by oil companies to value oil projects [7,8,9]. Magne Emhjellen [7] examined the differences in the net present values (NPVs) of North Sea oil projects by using the weighted average cost of capital and a modern asset pricing (MAP) method that involves the separate discounting of project cash flow components. Frenette et al. [10] presented a study to maximize the NPV of a greenfield cyclic steam stimulation (CSS) project by incorporating a horizontal CSS analytical model with a new surface model and specifically developed an economic evaluation model. Luo et al. [11] conducted an economic evaluation (using an NPV model) to determine the overall economic viability of China’s coal bed methane (CBM) resource and the factors that most impact the economic viability of CBM resources; the researchers then provided recommendations for policy-makers. However, the NPV method requires extensive data, such as the exploration and development investment, average production per well, development well numbers, etc., which are difficult to obtain in the exploration stage. Moreover, cash flow cannot be estimated precisely in uncertain decision-making environments [7], and the value of managerial flexibility in investment projects cannot be precisely revealed through DCF analysis.
The second method used to value oil projects is real options valuation. Dias [12] presented a set of selected real options models to evaluate investments in petroleum exploration and production under market and technical uncertainties. Shiu-Hwei Ho [13] proposed a fuzzy approach for investment project valuation in uncertain environments using real options. Armstrong [14] developed a novel form of Bayesian updating based on Archimedean copulas and presented a case study on oilfield production enhancement that shows how to combine Bayesian updating and the real options method. Although using the real options method to evaluate projects can increase decision flexibility to avoid risk [15], oil and gas projects are hysteretic by nature (underground resources cannot be mined immediately), which affects the method’s practicability.
The third method is multi-criteria decision-making. Amiri [16] assessed alternative projects and helped the decision-maker select the best one for the National Iranian Oil Company using AHP (Analytic Hierarchy Process) and fuzzy TOPSIS (Technique for Order Preference by Similarity to an Ideal Solution) techniques. Jialin Liu [17] proposed a fuzzy synthetic evaluation approach for scientific drilling project risk assessment. Shakhsi-Niaei [18] proposed an integrated model that is formulated as linear mixed integer programming for making a group of strategic decisions regarding oil and gas development projects. Zhao Dong et al. [19] built a model to rank international oil and gas E&P (Exploration and Production) projects; the model provides a special indicator system to show the risk contained in oil and gas E&P projects. Dey [20] analyzed projects with respect to market, technicalities, and social and environmental impact in an integrated framework using an analytic hierarchy process. The multi-criteria decision-making approaches above are both objective and subjective; the subjectivity of the index weights may lead to inaccurate evaluation results. Di Somma [21] formulated a multi-objective linear programming model to research the operation optimization of a Distributed Energy System (DES).
Other evaluation methods such as game theory [22,23], portfolio theory [24,25,26], Monte Carlo simulation [27,28,29], and the exploration cost method [30,31,32] can also be used to support decision-making in the oil and gas industry. Although the existing research expends great effort to provide project evaluations from various perspectives, the studies are difficult to apply to international oil exploration projects. Decision-making in international oil exploration projects must be evaluated based on many perspectives because the projects are influenced by technical, environmental, economic, and geopolitical issues at the international, national and local levels [33]. The key to improving the effectiveness and efficiency of an oil and gas project evaluation is to allow decisions to be made based on the available information in real time.
In this paper, we present a procedure for the selection of an international oil exploration project that aims to maximize benefits while considering the influence of technical and economic factors. Combining the characteristics of international oil exploration projects and indicator classification principles, we merge technical and economic impact factors into five types of indicators: geological factors, resource quality, geographic conditions, contract constraints, and the investment environment. We then establish the indicators’ weight dynamic calculation method associated with oil prices. The quantitative model to determine contractor income ratio based on different types of contracts and fiscal terms is also developed. In addition, the investment environment of the host country is quantified using the Global Competitiveness Index (GCI). Finally, we establish an evaluation model for international oil exploration projects by combining the five adjustment factors, and we propose the concept of Adjusted Concept Reserves (ACR).
This paper establishes an integrated evaluation model to maximize investment benefits within the constraints of technical and economic factors. This analysis quantifies the contractor income ratio in different types of contracts and in the investment environment of the host country. We propose the evaluation indicator Adjusted Concept Reserves (ACR), and apply it to five oil exploration projects in Africa. Remaining recoverable reserves and contract terms exert tremendous influences on ACR. Changes in oil prices lead to various rates of change in the contractor income ratio.

2. Analysis of Influence Factors for International Oil Exploration Projects

The evaluation of an international petroleum exploration project involves a wide range of factors, including oil resources characteristics [3,33,34,35], the investment environment [4,5,6], and contract terms [36,37,38], which are in turn affected by many sub-factors. The determination process for each factor may have certain deviations and poses risks. To scientifically and objectively evaluate international petroleum exploration projects, we establish a comprehensive evaluation index system based on technical and economic aspects by analyzing the intrinsic link between the factors.

2.1. The Technical Factors Affecting Investment Benefits

2.1.1. Geological Factors

Oil resources are the result of long-term geological evolution and are distributed in specific geological strata in accordance with the laws of geology [34]. The geological condition is the basis of the evaluation of an oil resource potential; in addition, it is the most basic factor among the various factors that economically affect oil exploration projects [3]. The influence of geological factors on the economic benefits of oil development mainly includes two aspects of investment: capacity building and development efficiency.
The geological factors of oil reservoirs [34] include reservoir depth, geological reserves, reserve abundance, reservoir type, physical properties, reservoir wettability, effective pay thickness, reservoir pressure, and effective permeability. Resource depths, which directly affect the cost of mining (mining costs increase rapidly with an increase in depth), are independent of other technical factors and can be considered a separate factor. Technical factors such as resource abundance, oil-bearing areas, average effective thickness, and trap types reflect the amount of resources and can be merged into a reserve scale. Other factors such as porosity, permeability, reservoir wettability, and reservoir heterogeneity reflect the difficulty of resource recovery and can be merged into the recovery ratio.

2.1.2. Resource Quality

Resource quality primarily refers to the physical properties and chemical composition of crude oil. The former affects the complexity of reserves development and the corresponding production efficiency, whereas the latter affects oil quality and the corresponding sales price [35]. Both have an impact on the ultimate recovery and production rate. The physical properties of the oil, including color, density, viscosity, fluorescence, optical activity, and solubility are determined by chemical composition [34]. The resource qualities with the primary economic impact on the development of the remaining reserves are specific gravity and viscosity. Oil is important both as energy and as a chemical raw material; the chemical composition of oil affects its grade quality and thus determines its selling price and the value of remaining recoverable reserves. From an elementary substance perspective, oil is mainly composed of carbon, hydrogen and a small amount of oxygen, sulfur, and nitrogen.

2.1.3. Geographic Conditions

The economic benefit of the oil industry is restricted by geographic conditions. The geographic location of an oilfield has a great influence on the engineering investment and mining costs [3]. The geographic factors affecting the investment benefits of an international oil project mainly consist of topography, climate, geographic location, market conditions, and infrastructure.

2.2. The Economic Factors Affecting Investment Benefits

2.2.1. Contract Terms

International oil contracts are the conduits for host governments to achieve benefits in international oil cooperation, the basis for oil companies to generate revenue and participate in international oil exploration and development, and the legal basis for international oil companies to implement production operations.
The quality of the fiscal terms of oil contracts has a fundamental impact on the feasibility of a cooperation project and the economic benefits to the contracting company [38]. There are significant differences between different types of oil contracts and their fiscal terms. The quality of fiscal terms is mainly reflected in the economic benefits acquired by the contracting companies through different types of contracts. The main factors in evaluating contract terms [36] are the contract type, contract period, contractual obligations, oil cost, oil profit, government equity, and profit distribution.

2.2.2. Investment Environment
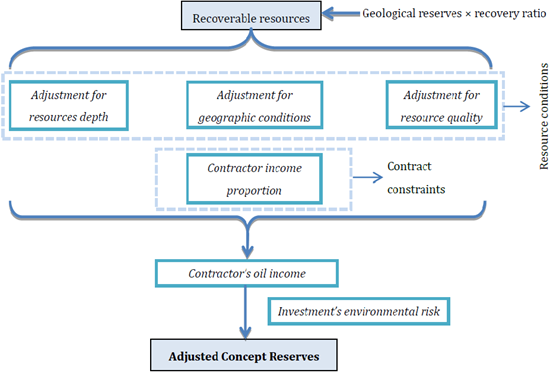
The environmental factors impacting the investment benefits of international oil exploration projects consist of political, economic, and social conditions [6,39]. Political stability, including the legal system’s integrity and policy stability, political soundness, the absence of conflict, and war risk, provides certain guarantees for exploration and development investments. Oil exploration and development projects, which have long investment cycles, set high demands for political stability. The host country’s economic stability, including exchange rates, interest rates, oil prices, and the level of economic development, determines the sustainability of a project’s cash flow and directly affects the contractor’s benefits. Social conditions, including social stability, population quality, and religious culture, are crucial to guaranteeing production safety. Good social conditions will mitigate operating risk and increase the investment profit of an international oil project.
Based on the analysis of the above factors, we merge the influential factors into seven sectors which are shown in Table 1.

3. Approach

For international oil exploration projects, the essential data are extremely limited. Generally, the essential data are obtained by analogy to similar oilfields or are provided (unproved) by the host country [3], which entails a great deal of uncertainty. Based on the characteristics of an international oil exploration project, we propose the following steps for an evaluation method. Firstly, based on the geological reserves of the target exploration blocks and considering the oil recovery for reserves with similar geological characteristics, we obtain a block of recoverable resources. Secondly, we successively adjust for different depths, geographic conditions, and the quality of recoverable resources, which can be summarized as the influence of resource conditions. Thirdly, we calculate the contractor income proportion (here, the calculation of the contractor income ratio does not include the oil recovery cost) under the contract bounds, and we calculate the contractor oil income based on the adjusted resources according to the resource conditions. Finally, we consider the impact of environmental risks on the project benefits. Based on the Adjusted Concept Reserves (ACR) (ACR is an evaluation indicator that is used for project optimization after a comprehensive adjustment considering the impact of resource conditions, contract constraints, and the investment environment) and the investment scale, potential international oil exploration projects can be ranked. The evaluation process is shown in Figure 1.

3.1. The Determination of Residual Recoverable Reserves

The calculation of recoverable resources is primarily considered the ultimate recovery which varies for different types of reservoirs. Utilizing the recoverable resources and considering the recovery percentage, we can calculate the remaining recoverable resources.
N 1 = N 0 f 1
N 2 = N 1 N 0 f 2

3.2. Adjustment for Different Resource Conditions

N2 is a no-difference standard of grading that eliminates differences in geological reserves, recovery ratios, and remaining recoverable reserves; however, it neglects investment differences resulting from different resource conditions. Reservoir depth, geographic conditions and resource quality differences directly affect resource value. In addition, the weight of the influence of these factors should be considered when we adjust N2.

3.2.1. The Weight of the Influence of Resource Depth and the Adjustment of N2

The influence of depth is mainly reflected in the drilling investment for exploration wells and development wells. Drilling investment grows exponentially with the resource’s depth. In addition, production costs such as operating costs and power costs will also grow in accordance with increased depth. To quantify the impact of depth on N2, we remove oil from the remaining recoverable reserves to compensate for the differences in drilling investment and costs caused by different resource depths. Thereby, we can calculate the proportion of the drilling investment over sales revenue and utilize a certain degree of the cost difference to determine the influence of different reservoir depths. The formula is shown as:
s d e p t h = m ( 1 + h h 0 h 0 )
The proportion of the drilling investment over sales revenue is different at different levels of oil prices. With rising oil prices, the proportion of the drilling investment over sales revenue becomes smaller, as does the influence of resource depth on development benefits. Using the value of m, which dynamically changes with oil prices, the adjusted weightings of the resource depths conform to the practical situation. Based on the correlational data (Source: Energy Information Administration, Financial Reporting System [46]), the relationship between the proportion of the total costs associated with resource depths over sales revenue and oil prices is plotted in Figure 2.
The fitted result can be described as follows:
m = 0.3747 × p - 0.238
The goodness of fit (R-squared) is 0.73. In the fitting process, we compared the linear, logarithmic power function, and exponential functions and ultimately used the power function, which has a higher goodness of fit (the goodness of fit of the linear function is 0.55, the exponential function is 0.58, and that of the logarithmic function is 0.61) and better reflects the data variation.

3.2.2. The Weight of Influence of Geographic Conditions and the Adjustment of N2

Geographic conditions primarily affect ground construction investment and transportation costs. When developing the remaining recoverable resources, the utilization of existing ground engineering should be considered, and a decision regarding whether to build and the building size follows. Because of the differences in geographic conditions among global exploration regions, ground construction investment varies. Therefore, the difference in investment in surface facilities caused by different geographic positions is needed to compensate for a portion of the remaining recoverable resources. The adjustment weight is primarily based on the proportion of the investment in surface facilities investment over oil sales revenue. The adjustment for geographic conditions can be written as:
S g = e d f s
The proportion of ground construction investment over sales revenue varies under different oil prices. With rising oil prices, the proportion of ground construction investment over sales revenue decreases; that is, the weights used to adjust for different geographic conditions are lower. The relationship between the proportion of ground construction investment over sales revenue and oil prices is plotted in Figure 3.
The fitted result is:
e = 0.2619 × p 0.32
The goodness of fit (R-squared) is 0.55. The goodness of fit of the linear function is 0.47 and that of the exponential function is 0.48.
Land topography, referring to plains, marshes, hills, gobi, and deserts, differs globally [40]. Incorporating the location and topography of target blocks, the adjustment coefficients for different landforms are shown in Table 2.
In this paper, we use regional pipeline density to describe infrastructure conditions. Pipeline density is equal to the pipeline length divided by the regional area. Although we make a series of adjustments for the effect of geographic conditions, we cannot guarantee that the result perfectly matches the actual situation. Therefore, we adopt a subjective adjustment coefficient to improve the limited adjustment. For convenient application, we establish five evaluation levels: excellent, good, fair, poor, and very poor. We also provide a fixed adjustment coefficient (Table 3).

3.2.3. Adjustment for Different Resource Quality

Because of the diversity in quality of the remaining recoverable resources, the quantity of resources does not accurately reflect the resource’s value. By multiplying the quantity of resources by the value coefficient, we can obtain the adjusted resources to diminish the influence of the diversity in quality. Oil quality directly affects the sales price. By establishing a benchmark price based on a certain oil quality and comparing other oil qualities, we can determine the value coefficient. According to the resources’ quality parameters, such as API °, sulfur content, viscosity [35], and impurities, crude oil can be divided into six grades: excellent oil, high quality oil, customary quality oil, low quality oil, inferior oil, and low condensate oil. The value coefficients for the different oil qualities are shown in Table 4.

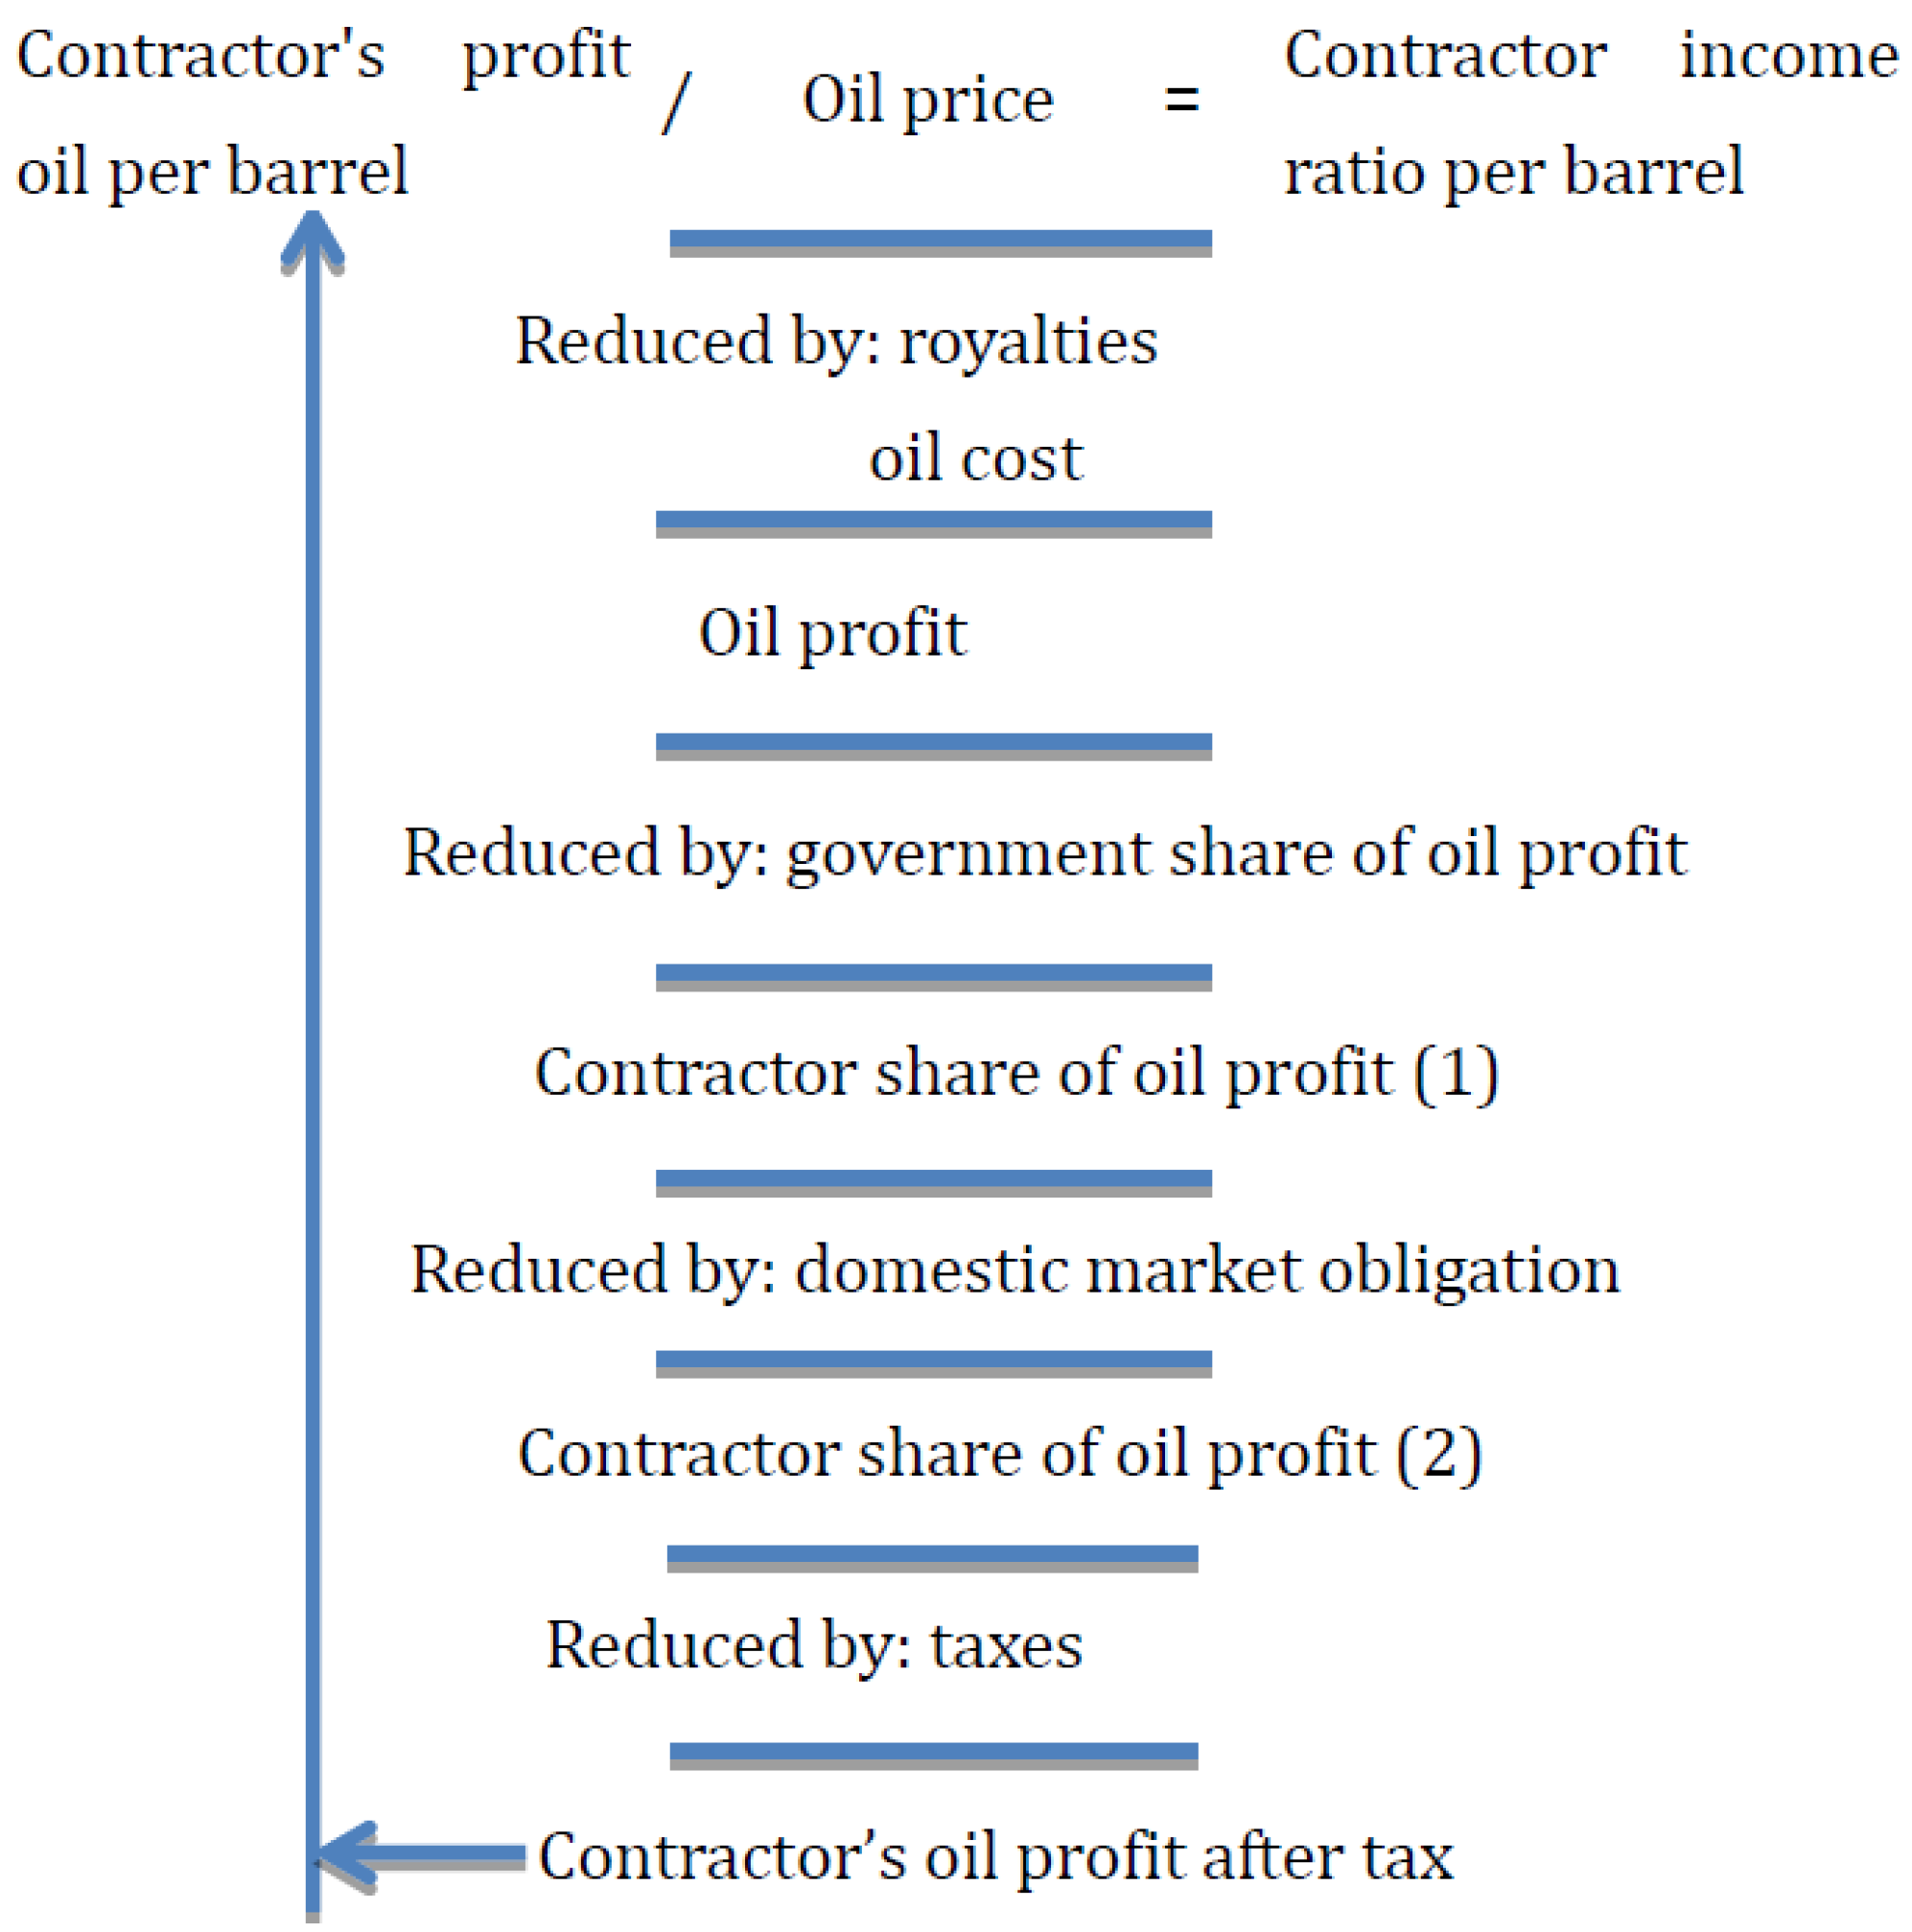
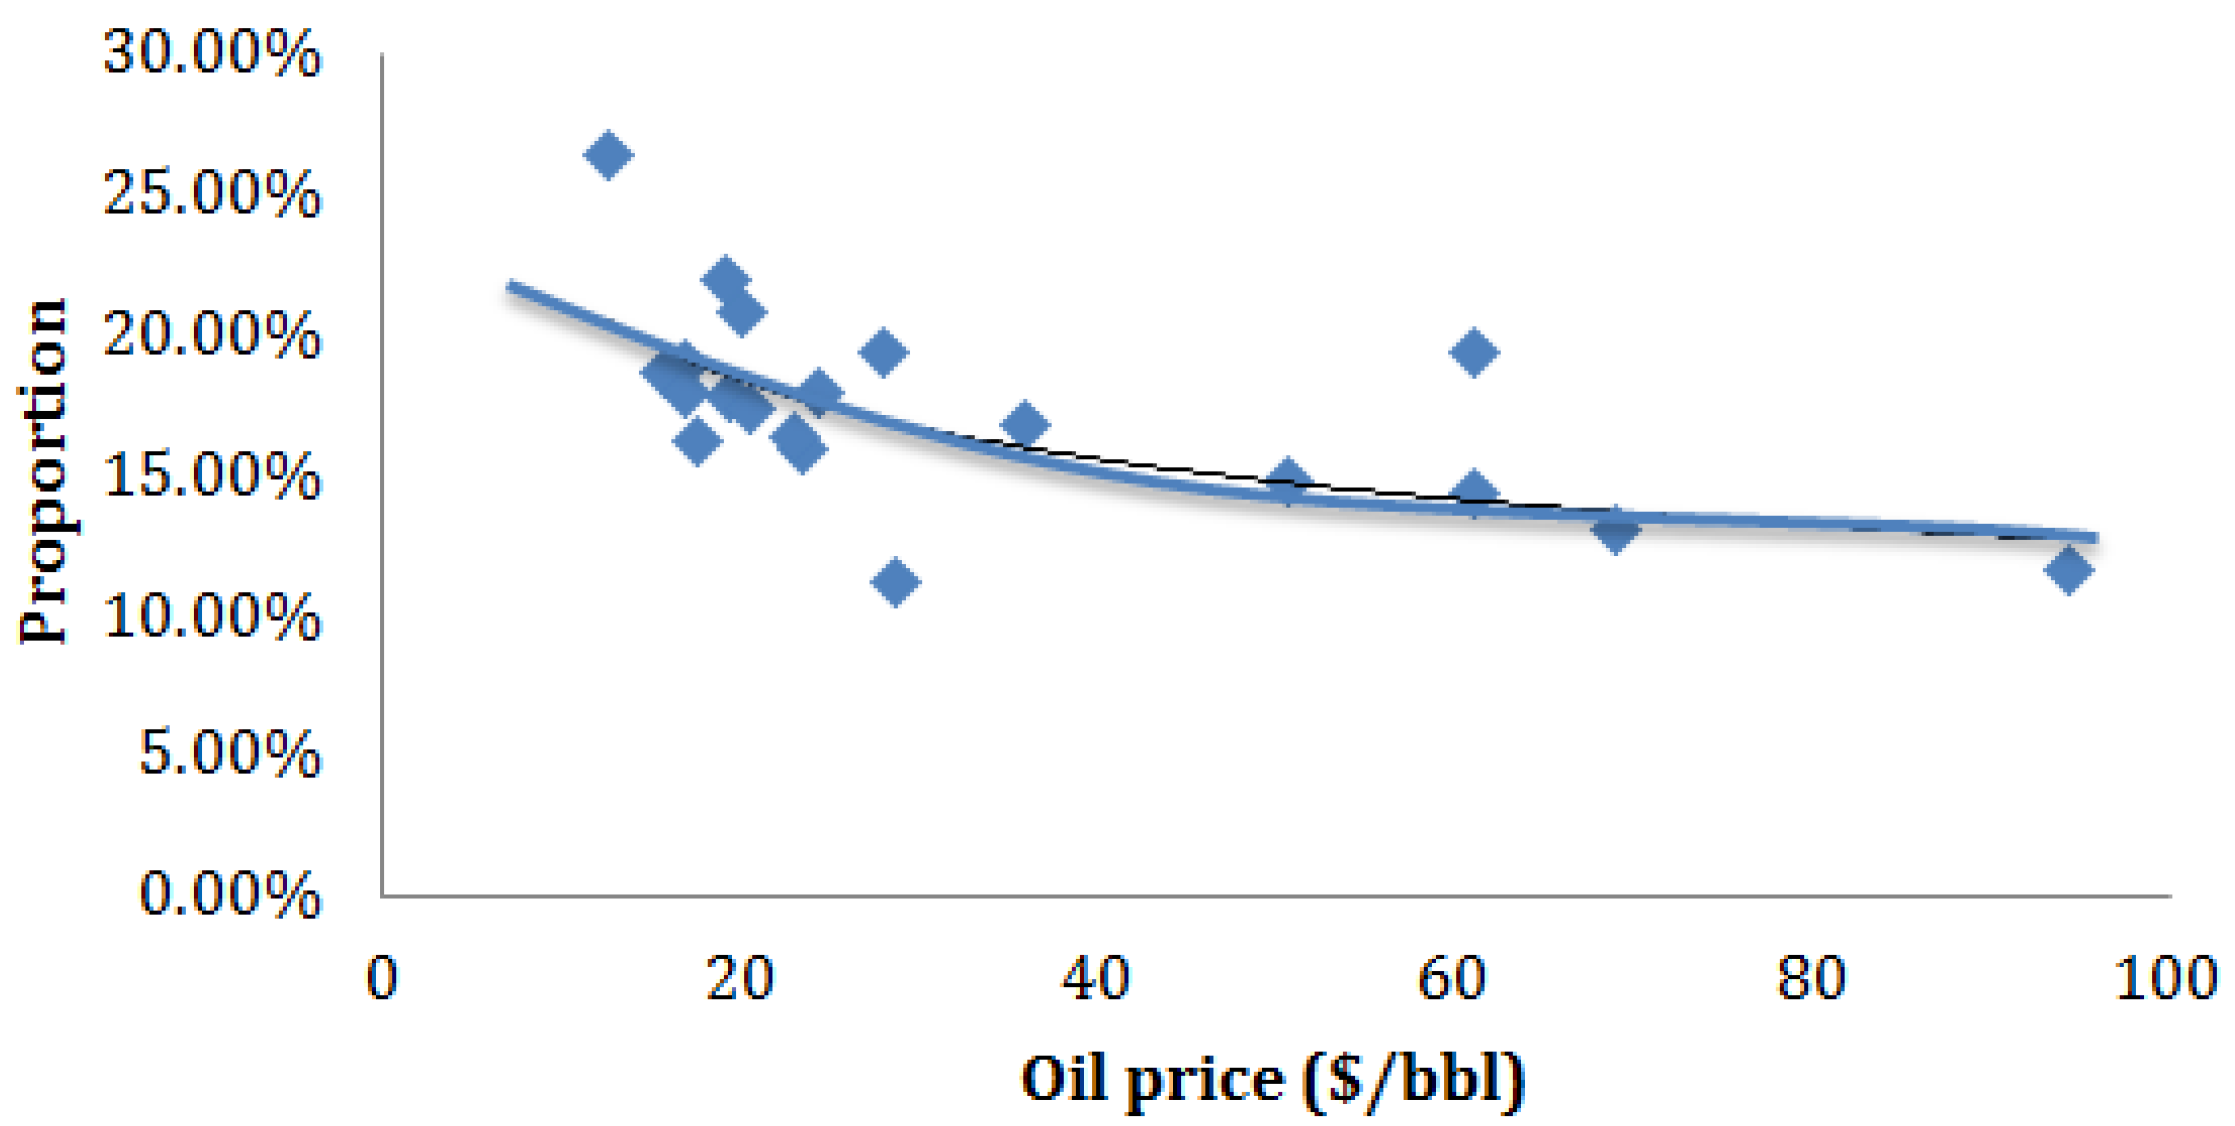
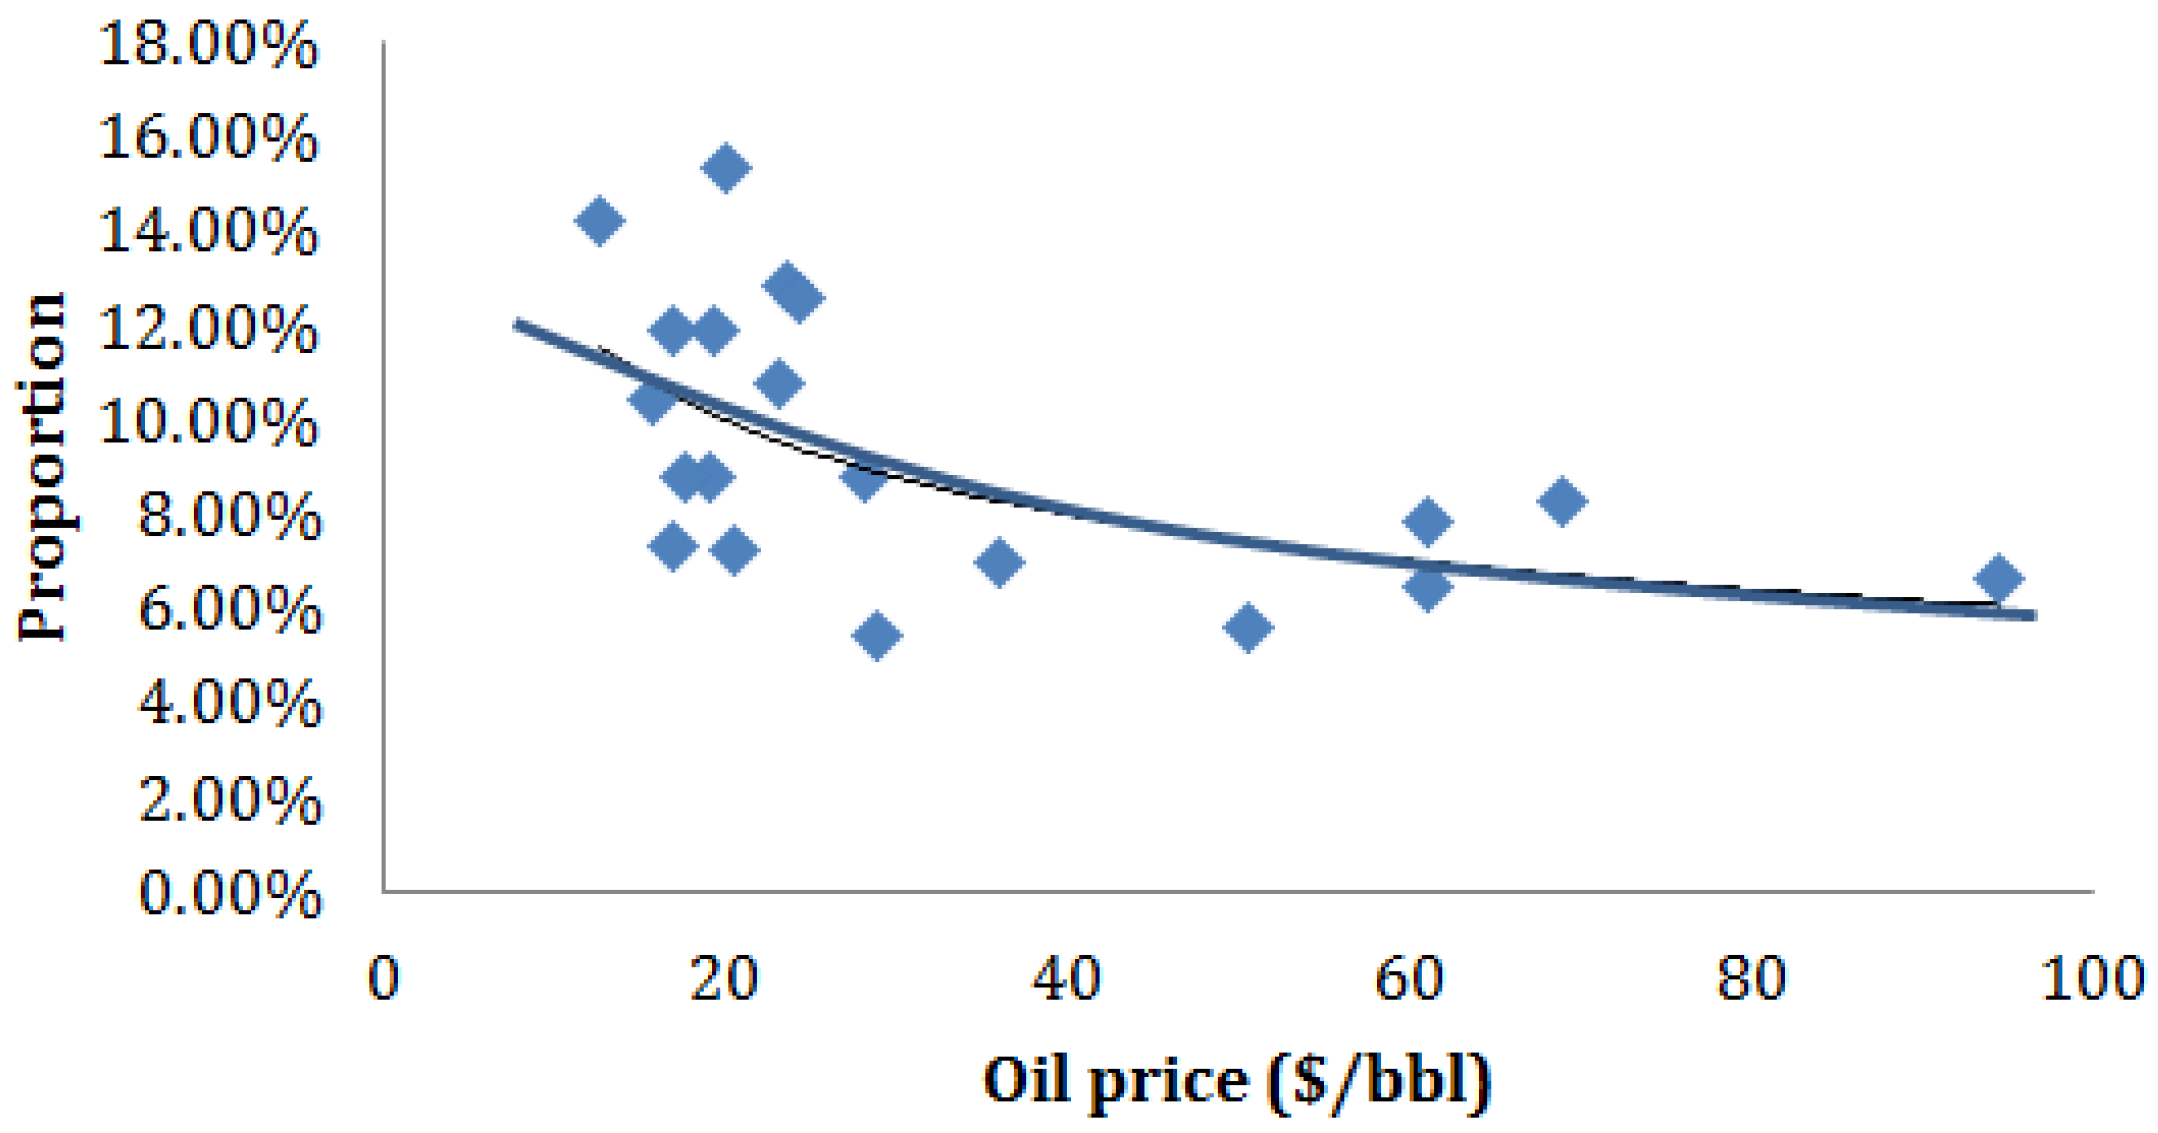
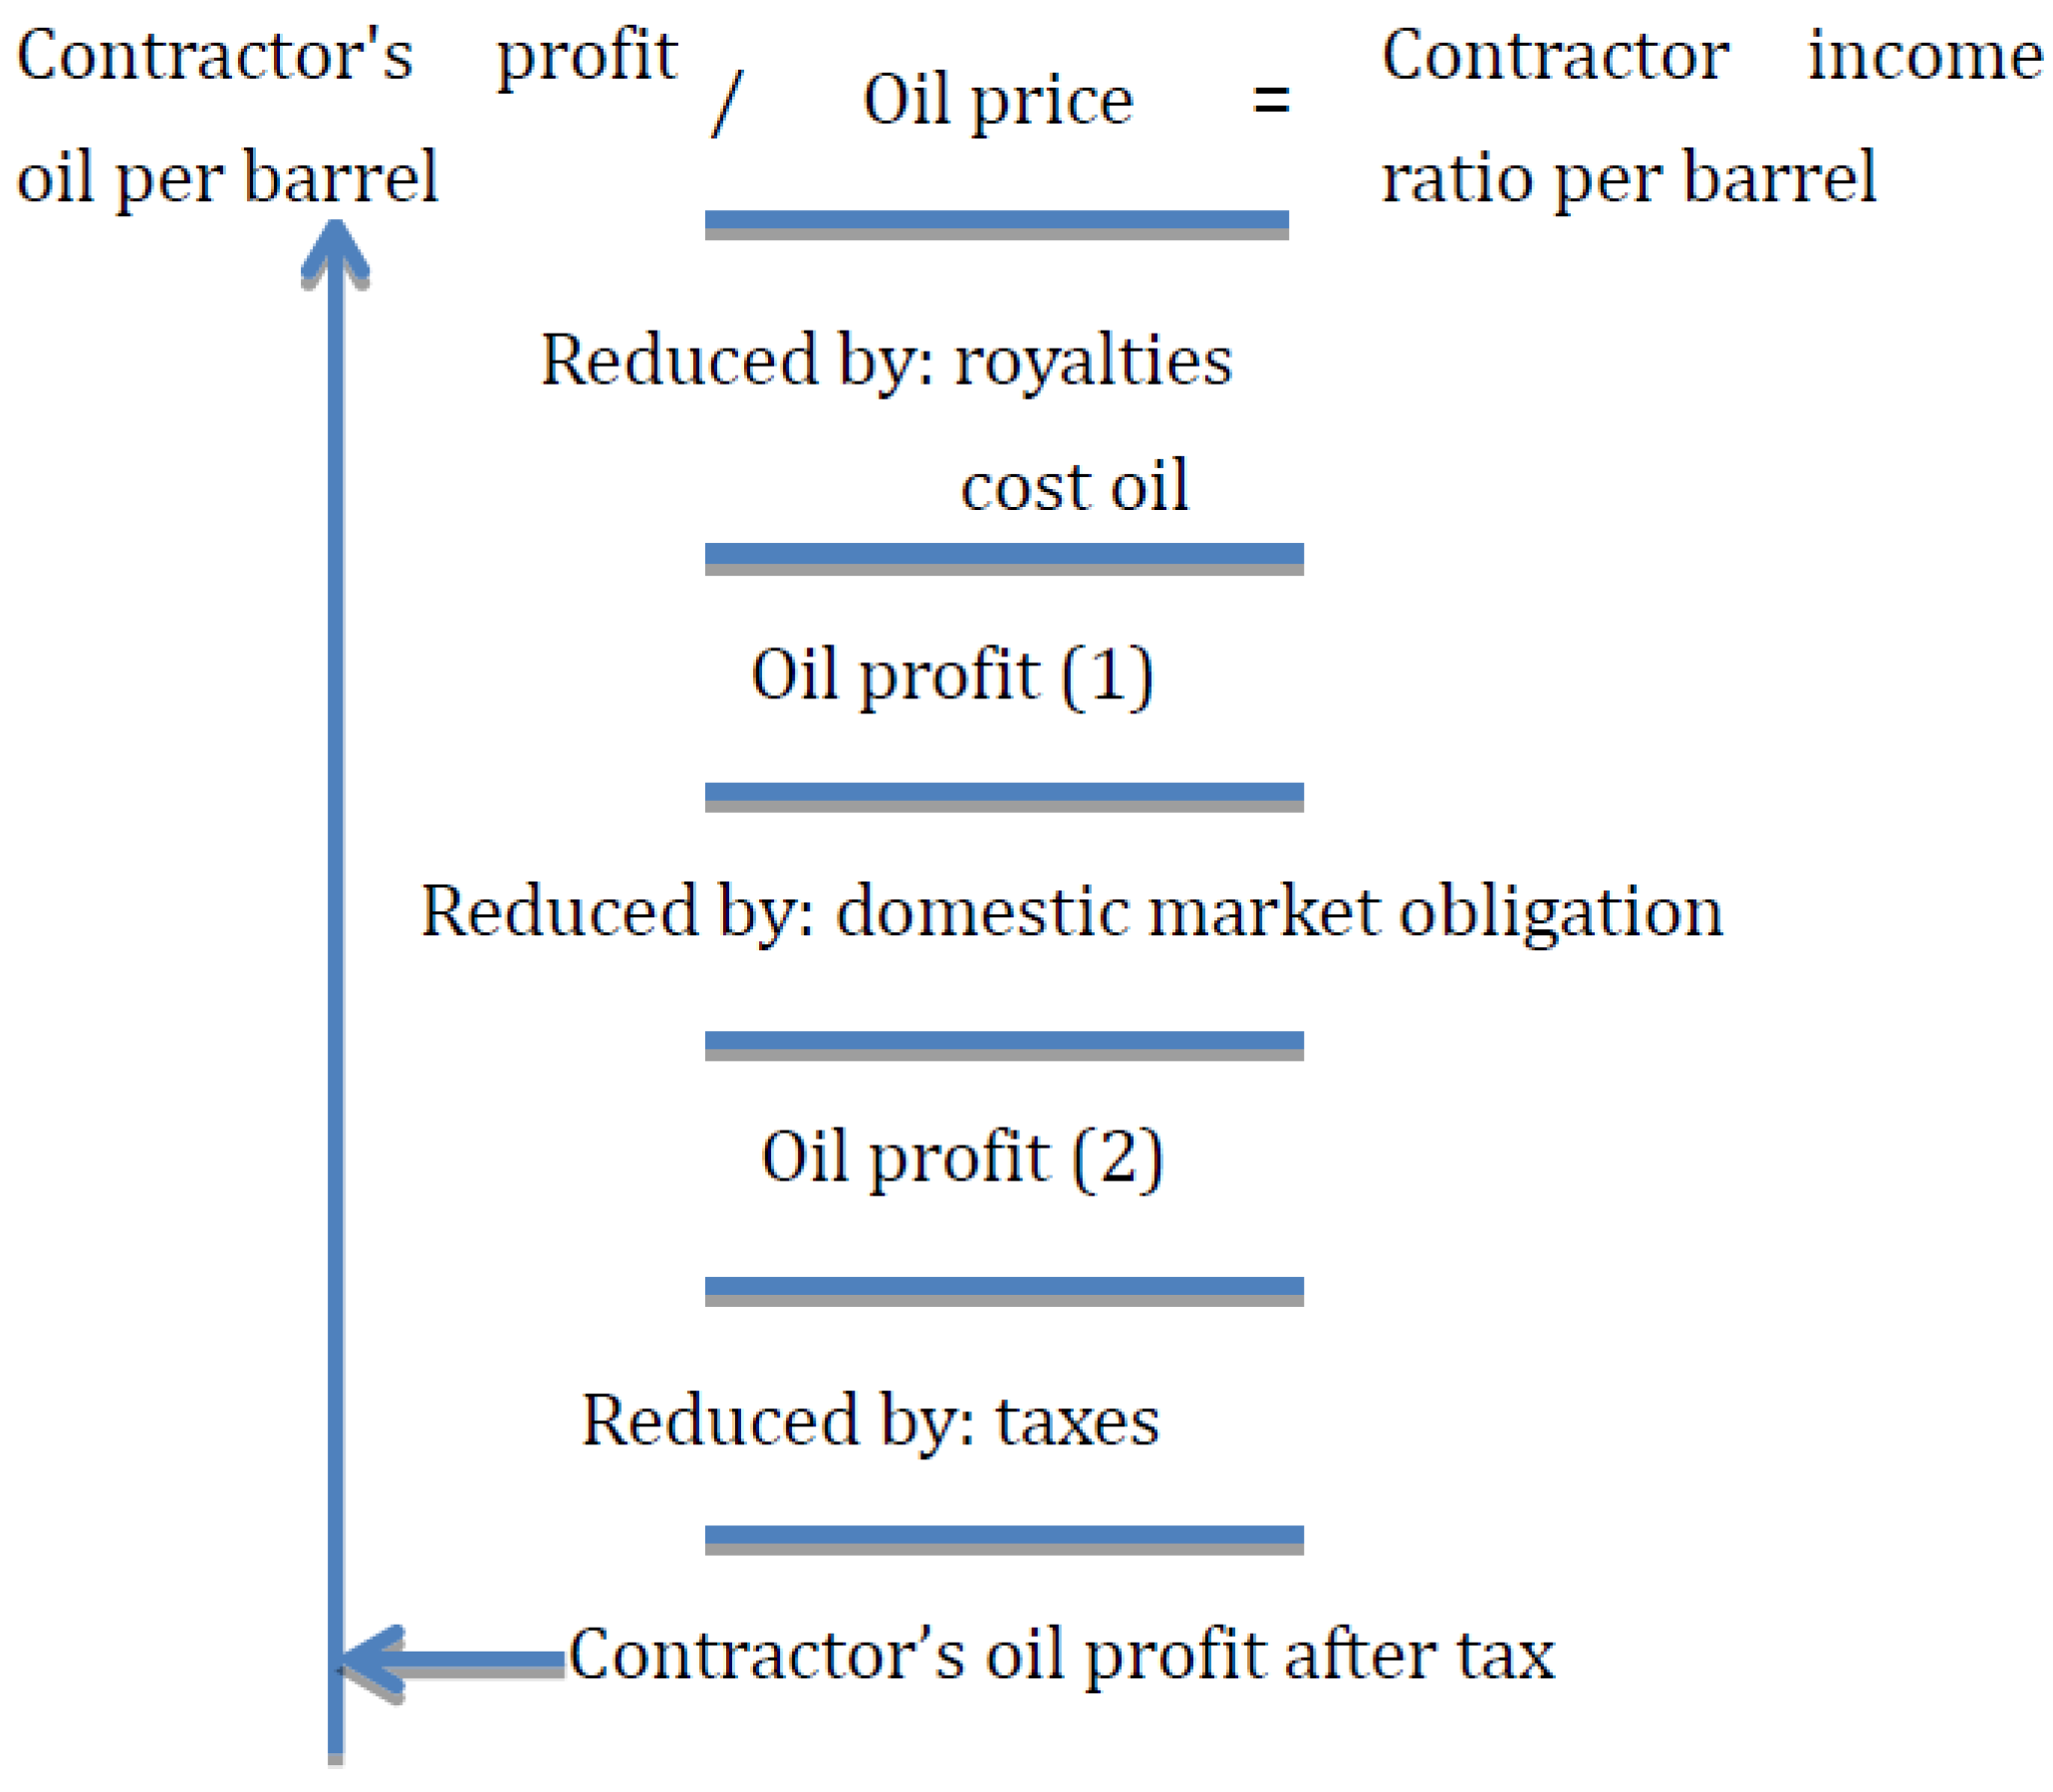
3.3. Calculation of the Contractor Income Ratio

International oil cooperation is conducted by means of concessions between parties. The types of contracts used in oil exploration and development primarily include royalty contracts, production sharing contracts, service contracts, and joint ventures [39]. The diversity of fiscal terms, cost recovery modes, and investment scales in the different contract types cause differences in the contractor income ratio. By calculating the contractor income ratio for different types of contracts, we can contrast the contractor income under different fiscal terms. This paper focuses on royalty contracts and production sharing contracts and discusses the differences between these contract types and the contractor income ratio calculation method.

3.3.1. Royalty Contracts

Other than the legal concept of mineral ownership, the most significant difference between a royalty contract and production sharing contract is the cost recovery method [39]. There is no restriction on the percentage of cost recovery in royalty contracts. Thus, the profit split between international oil companies and the host country proceeds as follows.
(1)
Pay royalties to the government. Royalties should first be deducted from the total oil production revenue; royalty rates vary widely between countries.
(2)
The cost recovery of the contractor. This amount includes production costs, depreciation, depletion, amortization, and intangible capital costs. Some countries allow deduction of the deposit.
(3)
Pay taxes to the government. Oil production revenue less deductions for royalties and costs is taxable income. The types of taxes and tax rates vary widely between countries.
The calculation of the contractor income ratio for royalty contracts is shown in Figure 4.
The formula for the contractor income ratio per barrel can be written as:
I O C % = C r + ( p R O Y C r D M O T A X ) p × 100 %

3.3.2. Production Sharing Contracts

The essence of a production sharing contract (PSC) is that the host country retains ownership of the oil resources. Through production service, contractors conduct cost recovery and share the oil produced. The basic fiscal terms of PSCs are as follows [39].
(1)
Pay royalties to the government, like with royalty contract.
(2)
The cost recovery of the contractor. A production sharing contract sets a cost recovery limit. The unrecovered cost beyond the limit can be carried forward.
(3)
Oil profit-sharing. After removing the royalties paid to the government and the contractor’s oil recovery costs, the remainder is oil profit; this amount is divided based on the ratio stipulated in the contract between the host country and the contractors.
(4)
Tax. The contractor must pay taxes on its oil profits according to the provisions of the host country.
The calculation of the contractor income ratio for a production sharing contract is shown in Figure 5.
The formula for the contractor income ratio per barrel can be written as:
I O C % = C r + ( p R O Y C r R g D M O T A X ) p × 100 %

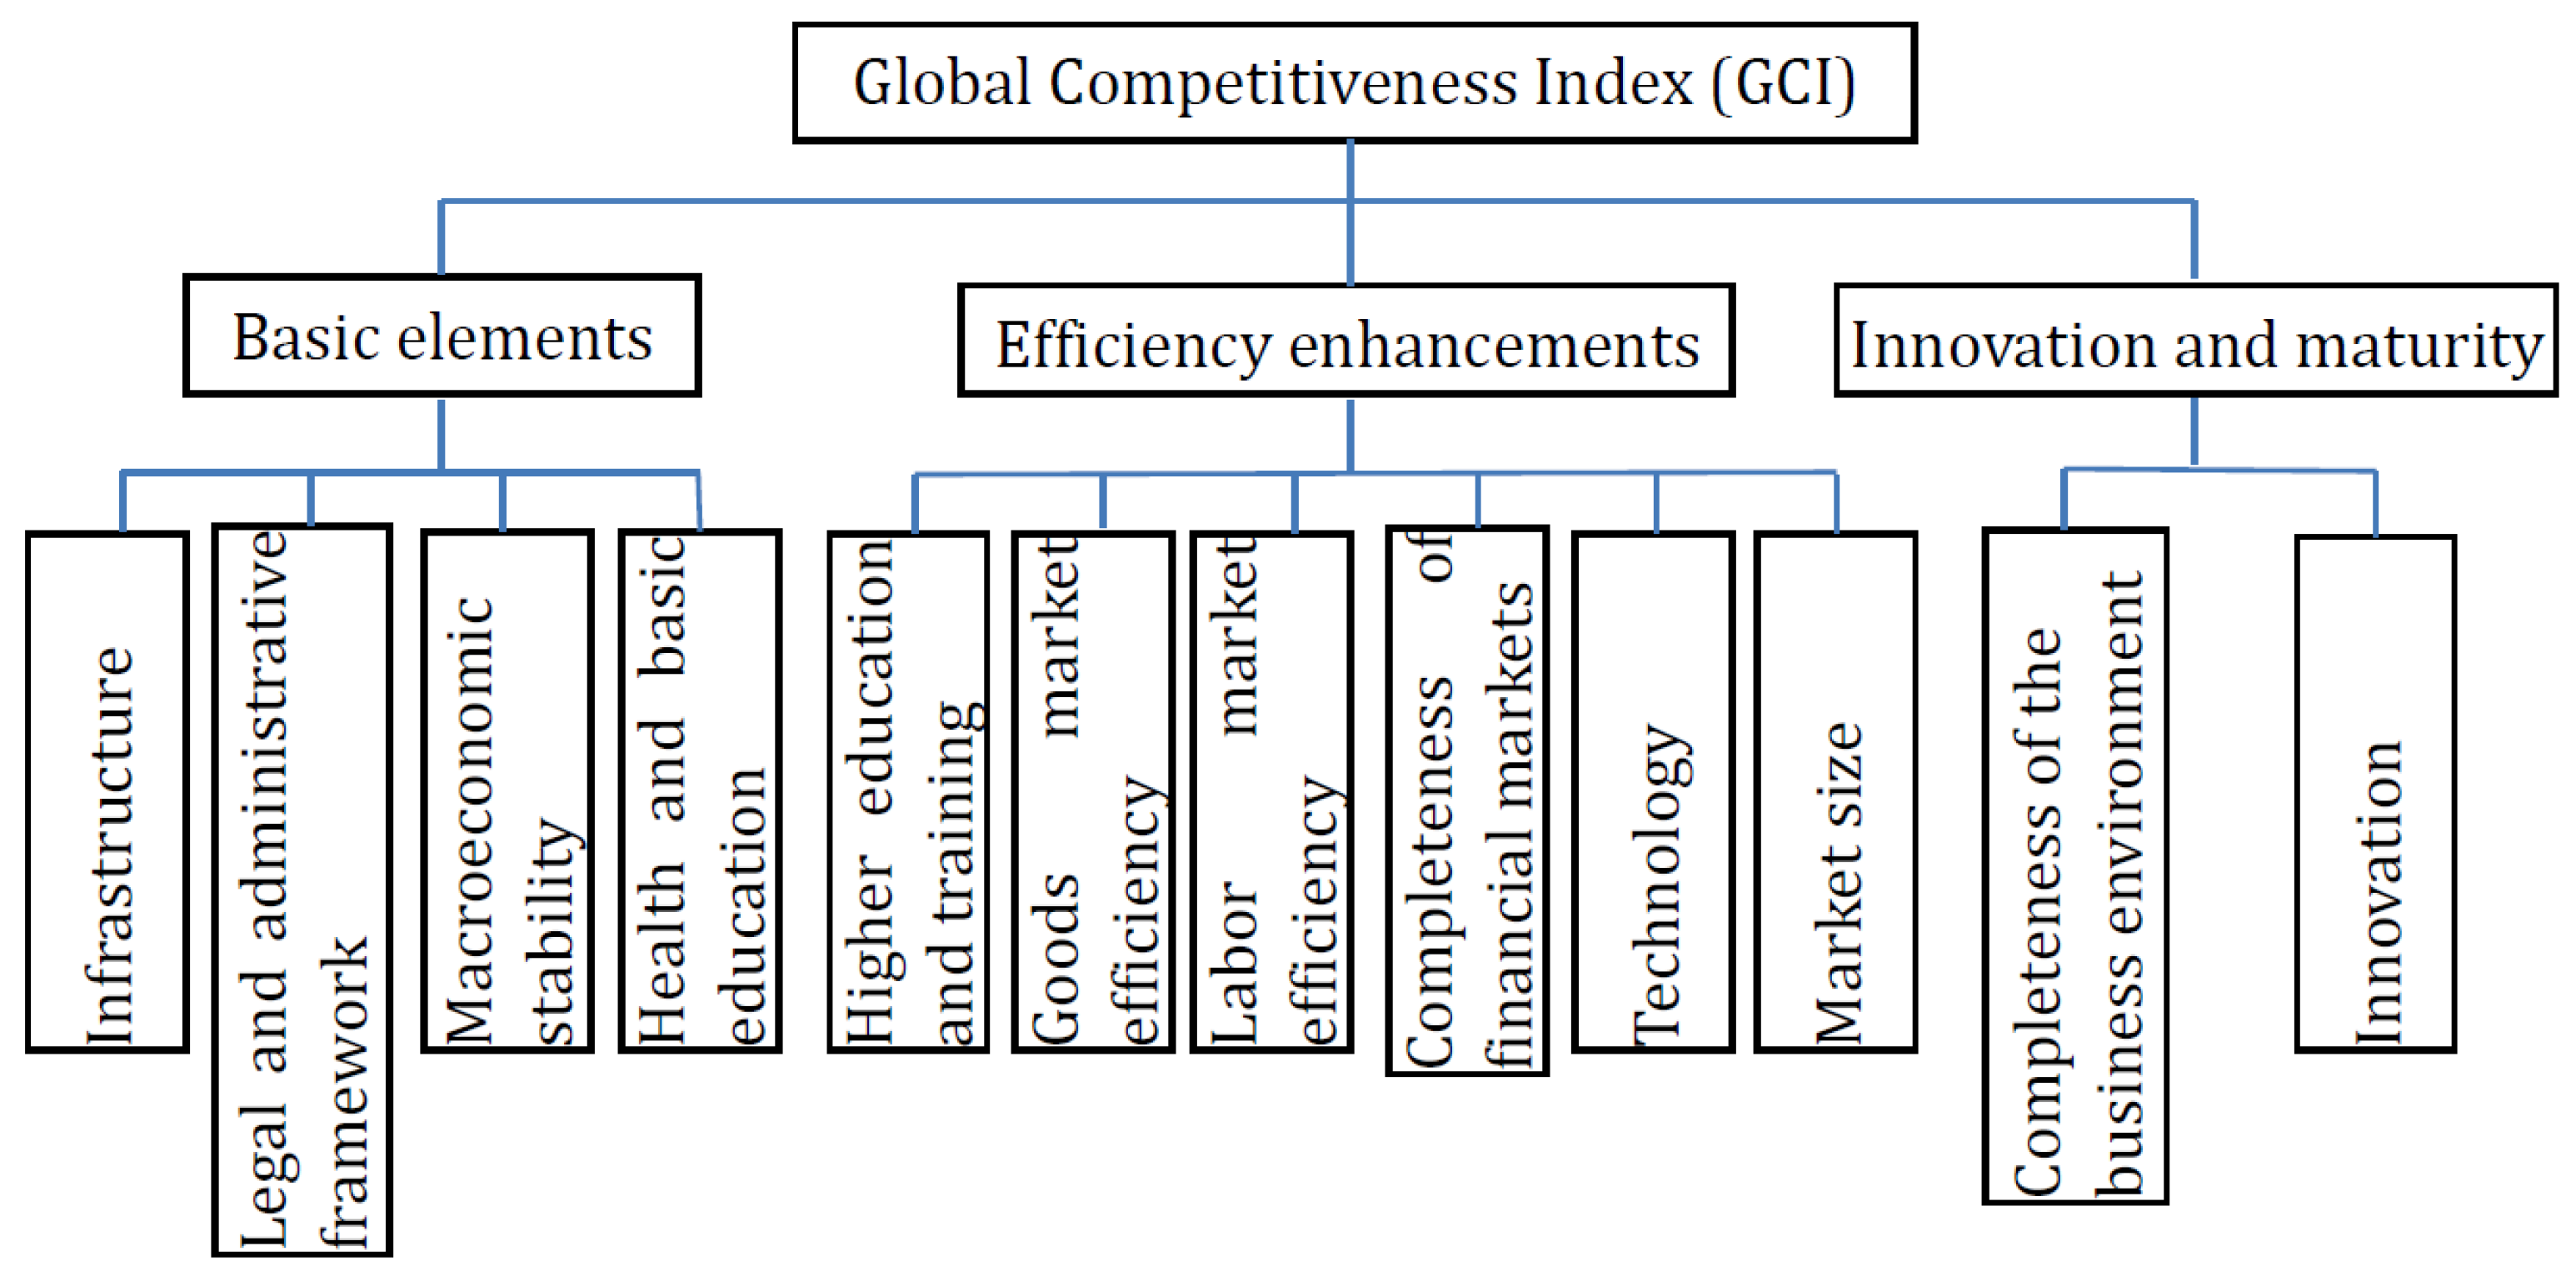
3.4. Adjustment for the Investment Environment Risk

To analyze the global political, economic, and social environments, we adopt the Global Competitiveness Index (GCI) released by the World Economic Forum to rank the macro investment environment of host countries [41]. The GCI, which consists of three categories and 12 sub-items (Figure 6), is designed to measure countries’ medium to long-term sustained economic growth capabilities. The index reflects differences in development stages, including basic elements, efficiency enhancements, innovation and maturity; it generally reflects countries’ macroeconomic environment.
By referring to the Global Competitiveness Report (2014–2015) (Source: World Economic Forum, Global Competitiveness Report 2014–2015) [41], we obtain the sorted macro investment environment results for oil-producing countries, as shown in Table 5. The risk adjustment factor for the investment environment of host countries can be written as:
f e = 1 + ( b R R h R h ) s e
Considering the significance of risk factors in the entire model, we set the risk adjustment weight to 20%; this can be adjusted in practice. The subjective adjustment factor (Se) is introduced to adjust the macro investment environment when the sorted GCI result does not match the oil industry’s actual situation.

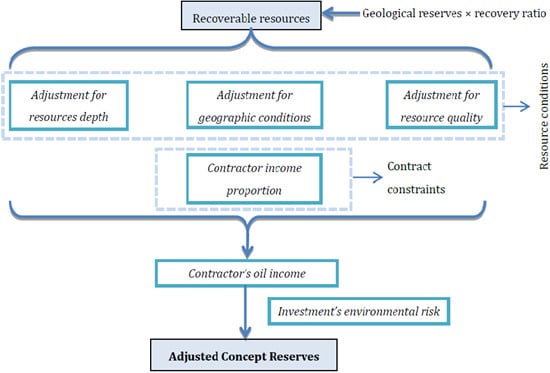
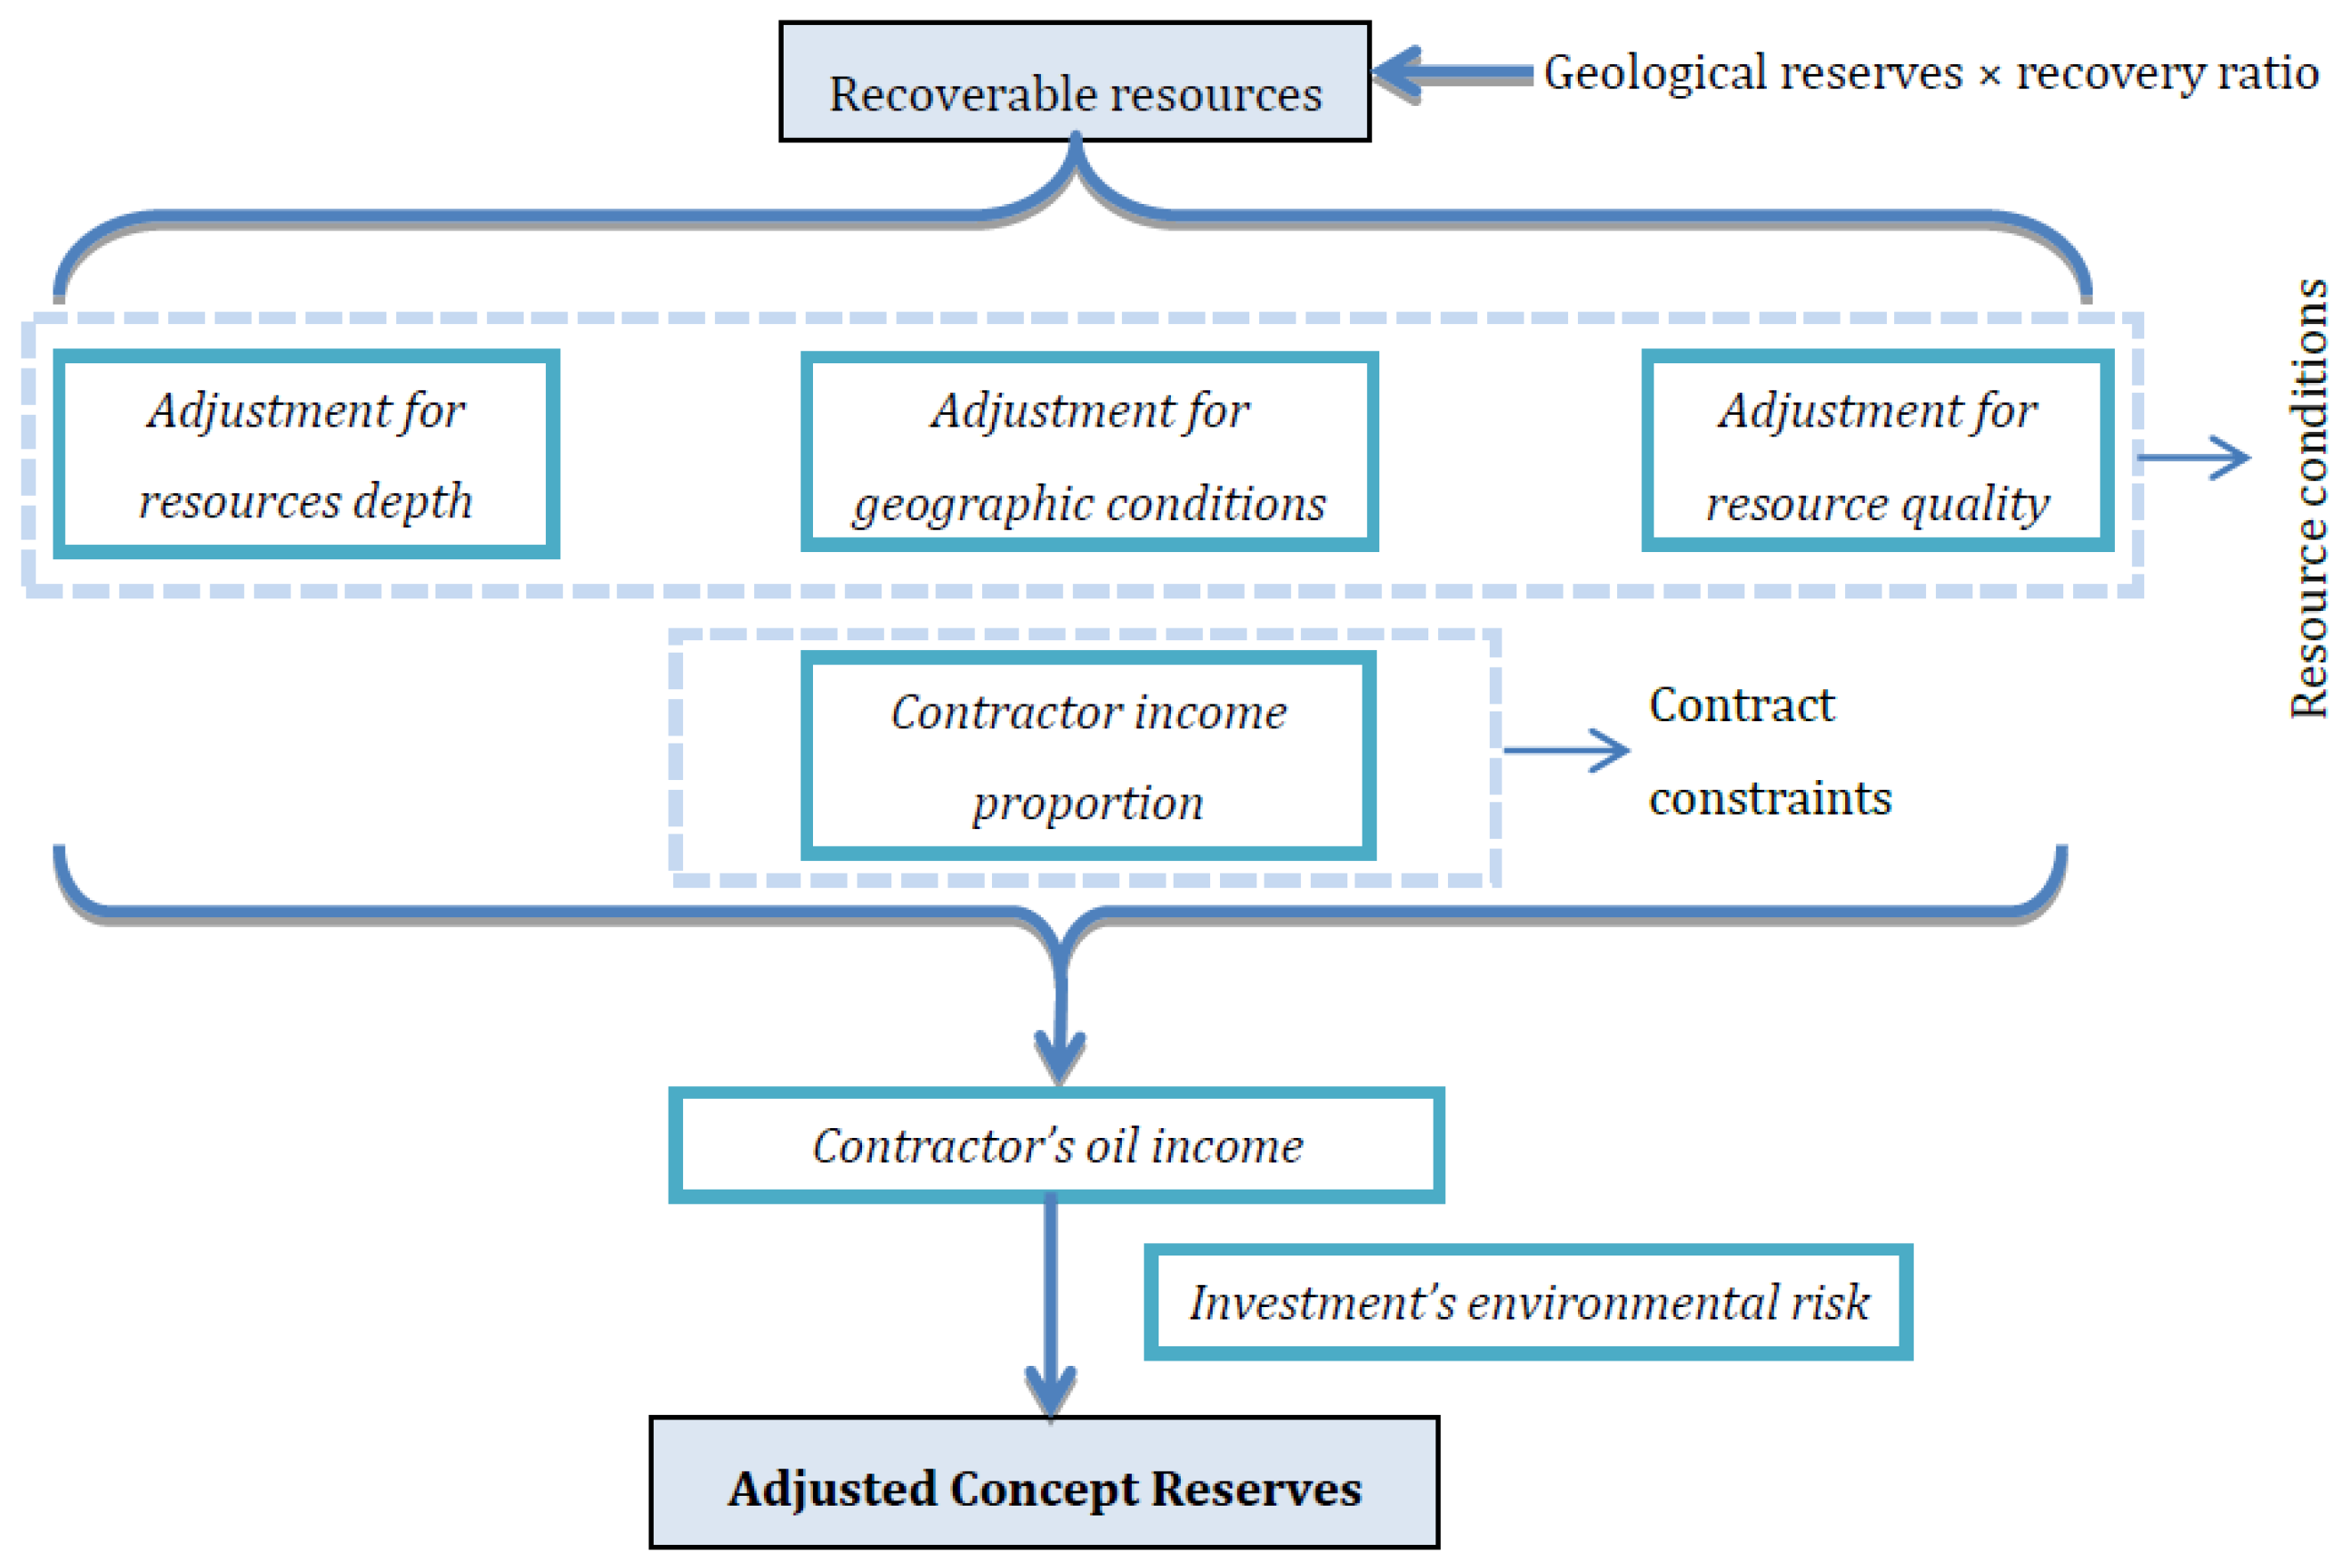
3.5. The Evaluation Model of International Oil Projects
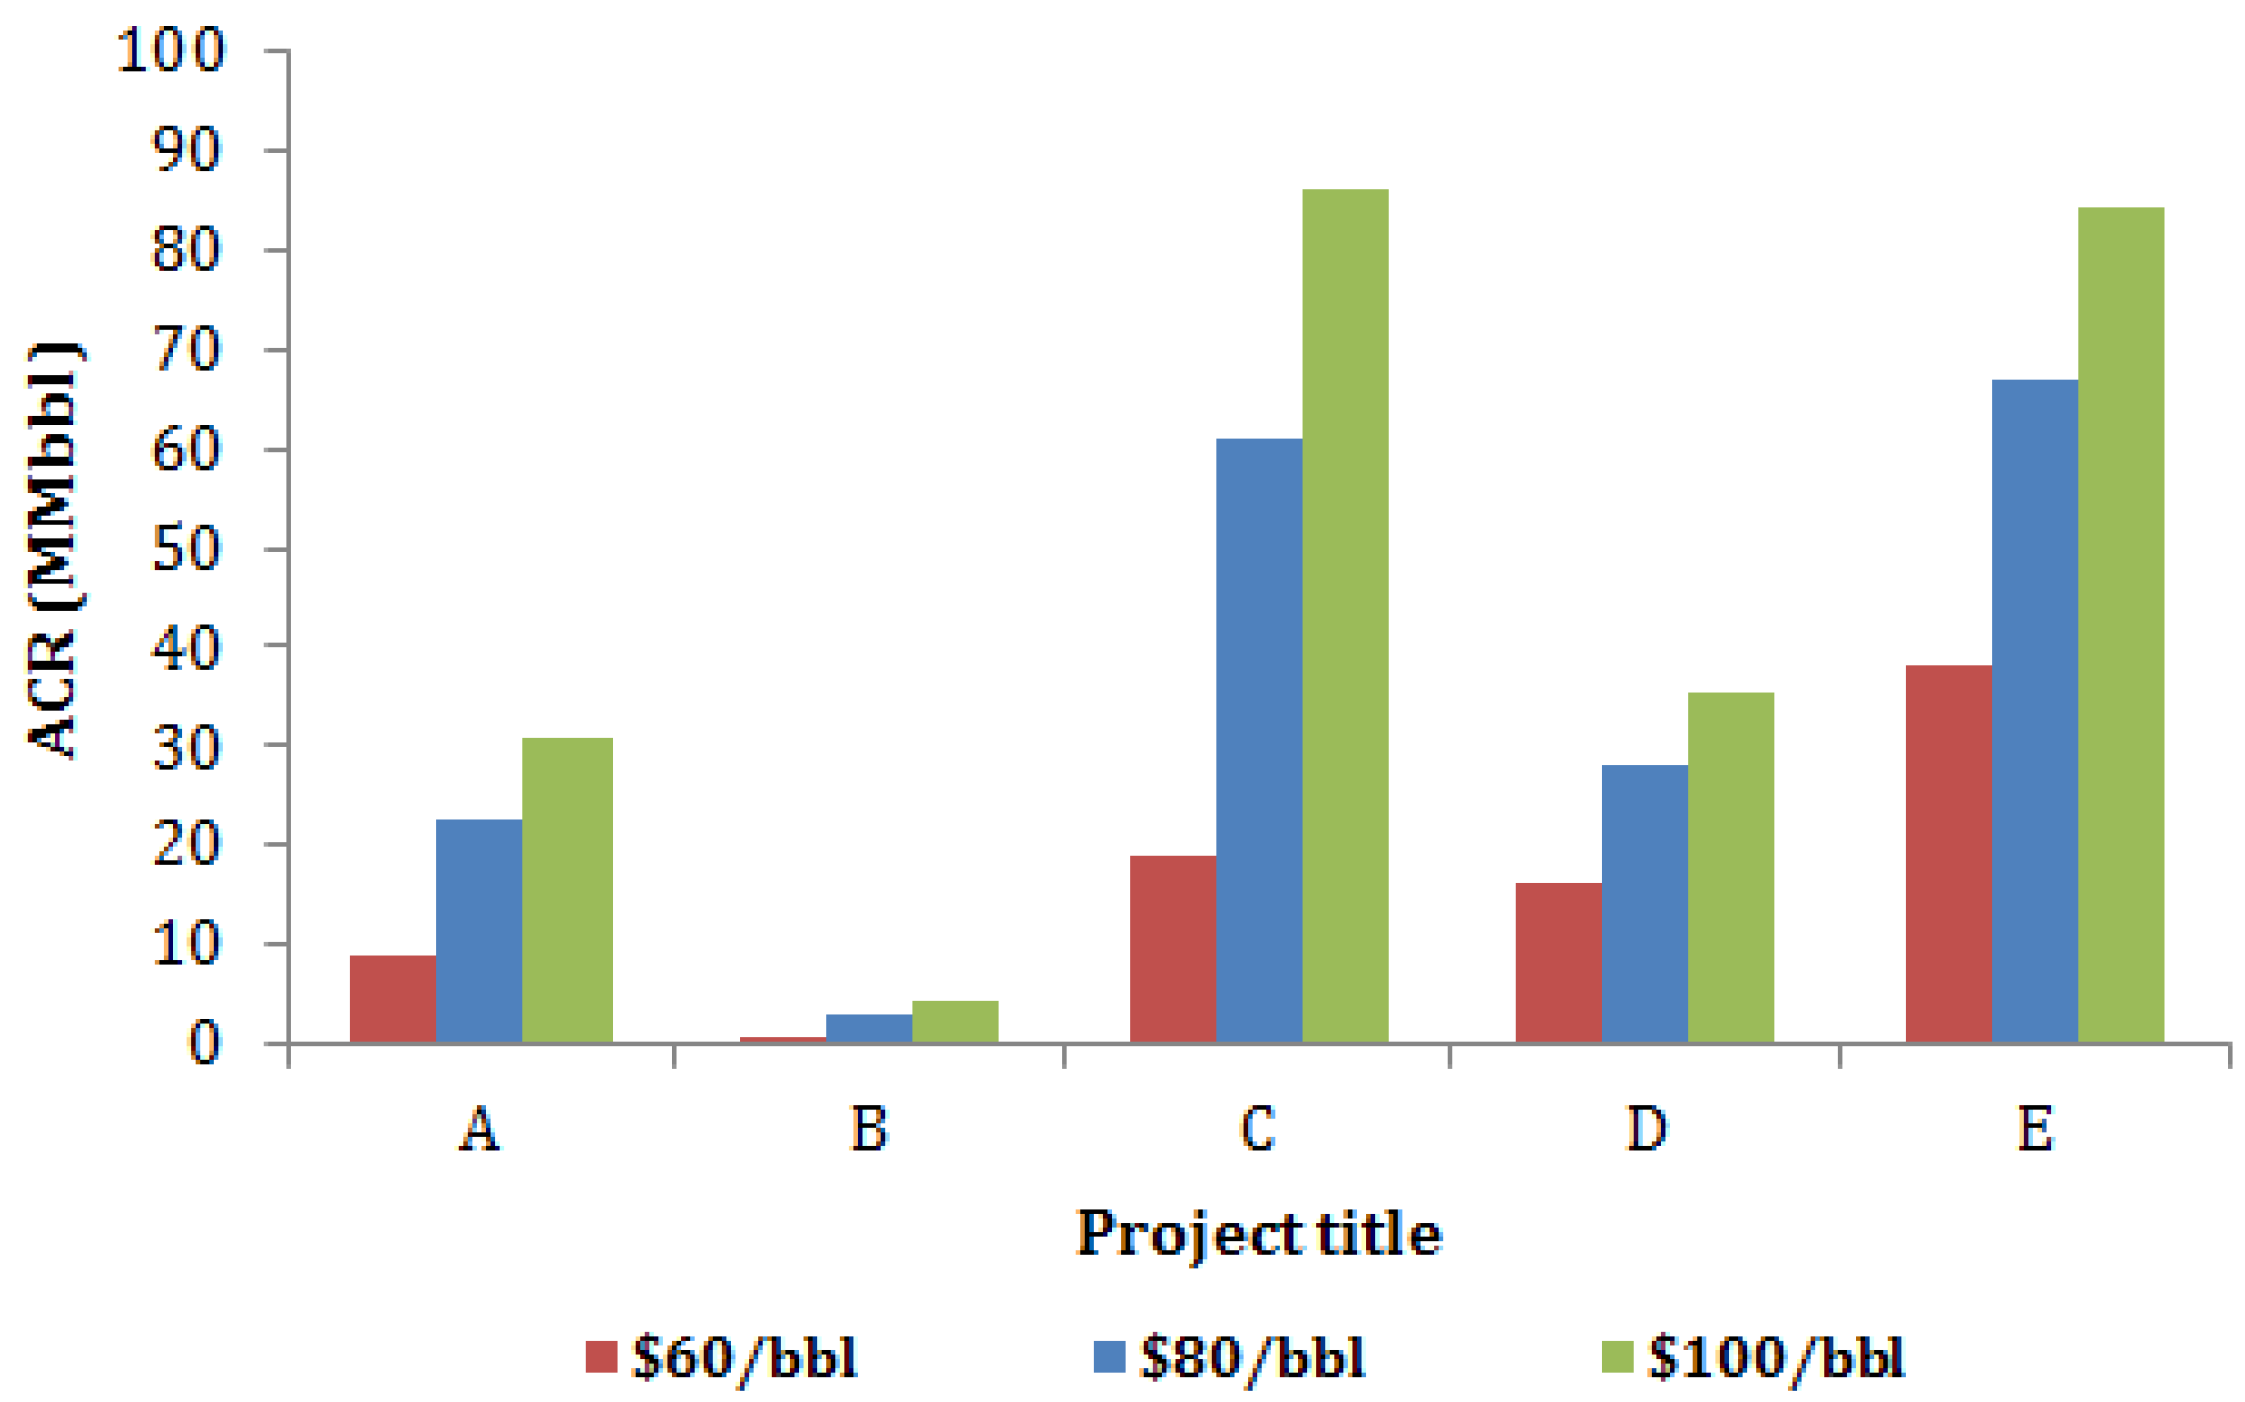
An integrated evaluation model for international oil projects can be built utilizing the factor adjustments described above. The model is based on the remaining recoverable reserves, adjusted for differences in resource depth, geographic conditions, and resource quality and multiplied by the contractor income ratio in accordance with the contract. Finally, after incorporating the investment environment risks of the host country, we obtain a ranking index, the Adjusted Concept Reserves (ACR).
N * = N 2 ( 1 S d e p t h S g ) S q I O C % f e = ( N 0 f 1 N 0 f 2 ) [ 1 0.3747 × p - 0.238 ( 1 + h h 0 h 0 ) 0.2619 × p - 0.32 d f s ] S q I O C % [ 1 + ( b R R h R h ) s e ]
The problem with ACR is that it does not consider the investment scale. The unit investment efficiency cannot be reflected using N* as the ranking index without considering the investment scale. If the ACR values of two blocks are similar, the block that has a lower investment scale provides a greater economic benefit. Therefore, we can use “N*/Total Investment” as an evaluation index to determine the development ranking of international oil projects.

4. Example

In Africa, oil and gas resources are abundant, while the degree of exploration is relatively low [1]. Oil and gas resources are mainly concentrated in North Africa and West Africa. In addition, the fiscal terms of oil contracts in Africa are more relaxed [36]. Thus, Africa is a hotspot for international oil exploration and development. This paper considers five exploration projects in Africa as examples and evaluates the projects’ value and investment priorities. The resource conditions of each project are shown in Table 6.
Through an analysis of the fiscal terms of the five projects, we establish five content areas: deposits, royalties, the cost recovery ratio, the profit-sharing ratio, and income tax. The fiscal terms of the five projects are shown in Table 7.
Adjustment for resource depth. The oil price is inherently uncertain [42,43]. This paper adopts the average Brent oil price in 2014 to assess the projects. Substituting the oil price, which is $99.08 (Source: Platts price of Reuters [44]), into Equation (4), we determine that m is 0.12. Related data show that the number of global onshore drilling wells is 95,036, and total drilling depth is 210,983 thousand meters [45]. The average depth of the land is 2220 meters. Substituting the parameters above into Equation (3), we obtain the adjustment coefficients for different resource depths (Table 9).
Adjustment for geographic conditions. Substituting the oil price into Equation (6), we determine that e is 0.058. The adjustment coefficient for geographic conditions, incorporating the effect of different landforms, is shown in Table 9.
Adjustment for resource quality. Oil quality can be determined by API and the sulfur percentage. Based on the value coefficient for different oil quality (Table 4), the adjustment result is shown in Table 9.
Calculation of the contractor income ratio. To calculate the contractor income ratio, we need not only the fiscal terms but also the production costs, which are difficult to obtain in the risk exploration stage. Although production costs can be obtained by analyzing similar geological conditions, large deviations occur. Based on the factor adjustment method described above, we can directly use the regional average production cost (Source: Financial Report System, EIA [46]), which can be easily obtained, to calculate the contractor income ratio. The contractor income ratios of the five exploration projects are shown in Table 8. According to the changes in the contractor income ratio under different oil prices (Figure 7), we find a corresponding increase in the ratio of contractor income with rising oil prices. Among the five projects, the contractor income ratio for Project C shows the largest increase with rising oil prices; this result means that the fiscal terms of Project C are superior to the others. In addition, the contractor income ratio for Project B is the lowest; this result means that the fiscal terms of Project B are poor (the contractor income ratio is 1.65% under $100/bbl).
Adjustment for the investment environment risk. The assessment of the investment environment risk for host countries, with reference to the GCI published by the World Economy Forum, is shown in Table 5.
Substituting the related data for the five exploration projects above into the evaluation model, we can determine the integrated sorting results, which are shown in Table 9.
As shown in Table 9, we can determine that the remaining recoverable reserves and the contractor income ratio are the decisive factors affecting the quality of the international oil exploration projects, wherein the remaining recoverable reserves is the basic factor. Projects C and E should be developed as key projects, and the oil exploration firms should strive to obtain more blocks and equity in the future. In addition, we should note that the severe investment environment creates the potential for unpredictable losses that seriously restricts the sustainability of exploration and development projects. If possible, the oilfield security in these regions should be strengthened to ensure the success of exploration and development activities.
The ACR of each project at different oil prices (Figure 8) shows that the ACR of Project C increase rapidly in accordance with an increasing contractor income ratio; Project C is considered to be the most valuable among the five projects at $100/bbl. Based on the ACR of each project at different oil prices, which are shown in Figure 9, it shows that the values of Projects C and E are significantly higher than the other projects, and the value of Project B is too low for investment. Therefore, the investment priorities of these five projects should be E > C > D > A > B.
In the exploration phase of international oil projects, the main problems in project evaluation include a lack of data (generally, there are no evaluation data such as investment planning, development program, operating costs, etc.), a short evaluation time (the time between bid opening and bidding is short for international oil exploration projects, and the investment opportunities are fleeting, thus emphasizing the need to make investment decisions quickly), and the difficulties involved in multi-project comprehensive optimization. Through an analysis of an existing project evaluation method, we found that the net cash flow (NCF) method has higher requirements for the accuracy and completeness of evaluation data, and the evaluation process is comparatively complicated. Therefore, the NCF method has limitations when applied to oil exploration projects. Other evaluation methods also have problems that have been described in the introduction section and are therefore not suitable for evaluations for international oil exploration. The integrated evaluation method–based technical and economic factors utilized in this paper can meet the requirements of rapid evaluation with insufficient data, and the obtained evaluation indicator ACR can provide decision support for multi-project optimization. However, in contrast to the NCF method, which determines the absolute economic value of a project, the ACR describes the relative value of projects and can be used as an indicator for project optimization and can provide rankings to guide investment decisions. When evaluation data are complete, we continue to recommend calculating the net present value of a project and coordinating it with the evaluation method we developed in this paper to obtain complementary information.

5. Conclusions

The objective of this research is to analyze the factors affecting the investment benefits of international oil exploration projects and to develop an integrated evaluation method based on five elements. The main influencing factors can be divided into technical aspects, including geological factors, resource quality, geographic conditions, and economic aspects, including contract terms and the investment environment. An evaluation model for international oil exploration projects can be established by combining the five adjustment factors, and we propose the concept of Adjusted Concept Reserves (ACR). The “ACR/investment scale” can be used as an evaluation indicator to rank international oil exploration projects and to determine investment priorities.
Through the practical evaluation of oil projects in Africa, we determine that the remaining recoverable reserves and the contractor income ratio are the key factors affecting the merits of projects. In addition, the investment environment of host countries, which directly affects the sustainability of projects, should receive special attention. With rising oil prices, the contractor income ratio and the ACR of each project will increase accordingly; however, these increased rates, which are determined by different fiscal terms, vary. The cumulative ACR can be used as a ranking index to eliminate the variance in the results when each project’s ACR changes under different oil prices.
The advantage of this method is that, although the evaluation data may not be complete, we can make adjustments according to basic geological differences. In addition, considering that the fiscal terms had a greater influence on contractor benefits and the investment environment risk of the host country, we can evaluate international oil projects from technical and economic perspectives based on geological reserves and objectively classify oil exploration projects in order of priority. This method avoids the requirements for data integrity and accuracy in the traditional economic evaluation method, the NPV, and greatly simplifies the evaluation parameters. By applying this method, the objective of rapid evaluation of an international oil exploration project can be achieved, and practicability has been demonstrated.

Acknowledgments

Funding for this work was provided by National Social Science Major Project through the research on Succeed Strategy of Overseas Oil and Gas Resources Based on the Perspective of China’s Petroleum Security under the project number 11&ZD164 and Government Project number 2014BAC01B02. In addition, the authors wish to thank the editors and reviewers of this manuscript for their elaborate work.

Author Contributions

This paper establishes an integrated evaluation model to maximize investment benefits within the constraints of technical and economic factors. This paper also proposes a dynamic calculation method of indicators’ weight associated with oil prices. This study is important to help oil companies optimize international oil projects and design reasonable investment strategies.

Conflicts of Interest

The authors declare no conflict of interest.

Nomenclature

N0
is geological reserves
N1
is recoverable resources
N2
is the remaining recoverable resources
f1
denotes the recovery ratio for different types of reservoirs
f2
denotes the recovery percentage of the reserves
Sdepth
represents the adjustment coefficient of different reservoir depths
m
is the proportion of the total costs associated with the resource depth (including drilling investment and the operating costs associated with well depth) in sales revenue
h
is the resource depth of the target project
h0
is the average resource depth
Sg
represents the adjustment factor for different geographic conditions
e
is the proportion of ground construction investment over sales revenue
d
is the adjustment factor for ground construction investment for different landforms
f
is the adjustment factor for ground construction investment for different types of infrastructure
s
is a subjective adjustment factor.
IOC%
represents the contractor income ratio
Cr
is the recycling oil cost per barrel
p
is the oil price
ROY
is the royalties
DMO
is the domestic market obligation
TAX
is the amount of taxes in the contract
Rg
is the government’s share of the oil profit
fe
represents the risk adjustment factor of the investment environment
b
is the risk-adjusted weight of the investment environment
R
is the national competitiveness index
Rh
is the maximum of the competitiveness index
se
is the subjective adjustment factor
N*
represents the Adjusted Concept Reserves

References

  1. BP. BP Statistical Review of World Energy 2014. Available online: http://www.bp.com/content/dam/bp-country/de_de/PDFs/brochures/BP-statistical-review-of-world-energy-2014-full-report.pdf (accessed on 17 February 2016).
  2. Charlez, P. Acceptability of New Oil & Gas Projects and Reputation Management. A Major Challenge for the International Oil Companies; Society of Petroleum Engineers: Richardson, TX, USA, 2012. [Google Scholar]
  3. Wang, Q.; Wang, J. The issues of overseas oil and gas exploration and new project development. China Pet. Explor. 2012, 4, 47–52. (In Chinese) [Google Scholar]
  4. Otillar, S.P. Risk Mitigation in International Oil & Gas Developments. In Proceedings of the Offshore Technology Conference, Houston, TX, USA, 3–6 May 2010.
  5. Walls, M.R.; Dyer, J.S. Risk Propensity and Firm Performance: A Study of the Petroleum Exploration Industry. Manag. Sci. 1996, 42, 1004–1021. [Google Scholar] [CrossRef]
  6. Clare, J.B.; Armstrong, L.J. Comprehensive Risk Evaluation Approaches for International E&P Operations; Society of Petroleum Engineers: Richardson, TX, USA, 2006. [Google Scholar]
  7. Emhjellen, M.; Alaouze, C.M. A comparison of discounted cashflow and modern asset pricing methods—Project selection and policy implications. Energy Policy 2003, 31, 1213–1220. [Google Scholar] [CrossRef]
  8. Emhjellen, M.; Alaouze, C.M. Project valuation when there are two cashflow streams. Energy Econ. 2002, 24, 455–467. [Google Scholar] [CrossRef]
  9. Brealey, R.A.; Myers, S.C. Principles of Corporate Finance; McGraw-Hill: New York, NY, USA, 1991. [Google Scholar]
  10. Frenette, C.T.; Saeedi, M.; Henke, J.L. Integrated Economic Model for Evaluation and Optimization of Cyclic Steam Stimulation Projects; Society of Petroleum Engineers: Richardson, TX, USA, 2016. [Google Scholar]
  11. Luo, D.K.; Dai, Y.J.; Xia, L.Y. Economic evaluation based policy analysis for coalbed methane industry in China. Energy 2011, 36, 360–368. [Google Scholar] [CrossRef]
  12. Dias, M.A.G. Valuation of exploration and production assets: An overview of real options models. J. Petrol. Sci. Eng. 2004, 44, 93–114. [Google Scholar] [CrossRef]
  13. Ho, S.-H.; Liao, S.-H. A fuzzy real option approach for investment project valuation. Expert. Syst. Appl. 2011, 38, 15296–15302. [Google Scholar] [CrossRef]
  14. Armstrong, M.; Galli, A.; Bailey, W.; Couët, B. Incorporating technical uncertainty in real option valuation of oil projects. J. Petrol. Sci. Eng. 2004, 44, 67–82. [Google Scholar] [CrossRef]
  15. Haque, M.A.; Topal, E.; Lilford, E. A numerical study for a mining project using real options valuation under commodity price uncertainty. Resour. Pol. 2014, 39, 115–123. [Google Scholar] [CrossRef]
  16. Amiri, M.P. Project selection for oil-fields development by using the AHP and fuzzy TOPSIS methods. Expert. Syst. Appl. 2010, 37, 6218–6224. [Google Scholar] [CrossRef]
  17. Liu, J.; Li, Q.; Wang, Y. Risk analysis in ultra deep scientific drilling project—A fuzzy synthetic evaluation approach. Int. J. Inform. Tech. Proj. Manag. 2013, 31, 449–458. [Google Scholar] [CrossRef]
  18. Shakhsi-Niaei, M.; Iranmanesh, S.H.; Torabi, S.A. Optimal planning of oil and gas development projects considering long-term production and transmission. Comput. Chem. Eng. 2014, 65, 67–80. [Google Scholar] [CrossRef]
  19. Dong, Z.; Zhen, W.; Lin, Z.; Ming-ming, L.I.U. Construction and application of risk rating and ranking model for international oil and gas exploration & production projects. J. China Univ. Petrol. Ed. Natrual Sci. 2010, 34, 164–169. [Google Scholar]
  20. Dey, P.K. Integrated project evaluation and selection using multiple-attribute decision-making technique. Int. J. Prod. Econ. 2006, 103, 90–103. [Google Scholar] [CrossRef]
  21. Di Somma, M.; Yan, B.; Bianco, N.; Graditi, G.; Luh, P.B.; Mongibello, L.; Naso, V. Operation optimization of a distributed energy system considering energy costs and exergy efficiency. Energ. Convers. Manag. 2015, 103, 739–751. [Google Scholar] [CrossRef]
  22. Castillo, L.; Dorao, C.A. Decision-making in the oil and gas projects based on game theory: Conceptual process design. Energ. Convers. Manag. 2013, 66, 48–55. [Google Scholar] [CrossRef]
  23. Rao, S.S. Game theory approach for multiobjective structural optimization. Comput. Struct. 1987, 25, 119–127. [Google Scholar] [CrossRef]
  24. Bhattacharya, A.; Kojima, S. Power sector investment risk and renewable energy: A Japanese case study using portfolio risk optimization method. Energy Policy 2012, 40, 69–80. [Google Scholar] [CrossRef]
  25. Arnesano, M.; Carlucci, A.P.; Laforgia, D. Extension of portfolio theory application to energy planning problem—The Italian case. Energy 2012, 39, 112–124. [Google Scholar] [CrossRef]
  26. Delarue, E.; De Jonghe, C.; Belmans, R.; D’Haeseleer, W. Applying portfolio theory to the electricity sector: Energy versus power. Energy Econ. 2011, 33, 12–23. [Google Scholar] [CrossRef]
  27. Dutra, C.C.; Ribeiro, J.L.D.; de Carvalho, M.M. An economic–probabilistic model for project selection and prioritization. Int. J. Prod. Econ. 2014, 32, 1042–1055. [Google Scholar] [CrossRef]
  28. Kemp, A.G.; Stephen, L. Price, cost and exploration sensitivities of prospective activity levels in the UKCS: An application of the Monte Carlo technique. Energy Policy 1999, 27, 801–810. [Google Scholar] [CrossRef]
  29. Terry, R.E.; Whitman, D.L.; Page, J.B. Monte Carlo Simulation of Heavy Oil Recovery Economics. In Energy Developments: New Forms, Renewables, Conservation; Curtis, F.A., Ed.; Pergamon Press, Ltd.: Oxford, UK, 1984; pp. 71–74. [Google Scholar]
  30. Wang, P.; Li, Z. The research of dynamic cost models for oil and gas reserves. J. Xi’an Petrol. Univ. 2004, 3, 35–39. (In Chinese) [Google Scholar]
  31. Ma, H. Differences analysis of economic evaluation methods for overseas oil and gas exploration project. Petrol. Petrochemical Today 2008, 7, 30–33. (In Chinese) [Google Scholar]
  32. Zuo, D.; Zhao, Y.-P.; Du, C. Average incremental cost method and its application in evaluation of undeveloped reserves. Fault-Block Oil Gas Field 2012, 2, 232–236. (In Chinese) [Google Scholar]
  33. Cheng, L.; Liu, B.; Rao, K. Economic Optimization Program and Risk Factors Analysis of Oil and Gas Cooperation; China Energy Strategy Research Center, China University of Petroleum: Beijing, China, 2009. (In Chinese) [Google Scholar]
  34. He, Y.; Zhao, H. An Introduction to the Oil Industry; Petroleum Industry Press: Beijing, China, 2006. (In Chinese) [Google Scholar]
  35. Lu, M.; Cheng, Y. Regulation of Petroleum Reserves Estimation; Ministry of Land and Resources of the People’s Republic of China: Beijing, China, 2005. (In Chinese)
  36. Luo, D.; Yan, N. Assessment of fiscal terms of international petroleum contracts. Petrol. Explor. Dev. 2010, 37, 756–762. [Google Scholar] [CrossRef]
  37. Feng, Z.; Zhang, S.-B.; Gao, Y. On oil investment and production: A comparison of production sharing contracts and buyback contracts. Energy Econ. 2014, 42, 395–402. [Google Scholar] [CrossRef]
  38. Zhao, X.; Luo, D.; Xia, L. Modelling optimal production rate with contract effects for international oil development projects. Energy 2012, 45, 662–668. [Google Scholar] [CrossRef]
  39. Ge, A.; Guo, P.; Xu, H. Theory & Practice of International Oil Cooperation; Petroleum Industry Press: Beijing, China, 2004. (In Chinese) [Google Scholar]
  40. China National Petroleum Corporation (CNPC). Long-Distance Pipeline Engineering Manual; CNPC: Beijing, China, 2010. (In Chinese) [Google Scholar]
  41. Forum, W.E. Global Competitiveness Report; World Economic Forum: Geneva, Switzerland, 2014. [Google Scholar]
  42. Creti, A.; Ftiti, Z.; Guesmi, K. Oil price and financial markets: Multivariate dynamic frequency analysis. Energy Policy 2014, 73, 245–258. [Google Scholar] [CrossRef]
  43. Katircioglu, S.T.; Sertoglu, K.; Candemir, M.; Mercan, M. Oil price movements and macroeconomic performance: Evidence from twenty-six OECD countries. Renew Sustain. Energ. Rev. 2015, 44, 257–270. [Google Scholar] [CrossRef]
  44. Reuters. Platts Price. Available online: http://www.platts.com/products/market-data-oil (accessed on 18 February 2016).
  45. Zheng, L.; Liang, H. World Oil Industry Statistics 2012; China National Petroleum Corporation (CNPC) Economic & Technical Research Institute: Beijing, China, 2012. (In Chinese) [Google Scholar]
  46. U.S. Energy Information Administration (EIA). Financial Report System. Available online: http://www.eia.gov/cfapps/frs/frstables.cfm (accessed on 18 February 2016).
Figure 1. The evaluation flowchart for an international oil exploration project.
Sustainability 08 00188 g001
Figure 2. Changes in the proportion of total costs associated with resource depths over sales revenue under different oil prices.
Sustainability 08 00188 g002
Figure 3. Changes in the proportion of ground construction investment over sales revenue under different oil prices.
Sustainability 08 00188 g003
Figure 4. The calculation process for the contractor income ratio from a royalty contract.
Sustainability 08 00188 g004
Figure 5. The calculation process for the contractor income ratio from a production sharing contract.
Sustainability 08 00188 g005
Figure 6. The Global Competitiveness Index.
Sustainability 08 00188 g006
Figure 7. Changes in the contractor income ratio under different oil prices.
Sustainability 08 00188 g007
Figure 8. The ACR of each project under different oil prices.
Sustainability 08 00188 g008
Figure 9. The cumulative ACR of each project under different oil prices.
Sustainability 08 00188 g009
Table 1. The influential factors in an international oil project.
Main FactorsBasic Technical FactorsMerged Factors
Geological factorsReservoir bed, trap types, sedimentary facies, resource abundance, oil-bearing area, average effective thickness, oil saturation, crude oil volume factor, etc.Reserves scale
Reservoir type, porosity, permeability, natural energy, reservoir continuity, water saturation, reservoir wettability, oil viscosity, gas-oil ratio, bubble point pressure, reservoir heterogeneity, etc.Recovery ratio
Reservoir depthReservoir depth
Resources qualityChemical composition: hydrocarbons, non-hydrocarbon compounds
Physical properties: specific gravity, viscosity
Price ratio
Geographic conditionsTransportation conditions, communication conditions, social services, location, topography, physioclimate, market conditions, etc.Basic conditions
Contract termsContract type, contract period, signing bonus, minimum obligation workload, domestic market obligation, royalties, cost Recovery, profit distribution, government equity, taxes, etc.Contractor income proportion
Investment environmentLegal soundness, political stability, foreign policy stability, economic system, GDP per capita, inflation rate, labor supply, industry competition, exchange rate, interest rate, religious culture, population qualityInvestment’s environmental risk
Table 2. The adjustment coefficients for topography.
TopographyAdjustment Coefficients (d)
Plain1
Gobi0.92–0.96
Desert1.05–1.08
Marsh1.15–1.25
Hills1.02–1.06
Mountain1.2–1.3
Source: Long-distance Pipeline Engineering Manual, CNPC [40].
Table 3. Subjective adjustment coefficient.
LevelScore (l) l l ¯ l ¯ Adjustment Coefficient (s)
Excellent50.6670.333
Good40.3330.667
Fair301
Poor2−0.3331.333
Very poor1−0.6671.667
Table 4. The value coefficients for different oil qualities.
Quality GradeAPI °Viscosity (cP)Sulfur Content (%)Carbon Residue (%)Value Coefficient
Excellent oil40–45≤5≤0.5≤61.04
high quality oil>31.15–20≤0.5≤61.0
customary quality oil22.3–31.120–500.5–1.0>80.88
low quality oil<22.350–1501.0–2.0>80.70
inferior oil<10≤10,000>2.0>80.68
Source: The quality of crude oil and the wellhead price of different oilfields, including Daqing, Shengli, Yumen, Urho, and Xinjiang.
Table 5. Adjustments for the macro investment environment of part oil-producing countries.
No.CountryGCIfe
1Singapore5.671
2Qatar5.240.984832451
3United Arab Emirates4.920.973544974
4Indonesia4.530.95978836
5Kazakhstan4.410.955555556
6Brazil4.330.952733686
7Russia4.250.949911817
8Iran4.070.94356261
9Nigeria3.570.925925926
10Chad2.850.900529101
Table 6. The resources conditions for oil exploration projects in Africa.
Project TitleBlock Area (km2)Remaining Recoverable Reserves (MMbbl)Resource Depths (m)TopographyResource Quality (API)
A27,516658.8372950–3400Desert30–35
B29,000345.82140–2379Plain26–44
C25,694610.1892384–2510Plain35–45
D17,747504.1121817–2081Tropical jungle21.6
E45,876930.6041347–1688Plain13–34
Table 7. The fiscal terms of the five projects in Africa.
Project TitleContract TypeDeposit aRoyalty RatesCost Recovery LimitProfit Sharing Ratio (Contractor)Income Tax
APSCS12.50%70.00%20%–60%35%
BPSCS18.5%70.00%30%85%
CRoyaltyS,D,P16.50%100.00%-50%
DPSCS,D,P0.00%60.00%20%–30%0%
EPSCS,D,P0.00%60.00%20%–30%0%
a S is signature deposit; D is discovery bonus; P is production bonus.
Table 8. The contractor income ratios of the five exploration projects.
Project titleABCDE
Oil price (USD/bbl)99.0899.0899.0899.0899.0899.0899.0899.0899.0899.08
Royalties16.5%16.348218.50%18.329816.5%16.34820.00%00.00%0
Recoverable costs *35.01 + 9.9344.9435.01 + 9.9344.9435.01 + 9.9344.9435.01 + 9.9344.9435.01 + 9.9344.94
Oil profit-41.755-35.8102 37.7918-54.14-54.14
Contractor share of oil profit (1)25.0%10.4387530.0%10.74306 25.0%13.53525.0%13.535
Domestic market obligation---- ----
Contractor share of oil profit (2)-10.43875-10.74306 -13.535-13.535
Income tax35%3.653562585%9.13160150%18.8959-0-0
Oil profit after tax-6.7851875-1.611459-18.8959-13.535-13.535
Contractor income ratio-6.85%-1.63%-19.07%-13.66%-13.66%
* The recoverable costs include unit discovery costs and unit operating costs. The unit discovery costs are calculated by (weighted average expenditure for exploration and development in the past three years − blocks expenses)/(newly verified reserves − purchasing reserves).
Table 9. The integrated sorting results for the exploration projects in Africa.
Project TitleRemaining Recoverable Reserves (MMbbl)Adjustment for Resource DepthAdjustment for Geographic ConditionsAdjustment for Resource QualityContractor Income RatioInvestment Environment Ristable9kAdjusted Concept Reserves (MMbbl)
C610.1890.129729730.058119.07%0.90052910185.12247995
E 930.6040.0841351350.0580.8813.66%0.87054673783.54699279
D 504.1120.1135135140.0630.713.66%0.88818342235.25790288
A658.8370.2027027030.05816.85%0.91358024730.47331183
B345.80.1160540540.05811.63%0.9259259264.301165184

