1. Introduction
Urbanization is a key driver that increases the frequency and intensity of urban flooding. Rapid sprawl in urban areas reduces green spaces and increases the amount of impervious surfaces, which can exacerbate flooding. Increases in impervious surfaces are known to significantly influence the hydrological cycle [
1]. Moreover, decreases of evapotranspiration and reduced rainwater infiltration can increase average runoff and peak runoff amounts [
2,
3,
4]. Consequently, flooding in urbanized areas often results in huge losses of life and property. Urban infrastructure in developing countries is outdated and not capable of mitigating the increased precipitation expected in some areas as a result of climate change. Therefore, it is important that cities design fundamental countermeasures to prevent damage from urban flooding.
The development of appropriate flood risk management strategies to flooding should consider long-term perspectives (e.g., expected future rainfall amounts, although climate change impacts can be unpredictable and complex) and aim to increase an area’s resilience to flooding. Recently, as rainfall has become more concentrated over short periods of time, substantial amounts of damage due to pluvial flooding have occurred in urban areas. This includes damage to social infrastructure, as well as losses of human life and property. Conventionally, storm water management has been focused on drainage systems via underground pipes. However, these conventional approaches have exceeded in many cases, because conventional approaches have been designed based on historical events. This makes it difficult to deal with extreme rainfall events that exceed the designated capacity. The frequency of extreme rainfall events is expected to increase with projected climate change, which may cause conventional stormwater management systems to be exceeded [
5]. After several problems of conventional storm water management systems, there have been new efforts to study the effects of green spaces on urban storm water management [
2].
The effects of urban green spaces on runoff have been studied in various fields [
6,
7,
8]. Urban green spaces generally include parks, public green spaces, allotments, green corridors, street trees, urban forests, roof and vertical greening, private gardens and domestic gardens [
9]. Increasing urban green spaces is considered to be an effective approach to reducing the adverse impacts of urbanization on the hydrological cycle [
10,
11]. Urban green spaces intercept water from the canopy and stem areas and enhance infiltration into the soil and root systems [
12,
13]. In other words, urban green spaces improve the retentiveness of hydrological systems in urban areas and dampen peak flows from storms that can lead to flooding.
Therefore, urban green space preservation and restoration should represent a potentially effective option to reduce urban flood risks, and its effectiveness has been highlighted in notable urban water management studies [
14,
15,
16]. Expansion of urban green spaces is not only an economical and environmentally-friendly approach to dealing with storm water runoff and urban flooding, but can also improve the resiliency and sustainability of cities in many ways, such as by decreasing the susceptibility of cities to heat waves [
17,
18,
19,
20,
21,
22].
Effective mitigation of surface runoff with urban green spaces is highly dependent on the physical factors and characteristics present in different neighborhoods. Thus, it is necessary to evaluate how increases in urban green spaces will reduce surface runoff in different neighboring areas. Several studies have analyzed properties of flooded areas and categorized the flooded area type by regional factors, such as land use, imperviousness, slope and the Topographic Wetness Index (TWI) [
23,
24,
25,
26]. However, there is a dearth of quantitative studies that have analyzed the flood reduction effect achieved through the introduction of green spaces based on geomorphological characteristics.
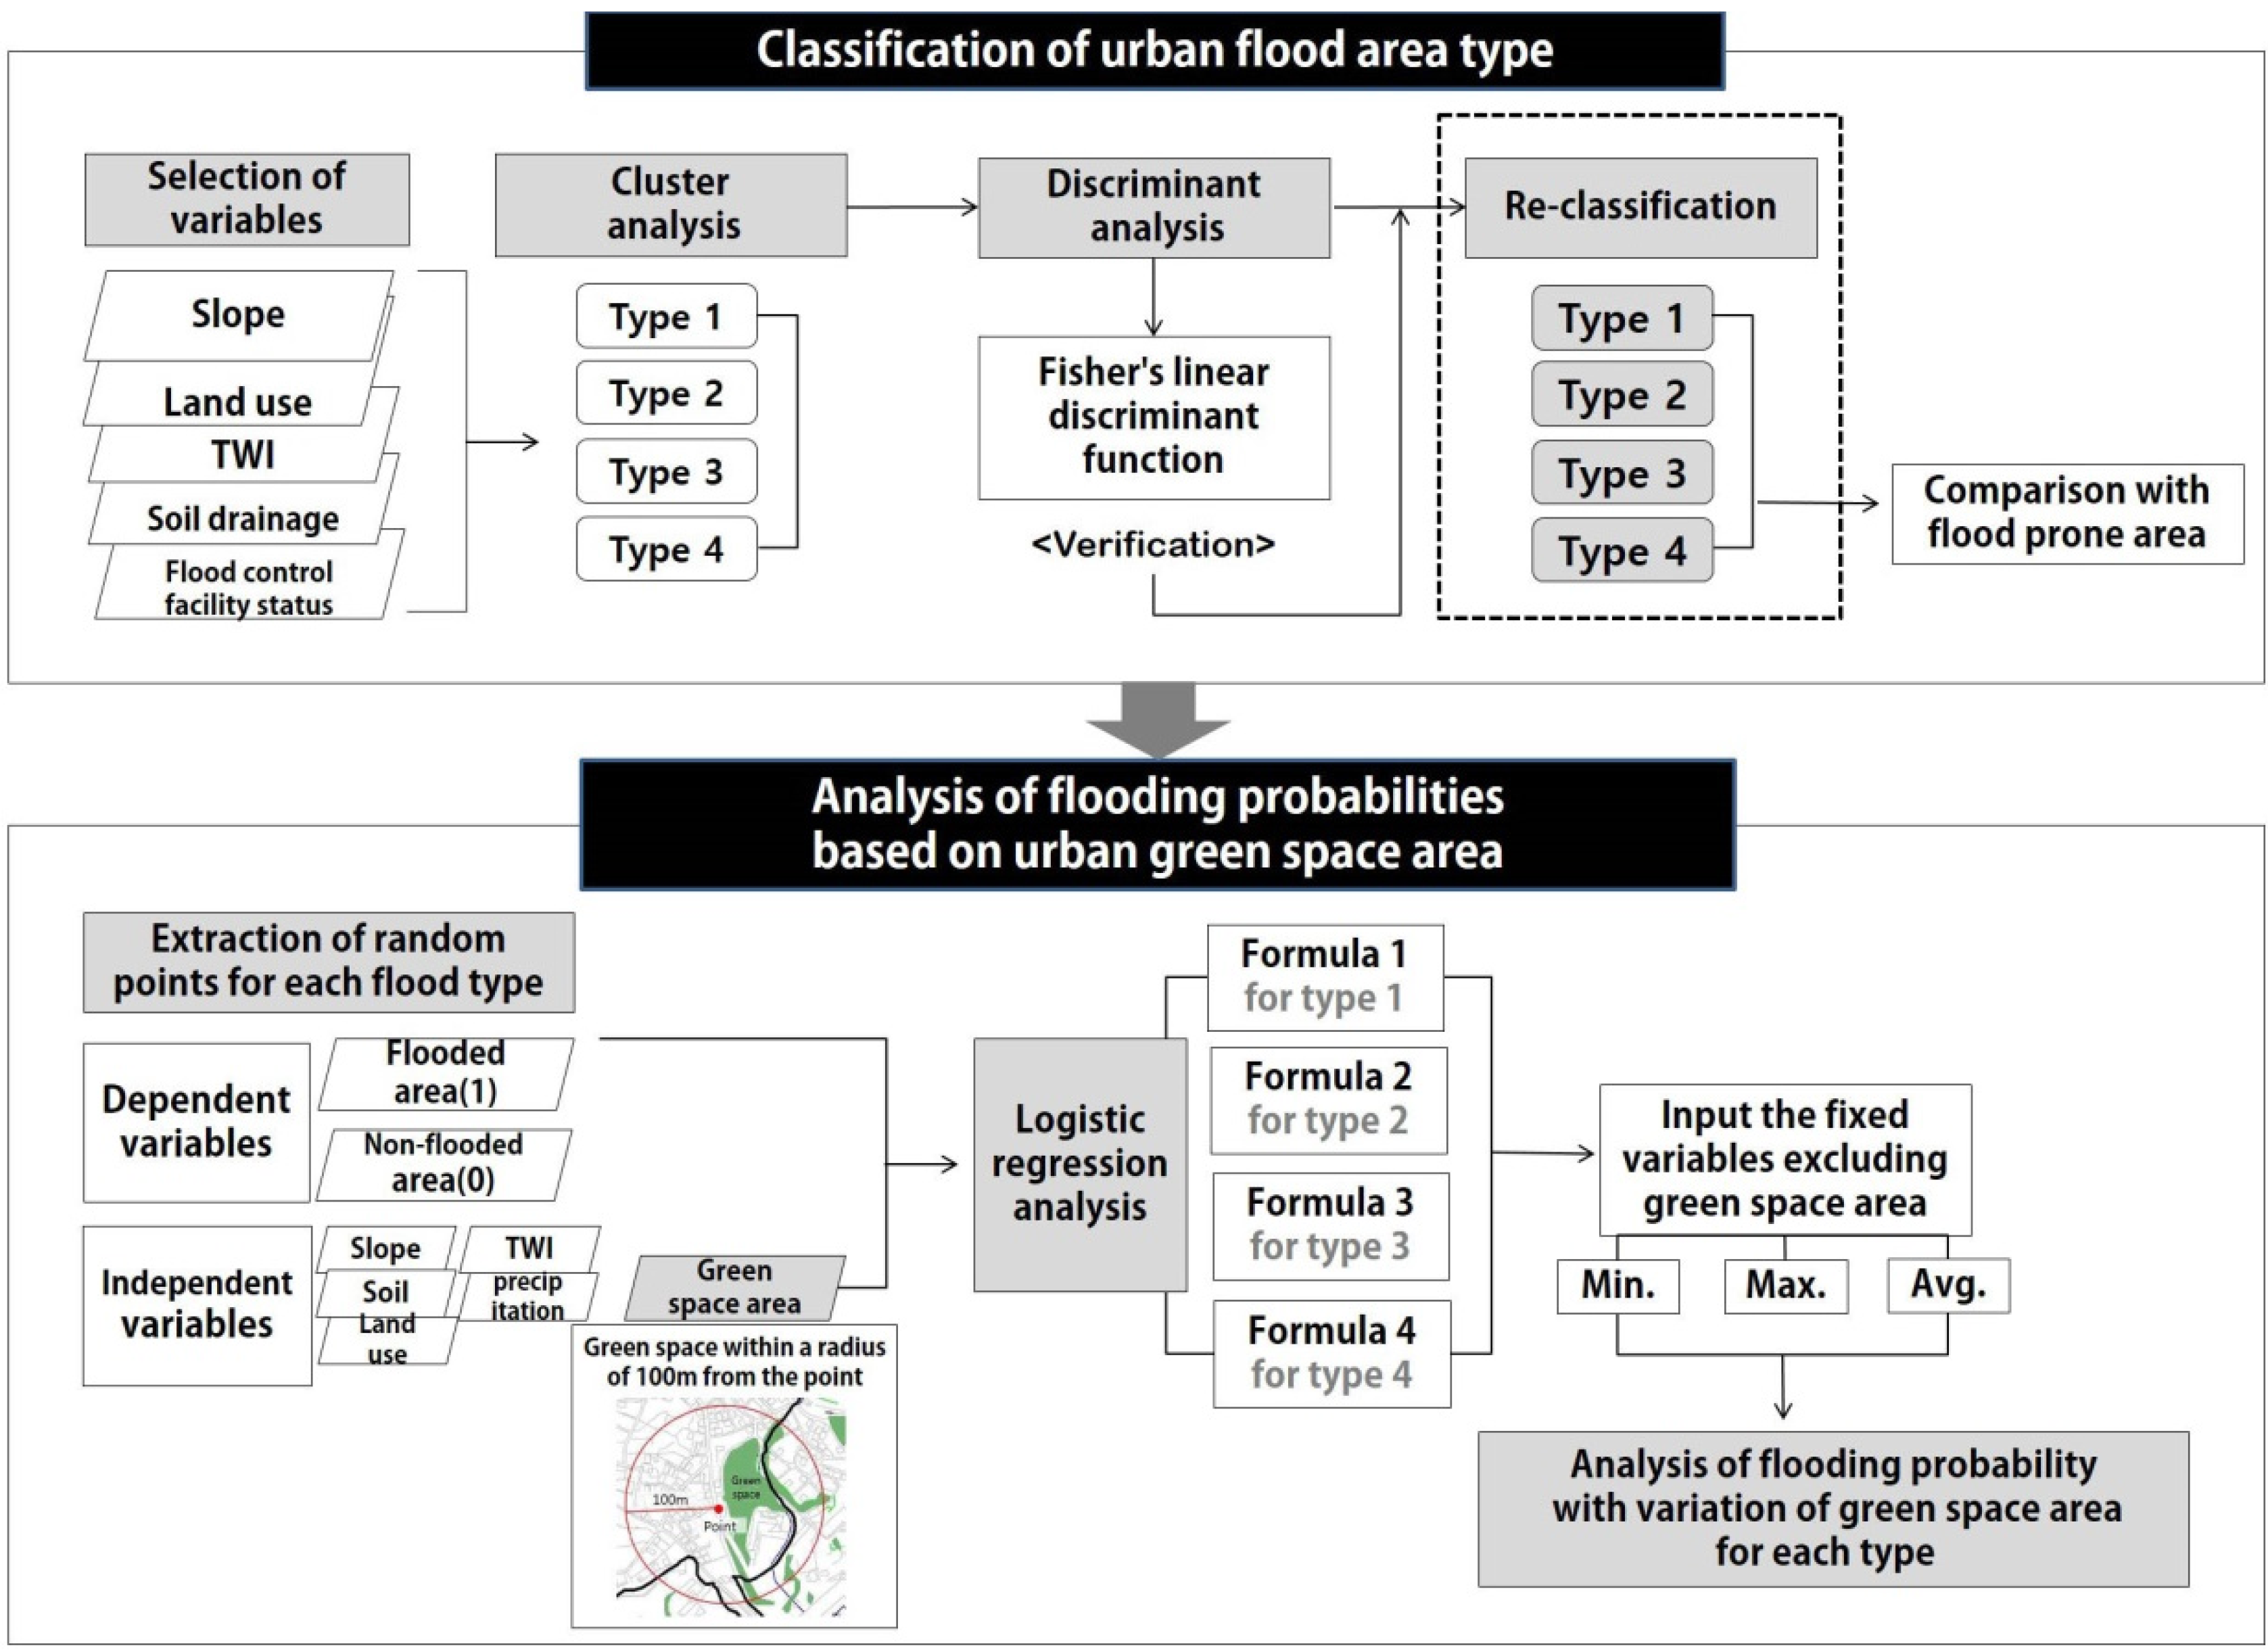
The spatial patterns in urban areas require comprehensive study for accurate quantification of the effects of green spaces on the hydrological cycle. Specifically, it is necessary to understand the regional characteristics to maximize the effects of urban green spaces on flooding and thereby make cities more resilient to the impacts of climate change. In this study, a multivariate analysis technique was used to distinguish four different types of urban flooded areas in Seoul, Korea. Afterwards, the probability of urban flooding was statistically analyzed for each flooded area type, and the impact on flood probabilities from increased urban green space area was analyzed.
3. Results
3.1. Classification of Urban Flooded Area Type
First, as a result of observing the dendrogram from the hierarchical cluster analysis performed during the first stage of analysis, flooding was divided into four types. Data were also analyzed preliminarily according to three and five types of flooded areas through the non-hierarchical cluster analysis during the second stage, but the explanatory power and accuracy of the discriminant analysis results were optimal when four types of flooded areas were used.
Second, as a result of verifying the homogeneity of group averages, it was determined that the statistical probabilities for the variables, including land use, slope, TWI and presence of FRMI, were less than 0.001, and thus, these variables were very significant in the model; the average differences among variables for each of the four flooded area types were also significant. Larger F statistic values were associated with more discriminatory power, and the presence of FRMI had the largest discriminatory power among the five variables analyzed when these were used to divide the flooding into four types. The discriminatory powers for the other variables decreased in the order of the slope, TWI, soil drainage and land use.
Third, through the use of canonical discriminant function coefficients and central points of the functional groups, key characteristics of each group could be observed. One variable that contributed greatly to the division of Type 1 flooded area was the presence of FRMI. In the division of Type 2 and 4 flooded area, the slope variable made significant contributions to these groups, while TWI was a major factor for discriminating Type 3 flooded area. Canonical correlation at the relevant level between the discriminant function and groups was excellent, as indicated by the 0.996 correlation coefficient, and 98% of the total variance was explained by the model with an eigenvalue of 127.74.
Fourth, the clustered types were re-classified using the discrimination formulas. Fisher’s linear discriminant function that determines a discriminant score for each flooded area type was applied (
Table 2). The discrimination accuracy rate as determined using a cross-validation technique was 98.1%. In the case of Type 1 flooded area, through the reclassification process performed by discriminant analysis, 459 places that had FRMI in place when flooding occurred were classified as Type 1, and the discrimination accuracy rate increased by 1.1%. Finally, among the total 1951 places where flooding occurred as analyzed in this study, 459 were classified as Type 1, 106 places as Type 2, 961 places as Type 3 and 425 places as Type 4.
Using the classification function (
Table 1), the different types of flooded areas were mapped as shown in
Figure 3.
Table 2.
Fisher’s linear discriminant function.
Table 2.
Fisher’s linear discriminant function.
| Z1 (Type 1) = 4.624X1 + 0.812X2 – 0.113X3 + 1.972X4 + 111.569X5 − 76.389 |
| Z2 (Type 2) = 7.064X1 + 0.930X2 + 2.842X3 + 1.373X4 + 7.806X5 − 42.109 |
| Z3 (Type 3) = 4.594X1 + 0.689X2 + 0.467X3 + 2.134X4 − 0.716X5 − 22.455 |
| Z4 (Type 4) = 5.104X1 + 0.706X2 + 0.892X3 + 1.104X4 − 1.731X5 − 14.716 |
| * X1 = Soil drainage, X2 = Land use, X3 = Slope, X4 = TWI, X5 = Presence of FRMI |
Figure 3.
Green space and four types of flooded area through the discriminant function.
Figure 3.
Green space and four types of flooded area through the discriminant function.
3.2. Physical Properties of Urban Flooded Area Types
Type 1 flooded areas represent regions where flooding occurred in a drainage basin that contained an FRMI. Specifically, this is a region where FRMIs had been installed because flooding had occurred frequently in the past. The average slope for these regions was 1.61%, which was gentler than the 2.51% average for total flooded regions in Seoul. The TWI in Type 1 areas was the second highest after the TWI in Type 3 areas and was higher than the average for all flooded regions. Soil drainage was imperfect in these regions, which is a regional characteristic factor for high flood risk. Compared to other drainage basins, the occurrence of flooding was significantly limited in general here, but at the time of extreme rainfall in 2011, flooding was excessive, as the capacities of the FRMIs were overwhelmed in this region. The Type 1 areas were mainly located around the Han River and major streams, and the mixed land use area ratio amounted to 45.5%, which was the highest among all four types. As semi-underground housing consisting of old brick structures is common in the Type 1 flooding areas, this region experienced heavy damage during the flood in 2011.
The average slope for Type 2 flooded areas was 14.06%, which was much steeper than the total area average (3.82%) for non-flooded areas in Seoul. The TWI value was relatively low here, and soil drainage was the most favorable among the four types. Landslides may be a concern for this area, given the steep gradients and vegetated hilly areas. Commercial, business and industrial areas were not present in this region. It was a place where water is prone to flow without attenuation, and hence, flooding did not occur frequently; when it did occur, inundated land in this region made up about 5% of the total flooded area in Seoul. These areas are bordered by mountainous terrain, and several newly-built detached houses are located here, along with many older brick houses. These structures are vulnerable to severe damage during intense discharge of water from the mountains to lower areas.
The average slope of Type 3 areas was 1.29%, which was the gentlest slope in the study areas, and the TWI was the highest among the four flooded area types. In addition, soil drainage was the worst compared to the overall average soil drainage of all flooded areas in Seoul. The ratio of detached housing area and mixed land use area was relatively high, and roads accounted for over 50% of the area. Type 3 areas had geographical conditions conducive to water attenuation, contrary to Type 2 flooded areas. Given the high TWI values, this region will be prone to future flooding if appropriate drainage systems are not installed.
The average TWI value for Type 4 flood areas was much lower than the total average of 10.42 for non-flooded areas, and slopes here were moderate. Soils drain imperfectly in this region, as indicated by the soil drainage data. In general, this area had several features that fell between the values for Type 2 and 3 areas; in comparison with all flood area types, the Type 4 area represents a place where the flooding probability can be expected to change considerably based on precipitation.
Statistical data for regional characteristic factors in each of the four types of flooded areas are summarized in
Table 3.
Table 3.
Statistic features of flooded area type.
Table 3.
Statistic features of flooded area type.
| Type | N | Description | Soil Drainage | Slope | TWI | Presence of FRMI | Land Use |
|---|
| Type 1 | 459 | Average | 2.61 | 1.61 | 11.95 | Contained FRMIs (pumping station, rainwater retaining tank) | Mixed land use area ratio is the highest
Located around river and streams |
| Coefficient of variation | 3.10 | 0.46 | 3.09 |
| Min. | 2 | 0.00 | 2.40 |
| Max. | 5 | 29.47 | 19.69 |
| Type 2 | 106 | Average | 3.48 | 14.06 | 7.38 | None | Green space (forest) ratio is highest
No commercial, business and industrial areas |
| Coefficient of variation | 3.56 | 3.35 | 1.76 |
| Min. | 2 | 7.86 | 2.53 |
| Max. | 5 | 30.01 | 19.95 |
| Type 3 | 961 | Average | 2.32 | 1.29 | 13.31 | None | Detached housing and mixed land use area are relatively high
Road ratio is the highest |
| Coefficient of variation | 3.27 | 0.72 | 7.70 |
| Min. | 1 | 0.00 | 9.93 |
| Max. | 5 | 8.50 | 20.24 |
| Type 4 | 425 | Average | 2.58 | 3.91 | 5.98 | None | Low hill area is highest |
| Coefficient of variation | 3.46 | 1.70 | 3.41 |
| Min. | 1 | 0.00 | 2.78 |
| Max. | 5 | 10.00 | 11.17 |
| Total average in Seoul | 2.70 | 3.22 | 10.75 | - | - |
| | average in flooded area | 2.51 | 2.63 | 11.07 | - | - |
| | average in non-flooded area | 2.89 | 3.82 | 10.42 | - | - |
3.3. Analysis of Flooding Probability Based on Green Space Area
3.3.1. Characteristics of Green Spaces
Green spaces in the city of Seoul amount to 212.41 km
2, taking up about 35% of the total area. Estimates of the green space area average within a 100-m radius from flooded and non-flooded areas in Seoul are shown in
Table 4. The average green space ratio for flooded areas in Seoul city was 4.49%; for Type 1 flood areas, the green space ratio was 2.26%; and for Type 3 areas, the green space ratio was 2.81%, which are values that were below the average value for the city. For Type 2 flood areas, which border mountainous terrain, the green space ratio was 22.48%. The green space ratio within a 100-m radius in non-flooded areas in Seoul was 19.43%, which was very high.
Table 4.
Average green space area average within a 100-m radius from flooded and non-flooded areas.
Table 4.
Average green space area average within a 100-m radius from flooded and non-flooded areas.
| Description | Average of Green Space Area within a 100-m Radius | Average of Green Space Area Ratio within a 100-m Radius |
|---|
| Non-flooded | 6102.20 m2 | 19.43% |
| Flooded | 1410.40 m2 | 4.49% |
| | Flooded area Type 1 | 709.78 m2 | 2.26% |
| Flooded area Type 2 | 7058.9 m2 | 22.48% |
| Flooded area Type 3 | 881.36 m2 | 2.81% |
| Flooded area Type 4 | 1954.52 m2 | 6.23% |
3.3.2. Flooded Area Type 1
For significant variables with the potential to affect the occurrence of floods in Type 1 flood areas, variables including the green space area, soil drainage, detached housing area and mixed land use area were selected as significant variables with the potential to affect the occurrence of floods in Type 1 flooded areas. The flooding probability will be decreased by increasing green space area and better soil drainage. According to the flooding probability model for Type 1 areas (Equation (1)), the probabilities of flooding in detached housing areas and mixed land use areas were 6.7-times and five-times higher than other areas, respectively.
Other variables affecting flooding included the TWI, slope and land use. As these were variables that were used in the previous cluster analysis to divide the study area into four types and because similar factors may be bound by each type, these variables were not selected as significant variables for the regression analysis. All of the variables were determined to be below the significance level of
p < 0.05; hence, all such variables were statistically significant. The flooding probability was distributed from a maximum value of 94.19% (in areas where green space was non-existent, the drainage was very inferior and detached house was present) to a minimum value of 1% (
Figure 4a). The relevant equation is as follows:
3.3.3. Flooded Area Type 2
In Type 2 flood areas, green space area, slope and maximum hourly precipitation variables were selected as significant variables with the potential to affect flood occurrence. The estimated coefficient for all of the explanatory variables, except for the constant term, was statistically significant (p < 0.05), and more green space area was associated with a reduced occurrence of flooding in this region. During times of high maximum hourly precipitation and in areas with gentle slopes, flood occurrence was increased. The model seemed to yield reasonable results, and the observed accuracy was 91.4%, which was the highest accuracy among the deduced model of four flooded area types.
Type 2 was dominated by steep areas bordered by mountainous terrain. As mountain soil is rapidly saturated by regional torrential rains, debris flows occurred that contributed to the flooding. In the Type 2 area, detached houses are densely located in the lower part of the mountainous area, and serious damage is highly likely to occur here during future flooding events.
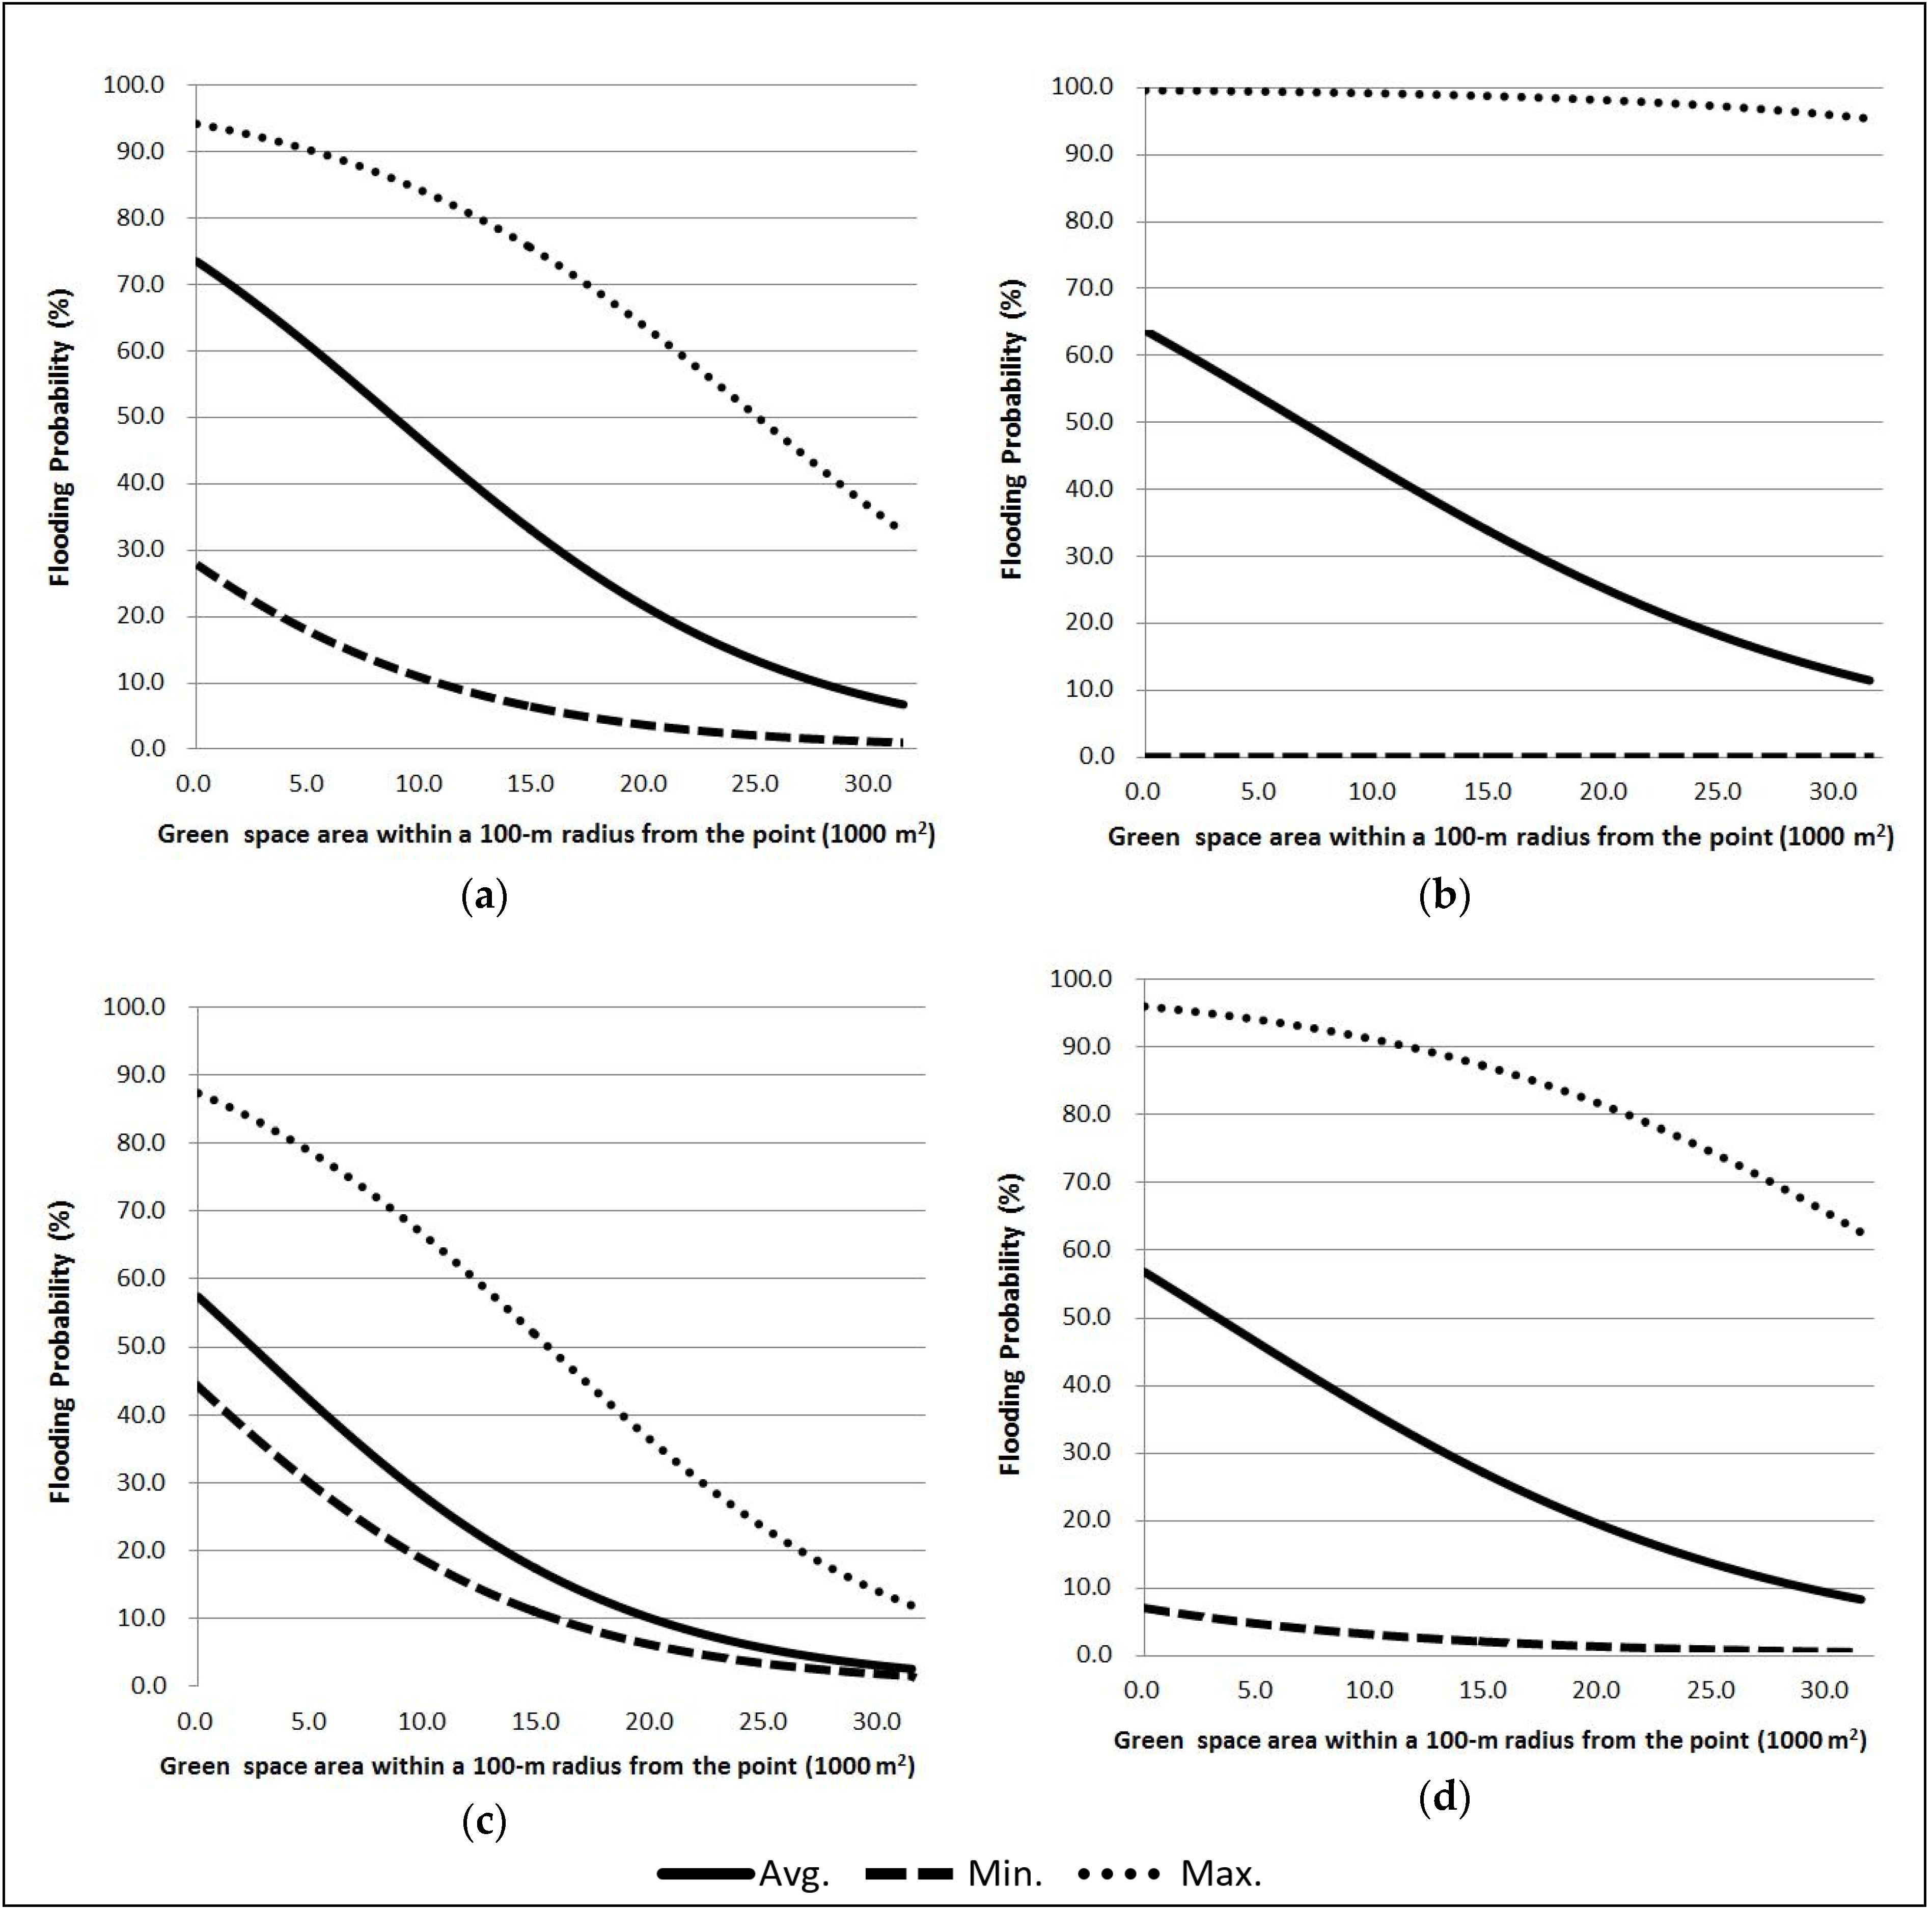
Figure 4.
Flood probability analysis by change of green space area. (a) Type 1; (b) Type 2; (c) Type 3; (d) Type 4.
Figure 4.
Flood probability analysis by change of green space area. (a) Type 1; (b) Type 2; (c) Type 3; (d) Type 4.
The flooding probability was distributed from a maximum value of 99.65% (where green space did not exist at all, the slope was minimum and maximum hourly precipitation was maximum) to a minimum value of 0% (
Figure 4b). Flooding possibilities are minimized in the mountainous area with the steepest slopes according to the deduced function (2). The steepest areas in the Type 2 flooded area are not considered vulnerable to flooding, because those areas quickly withdraw the exceeded amount of rainfall to the neighboring gentle sloped areas. In cases where the maximum hourly precipitation reaches 87.77 mm, the flood probability is predicted to be greater than 95% regardless of whether green space is increased; thus, this is an area where floods are inevitable, under the current conditions, at times of extreme rainfall. The installation of flood control facilities, such as rainfall retention tanks, would be valuable in such areas. The relevant equation is as follows:
3.3.4. Flooded Area Type 3
In Type 3 flood areas, green space area, TWI and detached housing area were selected as significant variables with the potential to affect flood occurrence. As the green space area expanded, the flooding probability decreased, and higher TWI values and more extensive detached housing areas were associated with an increase in flooding probability. The estimated coefficient of all variables was very significant (p < 0.005). The explanatory capability of this model was 70%.
The flooding probability was distributed from 75.92% to 0% (
Figure 4c). The absolute estimated coefficient for green space area was the largest compared to the other types, and the variation of flood probability due to the change in the green space area was also the largest. The relevant equation is as follows:
3.3.5. Flooded Area Type 4
In Type 4 flood areas, green space area, soil drainage and maximum hourly precipitation were selected as significant variables with the potential to affect flood occurrence. When the green space area expanded and the drainage was good, the flood occurrence probability decreased. Conversely, when the maximum hourly precipitation was high, the flood probability increased. All of the variables were very significant (p < 0.005). The explanatory capability of the model was 75.6%.
The flood probability was distributed from 96.04% to 0.52% (
Figure 4d). In cases where the maximum precipitation was high and soil drainage was poor, the flood probability was greater than 60%, even when the green space area was at the maximum level. In this region, flood probability was mainly affected by heavy rainfall, and the maximum flood probability was associated with maximum hourly precipitation. The relevant equation is as follows:
4. Discussion
Flooding probability is shown to differ with the variation of green space area in each flooded area type. First, when comparing average values in the graph gradients (
Figure 4) to explore the effects of green space according to each type of flooded area, it was found that Type 1 flooded areas were the most amenable to flood control through increased green space area, followed by Type 3, Type 4 and Type 2. However, while the average value of the gradient was the highest for Type 1, up to about 7000 m
2 of green space area, the graph gradient of Type 3 was the highest among all of the areas. This means that compared to other flooded area type areas, the flood control capacity via green space is relatively large in Type 1 and 3 areas.
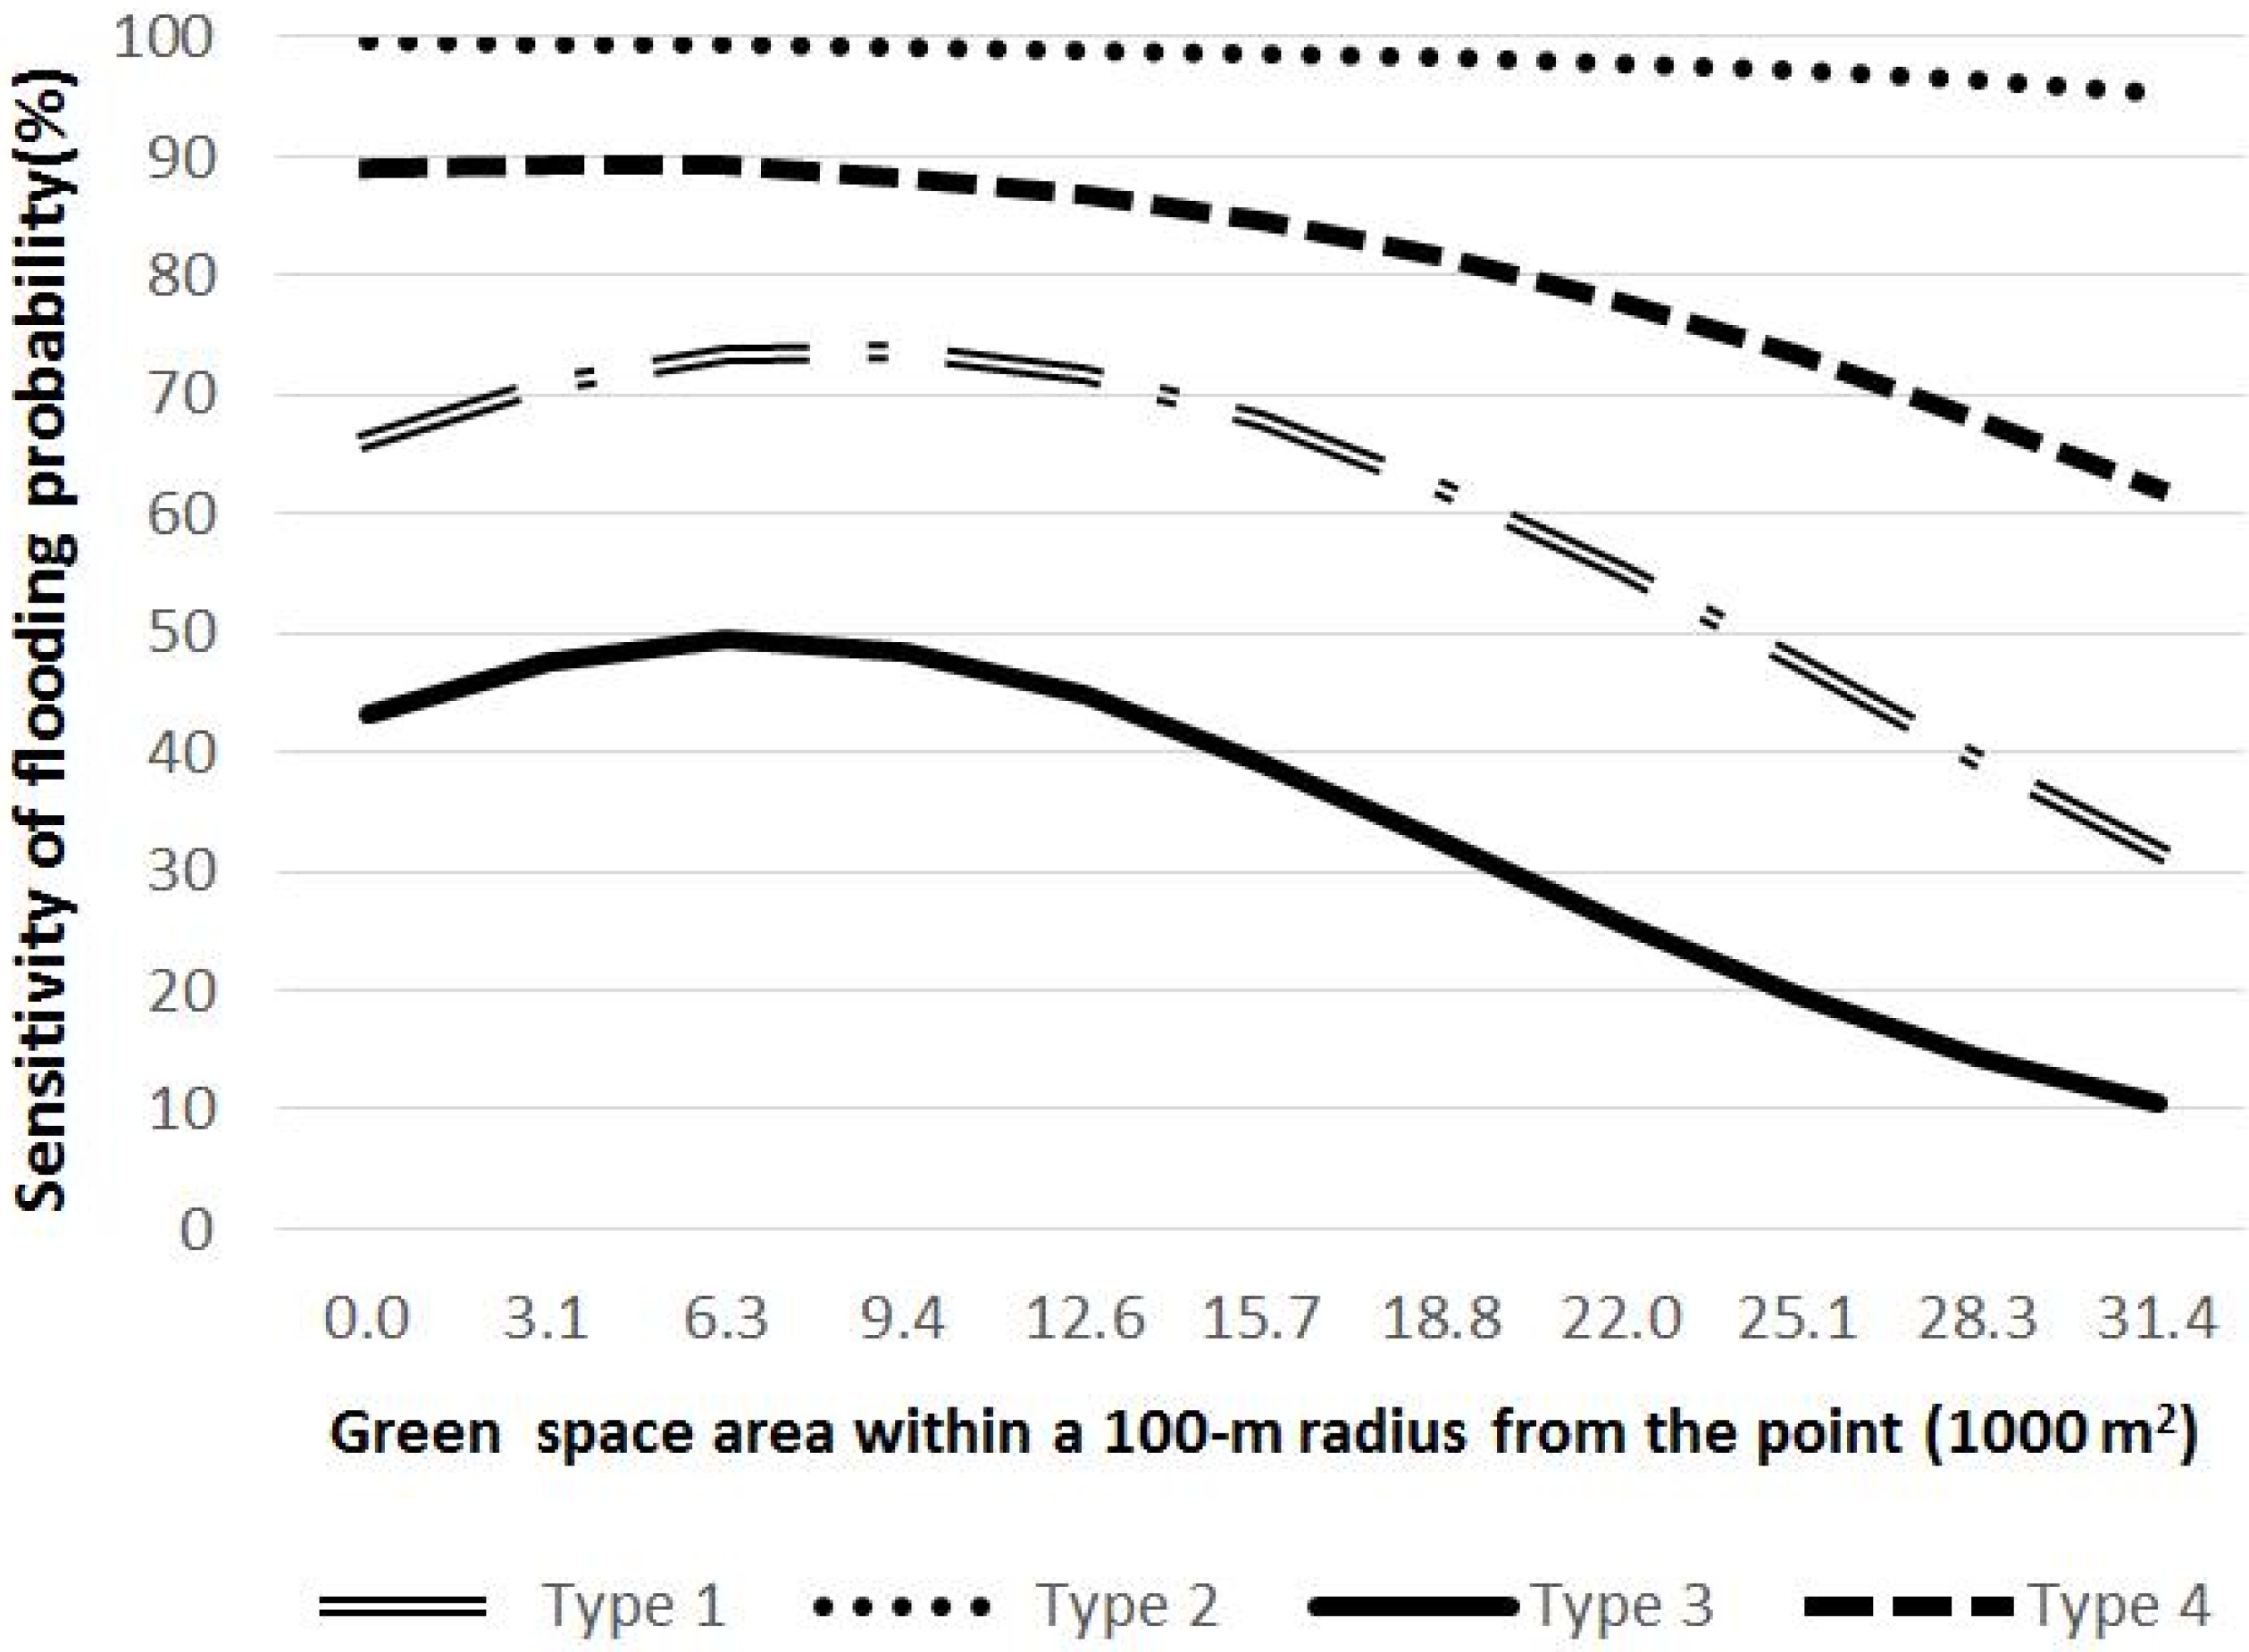
Sensitivity analysis of flooding probabilities through the green space area was performed based on
Figure 4. Flooding probabilities for each flooded area type were changed by not only green space area, but also physical and environmental variables. Therefore,
Figure 5 schematizes the difference between maximum and minimum of flooding probability due to green space area to show the scale of the sensitivity of flooding probability depending on the significant variables, except green space area. As a result, the sensitivity of flooding probability reduced as the green space area increased in all flooded area types. Moreover, in Type 3, a range of flooding probabilities due to green space area is the smallest among the four types in spite of other environmental variables’ change, that is Type 3 has low sensitivity, followed by Type 1, Type 4 and Type 2.
Figure 5.
Sensitivity analysis between flooding probabilities.
Figure 5.
Sensitivity analysis between flooding probabilities.
The Type 1 area, which is located in a drainage basin with an FRMI, was a flood-prone area before the FRMI was installed. Since the installation of a pumping station and a rainwater retention tank, the area has become less vulnerable to flood occurrences. It should be noted that in the case of no green space at all, the maximum value for the flood occurrence probability was the highest (73.48%) among the four types. In addition, the flood probability range, which went from a maximum of 73.48% to a minimum of 6.75%, was the greatest among the four types.
In Type 2 and 4 flood areas, when the maximum hourly precipitation was at the maximum level, the flood probability was greater than 60% despite changes in the green space variable; these represent areas where the maximum hourly precipitation significantly affects flood occurrence. Landslides are likely in this area, and these may be influenced by precipitation conditions, topography and geological features; landslides are apt to take place when external factors, such as rainfall impacts ground that has internal vulnerabilities [
40,
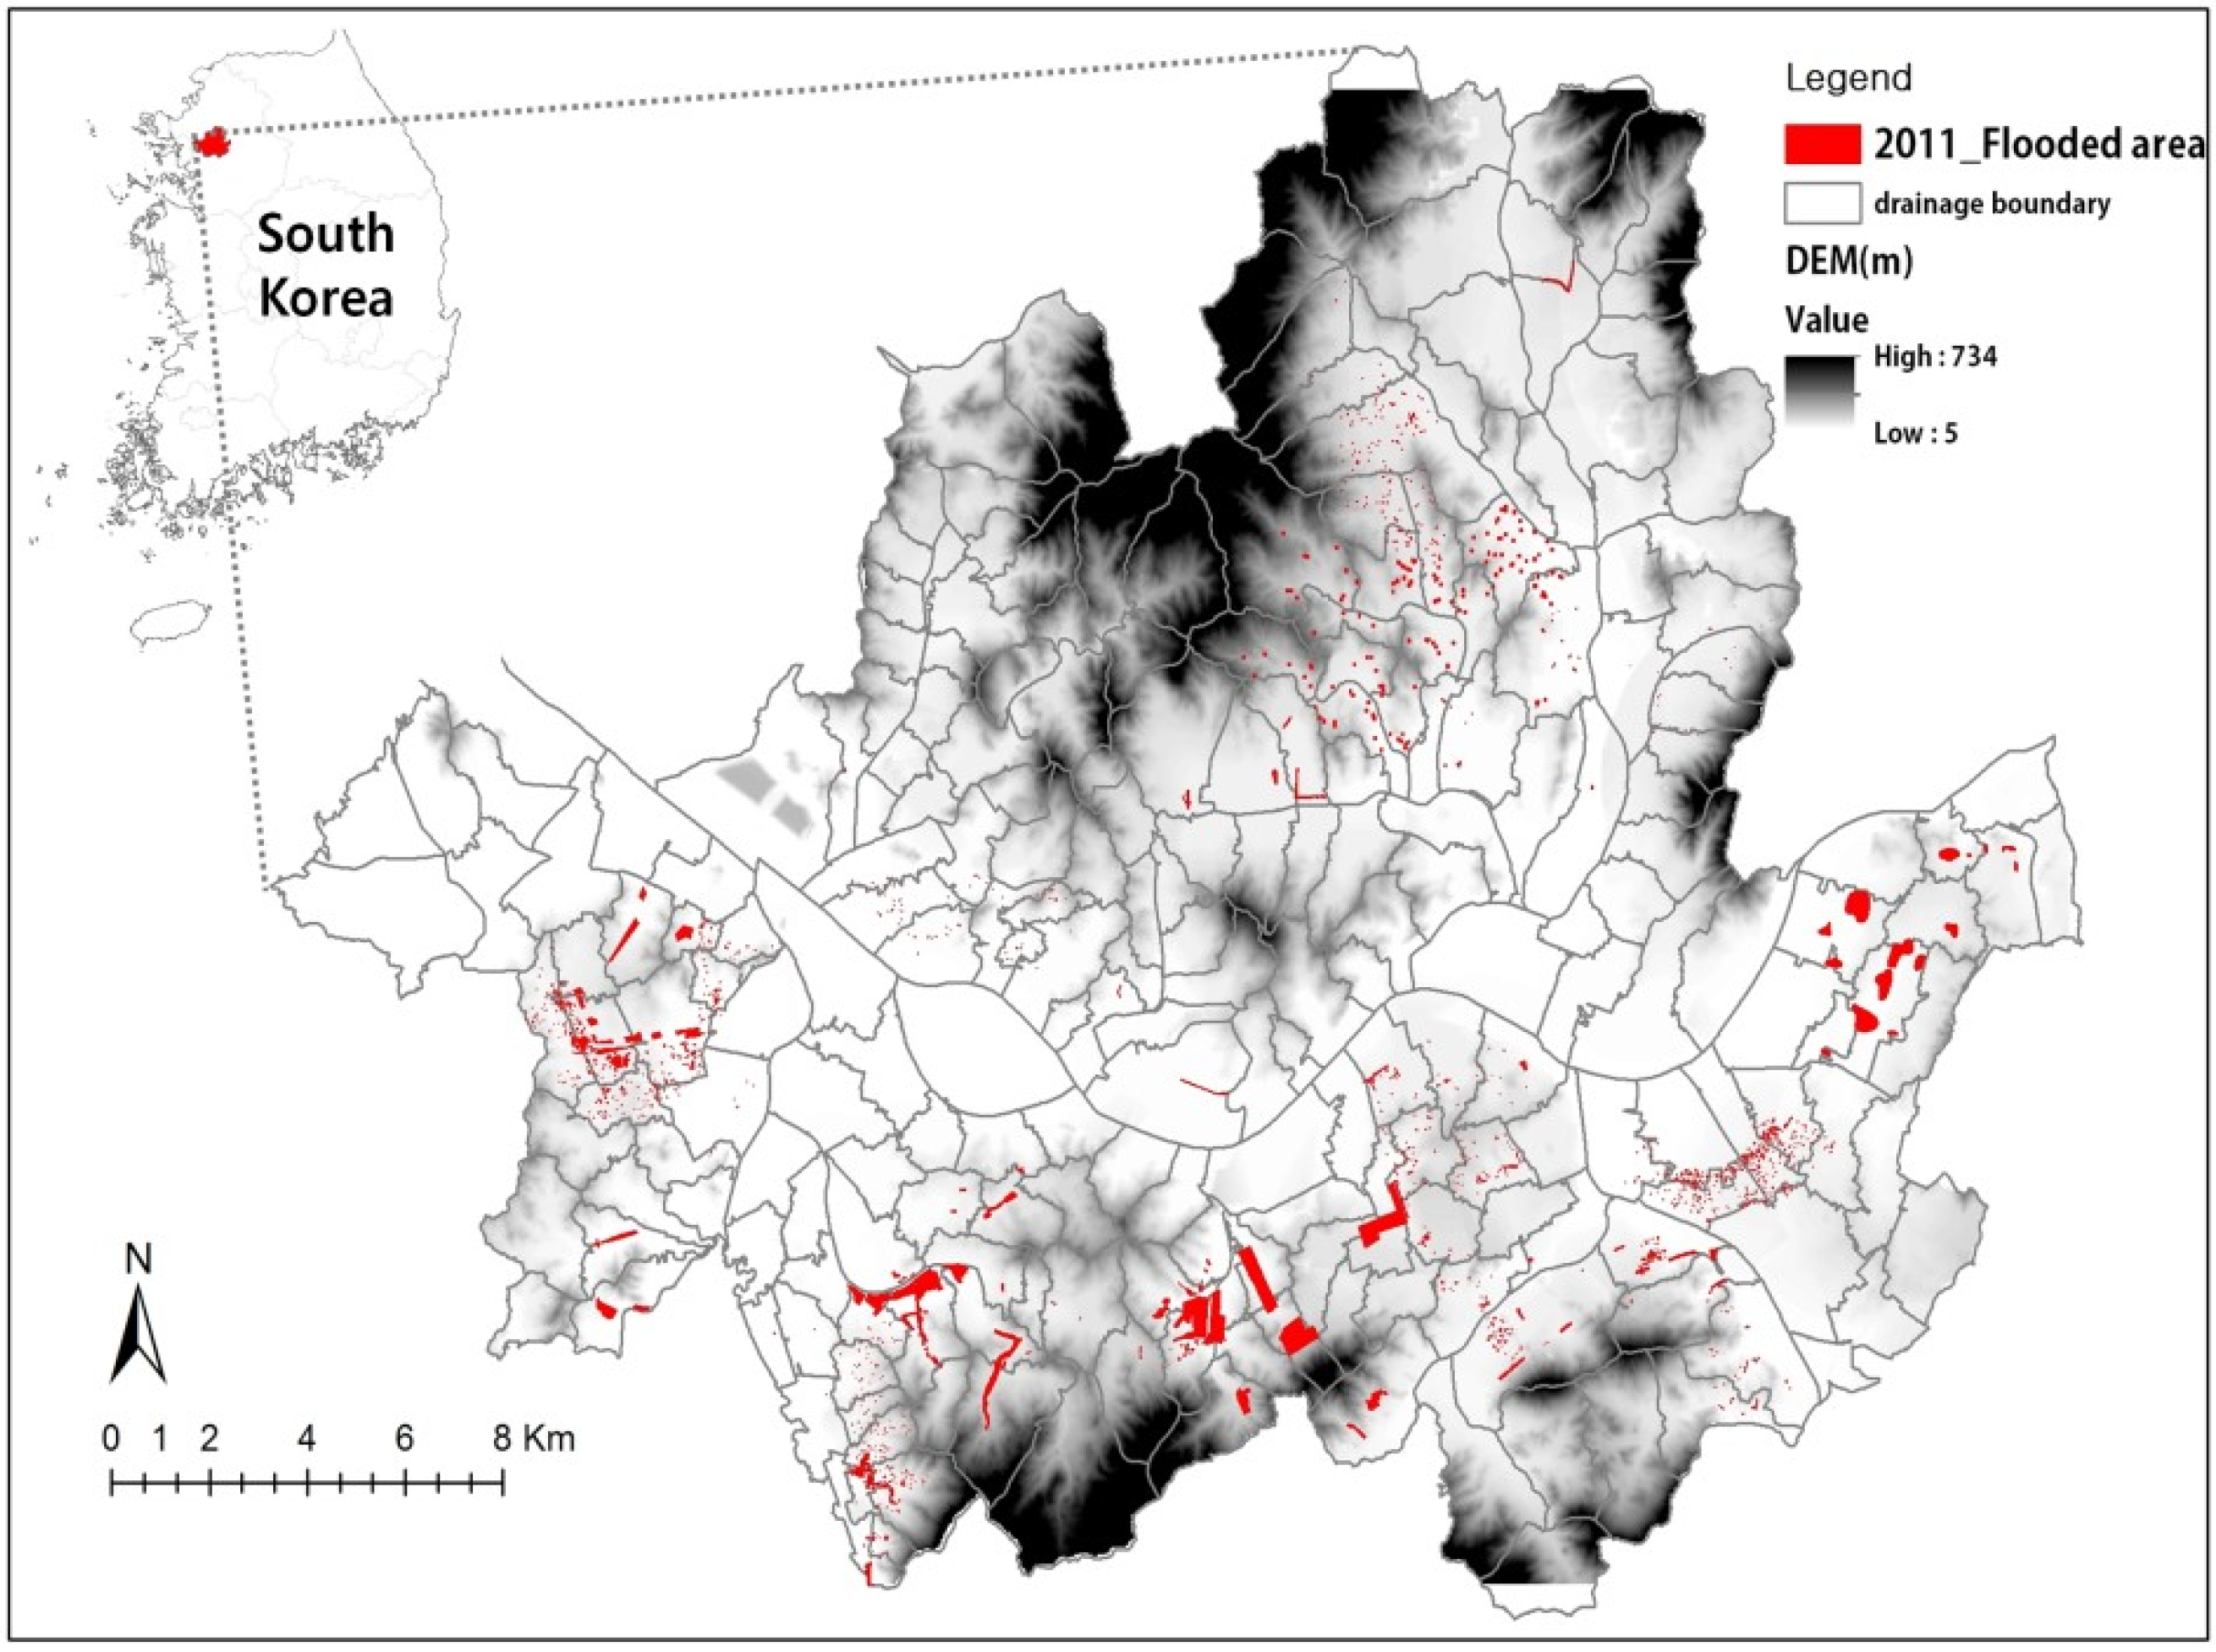
41]. Such a landslide occurred in the Woomyeonsan Mountains in 2011, resulting in 18 deaths, and was caused by flooding and the area’s unique geographical features. In the area bordering the mountains, it would be prudent to install flood control facilities, such as rainfall retention tanks, in addition to green spaces, to prevent future flooding.
On the other hand, in the case of Type 3 areas, there were small differences in the flooding probability according to the hourly maximum precipitation. The maximum hourly precipitation variable was not designated as a significant factor. Flooding probability for Type 3 was highly affected by TWI, green space area and the presence of housing rather than the distribution of precipitation. In particular, as flood occurrence was frequent in the detached housing area, mixed land use area, business area and roadway area, the flooding probability could be reduced effectively by introducing green spaces.
In the Type 3 flooded areas, the flooding probability was reduced to a minimum of 2.59% when the green space area in a 100-m radius is increased to the max. Compared to other types, it had the smallest probability values, and this is an area where the sensitivity to increases in green space area is high. When the green space area changed from 0 to 31,400 m2, the gradient mean value of flood probability for Types 2 and 4 was similar. However, it could be seen that in the case of Type 2, when the green space area was less than 6940 m2, it had a gentle gradient compared to Type 4, but at higher values, the graph gradient of Type 4 became gentler. Type 4 had intermediate geographical features between those of Type 2 and 3 and coexisted with Type 2 and 3 rather than achieving an independent existence in the model.
When observing the green space area of a place where the flooding probability was rapidly changing (inflection point), the inflection point occurred at 2380 m2 in the Type 3 area where the flood control effect based on the green space area was significant. The inflection point can be considered to be an area where the cost-effectiveness of flood control based on increases in green space area is the largest. The inflection point is identical to the green space area required for reducing the flooding probability by 50%.
The green space area required for reducing the flood probability to a 50% increase was in the order of Type 3, Type 4 and Type 2 areas. Specifically, for the Type 3 area, if 7.5% of the total area is converted to green space, the flood probability will be reduced to less than 50%, while in Type 4 and 2 areas, only when 10.3% and 21.7%, respectively, of the total area is covered with green space will the flood probability be reduced by half (
Table 5).
Table 5.
Comparison of average probability for each flooded area type.
Table 5.
Comparison of average probability for each flooded area type.
| Type | Coefficient of Green Space | Inflection Point of Green Space Area | Green Space Area to Reduce 50% Flooding Probability | Flooding Probability (%) |
|---|
| Max. | Min. | Difference |
|---|
| Type 1 | −0.116 | 8790 m2 | 8790 m2 (27.9%) | 73.48 | 6.75 | 66.73 |
| Type 2 | −0.083 | 6790 m2 | 6790 m2 (21.7%) | 63.74 | 11.47 | 52.27 |
| Type 3 | −0.125 | 2380 m2 | 2380 m2 (7.5%) | 57.41 | 2.59 | 54.82 |
| Type 4 | −0.085 | 3220 m2 | 3220 m2 (10.3%) | 56.82 | 8.35 | 48.47 |
To reduce the size of the area within 10% the flooding probability band in Type 3 areas,
i.e., to 47.41% from 57.41% when no green space is present at all, a green space area of 3205 m
2 would be required, and this amount accounts for about 10% of the total area. Similarly, Type 2 would require a green space area of 4990 m
2 in size, which would take up 16% of the total area, to reduce the top ranking 10% of flood probability (
Table 6).
Table 6.
Green space area and ratio to reduce flooding probability band.
Table 6.
Green space area and ratio to reduce flooding probability band.
| Type | Description | (Green Space Area to Reduce by) |
|---|
| Upper 10% Probability | Upper 20% Probability | Upper 30% Probability | Upper 40% Probability |
|---|
| Type 1 | area (m2) | 4015 | 7580 | 11,040 | 14,700 |
| ratio (%) | 12.79 | 24.14 | 35.16 | 46.82 |
| Type 2 | area (m2) | 4990 | 9830 | 14,950 | 20,900 |
| ratio (%) | 15.89 | 31.31 | 47.61 | 66.56 |
| Type 3 | area (m2) | 3205 | 6500 | 10,180 | 14,840 |
| ratio (%) | 10.21 | 20.70 | 32.42 | 47.26 |
| Type 4 | area (m2) | 4730 | 9570 | 15,040 | 22,030 |
| ratio (%) | 15.06 | 30.48 | 47.90 | 70.16 |
We found that green spaces exerted a considerable influence on urban flooding probabilities in Seoul, Korea, and reductions in flooding were noted in several areas with greater amounts of green space. Moreover, different areas showed different sensitivities to the effects of green spaces, and flooding probabilities could potentially be reduced by more than 50%, depending on the amount of green space area and its introduced location. By [
42], introduction of green spaces would be the best adaptation strategy for future flooding events through their use of a hedonic value evaluation method that considered the expansion of sewerage pipelines and construction of infiltration trenches. In a short-term perspective, expansion of sewerage pipelines may exert a significant influence on flood control, but in a long-term, sustainable and cost-effective perspective, increasing green spaces would represent an efficient way to control flood occurrences.
Green spaces were found to be more effective for decreasing flooding probabilities in Type 3 flood areas where the slope was gentle and the TWI was high, compared to Type 2 areas. This result is similar to one where it was found that creating green spaces such as street plantings in a concave rather than in a convex form by raising the elevation higher than surrounding roadways can be advantageous for reducing flooding by rainwater infiltration. In the case of reconstructing all green spaces in a community to a depth of 5 cm, it was found that runoff could be reduced by a maximum of 16% and the peak outflow by about 25% [
5]. Concave-shaped green spaces could be interpreted in the same context as Type 3 green spaces. This could also be applied to location selections for small-scale gardens at the time of green space planning for entire urban areas.
In the case of Type 3, the average value of flooding probability was the largest, and this was the most flood-prone area included in this study. On the other hand, the effect of green spaces on the reduction of flooding probabilities was greatest in these areas. Generally, in flood-prone areas, installation of large-scale rainwater retention basins as a short-term solution is the preferred method to control flooding. In this study, we found that the green space area has the potential to reduce flooding probability by less than 50% in all flooded area types.
Some limitations were encountered. First, data were analyzed based on land cover maps and urban biotope maps. Hence, in this study, only green space area was used as a variable, but more detailed information on planting types or structures of green spaces would be useful for future analyses of the impacts of green spaces on urban flooding. Such information could be identified through site surveys. Second, flooded point data were established from a flood inundation map for 2011, so analysis was performed using only one year of data. The extracted flooded/non-flooded point for 10 years had many precipitation data because flooding often occurred in the same area. Therefore, it is difficult to use the logistic regression analysis. If points were extracted from more flood inundation maps over many years, the accuracy of the results could be higher. Third, the model was constructed based on the total area of the city of Seoul. However, if a site-based model could be constructed and supplemented after identifying detailed small green spaces through site surveys in the future, the applicability of the model could be further increased as more accurate data were incorporated.
5. Conclusions
A city resilient to disasters must establish appropriate flood control and adaptation plans. Recently, in Korea, there has been a strengthening of the role of urban planning in disaster control [
43]. The application of diversified urban planning elements, including natural flood risk management and blue-green infrastructure, as well as existing physical sewer line systems, is required to ensure urban management with high resilience. Impervious land cover, such as asphalt and roofs in urban areas, is a key factor that affects flooding, and flood control plans that incorporate green spaces should be created. However, comprehensive studies of green spaces are required to understand how their implementation would affect water circulation in regional drainage basins.
In this study, flooded areas in Seoul were divided into four types by multivariate analysis techniques, and quantitative analyses were then performed to determine how the flooding probability changes with variations in the green space area. Through this study, green space area is suggested as a factor to reduce flooding probability according to the properties of the flooded area type. In addition, guidelines for increasing flood resilience were developed to assist with the spatial planning of green spaces as countermeasures for urban flooding.
In the case of artificial FRMI, such as rainwater retention basins, their value may decrease over time, but increasing the green space area is an eco-friendly solution that will benefit humans and nature over a long period of time. The role of existing green spaces is often limited to the production of ecological benefits for wildlife and aesthetically-pleasing landscapes for human residents, but functionally, proper design plans for green space locations could maximize their impact on flood control. Therefore, this study recommends that urban areas devote planning resources for green spaces, and such efforts should determine where the best areas are for their introduction.
It is expected that the approach used in this study and the results obtained will provide a framework for diverse research on green spaces in the future. Furthermore, the techniques employed may be useful for predicting flood probabilities in urban areas, i.e., the models, which were based on empirical data, had a high explanatory capability.


