Article

Analysis of Aluminum Resource Supply Structure and Guarantee Degree in China Based on Sustainable Perspective

College of Management Science, Chengdu University of Technology, Chengdu 610059, China
*
Author to whom correspondence should be addressed.
Sustainability 2016, 8(12), 1335; https://doi.org/10.3390/su8121335
Submission received: 17 October 2016 / Revised: 7 December 2016 / Accepted: 12 December 2016 / Published: 17 December 2016
(This article belongs to the Section Environmental Sustainability and Applications)

Abstract

:
Aluminum is a strategic mineral resource, and China’s aluminum production and consumption is fairly large. However, its supply guarantee is uncertain because of a high dependency on external raw materials. This uncertainty may expand, so finding a way to reduce the uncertainty of aluminum resource supply is especially important. This paper applies the SFA method to analyze the aluminum flows in mainland China from 1996 to 2014, and establishes a supply structure model to measure its supply guarantee degree. The results claim that: (1) China’s aluminum production can satisfy demand and even create a surplus; (2) Domestic self-productive primary and secondary aluminum increased at an annual rate of 12% and 24%; (3) The proportion of self-productive secondary aluminum in the supply structure increased from 7.7% in 1996 to 12.8% in 2014, while that of primary aluminum decreased from 79.6% to 42.8%; (4) The total supply guarantee degree decreased from 87.3% to 55.6% in this period. These results provide a feasible way to solve this plight: the proportion of secondary aluminum in the supply structure should be enhanced, and an efficient aluminum resource recycling system needs to be established as soon as possible to ensure its sustainable supply.

Graphical Abstract

1. Introduction

As we all know, mineral resources play a vital role in human life, but are relatively scarce [1,2]. Mineral resources were formed in geological time, tens or hundreds of million years ago, and can be exploited and utilized through the efforts of people, but cannot be artificially created. Mineral resources are always limited within a certain time and space, as opposed to the unlimited and continually increasing demands of humans. Shortages of mineral resources and an absolute growth in the demand of human beings result in the scarcity of mineral resources. With regard to the scarcity of resources, many scholars have proposed predictions and made comments; the most famous among them are Thomas Robert Malthus (Absolute Resource Scarcity) [1], David Ricardo (Relative Resource Scarcity) [2], and John Stuart Mill (Stationary Economy) [3].
Aluminum is the second most abundant metallic element in the earth’s crust after silicon, accounting for 8% of the earth’s crust [4], but is a comparatively new industrial metal that has been produced in commercial quantities for just over 100 years [5]. However, more aluminum is produced today than all other nonferrous metals combined [6]. There has been great growth in the demand and consumption of aluminum-containing products in recent decades, owing to its wonderful properties: (1) light weight (it weighs about one-third as much as steel or copper [5]); (2) low density, is malleable, ductile, easily machined and cast; (3) excellent corrosion resistance and durability; (4) high thermal conductivity, electrical conductivity and reflectivity, no low-temperature brittleness and magnetism [7,8].
The external dependency aluminum resource in China is up to 50%, so its sustainable supply cannot be guaranteed given the ever-increasing demand. The production of alumina and primary aluminum both increased dramatically after 2000 in mainland China, with their respective shares of global production rising from 9% and 13.2% in 2000, 10% and 15% in 2001, and 37.7% and 51.1% in 2008, to 33% and 36% in 2009 (under the influence of the international financial crisis) [9,10]. In 2014, the share of China’s primary aluminum production is 53.3%. So it seems that there exists a surplus. However, the proportion of bauxite reserves in China is only approximately 3% of that worldwide, and the per-capita bauxite reserve in China is only one-tenth of the world average level [11]. The static fixed number of years for availability of bauxite in China is only 20 years or so according to the mining quantity in 2005 [12]. The bauxite in China has the properties of high aluminum, high silicon, and low aluminum–silicon ratio, which leads to difficulties in mining and smelting it; also, it consumes larger amounts of energy and discharges more pollution [13,14,15]. China imports substantial bauxite, and the external dependency has gone up gradually, from 19% in 1996 to 41.3% in 2014 (highest in 2011 at 53%). Due to the complicated international situation, the aluminum supply will be uncertain. So, it is necessary to analyze aluminum’s entire life cycle and evaluate its supply structure to understand the general situation of aluminum production, consumption, and trade in China.
From the aspect of mineral resources supply, researchers focus on the following subjects: availability of mineral resources [16,17,18]; emphasizing the fixed number of years for availability, grade, and reserves of domestic mines; guarantee degree (excluding secondary resource); mining costs and economic benefits; the evaluation of supply risk [19,20]; supply; and demand forecasting [21,22,23]. However, there are few studies about the supply structure of mineral resources and evaluation of guarantee degree (including secondary resource and trade). This paper applies SFA to analyze the aluminum resource supply structure and guarantee degree in mainland China from 1996 to 2014. We hope the research results can be a reference for policy makers in creating reasonable aluminum supply policies so as to secure a sustainable supply and avoid supply risks.

2. Methods

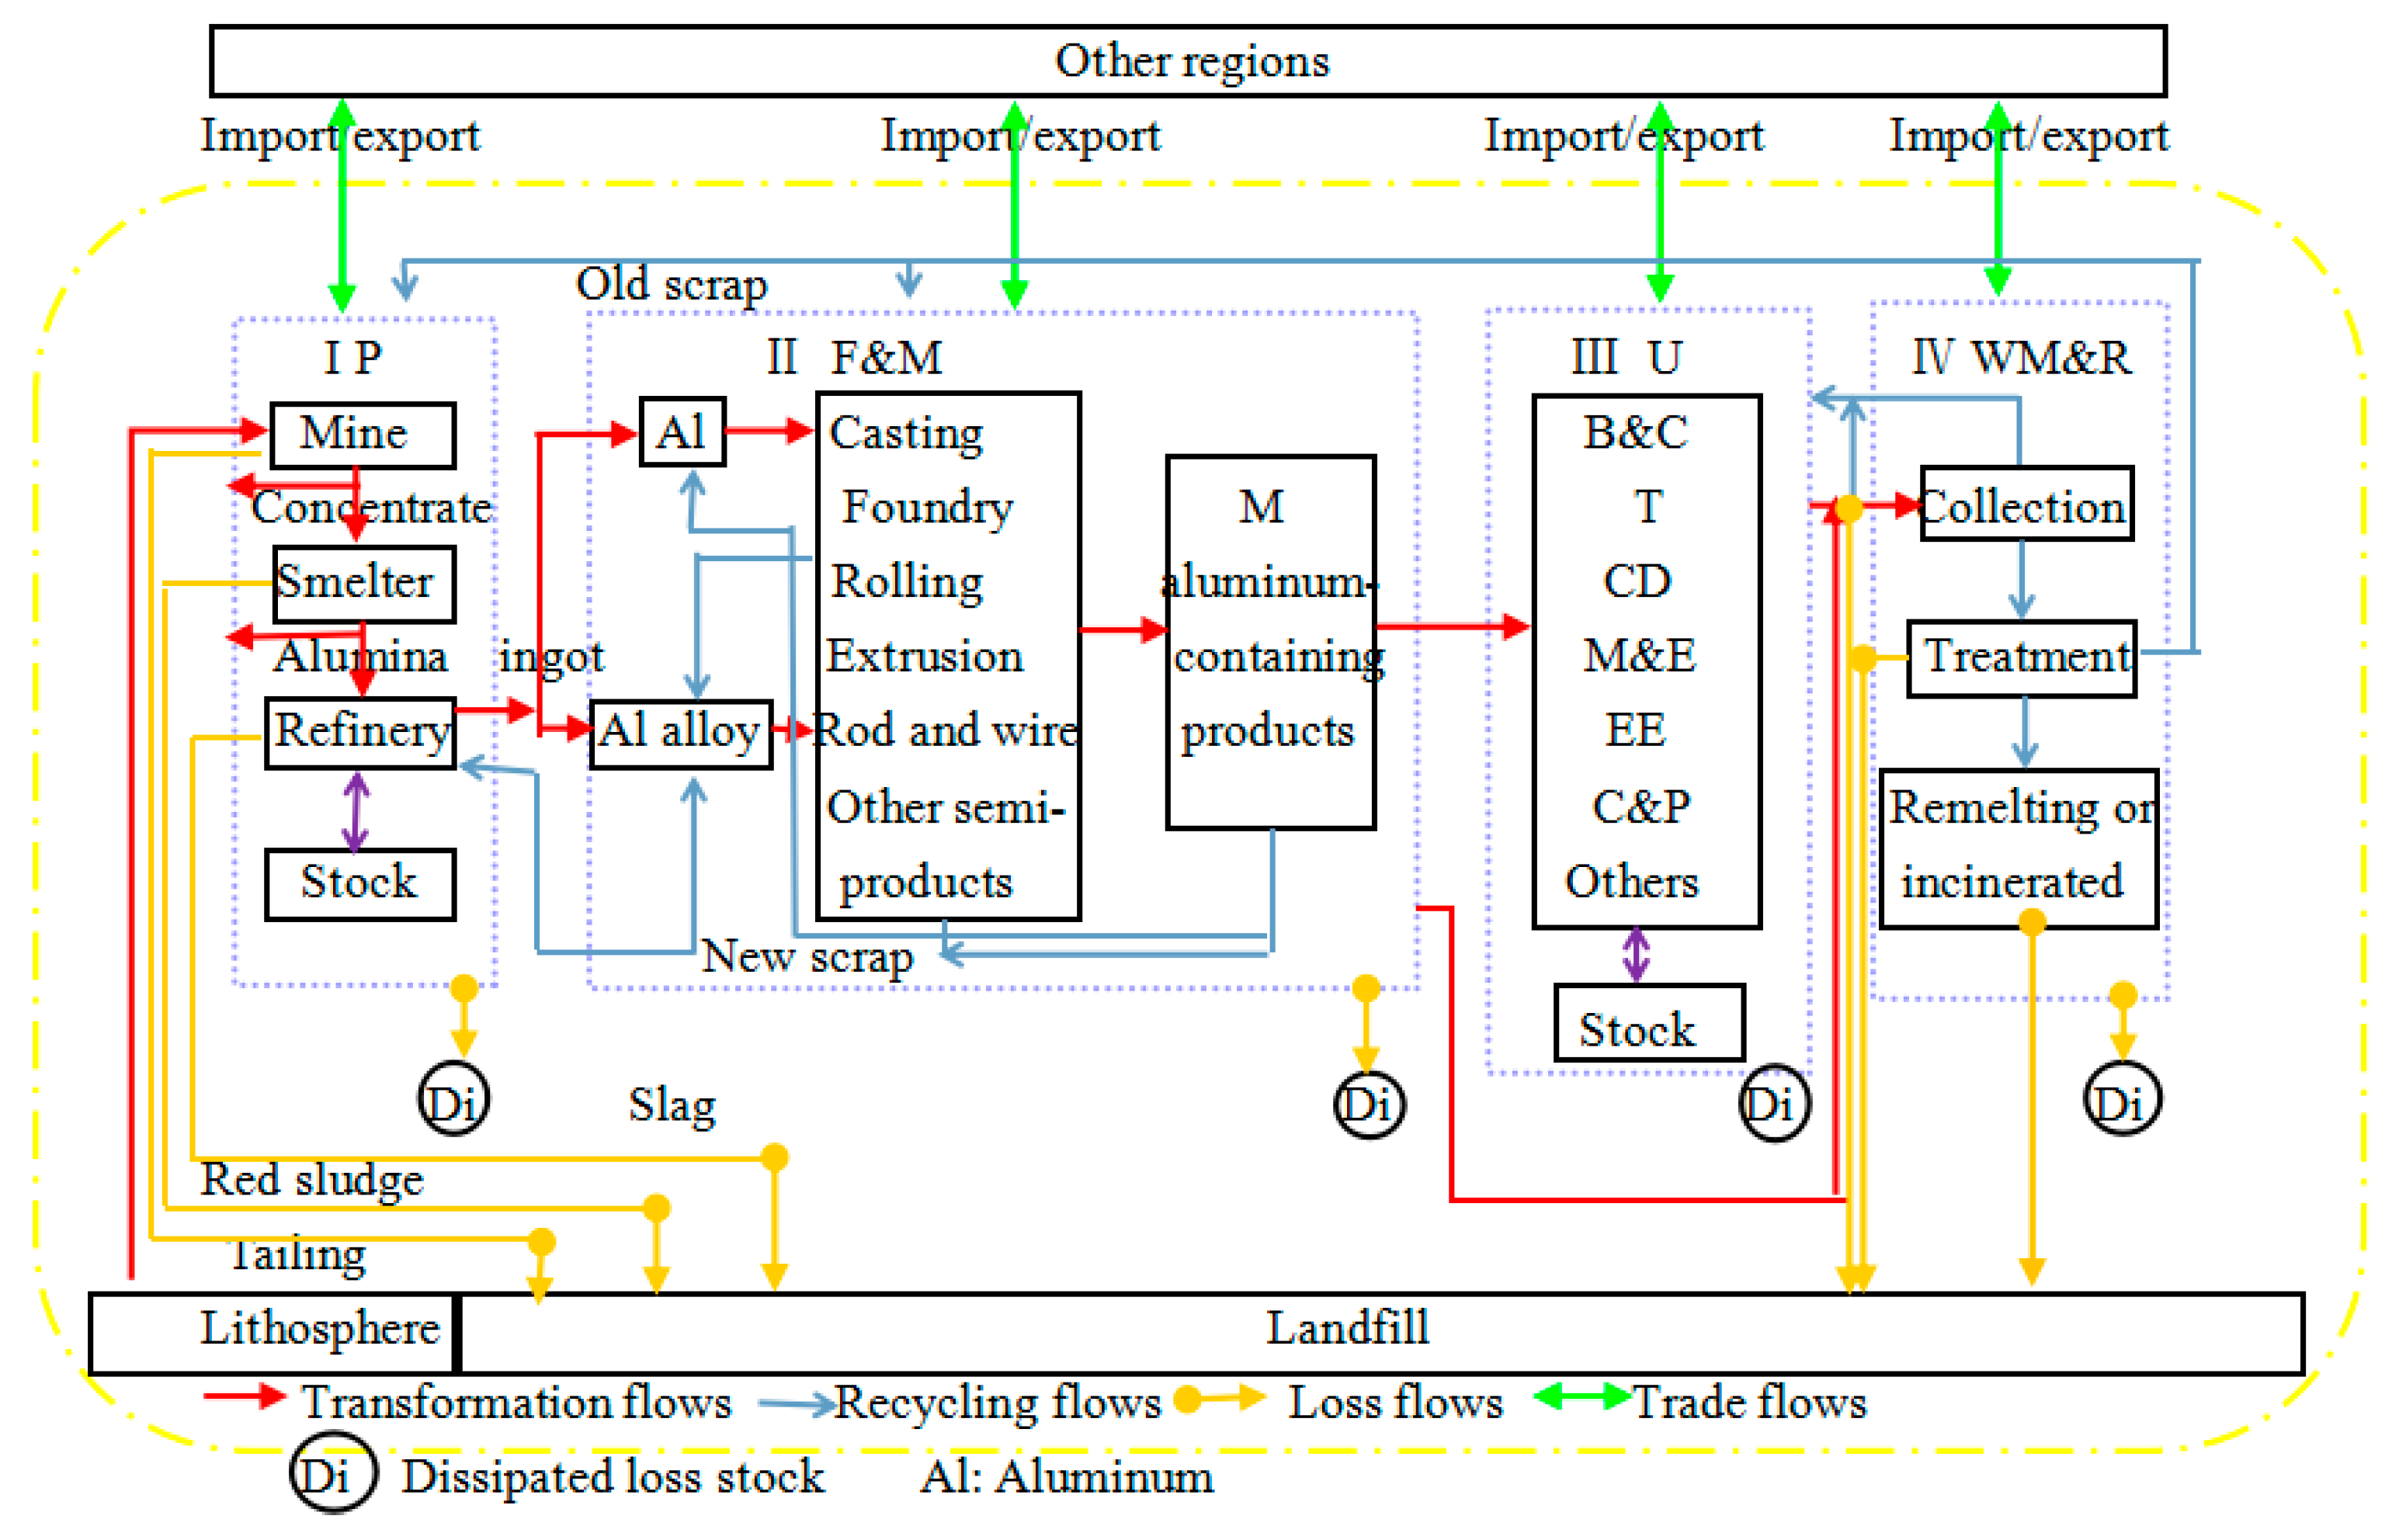
2.1. Substance Flow Analysis (SFA) and Brief Literature Review

Material flow analysis (MFA) is a systematic assessment method of the stocks and flows of materials within predefined anthropogenic temporal and spatial boundaries [24]. MFA is the pioneer of SFA; SFA is specialized in noxious or specific elements and can track the sources, pathways, transformation, and final sinks through their life cycle [25]. It has been extensively used by decision makers in determining the appropriate use and waste management of resources. The foundations of SFA are law of conservation of mass, life cycle theory, and input–output model, and the core of it is accurate data. In this method, the item “flows” are defined as the quantity of an element moving from one stage to another stage or from one destination to another destination; the item “stocks” are defined as the quantity of an element in “urban mines” or lost to the environment, calculated by weight. The main flows consist of transformation flows, recycling flows, loss flows, and trade flows, and the main stocks consist of in-use stocks and loss stocks.
Taking the example of aluminum, SFA divides the whole life cycle into four main stages (Figure 1): Production (P); Fabrication & Manufacture (F&M); Use (U); and Waste Management & Recycling (WM&R), each stage embraces the basic sub-processes (except U) and balances for material inputs and outputs. In SFA, certain temporal and spatial boundaries are characterized in the four life stages of the anthropogenic aluminum life cycle [26]. Figure 1 depicts the system boundary of aluminum, and the entire life cycle and sub-processes of aluminum in China are distinct. In the Production stage, there are three sub-processes: mine/mill, smelter, and refinery. Then comes the Fabrication and Manufacture stage, when aluminum alloys and pure aluminum are fabricated to foundry casting, rolling, extrusion, rod and wire, and other semi-products; the final aluminum-containing products are manufactured with aluminum semis and other raw materials. As for consumption structure, aluminum-containing products in Use stage are sorted into seven categories: building & construction (B&C), transportation (T), consumer durables (CD), machinery & equipment (M&E), electrical engineering (EE), containers & packaging (C&P), and other products. In the Waste Management and Recycling stage, end-of-life products and scrap are collected, separated, and treated. Some are remelted secondary aluminum, but others that have no economic value are incinerated. Trade or exchange with other regions occurs in every stage, even sub-processes. At the same time, resources and energy consumption, dissipated loss, and pollutant emissions to the environment happen at every stage too. Actually, aluminum, either bauxite or primary aluminum, exists in chemical compound form in nature. However, all values of aluminum stocks and flows in this study are in terms of aluminum content, therefore the aluminum content is calculated using atomic weights and some transfer coefficients estimated from the previous literature [27,28].
A considerable amount of information such as development situation, consumption, trade, recycling, and loss of aluminum industry can be obtained from SFA. Consequently, the information provide a base and support to design and make resource policies; many research fields are involved in the following: (1) analysis of quantities in the entire system—Chen researched the whole life cycle of aluminum including production, trade, consumption, stocks, and losses using the SFA method [8,9,10,15,29]; Buchner analyzed Austrian aluminum flows in 2010 using a static SFA model and conducted extensive research on aluminum production, consumption, trade, and waste management [30]; (2) recycling and sustainability—Melo developed several models (statistical approaches) for estimating the potential scrap arising from discard metal-containing products to predict the amount of aluminum old scrap in the waste management stage in Germany [31]; Boin and Bertram carried out mass balance analysis in the aluminum recycling industry for the EU-15 in 2002 [32]; Hatayama et al. reported a dynamic SFA of aluminum and its alloying elements in Japan to estimate future quantities of discarded aluminum in each of the eight categories using a population balance model [33]; (3) combining with other aspects such as value chain and environment; Dhalström analyzed aluminum flows in the United Kingdom in 2001 combining SFA with economic and environmental dimensions to create a value chain analysis [34]; Gang developed a dynamic SFA model to simulate the stocks and flows of the U.S. aluminum cycle and analyze the corresponding greenhouse gas (GHG) emissions [13]. Of course, this wonderful methodology was also conducted to research other metals, such as copper [35,36,37,38,39,40], nickel [41], zinc [39,42,43], iron [26], lead [44,45], silver [46], phosphorus [47,48], and so on. In recent years, this method has been applied at a more micro level, and used to measure the recovery rate, recovery amount, and recovery potential of a certain kind of product within a region or a small area [49,50,51,52,53,54].
However, there are fewer studies on guarantee degree starting with supply structure under the SFA method. This paper analyzed the data structure of various aluminum flows in detail, gave a clear diagram of aluminum supply structure in China, then put forward feasible suggestions according to the research for obtaining guarantee degree of China’s aluminum resources.

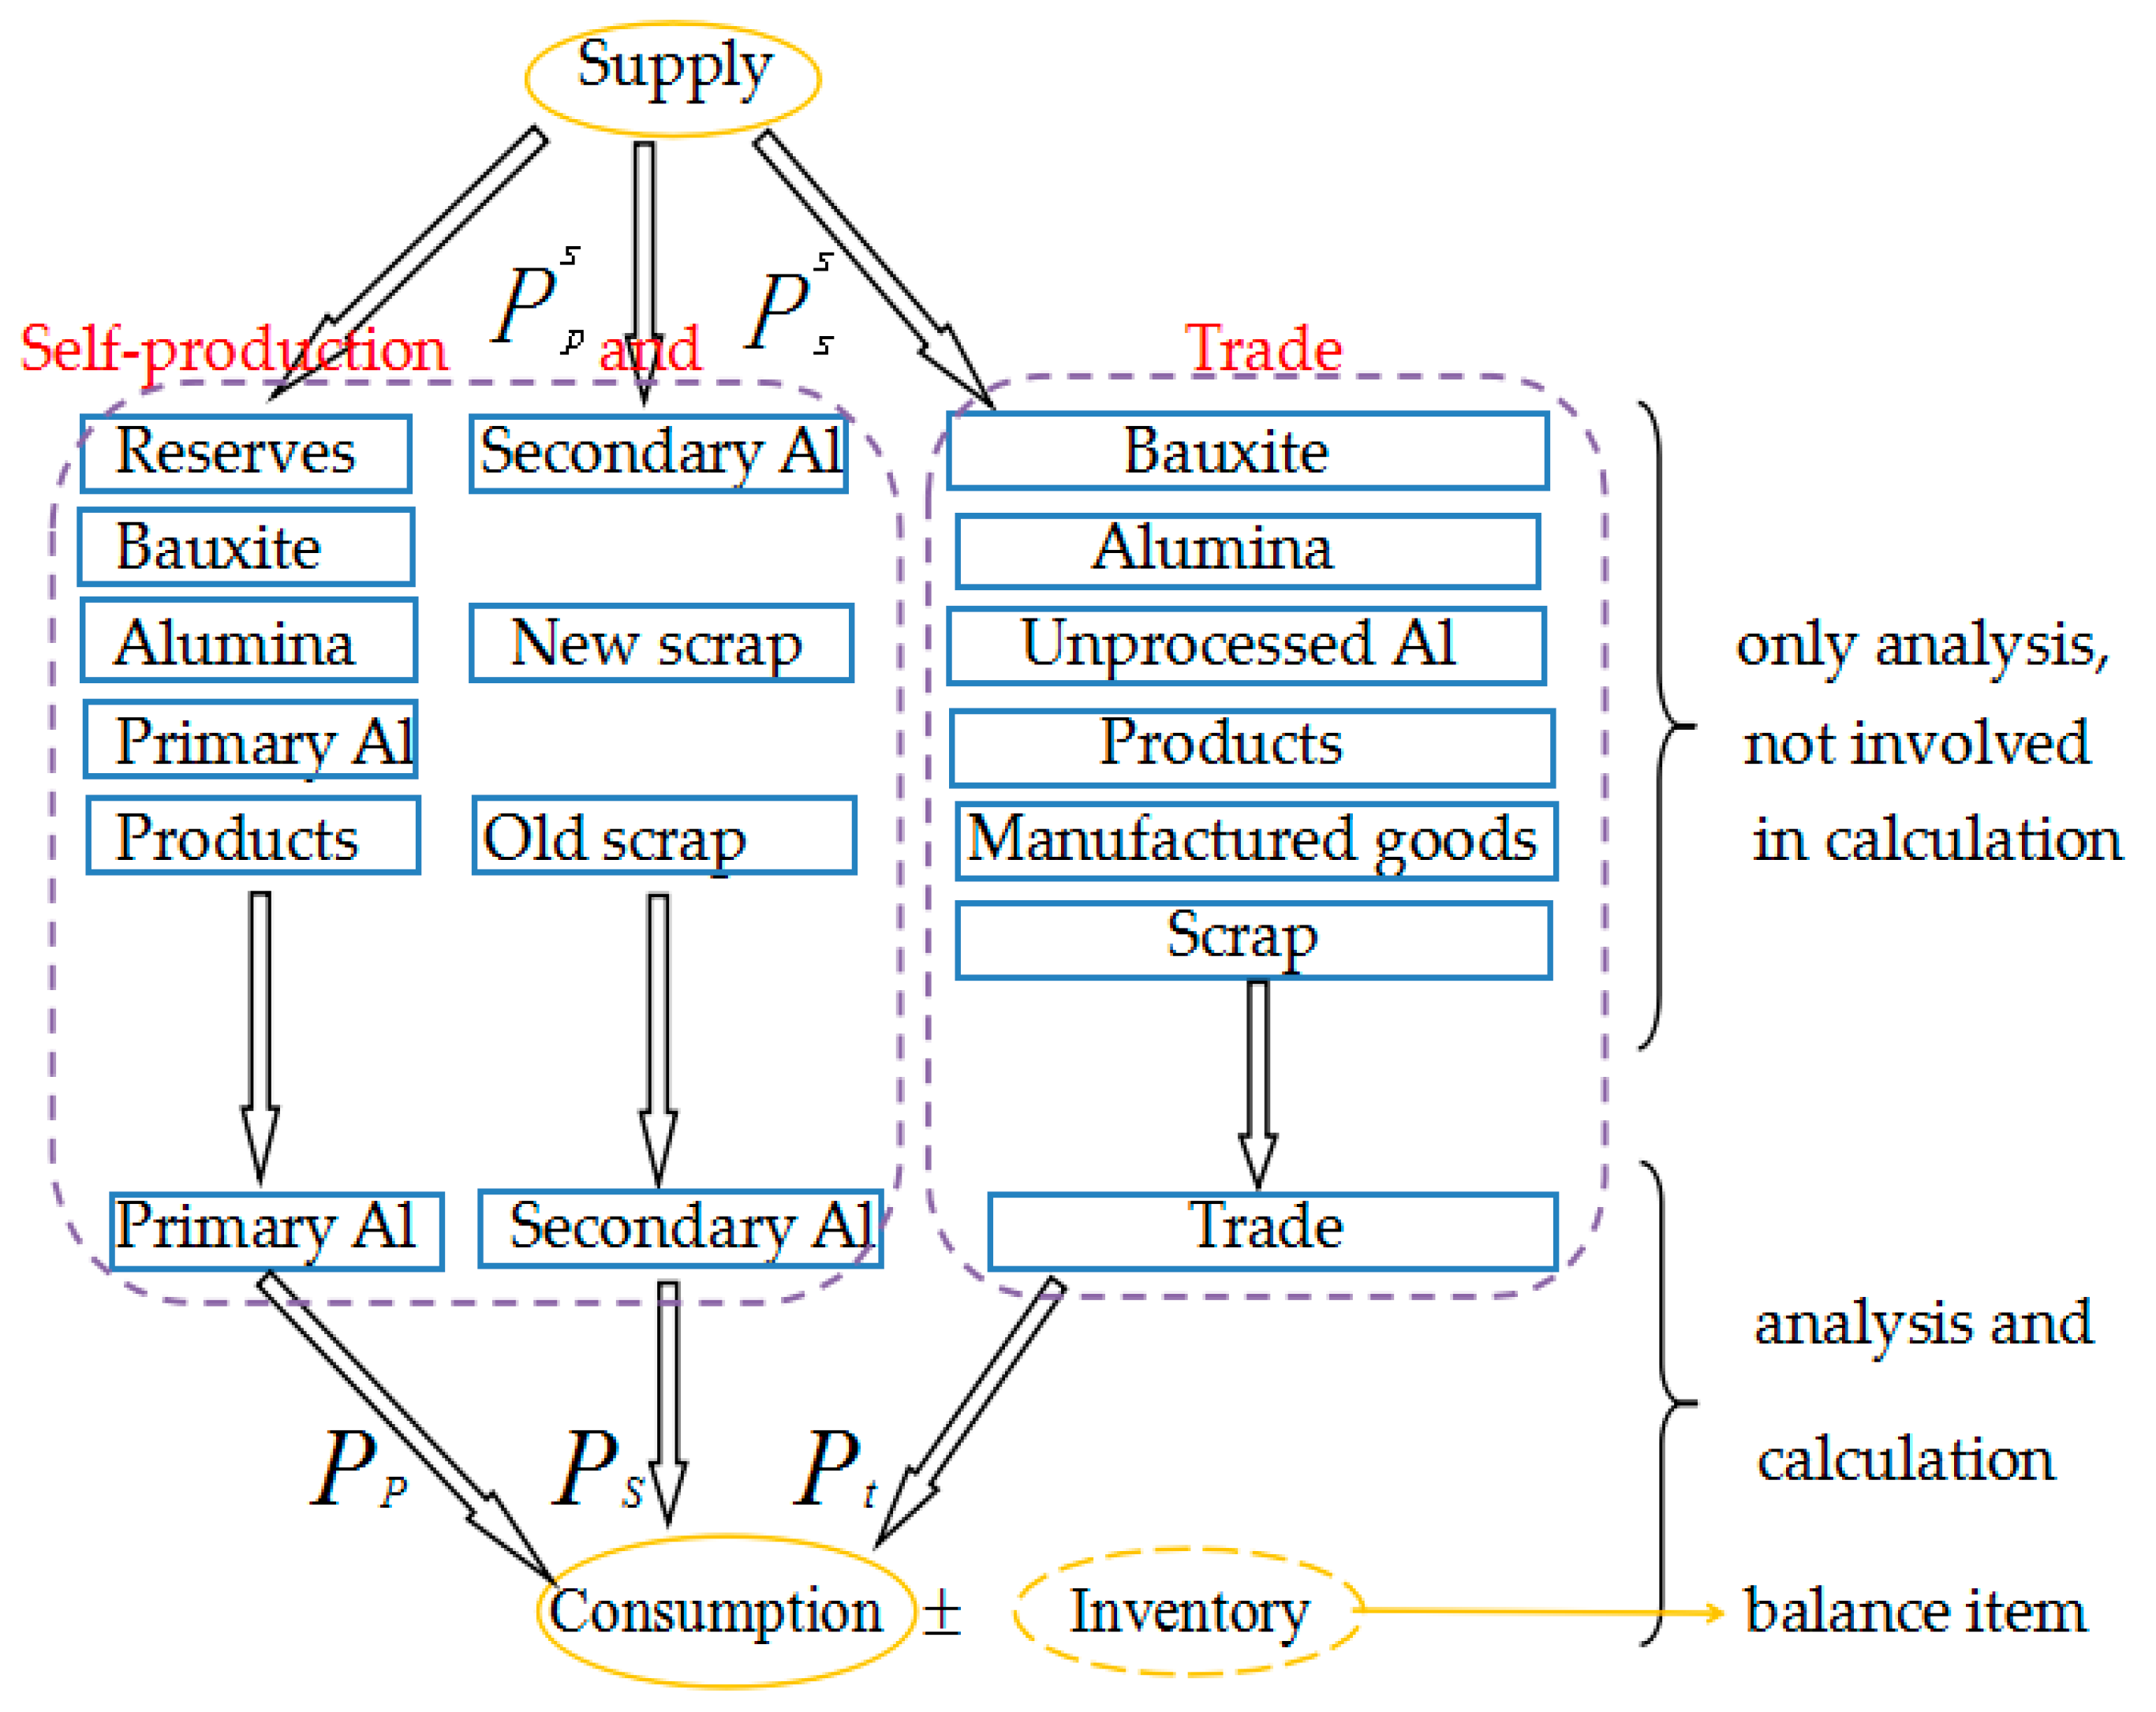
2.2. Supply Structure Model

Aluminum supply in China can be classified into five parts: primary aluminum, secondary aluminum, trade, overseas investment on bauxite, and substitute goods. However, overseas investment has not formed an effective support to China’s aluminum industry [55], and the proportion of substitute goods of aluminum or aluminum alloy are so small that they can be ignored. Therefore, the supply structure of China’s aluminum in this paper is the proportions of the former three parts taking up the domestic consumption plus “inventory”. Each part also possesses several sub-classifications (Figure 2). The “inventory” is just the balance of supply and consumption, and does not have much practical significance.
In this model, the section of primary aluminum includes five sub-classifications: reserves, bauxite, alumina, primary aluminum, and aluminum products. They are five successive products in the course of mining, smelting, fabricating, and manufacturing. The section of secondary aluminum includes three sub-classifications: secondary aluminum, new scrap, and old scrap. Similarly, these three sub-classifications also cannot be added together or subtracted out because secondary aluminum comes from remelted new scrap and old scrap. The section of trade includes six sub-classifications: bauxite, alumina, unprocessed aluminum, aluminum products, manufactured goods, and scrap. They are aluminum-containing materials through trade, and this paper requires the net imported quantity of unprocessed aluminum. The inventory is the part of supply more than consumption of the same year.
The research model contains five variables: the production of primary aluminum, secondary aluminum, net import of unwrought aluminum, domestic consumption and inventory, and their relationship is domestic primary aluminum + domestic secondary aluminum + net import of unwrought aluminum = domestic consumption ± inventory. P P , P s , and P t represent, respectively, the proportions of domestic primary aluminum supply, domestic secondary aluminum supply, and net import of unwrought aluminum taking up consumption and inventory. In addition, the bauxite that produces domestic primary aluminum and the recycled scrap that produces secondary aluminum are sourced from the homeland and other countries, so the calculations for self-productive supply structure are as follows:
P p s = P p × D b ( D b + N I b ) P s s = P s × D s ( D s + N I s )
P p s = P p × D b ( D b + I b ) P s s = P s × D s ( D s + I s )
P p s and P s s represent the proportion of self-productive primary and secondary aluminum in the supply structure, respectively. They are considered as the guarantee degrees of primary and secondary aluminum. D b and D s denote, respectively, production of domestic bauxite and domestic recycled scrap; N I b , I b , N I s , and I s denote net import of bauxite, import of bauxite, net import of scrap and import of scrap respectively. The exported amounts of bauxite and recycled scrap are so small that Equation (1) can be expressed as Equation (2):
T S G = P p s + P s s .
T S G is the total supply guarantee degree of China’s aluminum resources.

2.3. Data Compilation and Assumptions

The data are from various sources. Some comes from governmental or industrial statistics such as the China Nonferrous Metals Industry Yearbook, the World Bureau of Metal Statistics, the United States Geological Survey (USGS) and the Research Center for Strategy of Global Mineral Resources, Chinese Academy of Geological Science. Missing data are supplemented by the interpolation method or the law of conservation of mass. The spatial boundary of this paper is mainland China, and the temporal boundary of this paper is the late 1990s, because Chen concluded that growth rates of all aluminum flows in mainland China increased from decade to decade, with 75% of the flows taking place in the last two decades [10].
This paper gives some assumptions for better analysis of aluminum supply structure in mainland China: (1) Three parts constitute the whole aluminum supply structure of mainland China; (2) Some quantities of aluminum-containing materials in this paper are physical quantities, while some are metallic content, because of the inaccuracy of parameters and metallic proportions of aluminum-containing materials and aluminum products. However, the applied data is metallic content at the final calculations of P P , P s , P t and P p s , P s s ; (3) In Section 4, this research makes a hypothesis that steady and rapid economic development will occur as long as there is no economic boom or depression in the course of forecasting supply and demand.

3. Results

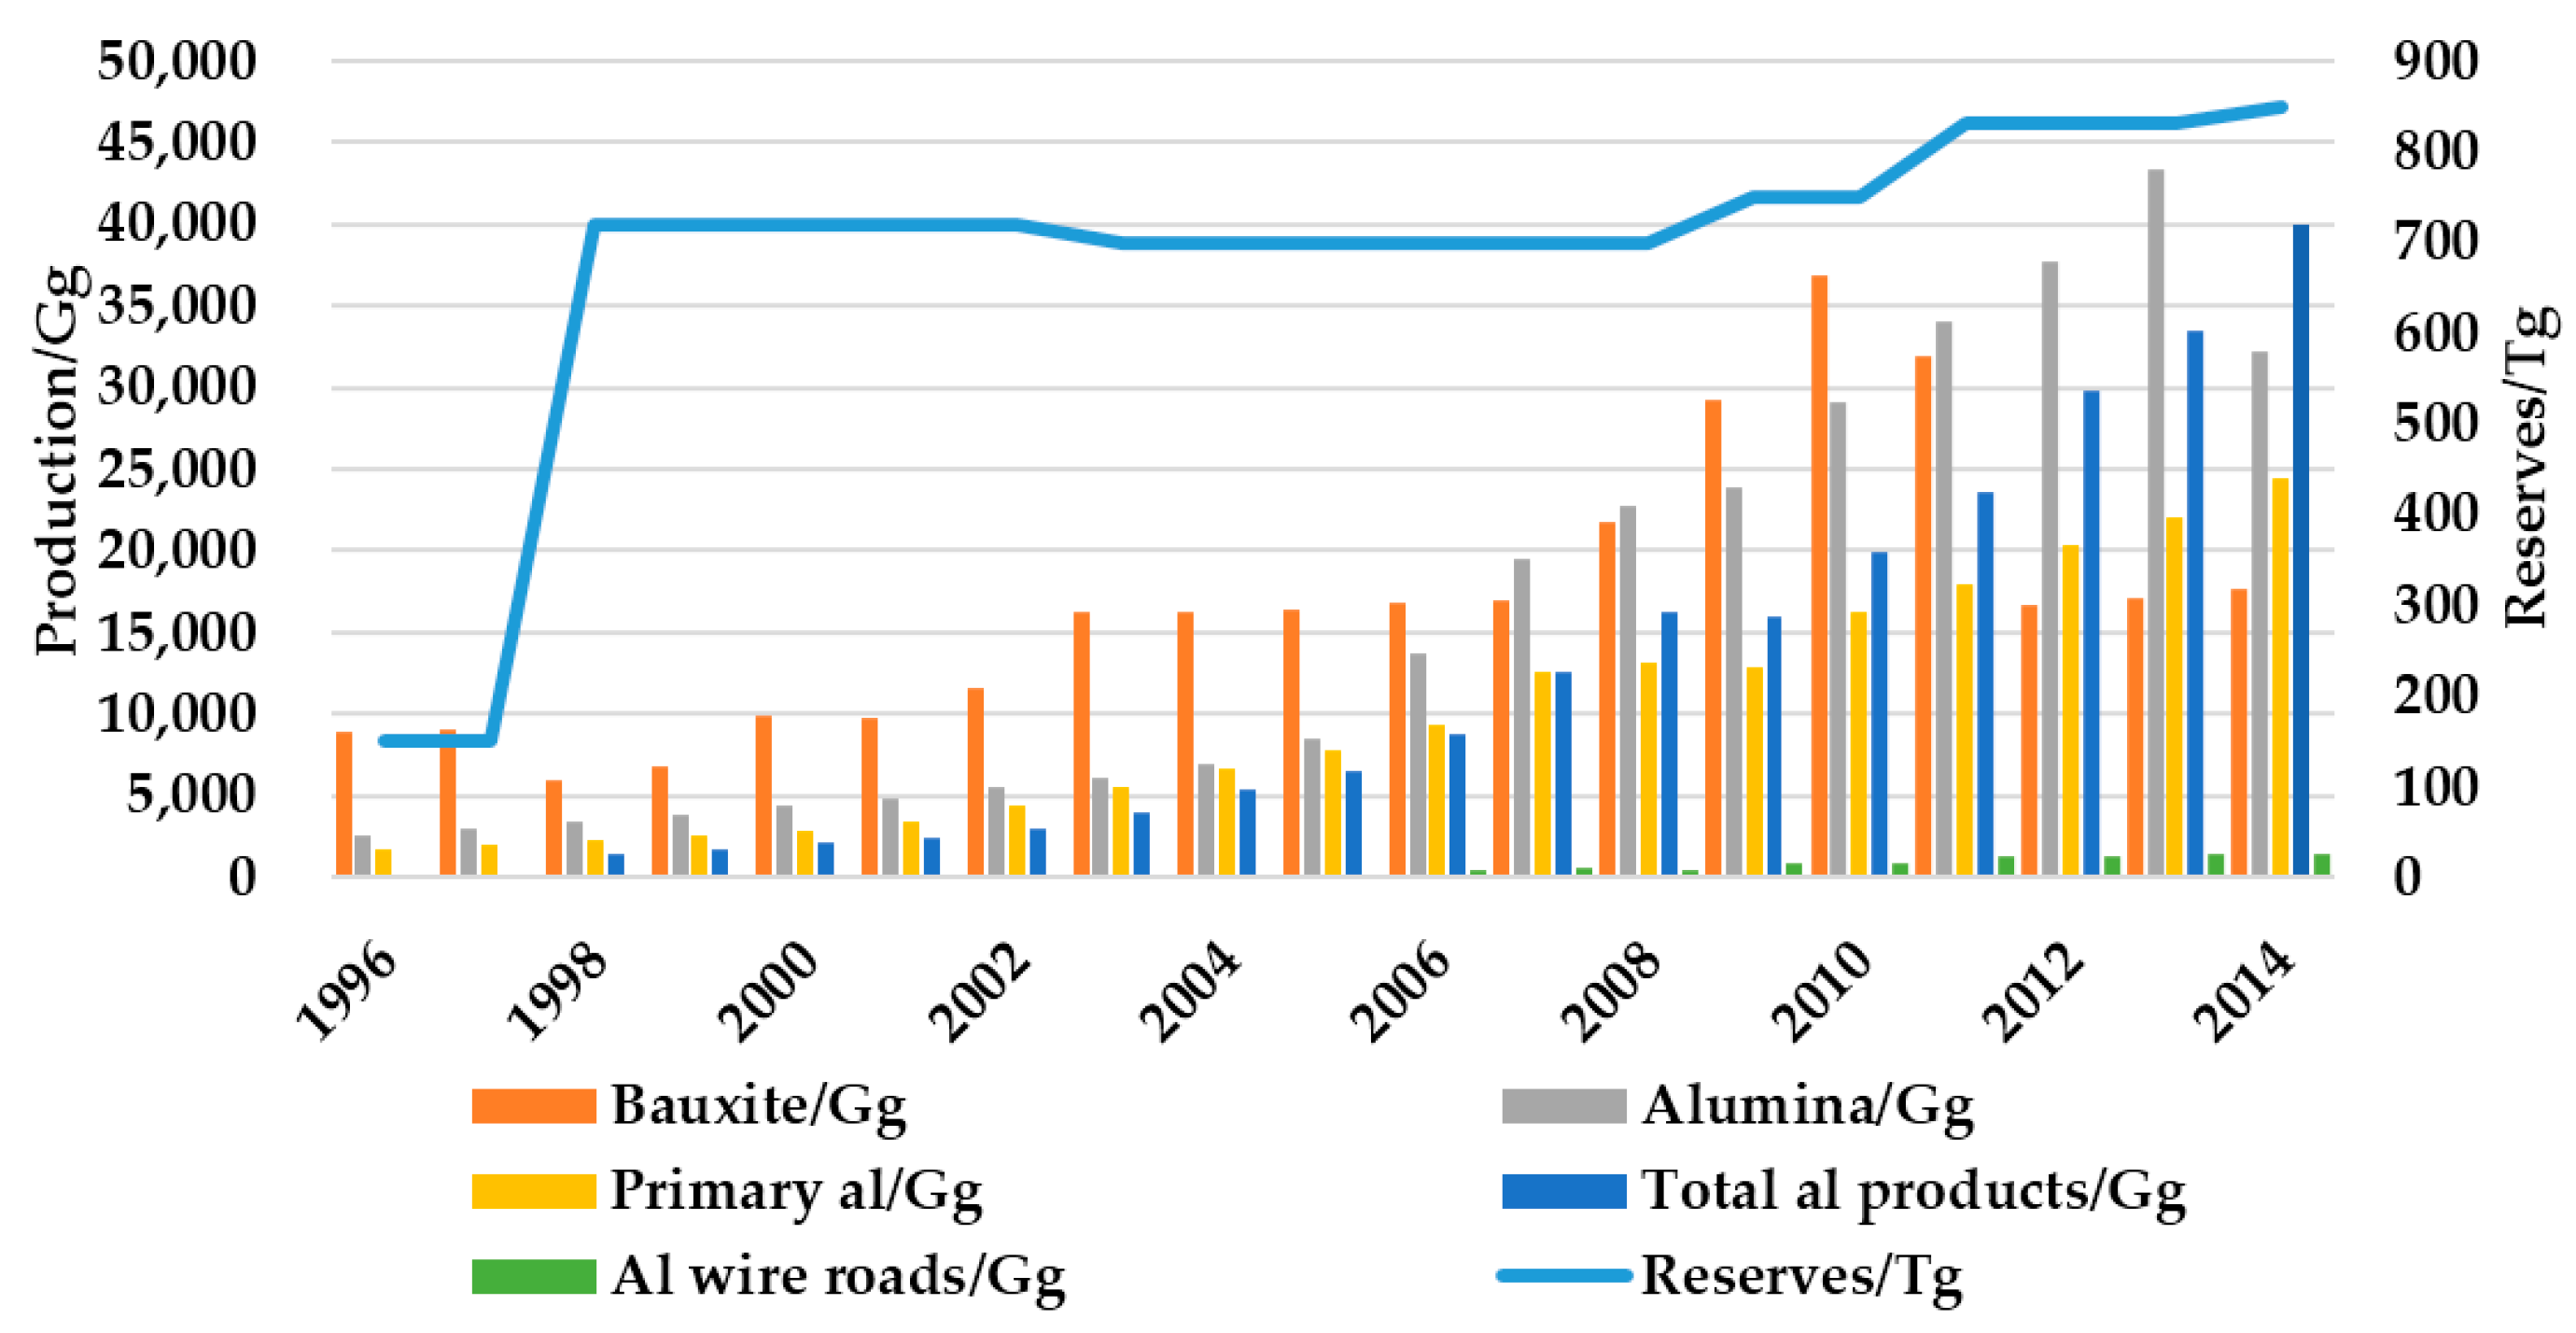
3.1. Domestic Aluminum Supply

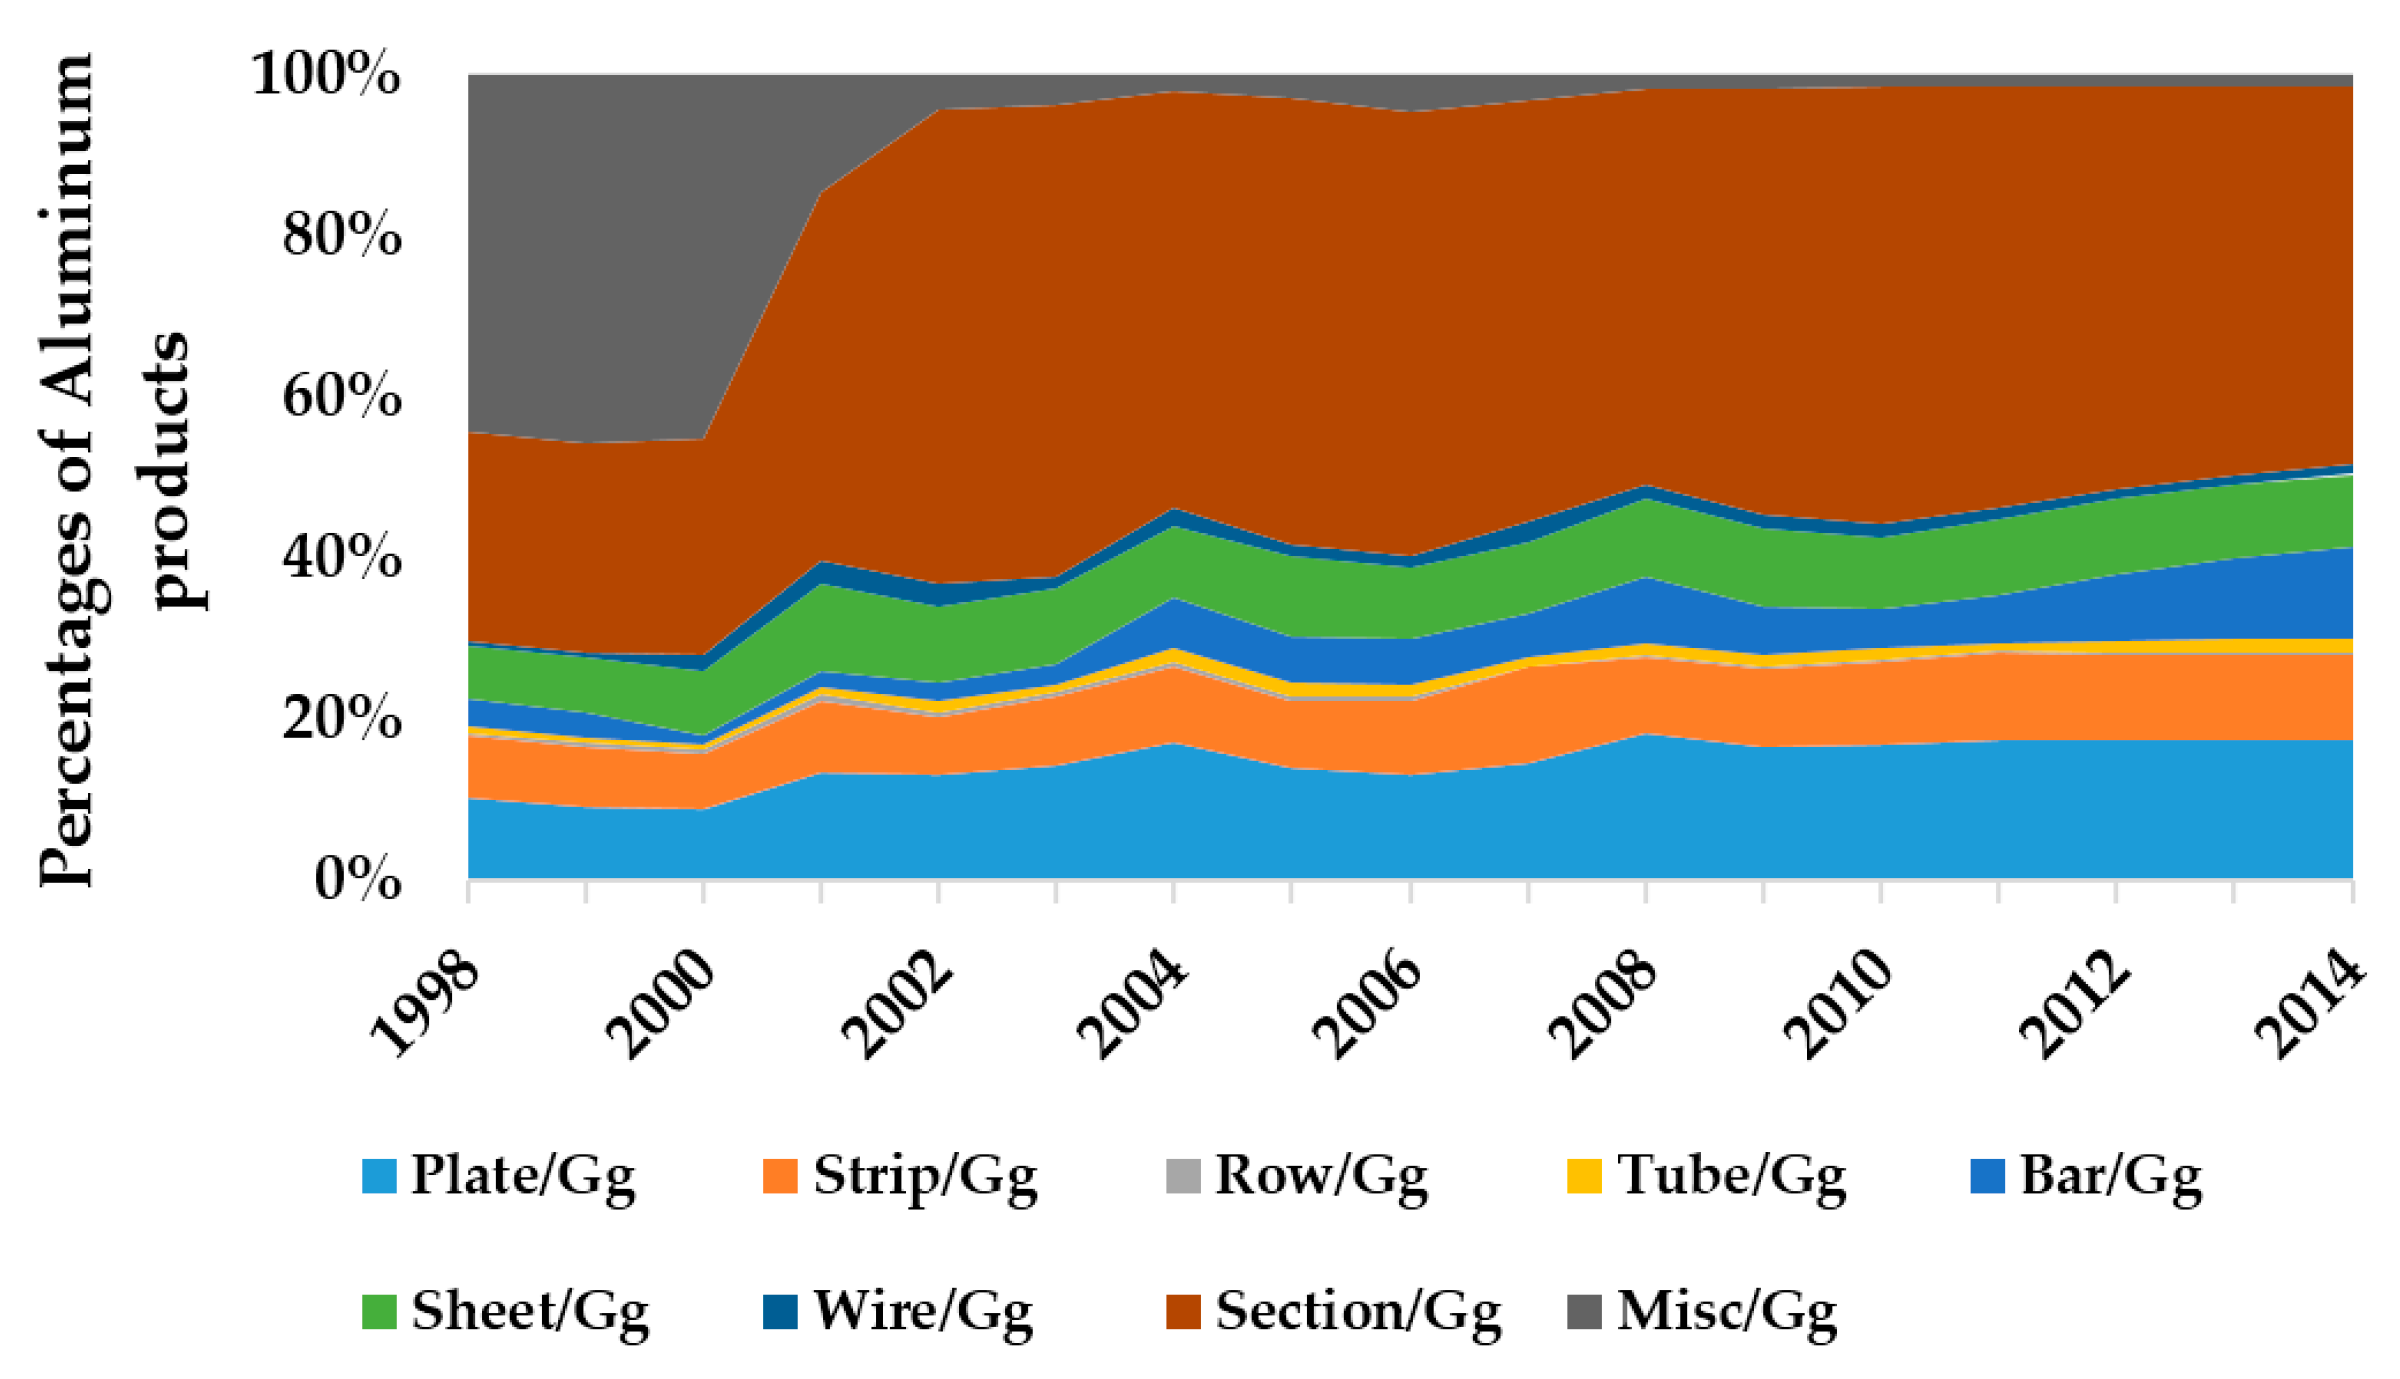
3.1.1. Primary Aluminum Supply

The absolute quantities and annually relative changes of aluminum-containing materials in mainland China from 1996 to 2014 are shown in the Figure 3 and Figure 4. The changes of all aluminum-containing materials depicted in Figure 3 are regular except reserves, bauxite output, and alumina production. The average annual growth rates in this period of primary aluminum production, total aluminum products, and aluminum wire roads are 16%, 23.4%, and 28.3%, respectively. Aluminum reserves increased approximately 4-fold in 1998, which denotes the abundant fruits of prospecting in this year, but increased slowly in later years. There emerged a strange phenomenon in bauxite output: in the period 2008–2011, the production of alumina, primary aluminum, and total aluminum products all increased slowly even had a tendency of decreasing, and the average annual growth rates are 14.6%, 9.5%, and 17.6%, respectively, lower than the average rates from 1996 to 2014 due to the international financial crisis; however, the bauxite output increased rapidly in this period and the average growth rate was 15.8%—by comparison, the average growth rate from 1996 to 2007 was 8.1%. However, it was halved in 2012, and there were no big changes in 2013 or 2014. As for the alumina production, it reduced by a quarter in 2014.
There are nine aluminum products (plate, strip, row, tube, bar, sheet, wire, section, and miscellaneous) illustrated in Figure 4, and the proportions of these products are distinct. In 2014, the most significant proportions are section, plate, and bar, which are 45.3%, 16.8%, and 10.8%, respectively, but the smallest proportions are row, wire, and tube, which, respectively, are 0.4%, 1.2%, and 1.7%. The largest change is in miscellaneous, from 44.3% in 1998 to 1.3% in 2014; the next is section, from 26% in 1998 to 45.3% in 2014; the third is bar and plate, from 3.2% and 10.4%, respectively, in 1998 to 10.8% and 16.8% in 2014. There are no obvious changes in the proportions of other aluminum products. For further analysis, the amounts of all products increased dramatically on the whole; the average annual growth rates were 28.6%, 26.9%, 38.4%, 38.1%, 45.9%, 25.6%, 50.4%, and 28.6% (except miscellaneous, only 8%) from 1998 to 2014. At the same time, the growth rate of miscellaneous in 2014 is −2.6% in comparison with the year 1998. Although the decrease in amount of miscellaneous was only 2.6%, its occupied proportion of total aluminum products dropped markedly. This is because production of miscellaneous underwent no significant change in these years, but the production of other products increased rapidly.

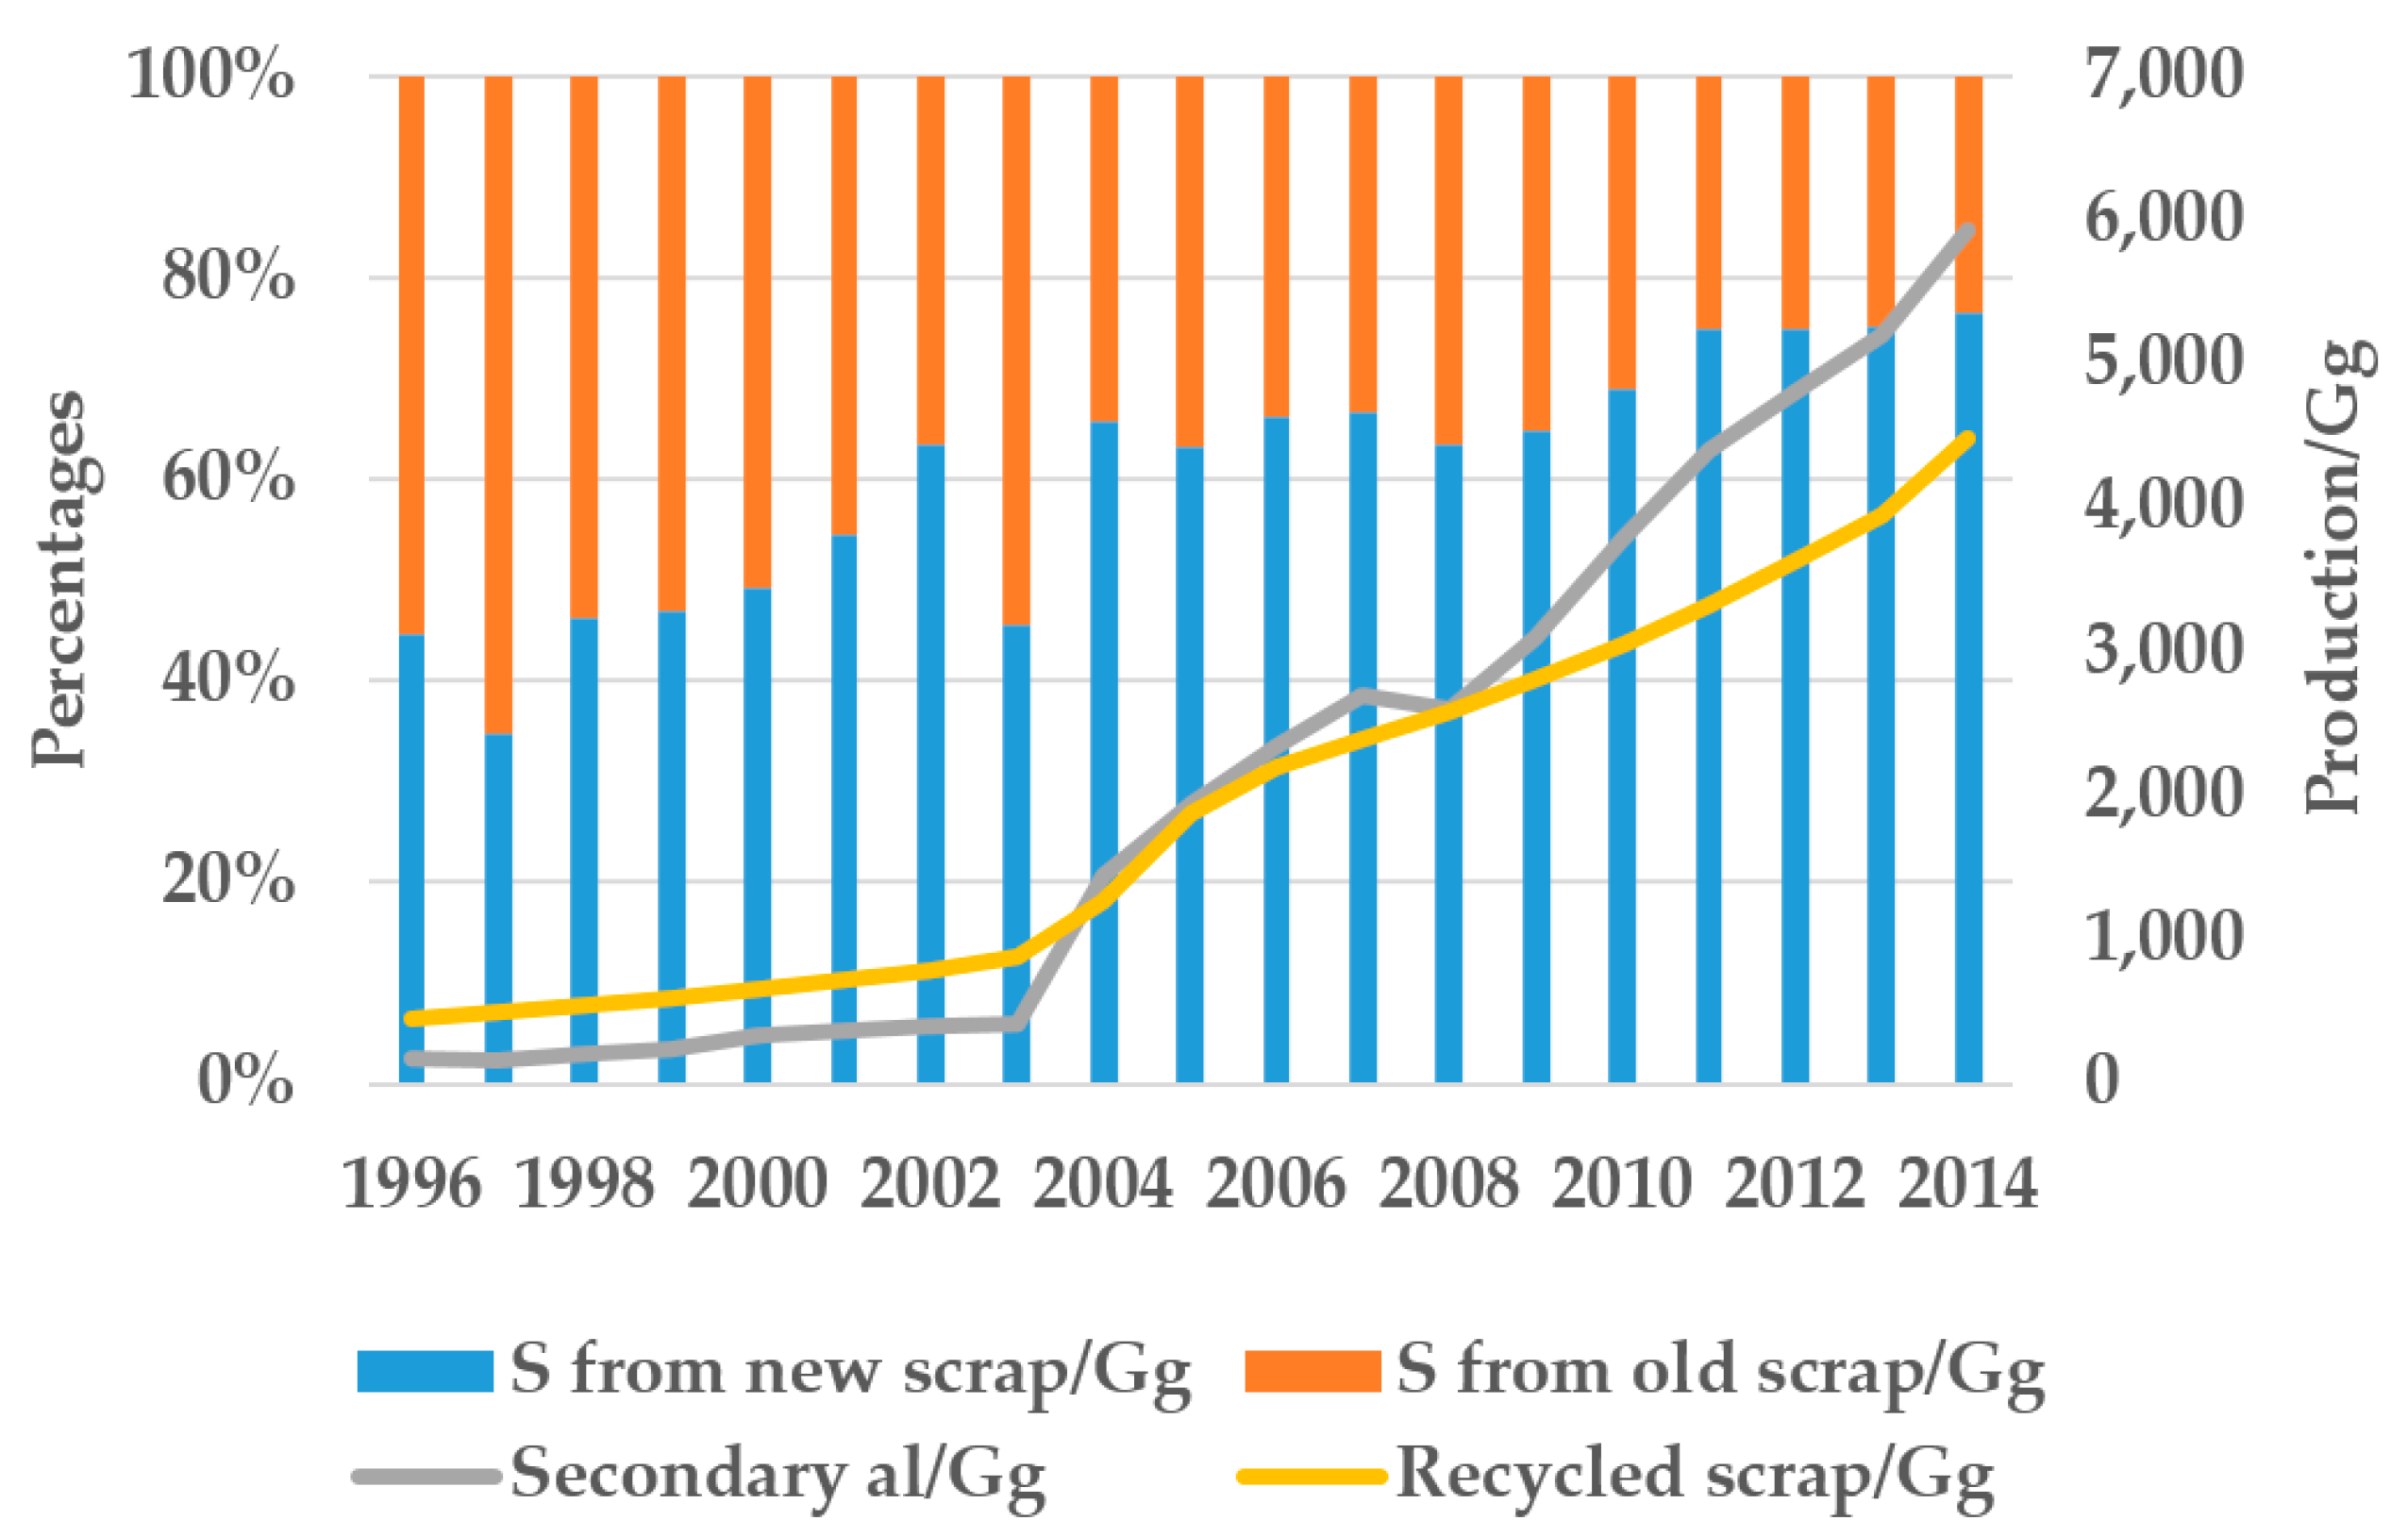
3.1.2. Secondary Aluminum Supply
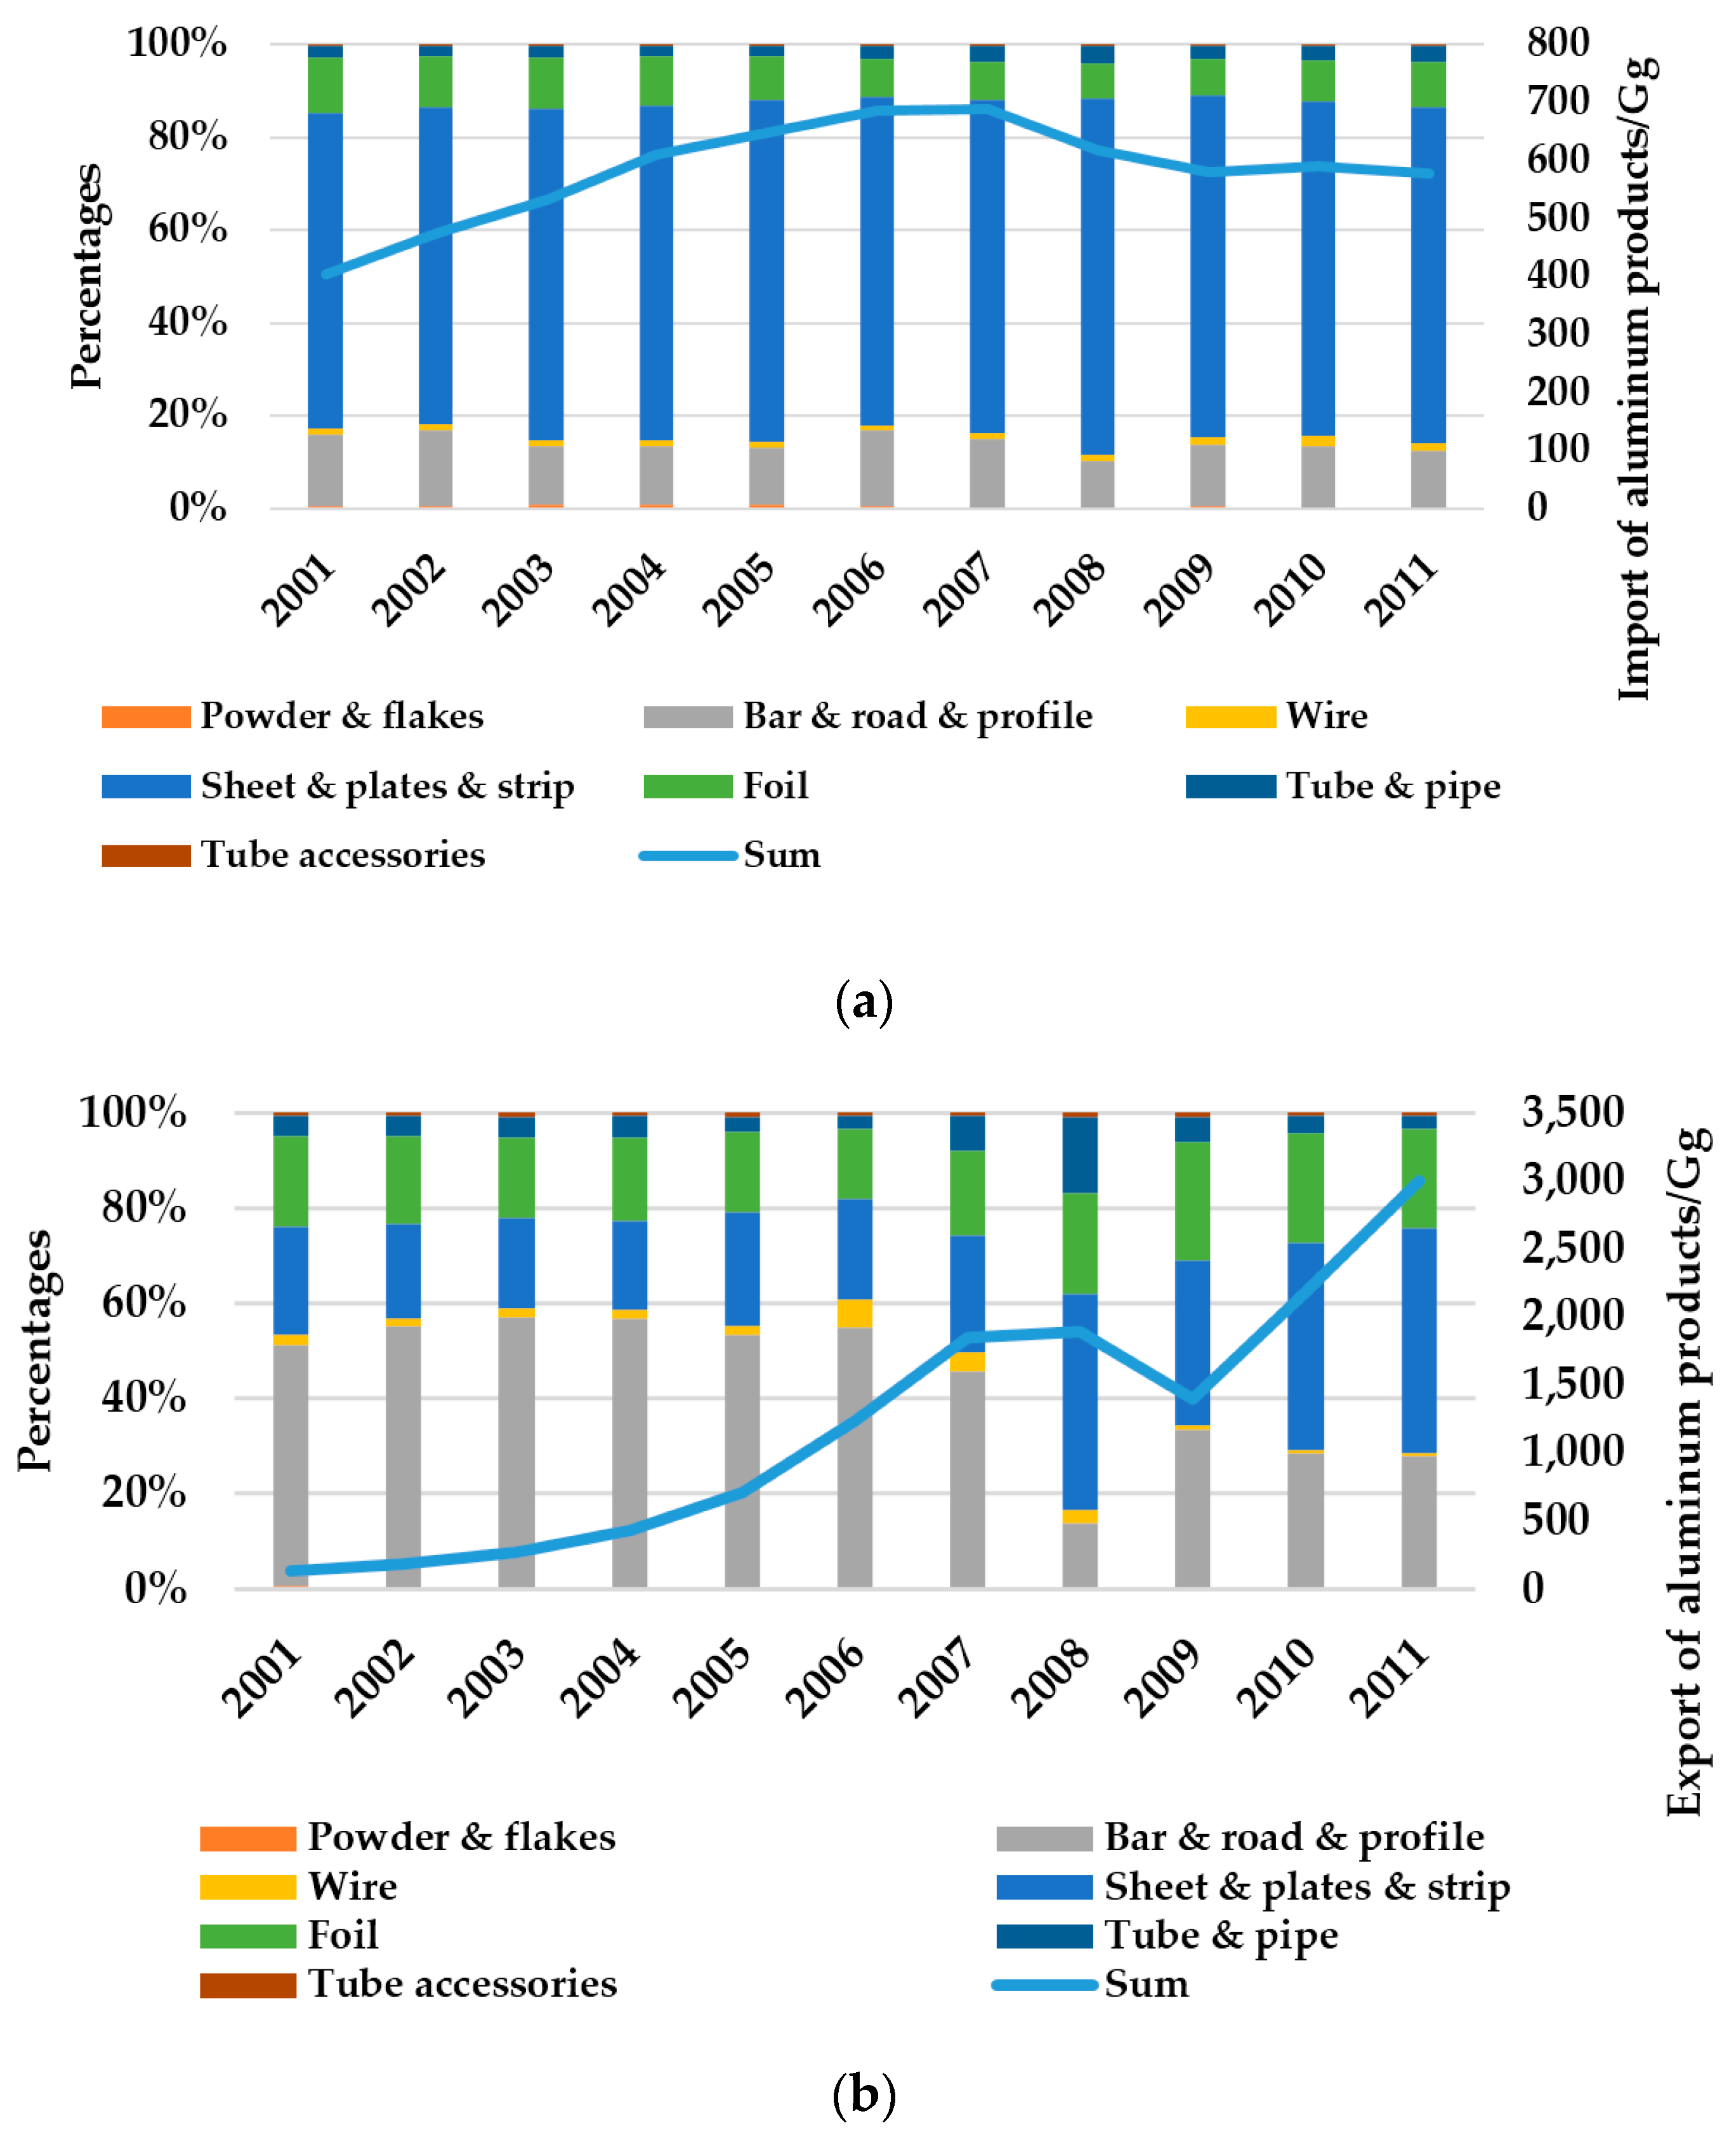
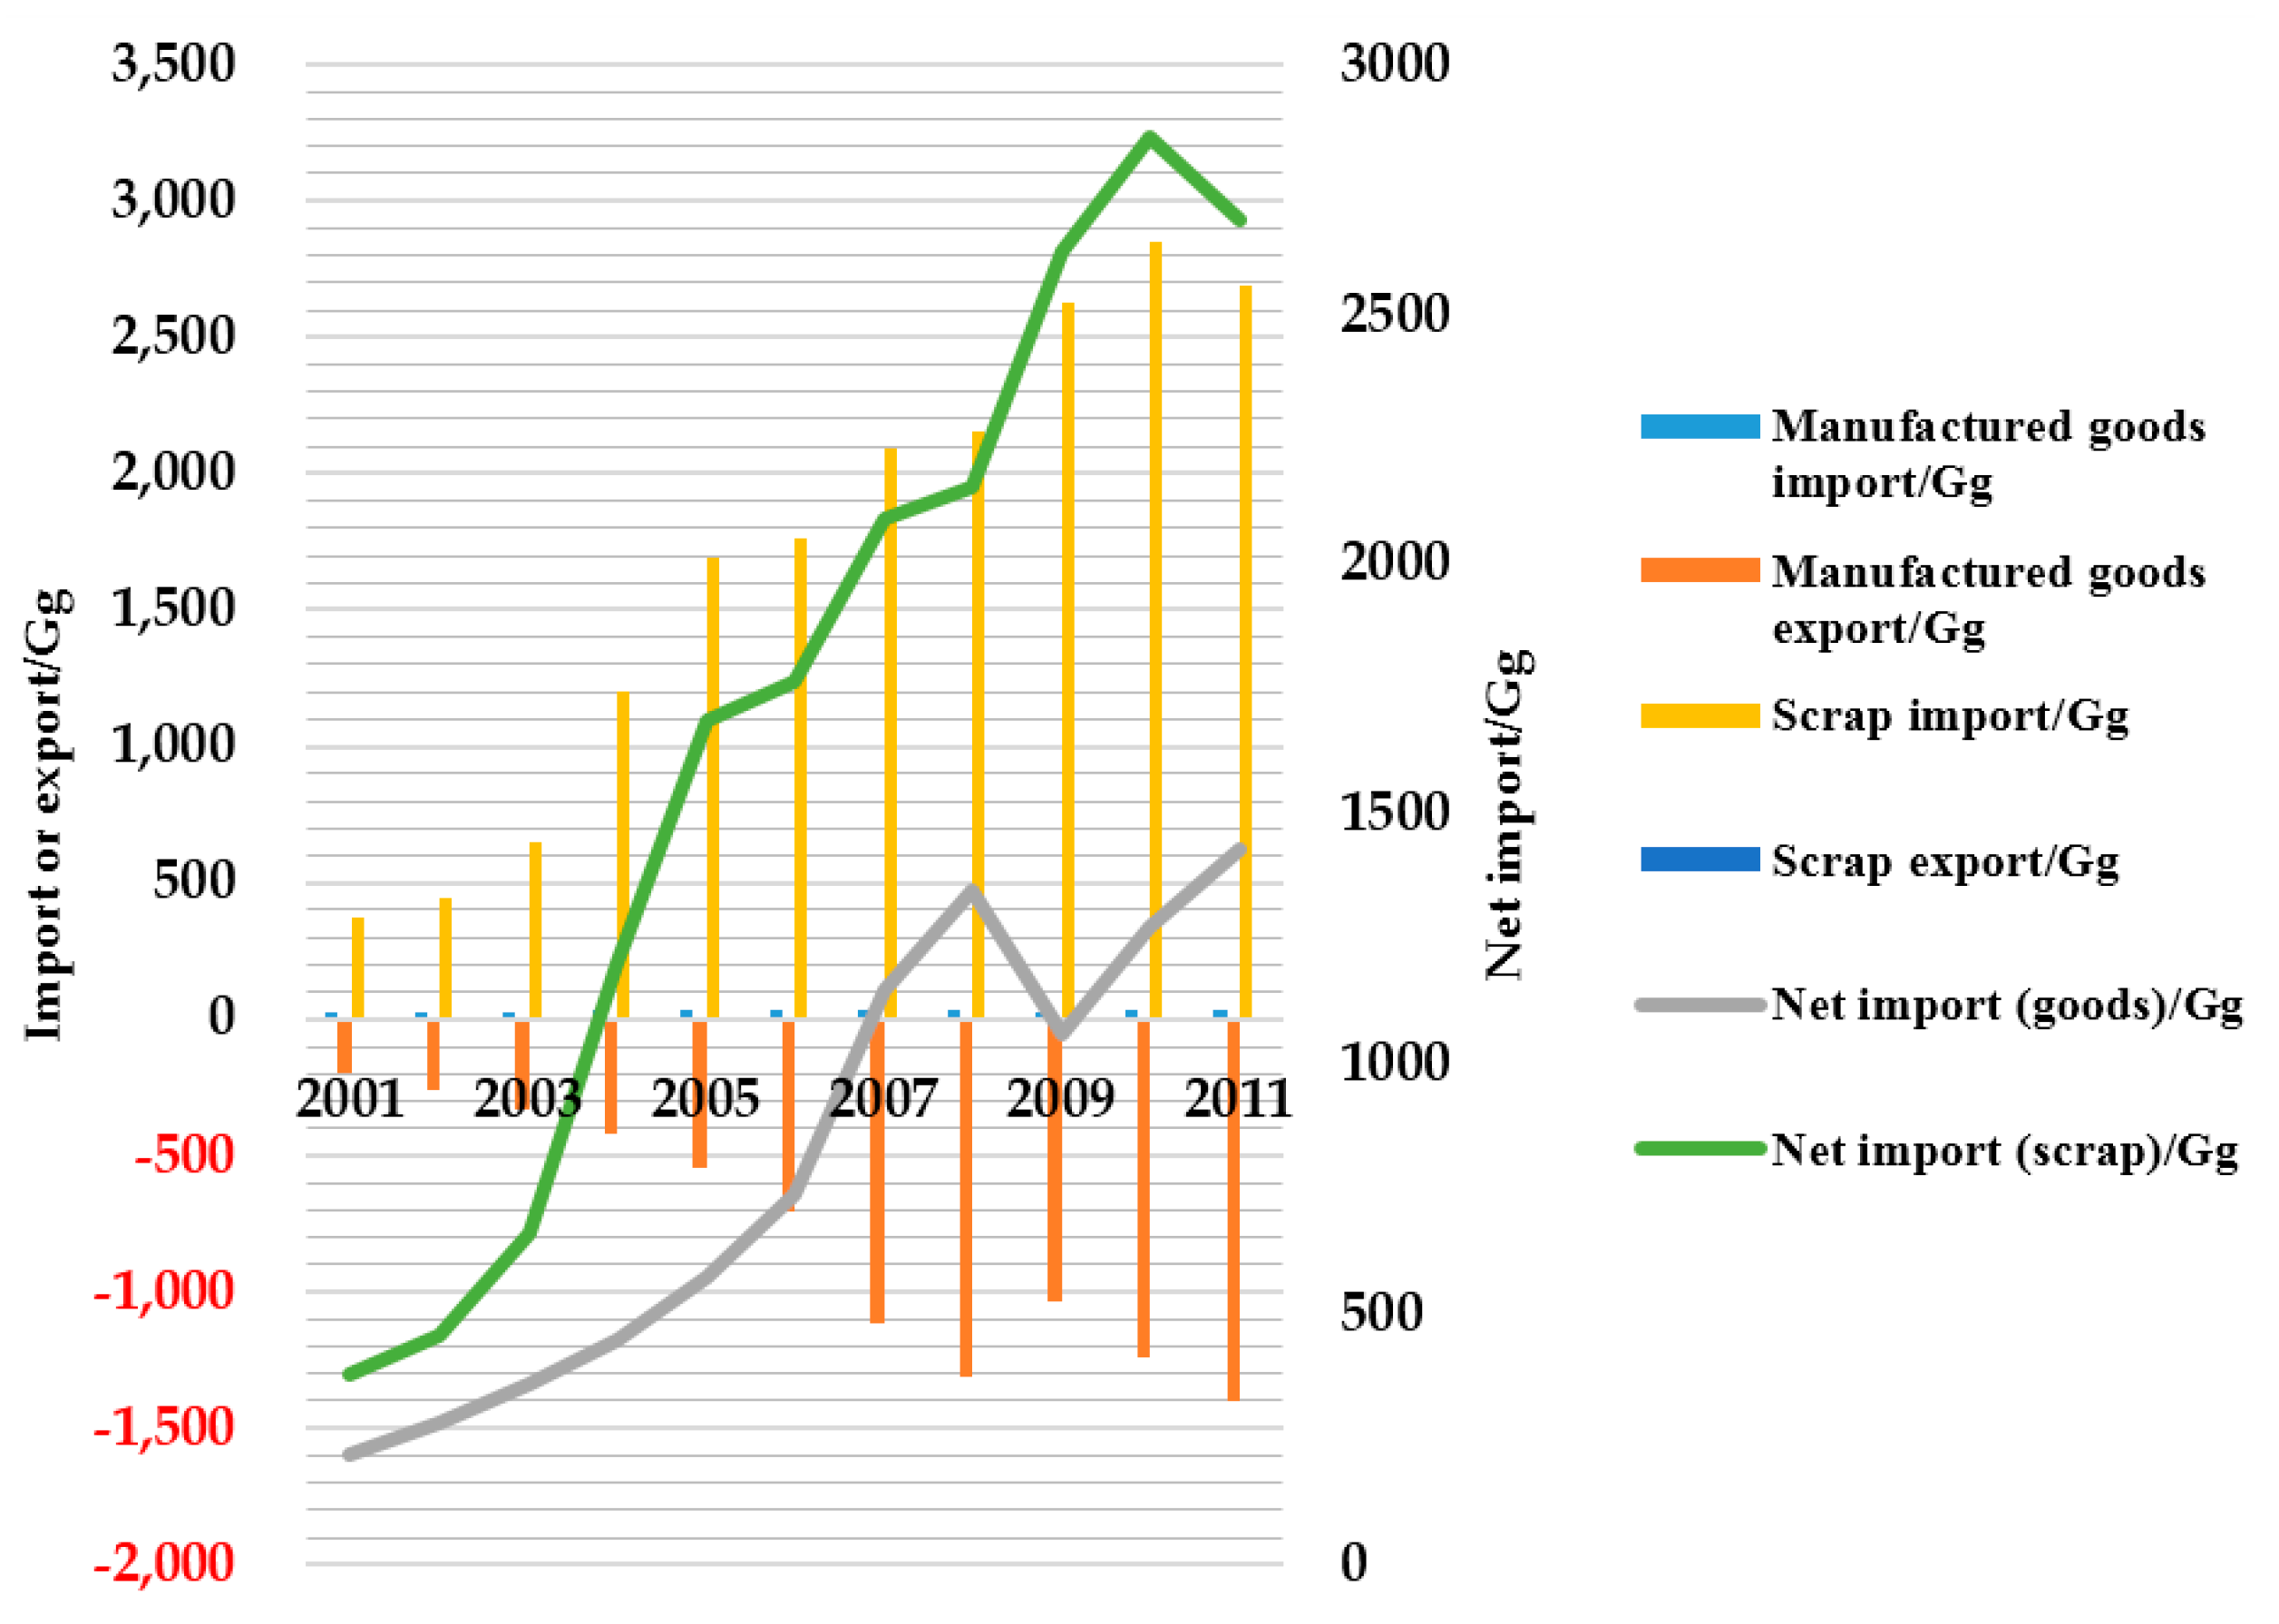
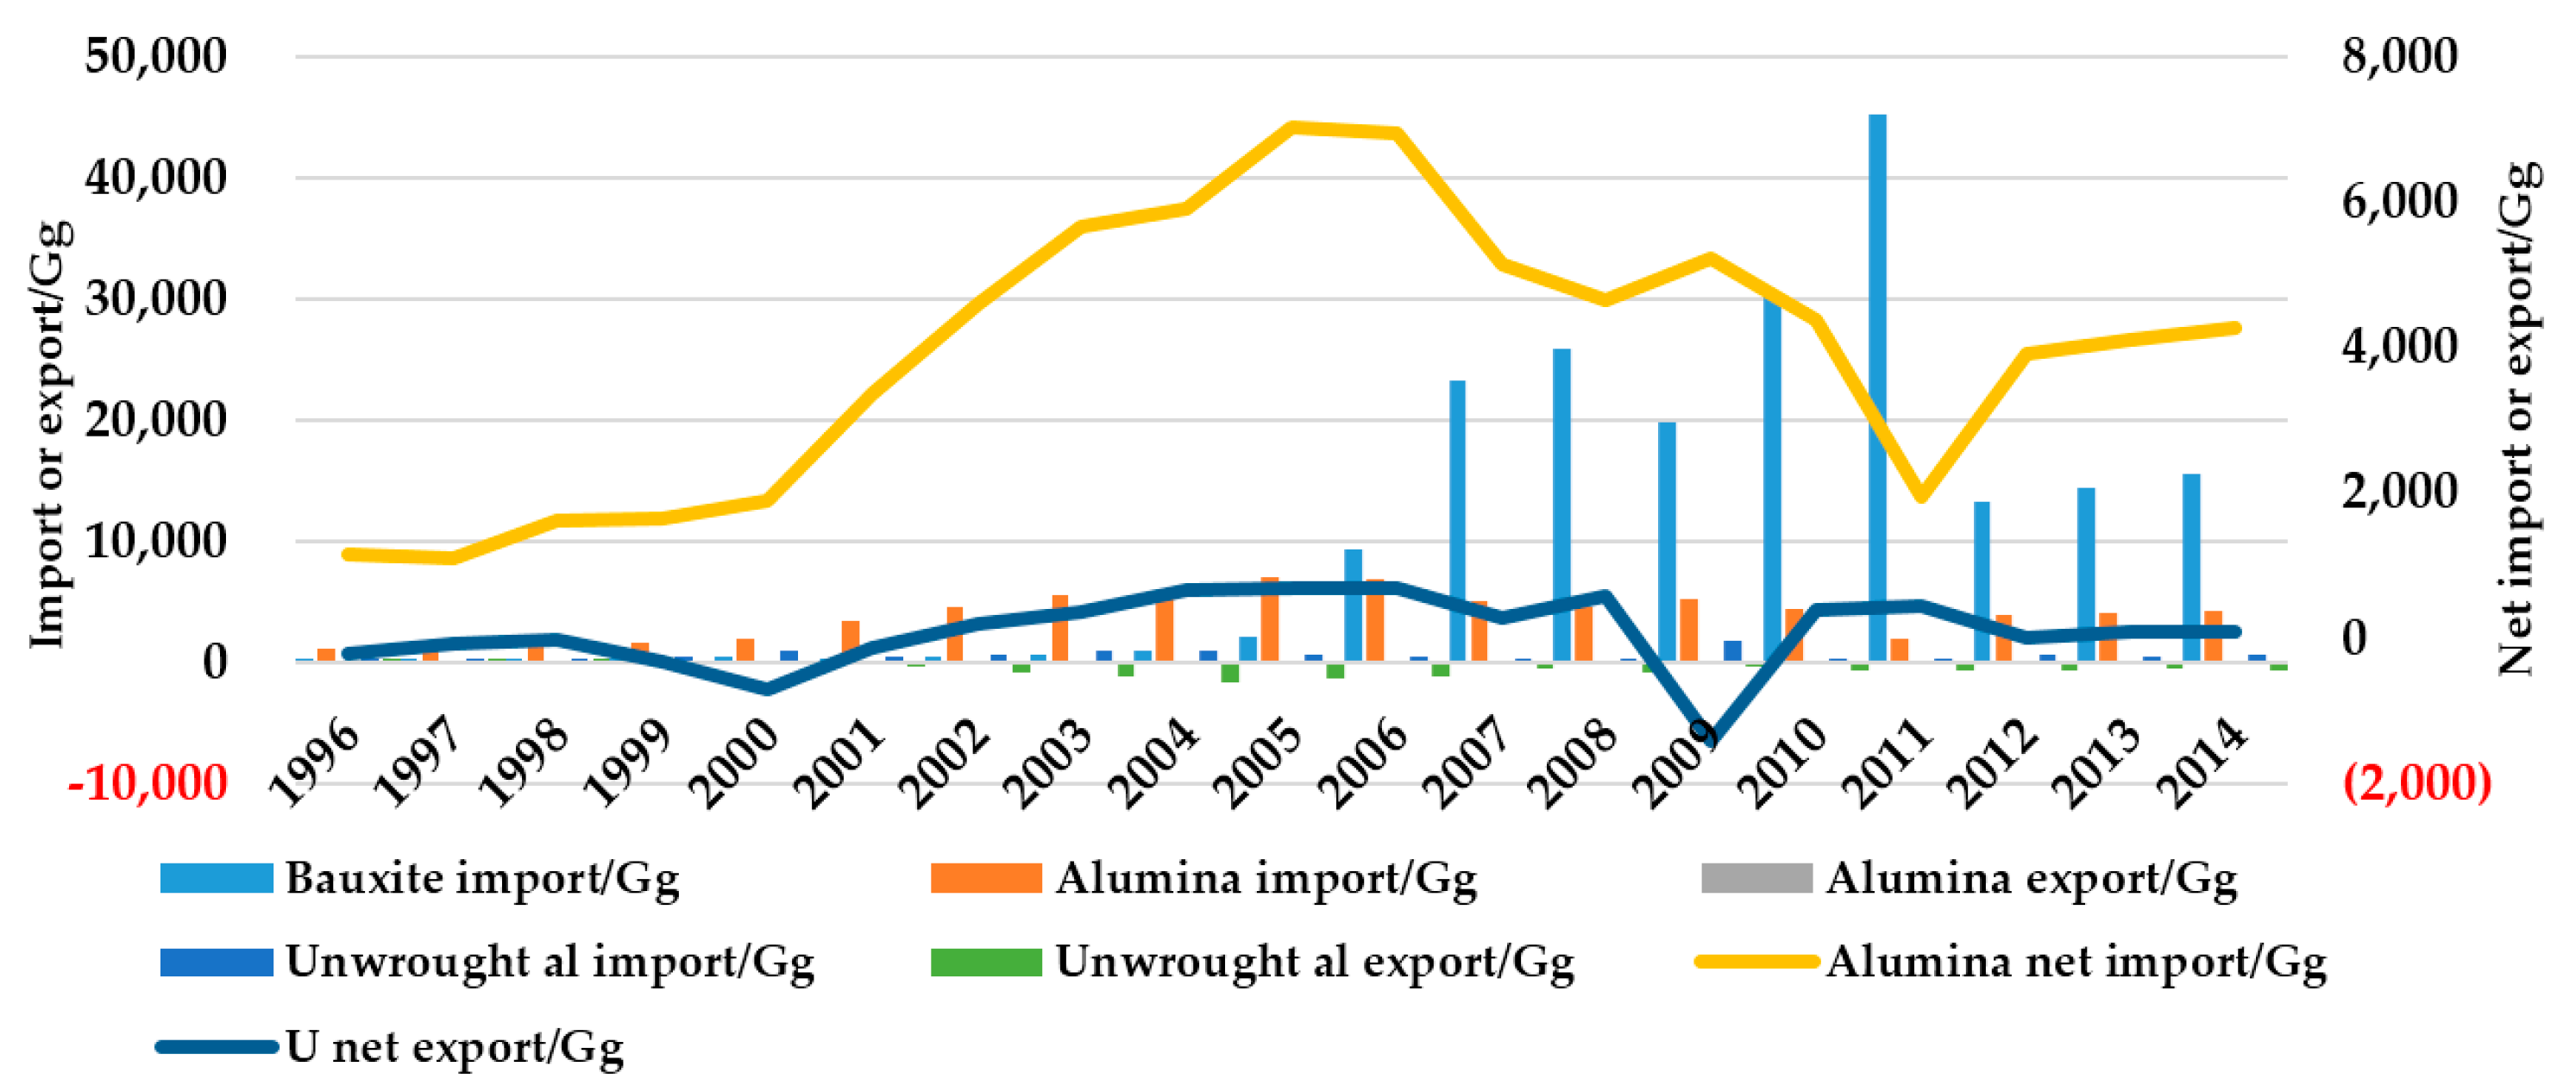
Domestic recycled scrap and the quantity and structure of secondary aluminum in mainland China in the period 1996–2014 are displayed in Figure 5. The secondary aluminum industry in China shows a tendency of steady and rapid development due to the advanced concept of circular economy and the strategy of sustainable development. The average annual increase rates of recycled scrap and secondary aluminum are 14% and 27.8%, respectively. Secondary aluminum comes from scrap by recycling, disassembling, disposing, or remelting; therefore, the amount of recycled scrap should be more than of secondary aluminum. By contrast, the amount of recycled scrap has been less than that of secondary aluminum since 2004, and the gap between them has become greater since 2009. The ever-increasing imported scrap filled up the gap and explained this phenomenon.

3.2. Trade

International trade plays an important role in promoting the development of participant countries and the world economy. It can adjust the relationship of supply and demand of international markets, make full use of essential productive factors, improve the production efficiency of participant countries, optimize the structure of domestic industries, and so on.
The trade situation of bauxite, alumina, and unwrought aluminum in mainland China from 1996 to 2014 is shown in Figure 6. In general, the quantities of imported or exported bauxite, alumina, and unwrought aluminum kept increasing, but the course was full of reversals and zigzags, without obvious regularity. Bauxite import grew rapidly in the period 1996–2008 and the average annual growth rate was 72%, especially high in 2006 (increased by 3.3 times) and 2007 (increased by 1.5 times). However, due to the influence of the international financial crisis, it declined by one-fifth in 2009. Then it increased and reached a peak in 2011. In 2012–2014, the imported amount was at one-third or so of that in 2011, while the exported amount was very small (0.15 Gg in 2010), which this paper neglects. There are two points that can be made with respect to alumina import in 2005 and 2011. The imported amount gradually increased from 1996 to 2005, with an average annual growth rate of 24.3%, and reached a peak in 2005. Then it decreased from 2006 to 2011, with an average annual decrease rate of 16.2%, decreased by about one-quarter in 2011, then increased slowly. The exported amount of alumina reached a maximum in 2009, but it is still smaller comparison with the imported amount, and there are no significant changes, so the change regularity of net imported amount is similar to that of the imported amount. The quantitative base of imported unwrought aluminum is very small in comparison with that of bauxite and alumina, but the situation is more complicated. It kept increasing at a rate of 39.2% from 1996 to 2000, then reduced by half in 2001. In the period 2002–2004, it increased at a speed of 34.4%, then reduced by one-third in 2005. From 2006 to 2008, it reduced in speed by 26.3%, then grew quickly to a maximum in 2009, about seven times the quantity in 2008. Then, it hovered at between one-fifth and one-third of that in 2009. The exported amount of unwrought aluminum increased more quickly, reaching a maximum in 2004, and the average annual growth rate in this period was 59.1%. Then it decreased steadily from 2005 to 2014, but also increased in some years. The net imported amount of unwrought aluminum is basically negative, so for convenient calculations net export is adopted in this research. However, the more imports and fewer exports, especially in 2009, denote that China is pursuing transformation of the trade structure. Through importing more unwrought aluminum, China wants to satisfy the demand for domestic rapid industrialization and urbanization, implementing the strategies of sustainable development and scientific development.
The aluminum products through international trade contain powder & flakes, bar & road & profile, wire, sheet & plate & strip, foil, tube & pipe, and tube accessories. The total imported quantity of aluminum products has been increasing steadily since 2001, reaching a maximum in 2007, then gradually dropped and still had a tendency to drop in the future. While the exported quantity increased on the whole from 2001 to 2011, with an average annual increase rate of 33.1%, it still had a tendency to increase in recent years. As we can see in Figure 7a, the proportions of varieties of imported aluminum products have not changed much. The largest proportion of total imported aluminum products is sheet & plate & strip, from 68% in 2001 to 72% in 2011; the next are bar & road & profile and foil, from 16% and 12% in 2001 to 12% and 10% in 2011, respectively. However, the change of export structure of aluminum products is rather complicated. In 2001, the largest ratio of total exported aluminum products is bar & road & profile, the next are sheet & plate & strip and foil, with ratios of 51%, 23%, and 19%, respectively; nevertheless, in 2011, the largest ratio was sheet & plate & strip, followed by bar & road & profile and foil, with ratios of 47%, 28%, and 21%, respectively. In addition, there are two points to be recognized: (1) the ratio of exported tube & pipe remained below 5% in 2001, but increased to 16% in 2008; (2) the ratio of exported wire remained below 2% in 2001, but increased to 5.6% in 2006. Although the exported quantities of other aluminum products grew quickly in this period, the quantitative base is very small comparison with sheet & plate & strip, bar & road & profile and so on, so the ratios of them on the total exported quantity are also small. Moreover, the influence of the international financial crisis in 2008 on aluminum product export is obviously great, and the export structure has changed significantly.
The import and export situation of manufactured goods and scrap in mainland China in the period of 2001–2011 are displayed in Figure 8. The imported amount and exported amount of manufactured goods are increased at a speed of 5.2% and 23%, respectively. The exported amount is much more than the imported amount; consequently, the net import amount was negative. Combined with the trade situation of aluminum products, an essential condition can be found: China imported aluminum products but exported manufactured goods, and became an important manufacturing center during this period. This finding is consistent with Chen [10]. As for scrap, because of almost no export, the amount of net import is decided by import, and the average annual growth rate is 25%. The energy required for the separation and remelting of aluminum scrap to produce secondary aluminum might be only 5%–10% of that needed for primary aluminum [31,58], therefore substantial imported scrap not only relieves the pressure on the domestic environment in the course of producing primary aluminum, but also can satisfy the needs of China’s rapid industrialization and urbanization.

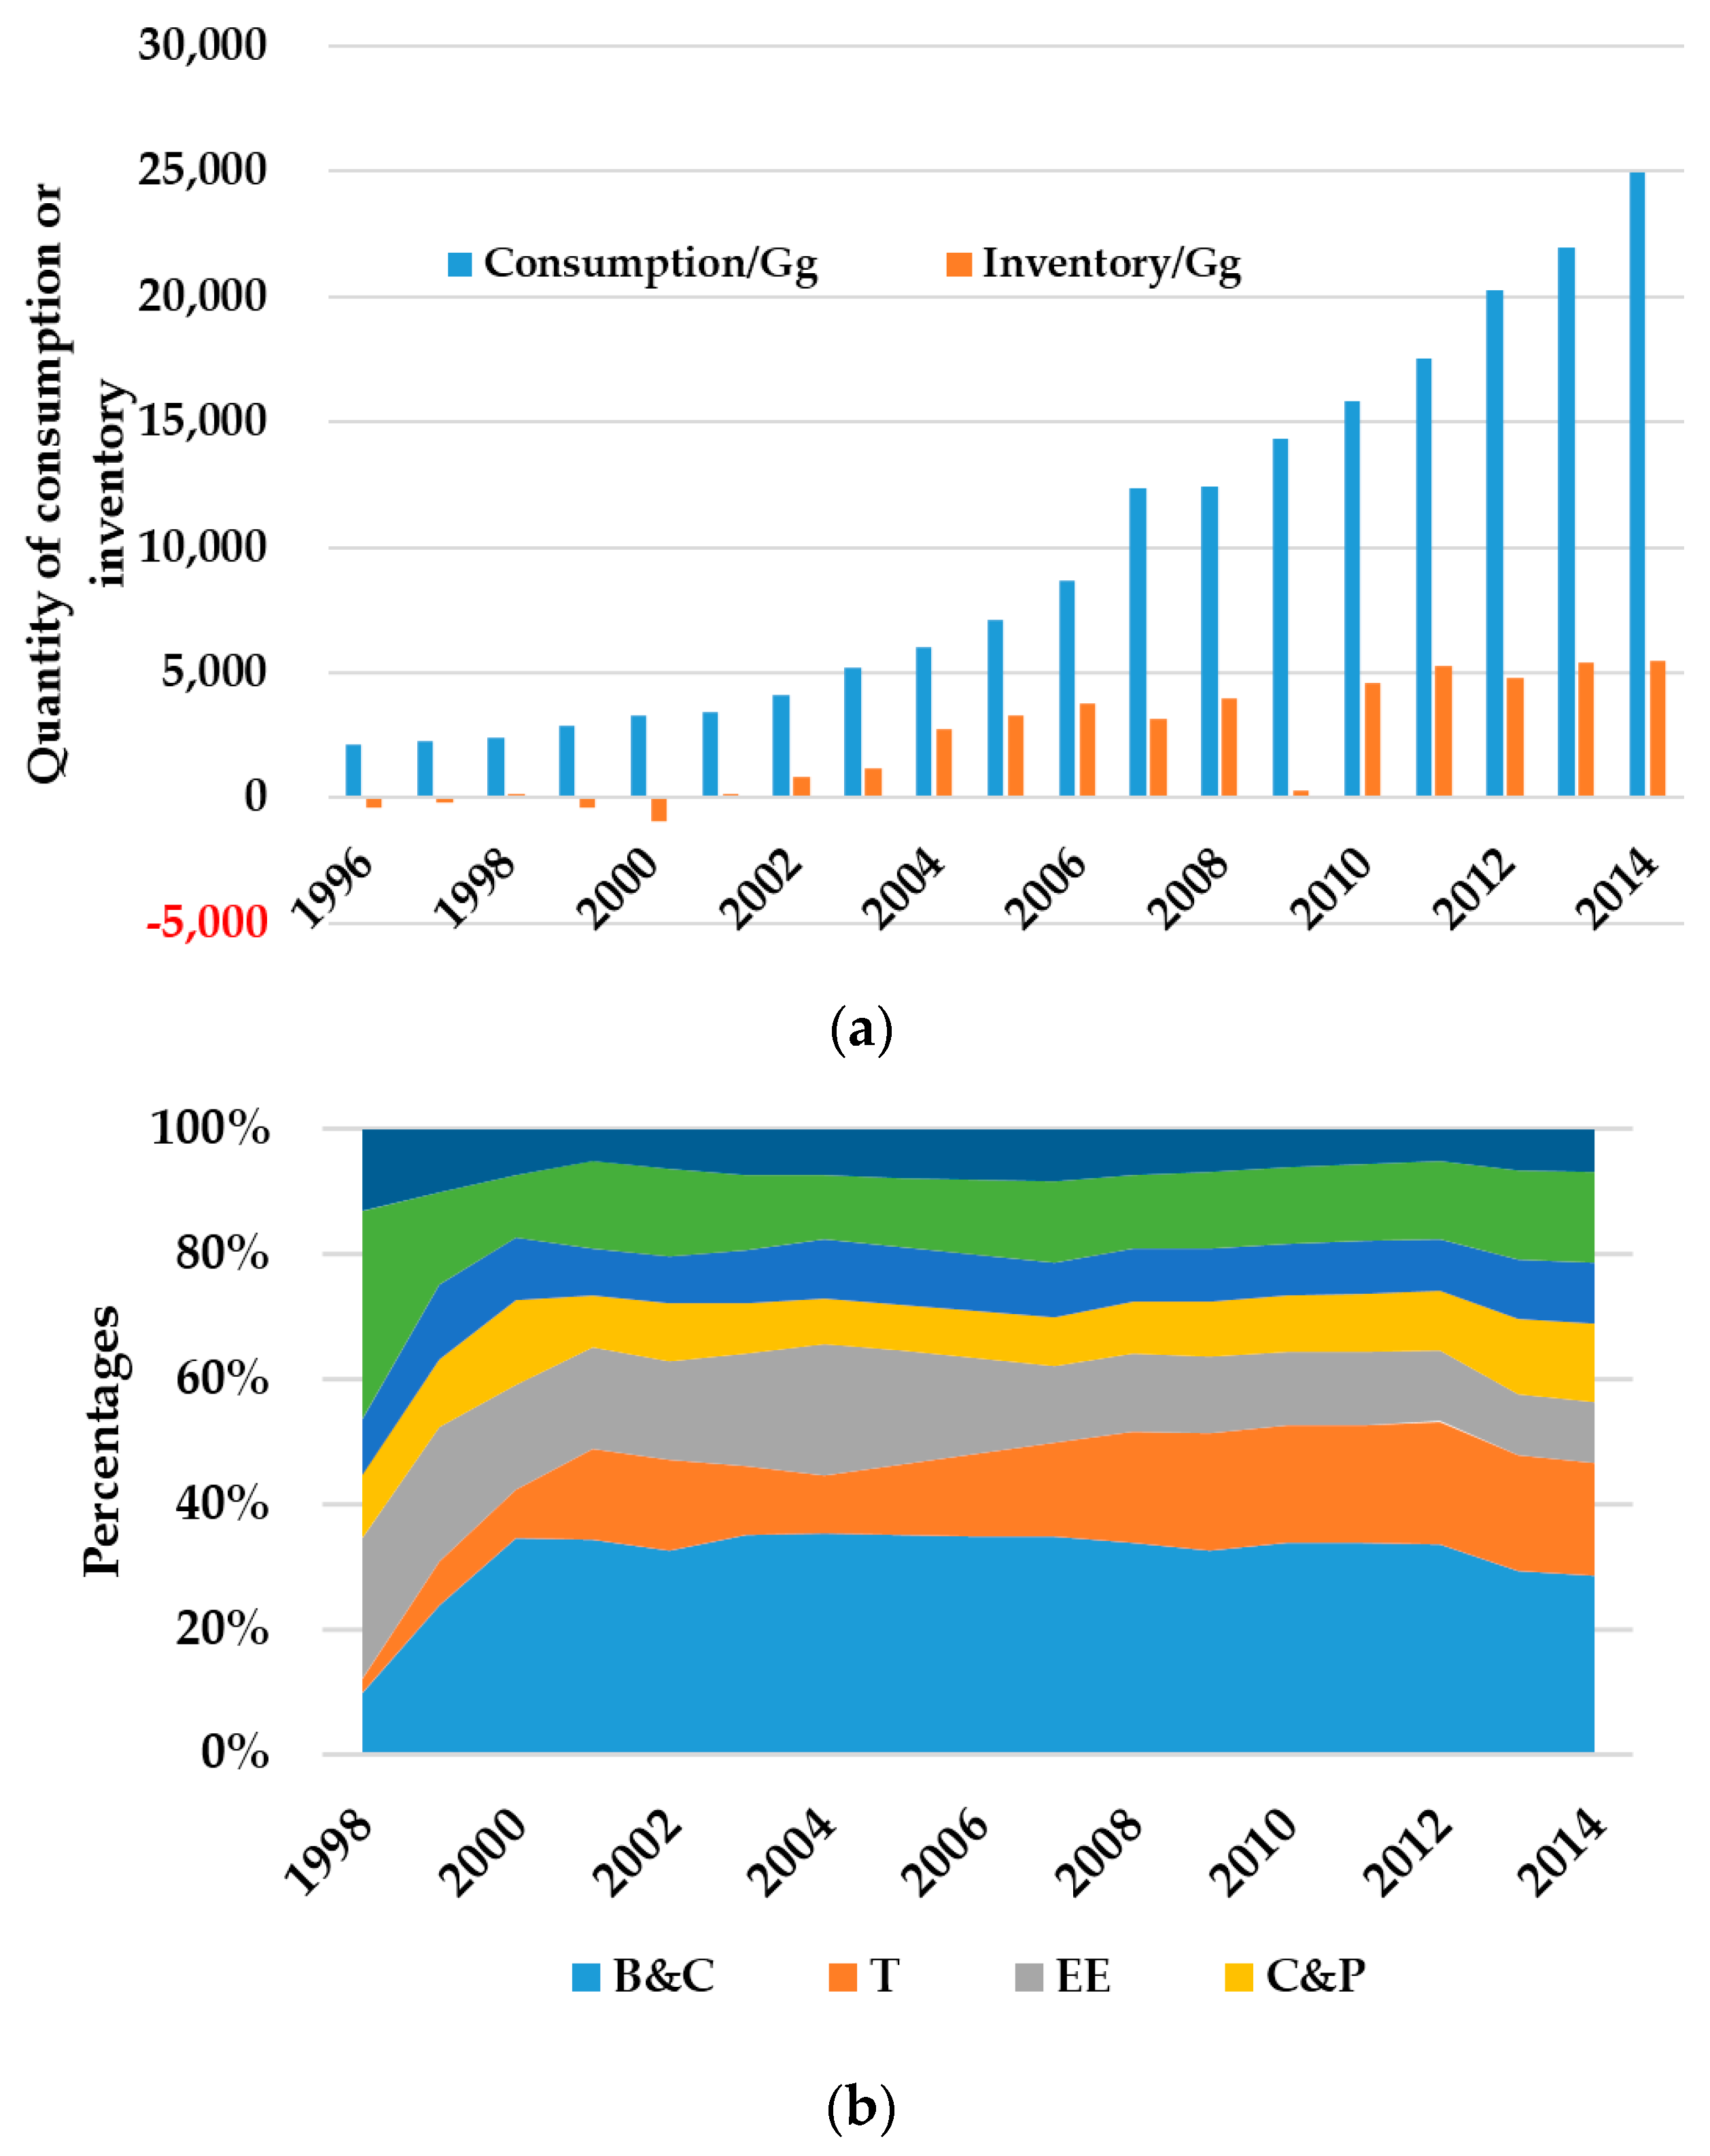
3.3. Domestic Consumption and Inventory

The domestic consumption of aluminum-containing products has been increasing quickly since 1996, except for 2008. The average annual growth rate is 16%, and that looks likely to increase in the coming years. At the same time, temporary inventory also grew quickly, except in 2009. Before the 21st century, there was hardly any inventory because of a situation where demand slightly exceeded supply. It has reached a stable level of 5000 Gg or so since 2010. A very small or even negative inventory implies that aluminum supply is difficult to feed domestic consumption, and relatively more inventory shows low consumption demand and weak economic development or market saturation. Accumulated aluminum inventory can be consumed for two years in the consumption level of 2014, so the de-stocking programs must be implemented as soon as possible.
Aluminum consumption composition is also experiencing some changes. As shown in Figure 9b, the distinct boundary of consumption composition change from 1998 to 2014 was in 2000. Before 2000, the largest consumption proportions were CD and EE; the fastest-growing segment was B&C, and the next was T; the fastest-reducing segment was CD, and the next was Others; the proportions of the other three categories did not change much. After 2000, the largest consumption proportions were B&C and T, and the shares of these seven categories were stable.
These appearances reflect the contemporary situation of the economy and society. In the 1990s, urbanization dove vigorous construction of infrastructure and public facilities: housing, roads, railways, electrical equipment, and so on. Because of the increase in living standards, household appliances entered into the homes of ordinary people and increased convenience. CD can continue to consume for a long time, so it is the fastest-reducing segment of aluminum-containing product consumption before 2000. In the 21st century, the consumption proportions of different kinds of aluminum-containing products are stable. The segments of B&C and T account for half the aluminum consumption, which denotes a higher standard of living.

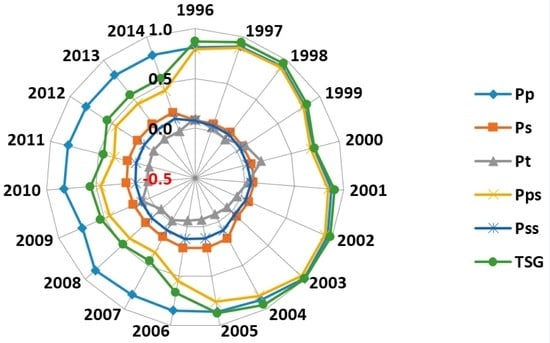
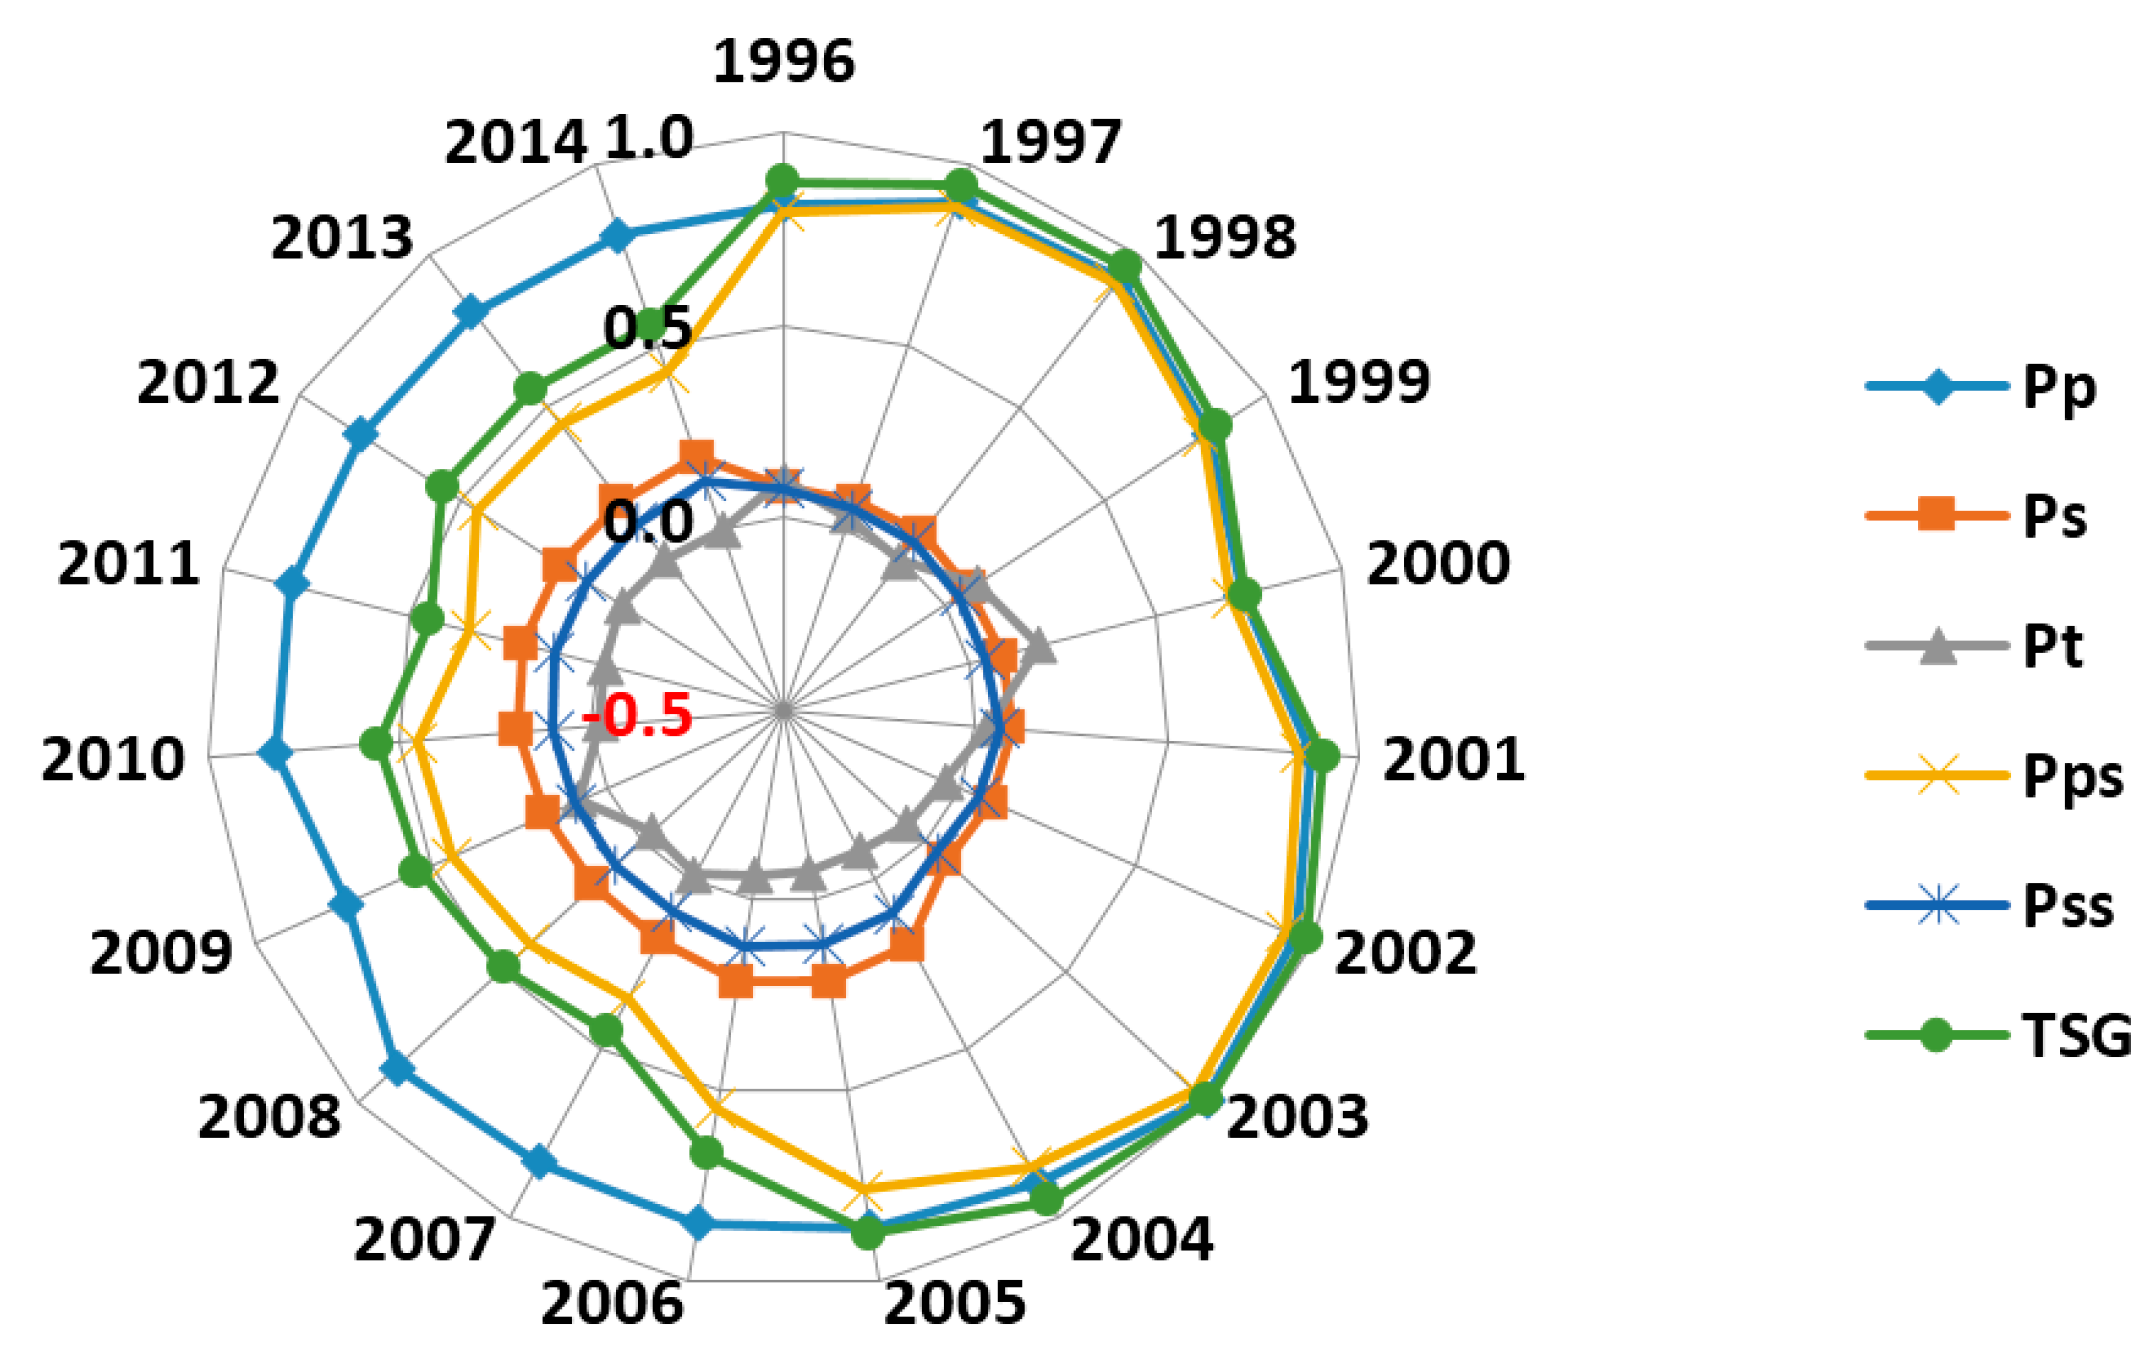
3.4. Supply Structure and Guarantee Degree

The ratio of domestic primary aluminum to the total amount (consumption and inventory) gradually increased and then declined in the period 1996–2014, and it has been 80% of the total after 2010. The primary aluminum produced domestically can satisfy domestic demand, especially in 1998, 2002, and 2003. However, almost half of the bauxite used to produce primary aluminum came from other countries after 2006, and the value has a tendency to increase. This drove the proportion of self-productive primary aluminum down until it reached a stable level at about 40% after 2007, but it was only approximately 34% in 2011. At present, international relationships are extremely complicated. If some countries cut off their bauxite supply, China would only produce half of the primary aluminum, and would not meet the needs of domestic production and construction. Moreover, importing substantial bauxite and then producing primary aluminum domestically could consume large amounts of energy and also bring about environmental pollution and ecological damage.
However, the proportion of domestic secondary aluminum went up slowly in this period and was about 20% after 2004. This is a favorable beginning from the perspective of circular economy and sustainable development because of less energy consumption, circular use of metals, and less ecological pollution in secondary aluminum production. Nevertheless, like bauxite, only half of the recycled scrap that are produced secondary aluminum is from China, which makes the self-supply ratios go down; they reached a stable level of about 10% after 2004.
The proportion of aluminum supply through trade has no obvious regular pattern and negative values occur. In general, the exported amount of unwrought aluminum was more than the imported amount, and China was an exporter except in 1996, 1999, 2000, and 2009. This means that domestic primary aluminum production can meet the domestic demand and even supply other countries. After 2010, cost-to-income of unwrought aluminum is on balance in trade, thus there is no significant effect on the total supply guarantee degree.
The line with dots (TSG) in Figure 10 shows the situation of total supply guarantee of self-productive aluminum, and the degrees gradually weakened: in 1996–1998, China’s aluminum industry was self-sufficient, but after 2006 the total supply guarantee degree of China’s aluminum resource was only about 50%, or 45% in 2007 and 2011. From the point of the whole supply chain, the upstream of China’s aluminum industry is in short supply, and the downstream of it can basically satisfy domestic needs. So resource constraint is a significant factor that will influence the sustainable development of China’s aluminum industry.

3.5. Main Results and Findings

The main results and findings are as follows. With respect to the domestic aluminum supply, the average annual growth rates of primary aluminum production, total aluminum products, and aluminum wire rods are 16%, 23.4%, and 28.3%, respectively. The most significant proportions of gross aluminum products were section, plate, and bar, but relatively small proportions were contributed by row, wire, and tube in 2014. The secondary aluminum industry in China shows a tendency of steady and rapid development due to the advanced concept of the circular economy and the sustainable development strategy. The proportions of secondary aluminum from new scrap and old scrap in 1996 were 44.5% and 55.5%, while that from new scrap gradually went up to 76.5% and that from old scrap dropped to 23.5% in 2014. With respect to trade, the quantities of imported or exported bauxite, alumina, and unwrought aluminum kept increasing in general, but the course is full of reversals and zigzags. In the meantime, China is an exporter of unwrought aluminum and an important manufacturing center, thus China should pursue the transformation of trade structure. The supply structure of China’s aluminum consumption in 1996 was: primary aluminum: 81.5%, secondary aluminum: 8.3%, and trade: 10.2%; in 2014, it was: primary aluminum: 80.6%, secondary aluminum: 19.6%, and trade: −0.2%. The supply structure of China’s aluminum basically consists of 80% primary aluminum and 20% secondary aluminum, but secondary aluminum has the potential to expand from the perspective of sustainable resource supply. In addition, with respect to the guarantee degree, this is because almost half of the bauxite and scrap needs to be imported; the proportions of self-productive primary and secondary aluminum in the supply structure decreased to 42.8% and 12.8%, respectively in 2014. So, in the end, the total supply guarantee degree of domestic aluminum resources went from 87.3% in 1996 to 55.6% in 2014. From the perspective of the whole supply chain, the upstream of China’s aluminum industry is in short supply, and the downstream products of it can basically satisfy domestic needs.

4. Analysis and Discussion

The research results showed that China will be in the middle and late stage of industrialization over the next 20 years and its aluminum consumption demand is expected to reach a peak in 2025 in the reference scenario [55,59]. That is to say, China’s aluminum demand will continue to increase in later 10 years from now. Furthermore, China’s aluminum consumption trajectory has characteristics of forward compared with other industrialized countries. This is because China actively adopted existing advanced science and technology to retain its rapid industrialization development mode. On the contrary, the aluminum resource supply of China presents a different scene: (1) Compared to the world, China’s bauxite reserves are poor and their quality is low; (2) the country’s external dependency is high and the sources of import are concentrated. For example, China’s imported bauxite was sourced from a total of 14 countries and regions in 2011; among these places, the main sources were countries such as Indonesia (80%), Australia (19%), India, and Malaysia [55]; (3) Aluminum resource supply is highly influenced by the policies of foreign countries. In early 2014, Indonesia issued export bans on bauxite aimed at China, and this led to fluctuations in China’s aluminum market. This implied that importing resources is not safe and reliable, and China must rely on its own efforts to overcome the uncertainty of the aluminum supply.
As illustrated in the supply structure, production of domestic primary and secondary aluminum can meet the consumption demand, and even create a surplus. However, about 50% of upstream raw materials rely on importing. Therefore, the total guarantee degree was only 55.6% in 2014. So, sustainable and safe supply of aluminum resource is a big challenge for China, a country undergoing rapid development. It is worth noting that the proportion of secondary aluminum increased quickly in the supply structure. Because of China’s rapid increase in aluminum in-use stocks in the last two decades, these aluminum stocks may become ground sources in the future. The recycled scrap generated from in-use stocks will become essential, and quantifying this tremendous potential has far-reaching significance for China.
Under the above analysis, there are some solutions to reduce the uncertainty of sustainable supply, and the advantages and disadvantages of these solutions are as follows. New technologies can be developed to try to refine alumina from other raw materials, and substitute goods are also feasible. These two solutions are not so effective at present because there are very few other raw materials that can be used and it will take a long time to seek for substitute materials. Furthermore, overseas investment is also important to reduce the uncertainty of aluminum supply, but now it is not so effective. Therefore, to optimize the aluminum supply structure and enhance the use ratio of secondary aluminum is an appropriate solution in the current situation. That is to say, recycling scrap from in-use stocks to produce secondary aluminum is a wise choice.
Theoretically, although the four improved methods of recycling scrap that Chen proposed cannot provide a good solution for determining the spatial distribution (at a resolution lower than that of countries) of in-use stocks [60], to combine these methods with some geological technologies such as remote sensing and geographical information system models will be feasible and can bring about additional benefits [61,62,63]. In practice, devoting greater efforts to recycling aluminum scrap to produce secondary aluminum to guarantee sustainable aluminum supply is a step in the right direction. To realize this goal, it is urgent to establish a complete recycling system for discarded metals as soon as possible. Of course, other recyclable items such as paper, plastic, wood, and so on can be recycled in the meantime. The Chinese government needs to invest much capital and issue a series of preferential policies at an early stage to reduce recycling costs and attract the active involvement of large numbers of enterprises and the public, and more attention should be paid to the sound environmental management of the recovery process.

5. Conclusions

Bauxite resources in China are inadequate and their grade is also low compared with that from elsewhere in the world. However, with the rapid development of domestic industrialization and urbanization, aluminum demand has increased dramatically in the last two decades. At present, in order to satisfy domestic demand, China must import substantial raw materials (bauxite and scrap) to produce aluminum. In addition, complicated international relationships mean that China will face supply risks if the export policies of certain countries change. How to guarantee the sustainability and safety of aluminum supply is a big challenge for China. This paper applied SFA to analyze the aluminum flows and overall situation of China’s aluminum industry from 1996 to 2014, and established a supply structure model to measure the guarantee degree in this period. The objective of this paper is to find a way to reduce the uncertainty in aluminum resource supply and guarantee its sustainable supply.
There are some conclusions following from this research. China’s aluminum production can satisfy its demand and even create a surplus. However, at a deeper level, upstream resource constraint is a significant factor that influences the sound development of China’s aluminum industry, and there are supply uncertainties and risks due to limited aluminum resources and complicated international relationships. So the import sources of bauxite should be diversified, and overseas investment in countries with rich bauxite ought to speed up the course. The other fundamental way is to enhance the proportion of secondary aluminum in the supply structure. China should devote greater efforts to establishing an efficient aluminum recycling system to ensure a sustainable supply.
However, related scenario analysis for stocks and the potential of aluminum remains a challenge. To gain further insight into this topic, it is vital to be certain about the spatial distribution of the existing infrastructures, calculate the lifetimes of varieties of aluminum-containing products accurately, and advance the technologies for efficient metal recycling. These points will be research highlights in the future.

Acknowledgments

This research was supported by funding from cultivating program of excellent innovation team of Chengdu University of Technology (KYTD201406), the resources environment strategy research team of Sichuan’s high level social science research team (2015–2017), the special funds of central finance support the development of local colleges and universities (2013–2015), project of Sichuan Mineral Resources Research Center (SCKCZY2016-ZD001), and Key Program of Sichuan Province Cyclic Economy Research Center (XHJJ-1601).

Author Contributions

Minxi Wang and Xin Li conceived and designed the experiments; Shaoli Liu collected data and information; Minxi Wang provided methods and processed data; Xin Li analyzed the data; Shaoli Liu wrote the paper.

Conflicts of Interest

The authors declare no conflict of interest.

References

  1. Malthus, T.R.; Chen, Z.Z.; Ou, Y.P.; Long, X.B.; Lv, R. Books Which Have Influenced the History of the World: An Essay on the Principle of Population (Translation in Chinese); Shanxi People’s Publishing House: Taiyuan, China, 2013. [Google Scholar]
  2. Ricardo, D.; Guo, D.L.; Wang, Y.N. On the Principles of Political Economy and Taxation; Beijing United Publishing Co., Ltd.: Beijing, China, 2013. [Google Scholar]
  3. Mill, J.S.; Jin, Z.; Jin, Y. Principles of Political Economics; Huaxia Publishing House: Beijing, China, 2013. [Google Scholar]
  4. Sverdlin, A. Introduction to aluminum. In Handbook of Aluminum; Totten, G.E., MacKenzie, D.S., Eds.; Marcel Dekker, Inc.: New York, NY, USA, 2003; Volume 1, pp. 1–31. [Google Scholar]
  5. U.S. Geological Survey: Aluminum Statistics and Information. 2016. Available online: http://minerals.usgs.gov/minerals/pubs/commodity/aluminum/ (accessed on 4 May 2016).
  6. Halvor, K. The aluminum smelting process. J. Occup. Environ. Med. 2014, 56, S2–S4. [Google Scholar]
  7. Luca, C.; Chen, W.Q.; Fabrizio, P. Historical evolution of anthropogenic aluminum stocks and flows in Italy. Resour. Conserv. Recycl. 2013, 72, 1–8. [Google Scholar]
  8. Chen, W.Q.; Shi, L.; Chang, X.Y.; Qian, Y. Substance flow analysis of aluminum in China for 1991–2007 (Ι): Trade of aluminum from a perspective of life cycle and its policy implications. Resour. Sci. 2009, 31, 1887–1897. [Google Scholar]
  9. Chen, W.Q.; Shi, L.; Qian, Y. Substance flow analysis of aluminum in mainland China for 2001, 2004 and 2007: Exploring its initial sources, eventual sinks and the pathways linking them. Resour. Conserv. Recycl. 2010, 54, 557–570. [Google Scholar] [CrossRef]
  10. Chen, W.Q.; Shi, L. Analysis of aluminum stocks and flows in mainland China from 1950 to 2009: Exploring the dynamics driving the rapid increase in China’s aluminum production. Resour. Conserv. Recycl. 2012, 65, 18–28. [Google Scholar] [CrossRef]
  11. Gu, S.Q.; Zhu, J.Y.; Yin, Z.L. Study on strategy of China’s aluminum resources sustainable development. In Research Group of China’s Sustainable Development Strategy of Mineral Resources. Study on China’s Sustainable Development Strategy of Mineral Resources: Nonferrous Metals Volume; Science Press: Beijing, China, 2006. [Google Scholar]
  12. Chen, W.Q.; Shi, L.; Qian, Y. Description of anthropogenic aluminum cycles. Resour. Sci. 2008, 30, 1004–1012. [Google Scholar]
  13. Liu, G.; Bangs, C.E.; Müller, D.B. Unearthing potentials for decarbonizing the US aluminum cycle. Environ. Sci. Technol. 2011, 45, 9515–9522. [Google Scholar] [CrossRef] [PubMed]
  14. Liu, G.; Müller, D.B. Addressing sustainability in the aluminum industry: A critical review of life cycle assessments. J. Clean. Prod. 2012, 35, 108–117. [Google Scholar] [CrossRef]
  15. Chen, W.Q.; Wan, H.Y.; Wu, J.N.; Shi, L. Life cycle assessment of aluminum and the environmental impacts of aluminum industry. Light Met. 2009, 5, 3–10. [Google Scholar]
  16. Tilton, J.E.; Lagos, G. Assessing the long-term availability of copper. Resour. Policy 2007, 32, 19–23. [Google Scholar] [CrossRef]
  17. Lu, A.L.; Sun, Z.W.; Zhang, H. Availability analysis of copper resource in China. Resour. Ind. 2010, 12, 12–16. [Google Scholar]
  18. Yang, B. Analysis and discussion on dependency of overseas market and supply of China non-ferrous metals resources. Miner. Explor. 2013, 4, 8–11. [Google Scholar]
  19. Rosenau-Tornow, D.; Buchholz, P.; Riemann, A.; Wagner, M. Assessing the long-term supply risks for mineral raw materials—A combined evaluation of past and future trends. Resour. Policy 2009, 34, 161–175. [Google Scholar] [CrossRef]
  20. Achzet, B.; Helbig, C. How to evaluate raw material supply risks—An overview. Resour. Policy 2013, 38, 435–447. [Google Scholar] [CrossRef]
  21. Wang, X.B.; Lei, Y.L.; Ge, J.P.; Wu, S.M. Production forecast of China’s rare earths based on the Generalized Weng model and policy recommendations. Resour. Policy 2015, 43, 11–18. [Google Scholar] [CrossRef]
  22. Wang, G.S.; Han, M. The prediction of the demand on important mineral resources in China. Acta Geosci. Sin. 2002, 23, 483–490. [Google Scholar]
  23. Xue, Y.Z. Forecast of aluminum consumption based on GM (1, n) model. Met. Mine 2012, 11, 14–18. [Google Scholar]
  24. Brunner, P.H.; Rechberger, H. Practical Handbook of Material Flow Analysis; Lewis Publishers: Boca Raton, FL, USA, 2004. [Google Scholar]
  25. Baccini, P.; Brunner, P.H. Metabolism of the Antroposphere; Spinger: Berlin, Germany, 1991. [Google Scholar]
  26. Wang, T.; Müller, D.B.; Graedel, T.E. Forging the anthropogenic iron cycle. Environ. Sci. Technol. 2007, 41, 5120–5129. [Google Scholar] [CrossRef] [PubMed]
  27. Zhao, H.C.; Zhang, L.N. Material flow analysis about China aluminum production: Based on data from China’s aluminum industry in 2010. J. North Chin. Univ. Technol. 2014, 26, 1–8. [Google Scholar]
  28. Chen, W.Q.; Shi, L.; Qian, Y. Aluminum substance flow analysis for mainland China in 2005. Resour. Sci. 2008, 30, 1320–1326. [Google Scholar]
  29. Chen, W.Q.; Graedel, T.E. Dynamic analysis of aluminum stocks and flows in the United States: 1900–2009. Ecol. Econ. 2012, 81, 92–102. [Google Scholar] [CrossRef]
  30. Buchner, H.; Laner, D.; Rechberger, H.; Fellner, J. In-depth analysis of aluminum flows in Austria as a basis to increase resource efficiency. Resour. Conserv. Recycl. 2014, 93, 112–123. [Google Scholar] [CrossRef]
  31. Melo, M.T. Statistical analysis of metal scrap generation: The case of aluminum in Germany. Resour. Conserv. Recycl. 1999, 26, 91–113. [Google Scholar] [CrossRef]
  32. Boin, U.M.J.; Bertram, M. Melting standardized aluminum scrap: A mass balance model for Europe. J. Metals 2005, 57, 26–33. [Google Scholar] [CrossRef]
  33. Hatayama, H.; Yamada, H.; Daigo, I.; Matsuno, Y.; Adachi, Y. Dynamic substance flow analysis of aluminum and its alloying elements. Mater. Trans. 2007, 48, 2518–2524. [Google Scholar] [CrossRef]
  34. Dhalström, K.; Ekins, P. Combining economic and environmental dimensions: Value chain analysis of UK aluminum flows. Resour. Conserv. Recycl. 2007, 51, 541–560. [Google Scholar] [CrossRef]
  35. Graedel, T.E.; Bertram, M.; Fuse, K.; Gordon, R.B.; Lifset, R.; Rechberger, H.; Spatari, S. The contemporary European copper cycle: The characterization of technological copper cycles. Ecol. Econ. 2002, 42, 9–26. [Google Scholar] [CrossRef]
  36. Spatari, S.; Bertram, M.; Fuse, K.; Graedel, T.E.; Rechberger, H. The contemporary European copper cycle: 1 year stocks and flows. Ecol. Econ. 2002, 42, 27–42. [Google Scholar] [CrossRef]
  37. Bertram, M.; Graedel, T.E.; Rechberger, H.; Spatari, S. The contemporary European copper cycle: Waste management subsystem. Ecol. Econ. 2002, 42, 43–57. [Google Scholar] [CrossRef]
  38. Rechberger, H.; Graedel, T.E. The contemporary European copper cycle: Statistical entropy analysis. Ecol. Econ. 2002, 42, 59–72. [Google Scholar] [CrossRef]
  39. Reck, B.R.; Bertram, M.; Müller, D.B.; Graedel, T.E. Multilevel anthropogenic cycles of copper and zinc: A comparative statistical analysis. J. Ind. Ecol. 2006, 10, 89–110. [Google Scholar] [CrossRef]
  40. Daigo, I.; Hashimoto, S.; Matsuno, Y.; Adachi, Y. Material stocks and flows accounting for copper and copper-based alloys in Japan. Resour. Conserv. Recycl. 2009, 53, 208–217. [Google Scholar] [CrossRef]
  41. Reck, B.R.; Müller, D.B.; Rostkowski, K.; Graedel, T.E. Anthropogenic nickel cycle: Insights into use, trade, and recycling. Environ. Sci. Technol. 2008, 42, 3394–3400. [Google Scholar] [CrossRef] [PubMed]
  42. Graedel, T.E.; van Beers, D.; Bertram, M.; Fuse, K.; Gordon, R.B. The multilevel cycle of anthropogenic zinc. J. Ind. Ecol. 2005, 9, 67–90. [Google Scholar] [CrossRef]
  43. Guo, X.Y.; Zhong, J.Y.; Song, Y.; Tian, Q.H. Substance flow analysis of zinc in China. Resour. Conserv. Recycl. 2010, 54, 171–177. [Google Scholar] [CrossRef]
  44. Mao, J.S.; Dong, J.; Graedel, T.E. The multilevel cycle of anthropogenic lead I. Methodology. Resour. Conserv. Recycl. 2008, 52, 1058–1064. [Google Scholar] [CrossRef]
  45. Mao, J.S.; Dong, J.; Graedel, T.E. The multilevel cycle of anthropogenic lead II. Recults and Discussion. Resour. Conserv. Recycl. 2008, 52, 1050–1057. [Google Scholar] [CrossRef]
  46. Johason, J.; Jirikowic, J.; Bertram, M.; van Beers, D.; Gordon, R.B. Contemporary anthropogenic silver cycle: A multilevel analysis. Environ. Sci. Technol. 2005, 39, 4655–4665. [Google Scholar] [CrossRef]
  47. Liu, Y.; Chen, J.N. Substance flow analysis of phosphorus cycle system in China. Chin. Environ. Sci. 2006, 26, 238–242. [Google Scholar]
  48. Liu, Y.; Chen, J.N. Substance flow analysis on phosphorus cycle in Dianchi basin, China. Environ. Sci. 2006, 27, 1549–1553. [Google Scholar]
  49. Hoyle, G. Recycling opportunities in the UK for aluminum-bodied motor cars. Resour. Conserv. Recycl. 1995, 15, 181–191. [Google Scholar] [CrossRef]
  50. Gesing, A.; Wolanski, R. Recycling light metals from end-of-life vehicle. JOM 2001, 53, 21–23. [Google Scholar] [CrossRef]
  51. Müller, D.B. Stock dynamics for forecasting material flows-case study for housing in the Netherland. Ecol. Econ. 2006, 59, 142–156. [Google Scholar] [CrossRef]
  52. Modaresi, R.; Müller, D.B. The role of automobiles for the future of aluminum recycling. Environ. Sci. Technol. 2012, 46, 8587–8594. [Google Scholar] [CrossRef] [PubMed]
  53. Gu, Y.F.; Wu, Y.F.; Xu, M.; Mu, X.Z.; Zuo, T.Y. Waste electrical and electronic equipment (WEEE) recycling for a sustainable resource supply in the electronics industry in China. J. Clean. Prod. 2016, 127, 331–338. [Google Scholar] [CrossRef]
  54. Gu, Y.F.; Wu, Y.F.; Xu, M.; Wang, H.D.; Zuo, T.Y. The stability and profitability of the informal WEEE collector in developing countries: A case study of China. Resour. Conserv. Recycl. 2016, 107, 18–26. [Google Scholar] [CrossRef]
  55. Cheng, C.Y. Study on the Development Strategies of China’s Aluminum Industry from the Background of Economic Transition. Master’s Thesis, China University of Geosciences, Beijing, China, 28 May 2013. [Google Scholar]
  56. World Bureau of Metal Statistics: World Bureau Metals Database. Available online: http://www.world-bureau.co.uk/index.html (accessed on 7 December 2016).
  57. China Nonferrous Metals Industry Association. China Nonferrous Metals Industry Yearbook 1997–2015; China Nonferrous Metals Industry Yearbook Press: Beijing, China.
  58. Quinkertz, R.; Rombach, G.; Liebig, D. A scenario to optimise the energy demand of aluminum production depending on the recycling quota. Resour. Conserv. Recycl. 2001, 33, 217–234. [Google Scholar] [CrossRef]
  59. Qiu, Z.S. The Chinese Primary Aluminum Consumption Analysis and Future Consumption Demand Forecasting. Master’s Thesis, Yunnan University, Kunming, China, 19 November 2010. [Google Scholar]
  60. Chen, W.Q.; Graedel, T.E. Improved alternatives for estimating in-use material stocks. Environ. Sci. Technol. 2015, 49, 3048–3055. [Google Scholar] [CrossRef] [PubMed]
  61. Rauch, J.N. Global mapping of Al, Cu, Fe, and Zn in-use stocks and in-ground resources. Proc. Natl. Acad. Sci. USA 2009, 106, 18920–18925. [Google Scholar] [CrossRef] [PubMed]
  62. Takahashi, K.I.; Terakado, R.; Nakamura, J.; Adachi, Y.; Elvidge, C.D.; Matsuno, Y. In-use stock analysis using satellite nighttime light observation data. Resour. Conserv. Recycl. 2010, 55, 196–200. [Google Scholar] [CrossRef]
  63. Hattori, R.; Horie, S.; Hsu, F.C.; Elvidge, C.D.; Matsuno, Y. Estimation of in-use steel stock for civil engineering and building using nighttime light images. Resour. Conserv. Recycl. 2013. [Google Scholar] [CrossRef]
Figure 1. System boundary of the whole aluminum life cycle.
Sustainability 08 01335 g001
Figure 2. Research model of aluminum supply structure.
Sustainability 08 01335 g002
Figure 3. The supply situation of domestic aluminum from 1996 to 2014 (data sources: WBMS [56] and China Nonferrous Metals Industry Yearbook [57]).
Sustainability 08 01335 g003
Figure 4. The supply structure of domestic aluminum products from 1998 to 2014 (data source: China Nonferrous Metals Industry Yearbook [57]).
Sustainability 08 01335 g004
Figure 5. The supply situation and structure of secondary aluminum from 1996 to 2014. “S from new scrap” represents secondary aluminum from remelted new scrap; similarly, “S from old scrap” represents secondary aluminum from remelted old scrap (data source: WBMS [56]).
Sustainability 08 01335 g005
Figure 6. The trade situation of bauxite, alumina, and unwrought aluminum from 1996 to 2014. The bar expresses quantities of imports and exports; the broken line expresses net quantities; and “U net export” represents the quantity of net exported unwrought aluminum (data sources: WBMS [56] and China Nonferrous Metals Industry Yearbook [57]).
Sustainability 08 01335 g006
Figure 7. The trade quantity and structure of aluminum products from 2001 to 2011. (a) Imported quantity and structure; (b) exported quantity and structure (data source: China Nonferrous Metals Industry Yearbook [57]).
Sustainability 08 01335 g007
Figure 8. The trade situation of manufactured goods and scrap from 2001 to 2011 (data source: China Nonferrous Metals Industry Yearbook [57]).
Sustainability 08 01335 g008
Figure 9. (a) Quantities of consumption and inventory from 1996 to 2014; (b) consumption composition varying from 1998 to 2014. B&C: Building and Construction; T: Transportation; EE: Electrical Engineering; C&P: Containers and Packaging; M&E: Machinery and Equipment; CD: Consumer Durables (data source: Research Center for Strategy of Global Mineral Resources, Chinese Academy of Geological Science).
Sustainability 08 01335 g009
Figure 10. The supply structure and guarantee degree of China’s aluminum from 1996 to 2014.
Sustainability 08 01335 g010

