
Wave Energy Assessment and Performance Estimation of State of the Art Wave Energy Converters in Italian Hotspots


Abstract
:1. Introduction
2. Review of the Current State of the Research Field
2.1. Assessment of the Offshore Potential
2.2. Assessment of the Nearshore Potential
2.3. Performance Assessment of Wav Energy Converters
3. Materials and Methods
3.1. Assessment of the Offshore Potential
3.2. Assessment of the Nearshore Potential and Hotspots Identification
3.3. Performance Assessment of Wave Energy Converters
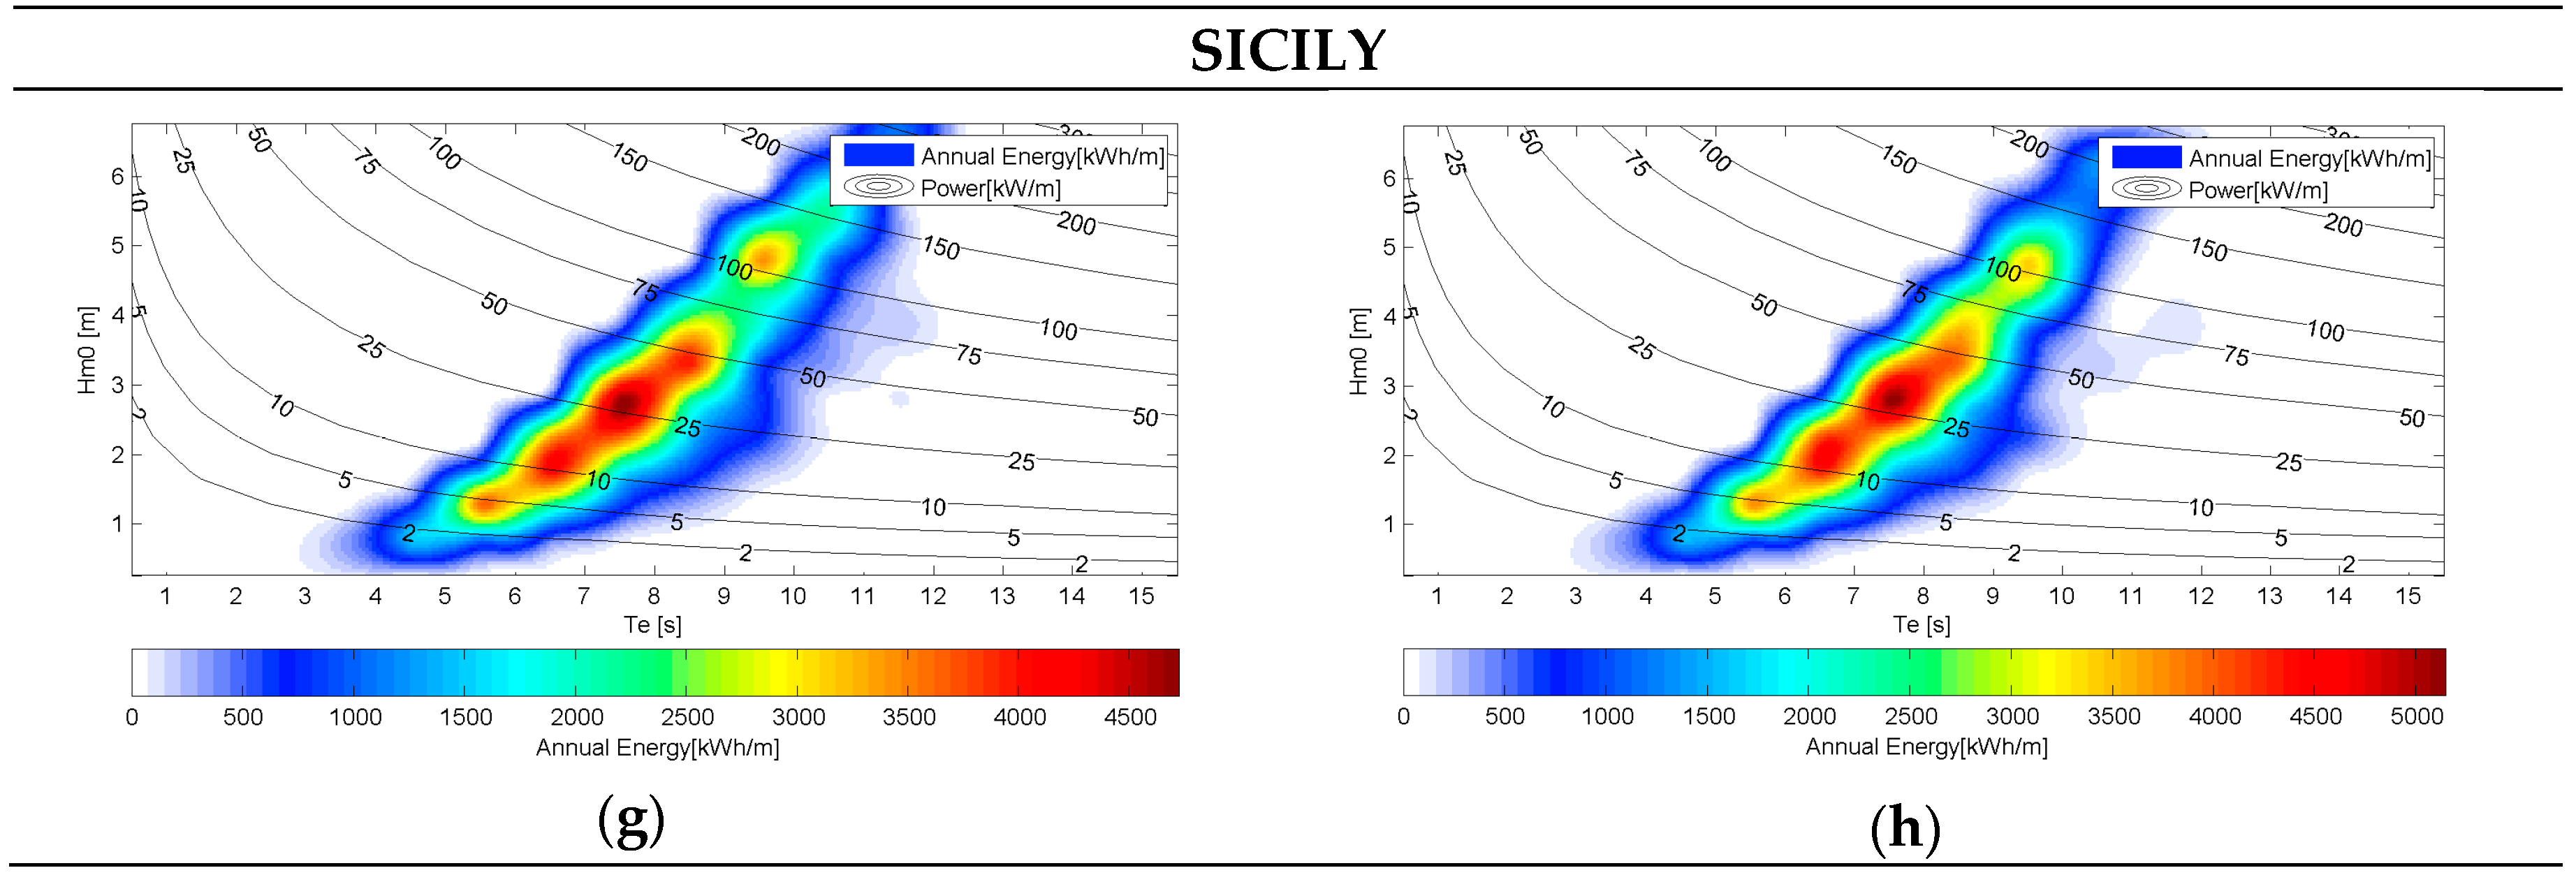
4. Wave Energy Assessments
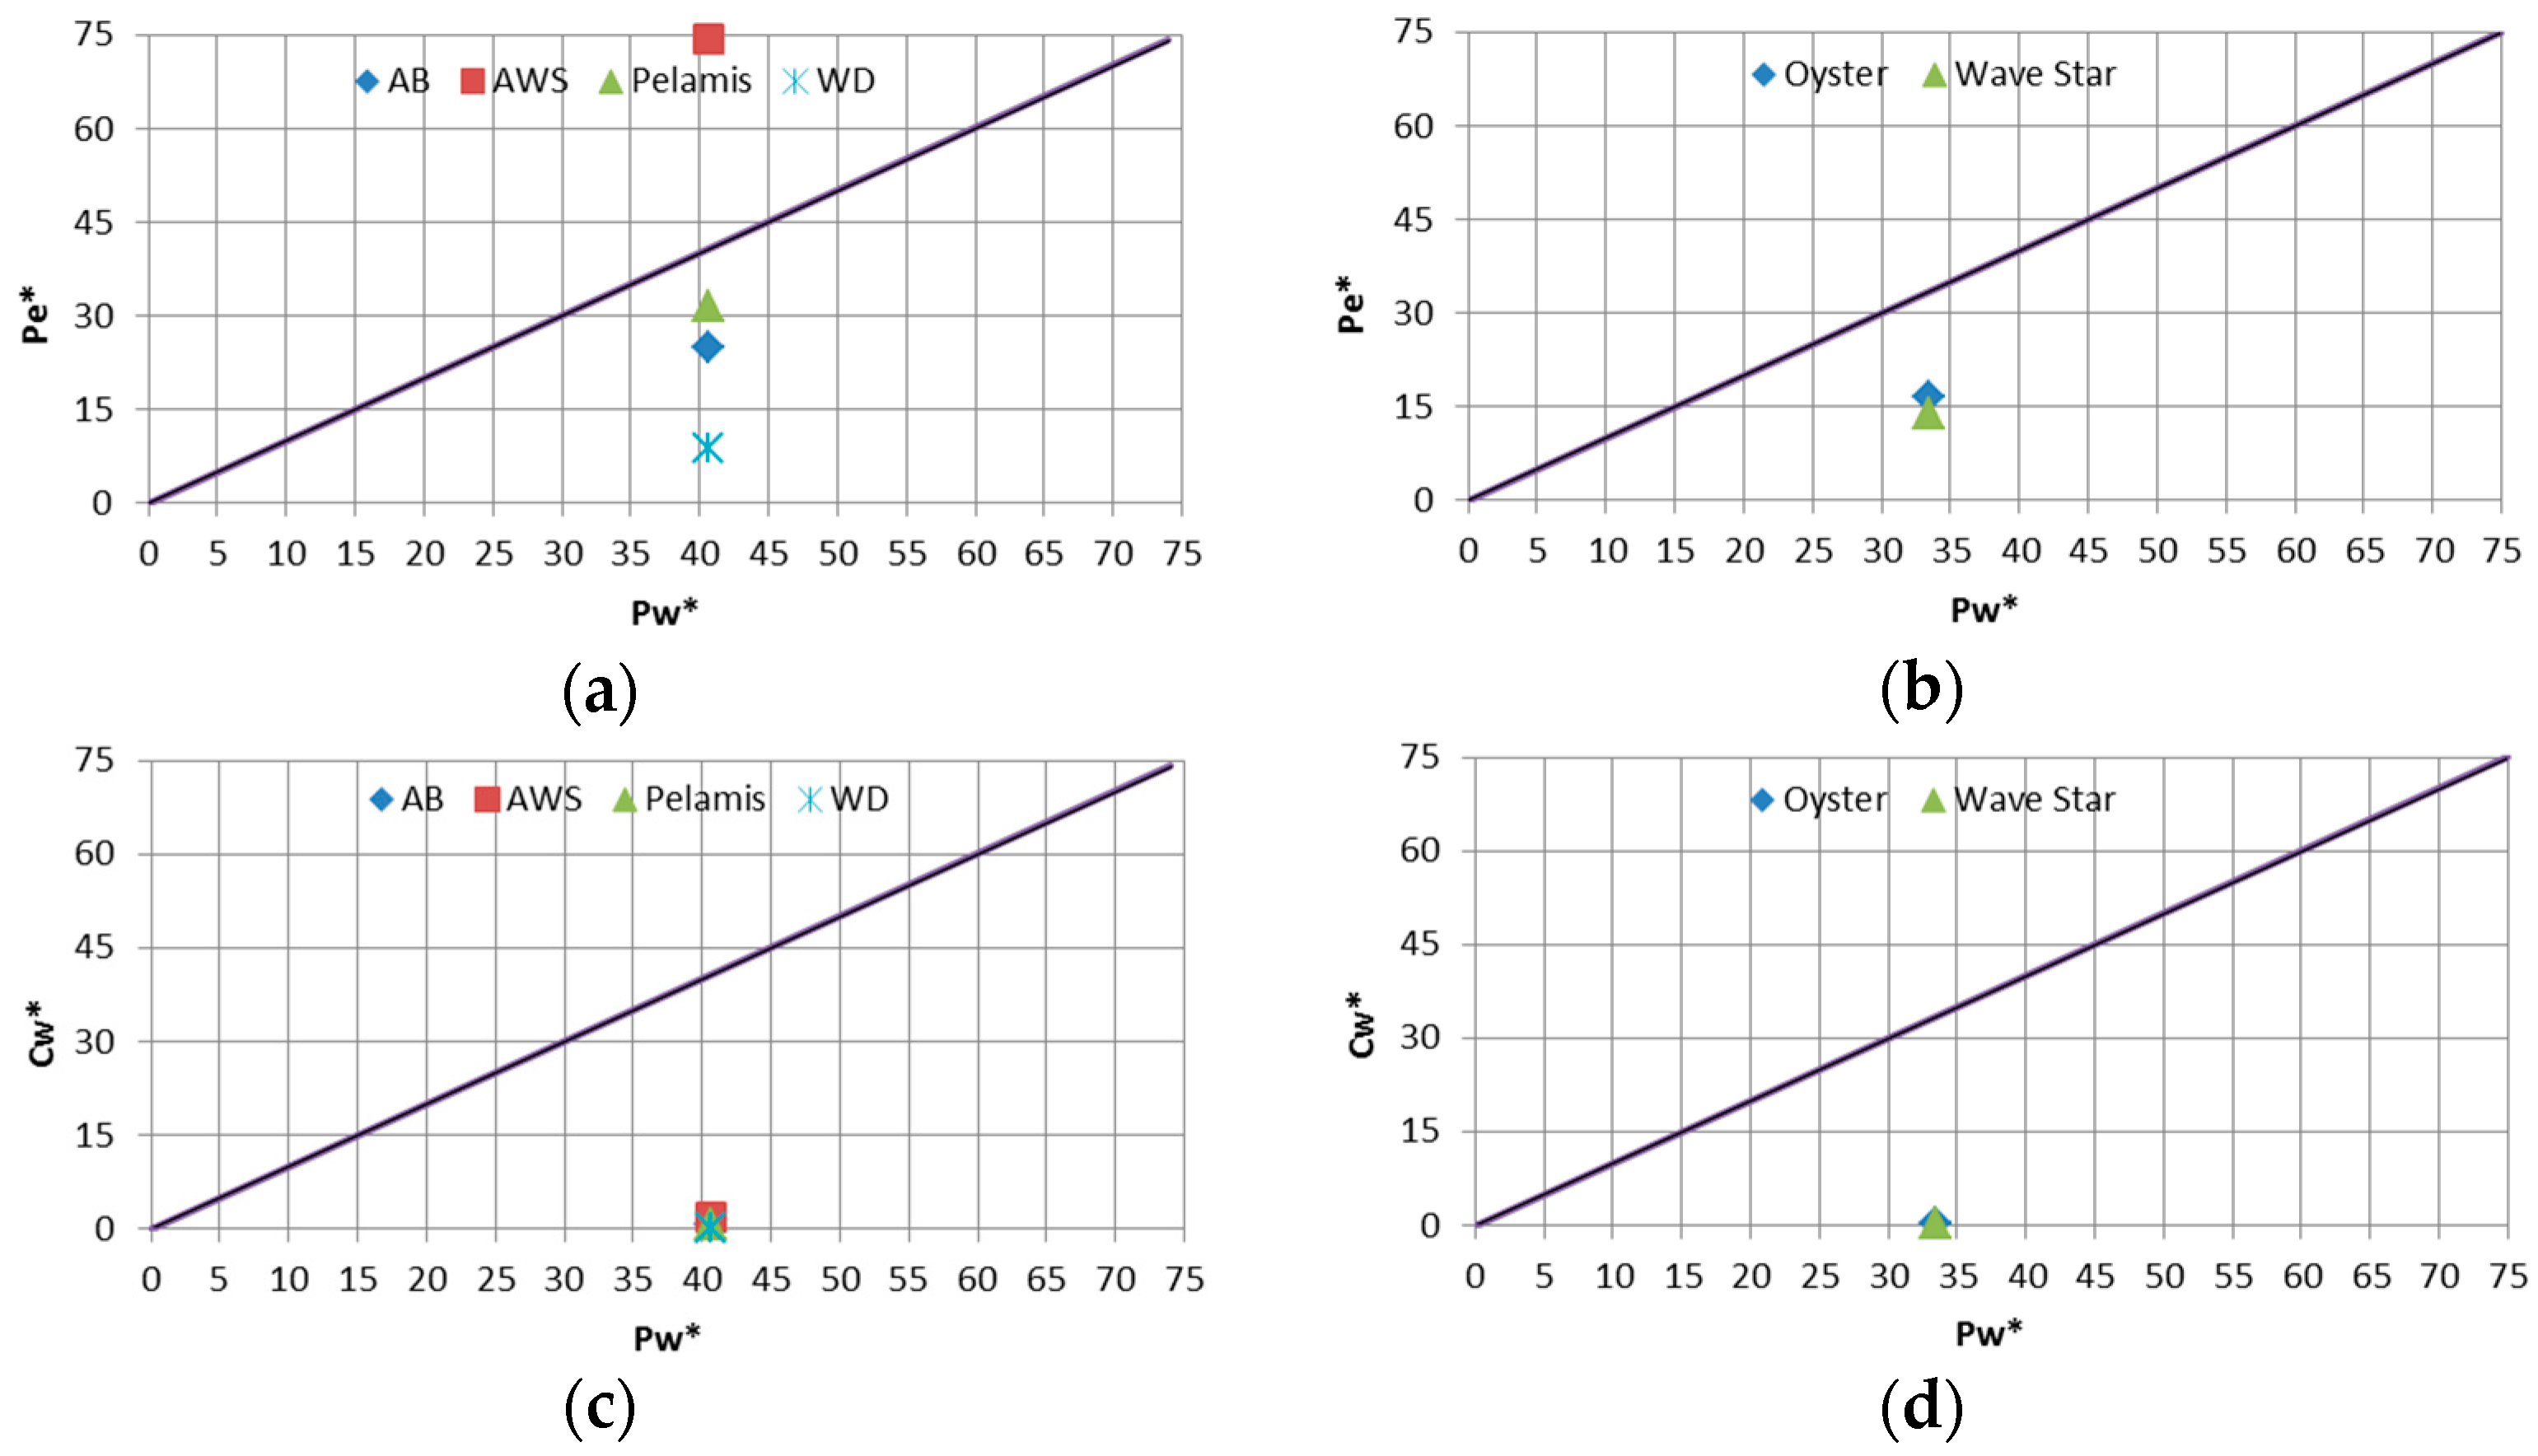
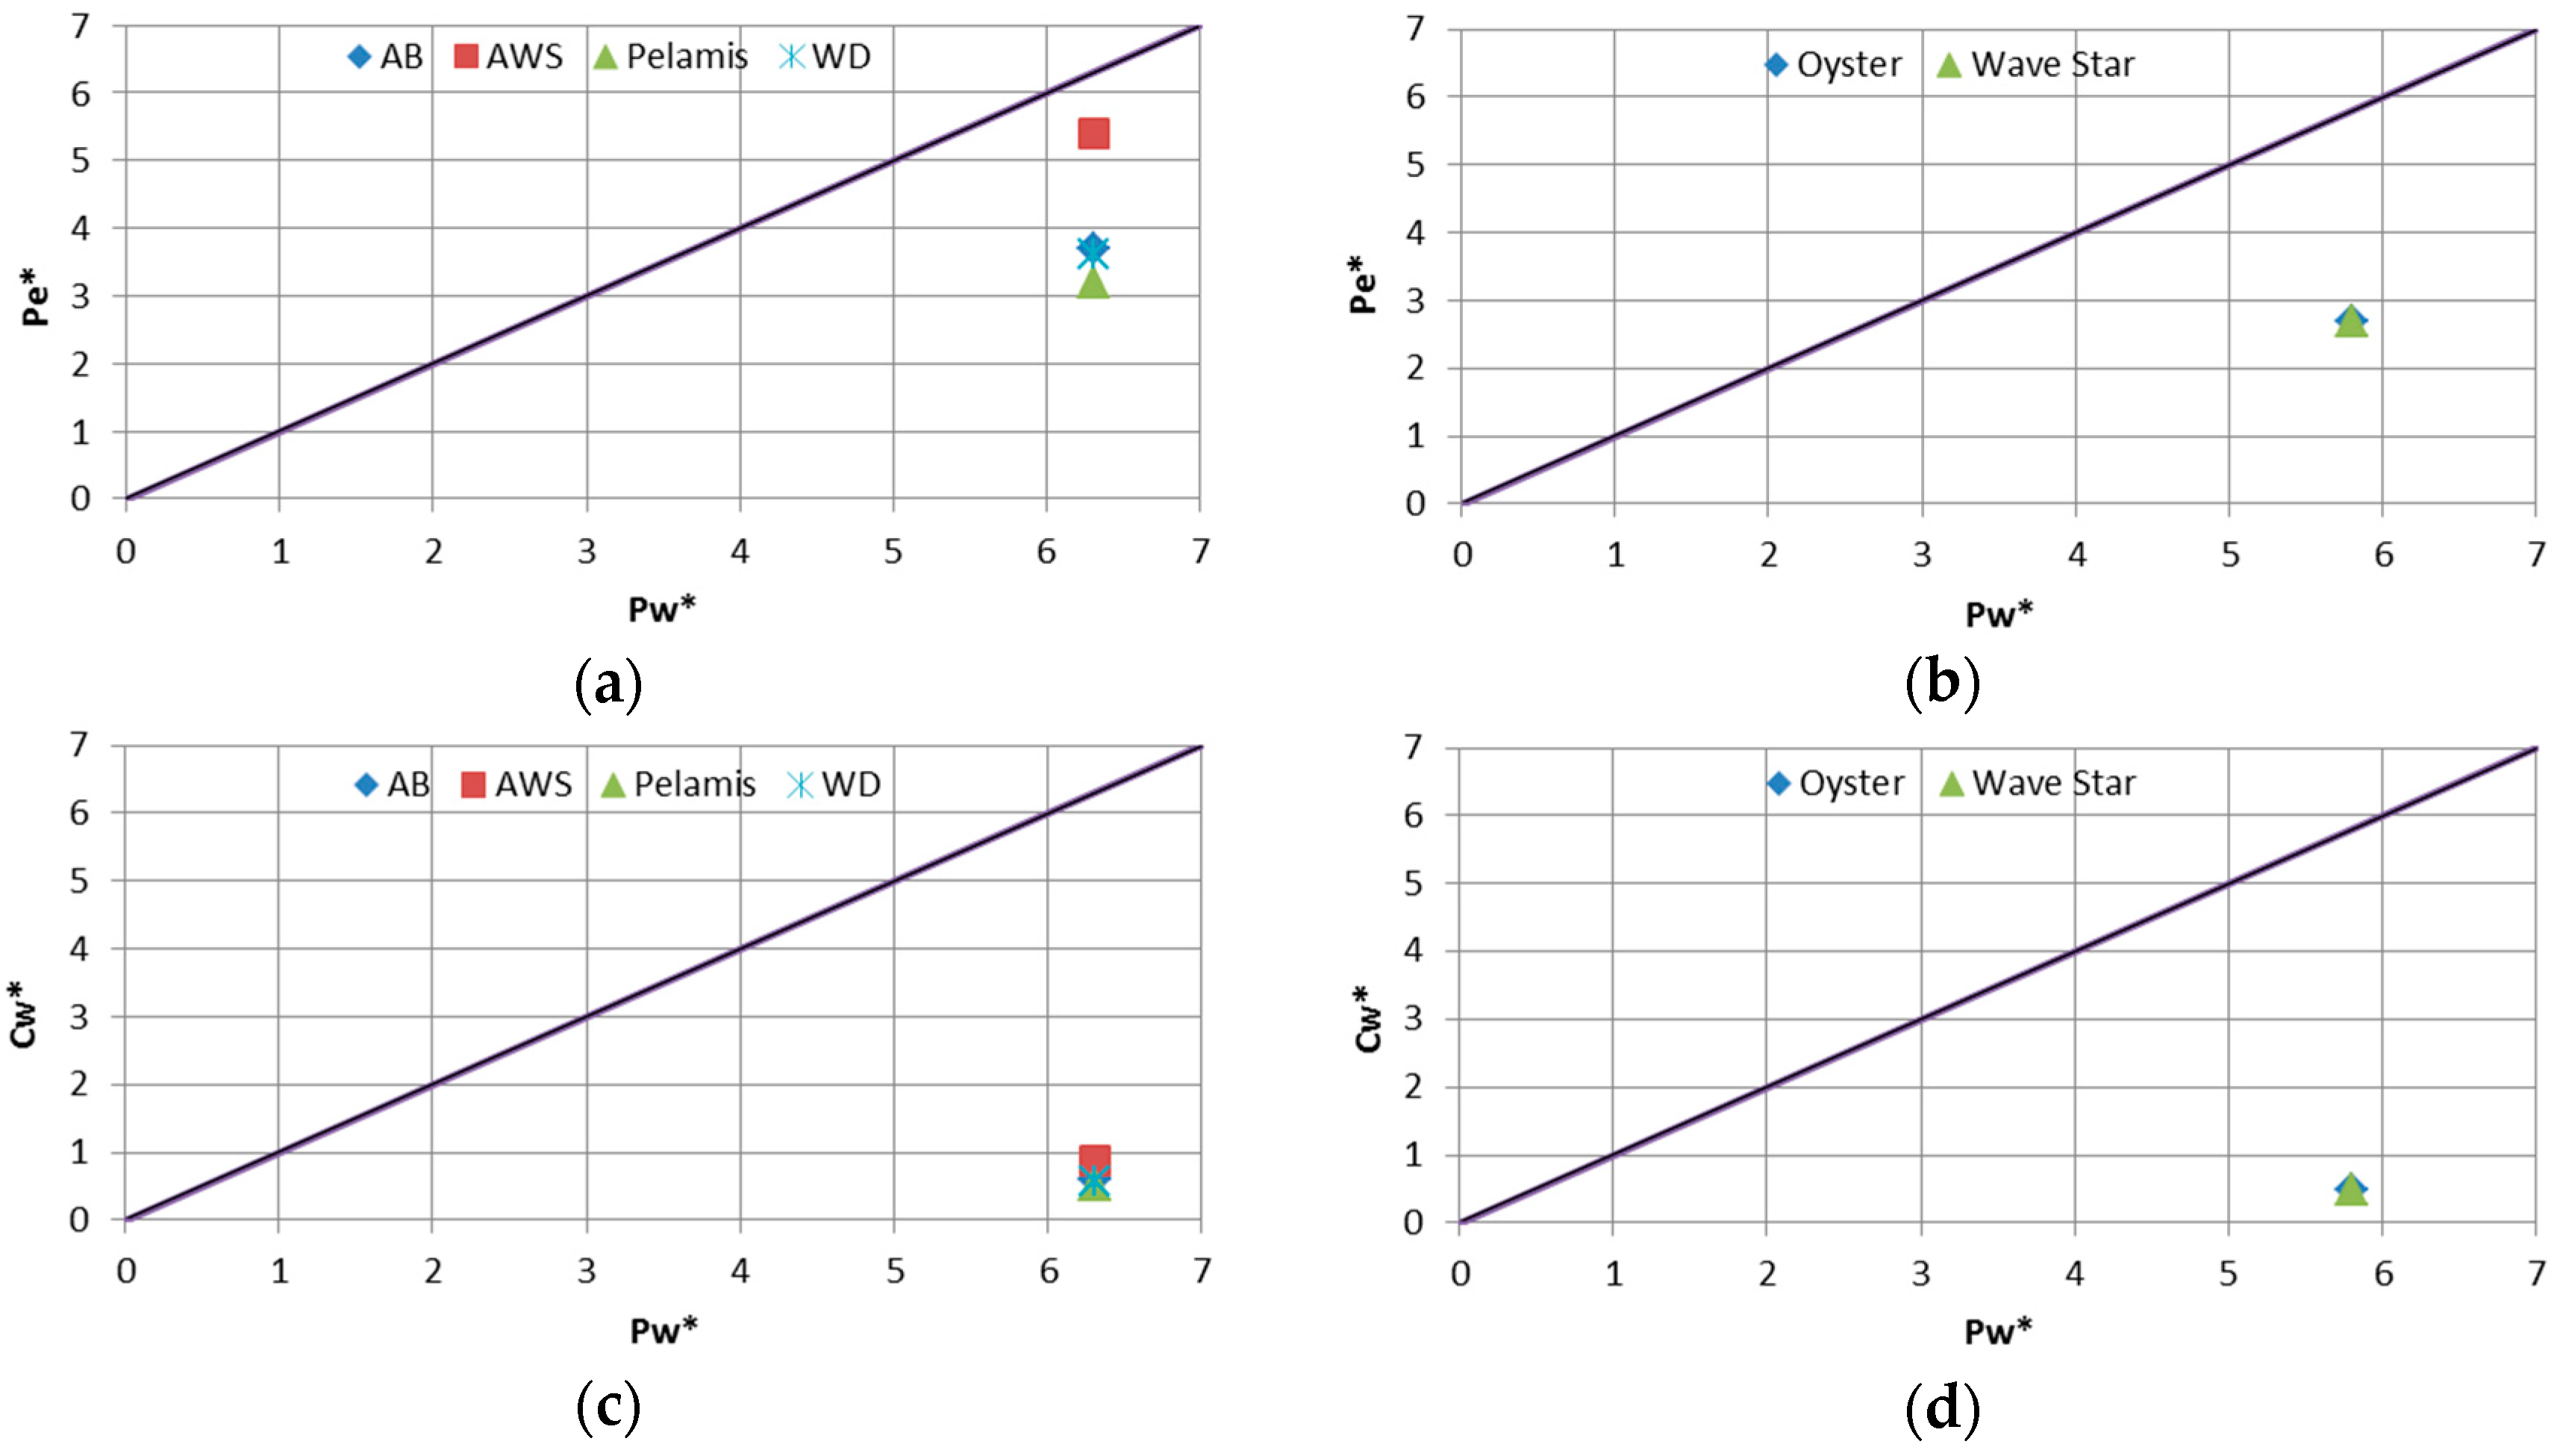
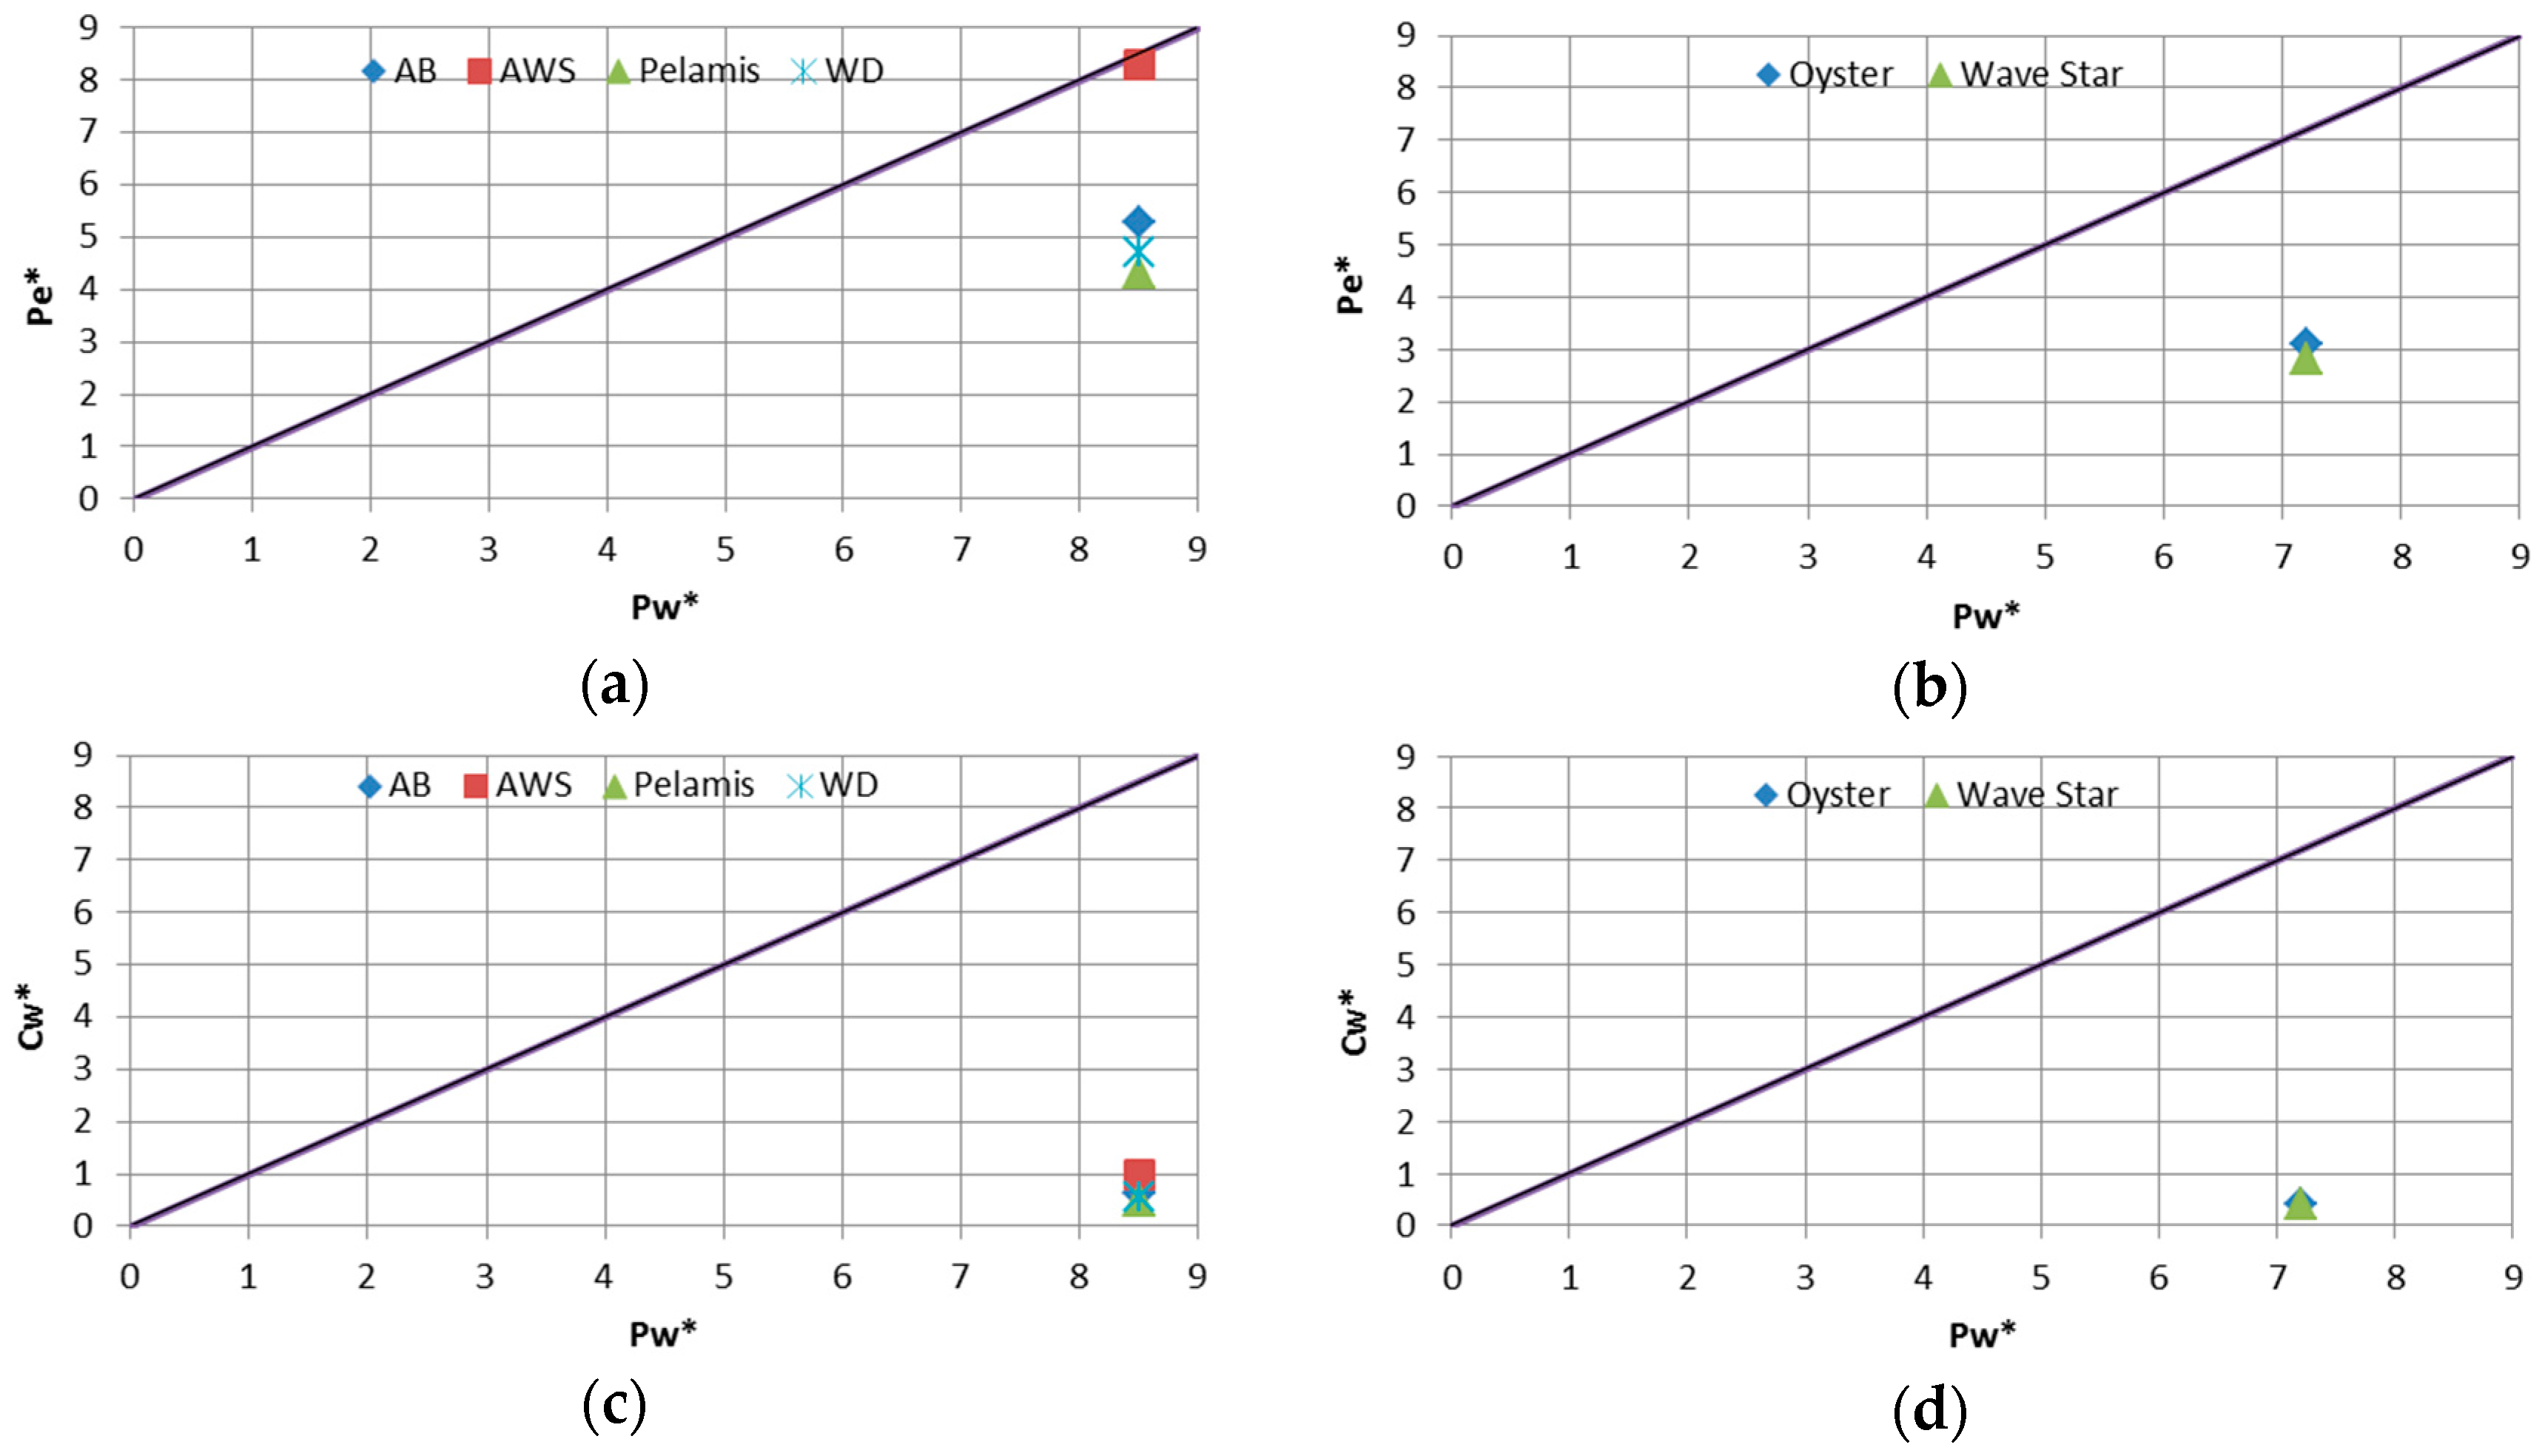
5. Performances of Wave Energy Converters
6. Conclusions
Acknowledgments
Author Contributions
Conflicts of Interest
References
- Mork, G.; Barstow, S.; Kabuth, A.; Pontes, M.T. Assessing the Global Wave Energy Potential. In Proceedings of the 29th International Conference on Ocean, Offshore and Arctic Engineering (OMAE), Shanghai, China, 6–11 June 2010; Available online: http://www.oceanor.no/related/59149/paper_OMAW_2010_20473_final.pdf (accessed on 1 March 2016).
- De, O.; Falcão, A.F. Wave energy utilization: A review of the technologies. Renew. Sustain. Energy Rev. 2010, 14, 899–918. [Google Scholar]
- Dalton, G.J.; Rousseau, N.; Neumann, F.; Holmes, B. Non-Technical Barriers to Wave Energy Development, Comparing Progress in Ireland and Europe. In Proceedings of the 8th European Wave and Tidal Energy Conference (EWTEC), Uppsala, Sweden, 7–10 September 2009; Available online: https://www.ucc.ie/en/media/research/hmrc/publications/Nontechnicalbarrierstowaveenergy.pdf (accessed on 1 March 2016).
- Clément, A.; McCullen, P.; Falcão, A.; Fiorentino, A.; Gardner, F.; Hammarlund, K.; Lemonis, G.; Lewis, T.; Nielsen, K.; Petroncini, S.; et al. Wave energy in Europe: Current status and perspectives. Renew. Sustain. Energy Rev. 2002, 6, 405–431. [Google Scholar] [CrossRef]
- Pontes, M.T.; Falcão, A. Ocean Energy Conversion. In Proceedings of the 18th World Energy Council, Buenos Aires, Argentina, 9–13 October 2001; Available online: http://download.nachhaltigwirtschaften.at/pdf/lect-p-pontes.pdf (accessed on 1 March 2016).
- Arinaga, R.A.; Cheung, K.F. Atlas of global wave energy from 10 years of reanalysis and hindcast data. Renew. Energy 2012, 39, 49–64. [Google Scholar] [CrossRef]
- Cornett, A.M. A Global Wave Energy Resource Assessment. In Proceedings of the International Offshore and Polar Engineering Conference, Vancouver, BC, Canada, 6–11 July 2008; pp. 318–326.
- Duckers, L. Introduction to wave power. Wave Power: An Engineering and Commercial Perspective (Digest No: 1997/098). IEE Colloq. 1997, 13, 1–8. [Google Scholar]
- Thorpe, T. An Overview of Wave Energy Technologies—Status; Performance and Costs. Wave Power: Moving towards Commercial Viability; Professional Engineering Publishing: London, UK, 2000; pp. 13–30. [Google Scholar]
- Cruz, J. Ocean Wave Energy; Springer Science & Business Media: Berlin, Germany, 2007. [Google Scholar]
- Barstow, S.; Mørk, G.; Lønseth, L.; Mathisen, J.P. WorldWaves Wave Energy Resource Assessments from the Deep Ocean to the Coast. In Proceedings of the 8th European Wave and Tidal Energy Conference, Uppsala, Sweden, 7–10 September 2009; Available online: http://www.oceanor.no/related/59149/ewtec_09_Barstow_245.pdf (accessed on 1 March 2016).
- Hughes, M.G.; Heap, A.D. National-scale wave energy resource assessment for Australia. Renew. Energy 2010, 35, 1783–1791. [Google Scholar] [CrossRef]
- Pontes, M.T.; Athanassoulis, G.A.; Barstow, S.; Cavaleri, L.; Holmes, B.; Mollison, D.; Oliveira-Pires, H. WERATLAS-Atlas of Wave Energy Resource in Europe. Available online: http://users.ntua.gr/mathan/pdf/WERATLAS.pdf (accessed on 1 March 2016).
- Cavaleri, L. The wind and wave atlas of the Mediterranean Sea—The calibration phase. Adv. Geosci. 2005, 2, 255–257. [Google Scholar] [CrossRef]
- Martinelli, L. Wave Energy Converters under Mild Wave Climates. In Proceedings of the IEEE OCEANS’11, Santander, Spain, 19–22 September 2011.
- Vicinanza, D.; Cappietti, L.; Ferrante, V.; Contestabile, P. Estimation of the wave energy in the Italian offshore. J. Coast. Res. 2011, 64, 613–617. [Google Scholar]
- Liberti, L.; Carillo, A.; Sannino, G. Wave energy resource assessment in the Mediterranean, the Italian perspective. Renew. Energy 2013, 50, 938–949. [Google Scholar] [CrossRef]
- Sierra, J.P.; Mösso, C.; González-Marco, D. A Wave energy resource assessment in Menorca (Spain). Renew. Energy 2014, 71, 51–60. [Google Scholar] [CrossRef]
- Besio, G.; Mentaschi, L.; Mazzino, A. Wave energy resource assessment in the Mediterranean Sea on the basis of a 35-year hindcast. Energy 2016, 94, 50–63. [Google Scholar] [CrossRef]
- Contestabile, P.; Vicinanza, D.; Ferrante, V. Wave Energy Resource along the Coast of Santa Catarina (Brazil). Energies 2015, 8, 14219–14243. [Google Scholar] [CrossRef]
- Waters, R.; Engstroöm, J.; Isberg, J.; Leijon, M. Wave climate off the Swedish west coast. Renew. Energy 2009, 34, 1600–1606. [Google Scholar] [CrossRef]
- Ayat, B. Wave power atlas of Eastern Mediterranean and Aegean Seas. Energy 2013, 54, 251–262. [Google Scholar] [CrossRef]
- Iuppa, C.; Cavallaro, L.; Vicinanza, D.; Foti, E. Investigation of suitable sites for wave energy converters around Sicily (Italy). Ocean Sci. 2015, 11, 543–557. [Google Scholar] [CrossRef]
- Folley, M.; Whittaker, T.J.T. Analysis of the nearshore wave energy resource. Renew. Energy 2009, 34, 1709–1715. [Google Scholar] [CrossRef]
- Iglesias, G.; Carballo, R. Wave energy resource in the Estaca de Bares area (Spain). Renew. Energy 2010, 35, 1574–1584. [Google Scholar] [CrossRef]
- Iglesias, G.; Carballo, R. Offshore and inshore wave energy assessment: Asturias (N Spain). Energy 2010, 35, 1964–1972. [Google Scholar] [CrossRef]
- Iglesias, G.; Carballo, R. Wave energy and nearshore hot spots: The case of the SE Bay of Biscay. Renew. Energy 2010, 35, 2490–2500. [Google Scholar] [CrossRef]
- Iglesias, G.; Carballo, R. Choosing the site for the first wave farm in a region: A case study in the Galician Southwest (Spain). Energy 2011, 36, 5525–5531. [Google Scholar] [CrossRef]
- Rusu, E.; GuedesSoares, C. Wave energy pattern around the Madeira Islands. Energy 2012, 45, 771–785. [Google Scholar] [CrossRef]
- Rusu, L.; GuedesSoares, C. Wave energy assessments in the Azores islands. Renew. Energy 2012, 45, 183–196. [Google Scholar] [CrossRef]
- Stopa, J.E.; Cheung, K.F.; Chen, Y.L. Assessment of wave energy resources in Hawaii. Renew. Energy 2011, 36, 554–567. [Google Scholar] [CrossRef]
- Monteforte, M.; Lo Re, C.; Ferreri, G.B. Wave energy assessment in Sicily (Italy). Renew. Energy 2015, 78, 276–287. [Google Scholar] [CrossRef]
- Vicinanza, D.; Contestabile, P.; Ferrante, V. Wave energy potential in the north-west of Sardinia (Italy). Renew. Energy 2013, 50, 506–521. [Google Scholar] [CrossRef]
- Akpınar, A.; Kömürcü, M.I. Assessment of wave energy resource of the Black Sea based on 15-year numerical hindcast data. Appl. Energy 2013, 101, 502–512. [Google Scholar] [CrossRef]
- Jadidoleslam, N.; Özger, M.; Agiralioglu, N. Wave power potential assessment of Aegean Sea with an integrated 15-year data. Renew. Energy 2016, 86, 1045–1059. [Google Scholar] [CrossRef]
- Carballo, R.; Iglesias, G. A methodology to determine the power performance of wave energy converters at a particular coastal location. Energy Convers. Manag. 2012, 61, 8–18. [Google Scholar] [CrossRef]
- Pontes, M.T.; Aguiar, R.; Pires, H.O. A nearshore wave energy atlas for Portugal. Trans ASME J. Offshore Mech. Arct. Eng. 2005, 127, 249–255. [Google Scholar] [CrossRef]
- Bozzi, S.; Archetti, R.; Passoni, G. Wave electricity production in Italian offshore: A preliminary investigation. Renew. Energy 2014, 62, 407–416. [Google Scholar] [CrossRef]
- O’Connor, M.; Lewis, T.; Dalton, G. Techno-economic performance of the Pelamis P1 and Wavestar at different ratings and various locations in Europe. Renew. Energy 2013, 50, 889–900. [Google Scholar] [CrossRef]
- Aoun, N.S.; Harajli, H.A.; Queffeulou, P. Preliminary appraisal of wave power prospects in Lebanon. Renew. Energy 2013, 53, 165–173. [Google Scholar] [CrossRef]
- Dunnett, D.; Wallace, J.S. Electricity generation from wave power in Canada. Renew. Energy 2009, 34, 179–195. [Google Scholar] [CrossRef]
- Mota, P.; Pinto, J.P. Wave energy potential along the western Portuguese coast. Renew. Energy 2014, 71, 8–17. [Google Scholar] [CrossRef]
- Iuppa, C.; Cavallaro, L.; Foti, E.; Vicinanza, D. Potential wave energy production by different wave energy converters around Sicily. J. Renew. Sustain. Energy 2015, 7, 061701. [Google Scholar] [CrossRef]
- Rusu, L.; Onea, F. Assessment of the performances of various wave energy converters along the European continental coasts. Energy 2015, 82, 889–904. [Google Scholar] [CrossRef]
- Rusu, E.; Onea, F. Estimation of the wave energy conversion efficiency in the Atlantic Ocean close to the European islands. Renew. Energy 2016, 85, 687–703. [Google Scholar] [CrossRef]
- Previmer Website. Available online: http://www.previmer.org (accessed on 20 September 2012).
- Lecornu, F.; De Roeck, Y.H. PREVIMER-Coastal observations and forecasts. Houille Blanche-Revue Internationale De L Eau 2009, 1, 60–63. (In French) [Google Scholar] [CrossRef]
- MIKE Powered by DHI. MIKE 21 Spectral Wave FM Module User Guide. Available online: http://www.hydroasia.org/jahia/webdav/site/hydroasia/shared/COURSES/MANUALS/DHI_water_resources_software/MIKE21-River_hydraulics_and_morphology/MIKE21_SW.pdf (accessed on 25 November 2016).
- Weinstein, A.; Fredrikson, G.; Parks, M.J.; Nielsen, K. AquaBuOY—The Offshore Wave Energy Converter Numerical Modeling and Optimization. In Proceedings of the OCEANS’04, Kobe, Japan, 9–12 November 2004.
- Silva, D.; Rusu, E.; Soares, C.G. Evaluation of Various Technologies for Wave Energy Conversion in the Portuguese Nearshore. Energies 2013, 6, 1344–1364. [Google Scholar] [CrossRef]
- Carbon Trust. Variability of UK Marine Resources; Environmental Change Institute: Oxford, UK, 2005. Available online: https://tethys.pnnl.gov/sites/default/files/publications/Carbon_Trust_2005.pdf (accessed on 9 January 2016).
- Marquis, L.; Kramer, M.; Frigaard, P. First Power Production Results from the Wave Star Roshage Wave Energy Converter. In Proceedings of the 3rd International Conference on Ocean Energy, Bilbao, Spain, 6–8 October 2010; Available online: http://wavestarenergy.com/sites/default/files/Wave%20Star%20Energy%20presentation%20ICOE%202010%20UPDATED%20After%20Conference.pdf (accessed on 9 January 2016).
- Valério, D.; Beirão, P.; Sá da Costa, J. Optimisation of wave energy extraction with the Archimedes Wave Swing”. Ocean Eng. 2007, 34, 2330–2344. [Google Scholar] [CrossRef]
- Henderson, R. Design; simulation; and testing of a novel hydraulic power take-off system for the Pelamis wave energy converter. Renew. Energy 2006, 31, 271–283. [Google Scholar] [CrossRef]
- Kofoed, J.P.; Frigaard, P.; Friis-Madsen, E.; Sørensen, H.C. Prototype Testing of the Wave Energy Converter Wave Dragon. Renew. Energy 2006, 31, 181–189. [Google Scholar] [CrossRef]
- Whittaker, T.J.T.; Collier, D.; Folley, M.; Osterreid, M.; Henry, A.; Crowley, M. The Development of Oyster—A Shallow Water Surging Wave Energy Converter. In Proceedings of the 7th European Wave & Tidal Energy Conference, Porto, Portugal, 11–13 September 2007; Available online: https://www.researchgate.net/publication/228671649_The_development_of_Oyster-A_shallow_water_surging_wave_energy_converter (accessed on 9 January 2016).
- Kramer, M.; Marquis, L.; Frigaard, P. Performance Evaluation of the Wavestar Prototype. In Proceedings of the 9th European Wave and Tidal Energy Conference, Southampton, UK, 5–9 September 2011; Available online: http://www.energinet.dk/SiteCollectionDocuments/Danske%20dokumenter/Forskning%20-%20PSO-projekter/Bilag%203%20-%20Performance%20Evaluation%20of%20the%20Wavestar%20Prototype%20-%20M.%20M.%20Kramer%20et%20al.pdf (accessed on 9 January 2016).
- Rusu, E. Evaluation of the Wave Energy Conversion Efficiency in Various Coastal Environments. Energies 2014, 7, 4002–4018. [Google Scholar] [CrossRef]
- Frigaard, P.; Lykke Andersen, T.; Margheritini, L.; Vicinanza, D. Design; Construction; Reliability and Hydraulic Performance of an Innovative Wave Overtopping Device. In Proceedings of the 8th International Congress on Advances in Civil Engineering, Famagusta, North Cyprus, 15–17 September 2008; Available online: http://vbn.aau.dk/files/14964781/Design (accessed on 9 January 2016).
- Gonçalves, M.; Martinho, P.; Guedes Soares, C. Wave energy conditions in the western French coast. Renew. Energy 2014, 62, 155–163. [Google Scholar] [CrossRef]
- Van Nieuwkoop, J.C.C.; Smith, H.C.M.; Smith, G.H.M.; Johanning, L. Wave resource assessment along the Cornish coast (UK) from a 23-year hindcast dataset validated against buoy measurements. Renew. Energy 2013, 58, 1–14. [Google Scholar] [CrossRef]
- Dalton, G.J.; Alcorn, R.; Lewis, T. Case study feasibility analysis of the Pelamis wave energy convertor in Ireland; Portugal and North America. Renew. Energy 2010, 35, 443–455. [Google Scholar] [CrossRef]


| Position | Type | Power Take Off | Rated Power (kW) | Size | |
|---|---|---|---|---|---|
| AcquaBuoy | Offshore (>50 m) | Point absorber | hydraulic motor/generator | 250 | diameter 6 m, draught 30 m |
| AWS | Offshore (>50 m) | Point absorber | linear generator | 2000 | 43 m deep underwater |
| Pelamis | Offshore (>50 m) | Attenuator—Oscillating Body | hydraulic motor/generator | 750 | diameter 3.5 m, length 150 m |
| Wave Dragon | Offshore (25–40 m) | Overtopping—floating | water turbine | 7000 | width 300 m, length 170 m |
| Oyster | Nearshore (≈15 m) | Oscillating Body—submerged | water turbine | 800 | width 18 m, height 12 m |
| Wave Star | Nearshore | Multi point absorber | hydraulic motor/generator | 600 | Float diameter Ø5 m |
| Latitude (WGS84-UTM32) | Longitude (WGS84-UTM32) | Pw (kW/m) | COV | SV | MV | Water Depth (m) |
|---|---|---|---|---|---|---|
| Tuscany | ||||||
| 4,826,801 | 592,648 | 4.7 | 1.87 | 0.99 | 2.03 | −10 |
| 4,826,150 | 587,255 | 3.8 | 1.84 | 0.96 | 2.02 | −50 |
| Liguria | ||||||
| 4,841,692 | 371,620 | 2 | 1.93 | 0.69 | 1.9 | −10 |
| 4,840,551 | 371,127 | 1.8 | 1.87 | 0.64 | 1.82 | −50 |
| Sardinia | ||||||
| 4,509,652 | 426,722 | 11.4 | 2 | 1.49 | 1.72 | −20 |
| 4,509,971 | 424,733 | 11.7 | 2 | 1.49 | 1.71 | −50 |
| Sicily | ||||||
| 4,208,742 | 238,674 | 9.1 | 2.58 | 1.76 | 2.03 | −15 |
| 4,209,477 | 238,355 | 8.6 | 2.55 | 1.76 | 1.99 | −50 |
| Location | Coordinates (WGS84-UTM32) | Depth (m) | Pw (kW/m) | Annual Energy (MWh/m) | |
|---|---|---|---|---|---|
| Offshore | Azores (Portugal) | 4291193/385315 | 43 | 73 | 639.5 |
| Madeira (Portugal) | 3667766/371286 | 40 | 57.4 | 502.8 | |
| Nazarè-Peniche (Portugal) | - | 50 | 20.8 | 182.1 | |
| Sines-Aljezur (Portugal) | - | 50 | 14.8 | 129.3 | |
| Belmullet (Ireland) | 6028028/497403 | 72 | 50 | 438 | |
| Ile d’Yeu (France) | 5170879/544349 | 32 | 15 | 113.1 | |
| Cornish Coast (UK) | 5576508/309895 | 50 | 20 | 175.2 | |
| Nearshore | Madeira (Portugal) | 3663184/374026 | 15 | 65.4 | 572.9 |
| Location | Mean Power Output (kW) “Pe” | Capacity Factor “Cf” (%) | Capture Width “Cw” (m) | ||||||||||
|---|---|---|---|---|---|---|---|---|---|---|---|---|---|
| AB | AWS | Pelamis | WD | AB | AWS | Pelamis | WD | AB | AWS | Pelamis | WD | ||
| Offshore | Tuscany | 7.3 | 26.5 | 21.5 | 290.6 | 2.93 | 1.32 | 2.87 | 4.15 | 1.93 | 6.97 | 5.66 | 76.48 |
| Liguria | 3.1 | 7.3 | 6.6 | 227 | 1.33 | 0.37 | 0.87 | 3.24 | 1.72 | 4.04 | 3.67 | 126.1 | |
| Sardinia | 21.1 | 99.2 | 64.9 | 540.4 | 8.44 | 4.96 | 8.66 | 7.72 | 1.81 | 8.49 | 5.56 | 46.26 | |
| Sicily | 14.5 | 64.7 | 49.1 | 419.4 | 5.81 | 3.23 | 6.54 | 5.99 | 1.7 | 7.55 | 5.73 | 48.99 | |
| Azores (Portugal) | 77.3 | 539.9 | 208.8 | 1967.5 | 29.97 | 26.69 | 27.83 | 28.11 | 1.06 | 7.4 | 2.86 | 26.95 | |
| Madeira (Portugal) | 45.5 | 413.8 | 118.6 | 1153.1 | 16.39 | 20.69 | 15.81 | 16.47 | 0.79 | 7.21 | 2.07 | 20.09 | |
| Nazarè-Peniche (Portugal) | 56.1 | 292 | 112.5 | 2779 | 22.44 | 14.6 | 15 | 39.7 | 2.7 | 14.05 | 5.41 | 133.69 | |
| Sines-Aljezur (Portugal) | 43.5 | 228 | 84 | 2324 | 17.4 | 11.4 | 11.2 | 33.2 | 2.95 | 15.44 | 5.69 | 157.41 | |
| Belmullet (Ireland) | 90.7 | 515.9 | 277.1 | 2159 | 37.96 | 25.8 | 36.94 | 30.84 | 1.81 | 10.32 | 5.54 | 43.18 | |
| Ile d’Yeu (France) | 53.2 | 367.9 | 120.8 | 1289.6 | 21.29 | 18.39 | 16.11 | 18.42 | 3.56 | 24.61 | 8.08 | 86.26 | |
| Cornish Coast (UK) | 51.3 | 250.9 | 172.3 | 1243.7 | 23.7 | 12.54 | 22.97 | 17.77 | 2.57 | 12.54 | 8.62 | 62.18 | |
| Location | Mean Power Output (kW) “Pe” | Capacity Factor “Cf” (%) | Capture Width “Cw” (m) | ||||
|---|---|---|---|---|---|---|---|
| Oyster | Wave Star | Oyster | Wave Star | Oyster | Wave Star | ||
| Nearshore | Tuscany | 22.59 | 46.86 | 6.45 | 7.81 | 4.85 | 10.05 |
| Liguria | 7.76 | 18.5 | 2.22 | 3.08 | 3.98 | 9.49 | |
| Sardinia | 48.51 | 96.59 | 13.86 | 16.1 | 4.27 | 8.49 | |
| Sicily | 41.72 | 91.23 | 11.92 | 15.2 | 4.56 | 9.98 | |
| Madeira (Portugal) | 129.2 | 257.3 | 36.97 | 42.88 | 1.98 | 3.9 | |
| Location | Offshore WEC | Nearshore WEC |
|---|---|---|
| Tuscany | Wave Dragon | Wave Star |
| Liguria | Wave Dragon | Wave Star |
| Sardinia | Pelamis | Wave Star |
| Sicily | Pelamis | Wave Star |
© 2016 by the authors; licensee MDPI, Basel, Switzerland. This article is an open access article distributed under the terms and conditions of the Creative Commons Attribution (CC-BY) license (http://creativecommons.org/licenses/by/4.0/).
Share and Cite
Vannucchi, V.; Cappietti, L. Wave Energy Assessment and Performance Estimation of State of the Art Wave Energy Converters in Italian Hotspots. Sustainability 2016, 8, 1300. https://doi.org/10.3390/su8121300
Vannucchi V, Cappietti L. Wave Energy Assessment and Performance Estimation of State of the Art Wave Energy Converters in Italian Hotspots. Sustainability. 2016; 8(12):1300. https://doi.org/10.3390/su8121300
Chicago/Turabian StyleVannucchi, Valentina, and Lorenzo Cappietti. 2016. "Wave Energy Assessment and Performance Estimation of State of the Art Wave Energy Converters in Italian Hotspots" Sustainability 8, no. 12: 1300. https://doi.org/10.3390/su8121300
APA StyleVannucchi, V., & Cappietti, L. (2016). Wave Energy Assessment and Performance Estimation of State of the Art Wave Energy Converters in Italian Hotspots. Sustainability, 8(12), 1300. https://doi.org/10.3390/su8121300