Abstract
Issues concerning which factors that influence carbon dioxide emission, and which administrative measures should be imposed to reduce carbon emission in Chinese cities, have been on the agenda in cities’ policy-making. Yet little literature has studied this topic from the city level. This paper first measures CO2 emission of 73 Chinese cities. We find heterogeneity embedded in the cross-city distribution of CO2 emission per capita and a nonlinear structure in the relationship between carbon emission and GDP per capita. To describe such multimodality and examine the determinants of CO2 emission in these cities, this article applies a linear mixed effect model covering the quadratic term of GDP per capita to extend the stochastic impact by regression on population, affluence, and technology (STIRPAT) model. The empirical results demonstrate that population size, secondary industry proportion, energy consumption structure, urbanization level and economic level have generally shown a positive influence on CO2 emissions in Chinese cities. However, the urbanization level is of no significance. The phenomenon of the environmental Kuznets curve varies across Chinese cities, according to which three city groups are formed. Specific policy recommendations are given to each city group in light of their unique influencing modes on carbon emissions.
1. Introduction
Nowadays, it is widely accepted that the high concentration of greenhouse gases, most notably carbon dioxide emissions (CO2), in the atmosphere is the main factor of the greenhouse effect. This fact justifies why CO2 emissions are considered by the specialists as the best available indicator of climate change [1,2]. China’s energy intensity and carbon-emission intensity decreased 16% and 17%, respectively, during the 12th Five-Year Plan (2011–2015), compared to the 11th Five-Year Plan (2006–2010). On 12 November 2014, the U.S-China Joint Announcement on Climate Change was issued by President Xi Jinping and President Obama, which says China hopes to reach its carbon emission peak no later than 2030. The Beautiful China initiative will also be in practice during the 13th Five-Year Plan (2016–2020), which was proposed in the Fifth Plenum of the 18th Central Committee of the Communist Party of China. This initiative aims to establish an industrial system geared toward green, low-carbon, and circular development, and to improve the initial allocation system for carbon permits. On 12 December 2015, the Paris Agreement under the United Nations Framework Convention on climate change suggests that countries should reach a global peak of greenhouse gas emissions as soon as possible, recognizing that peaking will take longer for developing countries. The agreement makes nationally-determined contributions with bottom-up voluntary emissions come true. China should reach its carbon emission peak and realize its emission reduction target as soon as possible according to the agreement.
Cities are the most important unit to execute the carbon reduction target in China. Under the restriction of reaching carbon emission peaking before 2030, city governments should implement reasonable carbon reduction policies for the balance of continuous carbon reduction and stable economy development. Therefore, it is very important to study the evolution over time of emissions in Chinese cities and their significant determinants. It is helpful for us to find out the appropriate way to reduce the CO2 emissions and achieve the carbon intensity target. China’s vast territory leads to different levels of carbon emission in different cities as the year goes by. Additionally, the economic development level and structure affect the carbon emissions in various ways. Some evidences have been found, which will be presented in Section 2. As a consequence, we argue that there exist different impact patterns among Chinese cities between carbon emissions and possible factors, such as the economic development level and structure.
To the best of our knowledge, previous literature on the topic of energy economics and environmental economics mainly focus on the aspects at a macroscopic level. Some studied the factors of CO2 emissions from the perspective of countries or states [3,4,5], whereas others examined the determinants of CO2 emissions in countries by different income levels [6]. Concerning the factors of CO2 emissions in China, many scholars have contributed to this issue [7,8,9,10,11,12,13]. The bright spot is that there appear to be some studies on the city level conducted in recent years, for example in Minhang district [14], Shanghai city [15], Beijing city [16], and Guangdong province [17]. What is worthy of noting is that the results of the factors on CO2 emissions in Chinese cities used in the literature are more or less the same, including population size, urbanization, GDP per capita, industrialization, carbon intensity, energy structure, export dependence, tertiary industry proportion, R & D output, stakeholder involvement, and so forth. However, the conclusions concerning the strength of the factors are different. For example, urbanization level has the greatest interpretative ability for CO2 emissions in Beijing [16], whereas population scale is the most important impact factor of CO2 emissions in Guangdong [17]. Such difference is probably due to the fact that large regional disparities exist in Chinese cities, in terms of not only the speed of economic development but also the structures of both the economy and the energy industry. As a consequence, we aim to find out the significant factors influencing China’s CO2 emissions in the city level. The conclusion is expected to provide some appropriate ways to reduce CO2 emissions according to the current development in a city, and to finally achieve the carbon intensity target in China.
Various determinants analyzing models are used to study the determinants of CO2 emissions. The representative models include the input–output model [18], environmental impact driven by population, affluence and technology (IPAT) model [19,20], stochastic impact by regression on population, affluence, and technology (STIRPAT) models [21,22], Laspeyres method [23], the logarithmic mean Divisia index (LMDI) method [24,25,26], the Adaptive Weighting Divisia (AWD) method [27], the generalized Fisher index (GFI) method [28], the Kaya Index method [29], and so forth. In recent years, the STIRPAT model has been widely applied on this topic, since it can examine many more factors than other models. Additionally, the STIRPAT model is suitable for the econometric model of panel data. Consequently, this paper attempts to build an improved STIRPAT model to study the factors influencing CO2 emissions by using the data from 2002 to 2012 of 73 cities. In particular, we used a linear mixed effect model to extend the STIRPAT model for studying different factors and intensities of influencing carbon emission in different cities.
The contributions of this research lie in the following three aspects. Firstly, we argue that different modes of development law as well as influence effect on CO2 emissions are embedded in different regions in China. Consequently, our studies in this paper mainly concentrate on the city level rather than at the macroscopic level, the latter of which have been commonly seen in previous studies. Secondly, a linear mixed effect model is applied in order to better identify such city-level patterns. To be specific, we consider the factors of population size, economy development, urbanization, industry structure as well as energy consumption structure, and examine their respective effects on each of the 73 cities in an empirical analysis. In this way, we expect to summarize the development laws and influence patterns for CO2 emissions across cities. Finally, at least two conclusions are expected to be drawn based on the empirical analysis: (1) it has been found in most cities that CO2 emission will first increase then decrease along with economic development. Indeed, this is an evidence of the existence of an environmental Kuznets curve (EKC) in China. Nevertheless, the phenomenon of an inverse EKC is also found in some cities; and (2) each city arrives at the peak of CO2 emission at its distinct level of economic development, and has different driving factors at the peak. These conclusions point out the direction and measures for policy-makers.
This paper is organized as follows: Section 2 measures CO2 emissions of 73 cities from 2002 to 2012, and describe their relations with GDP per capita; in Section 3, the STIRPAT model is extended and expressed as a linear mixed effect model; data resource and data processing methods are presented in Section 4; Section 5 provides the interpretation of the empirical analysis; and the conclusions and policy implications are summarized in Section 6.
2. Estimating CO2 Emissions of 73 Cities from 2002 to 2012 and Their Relations with GDP Per Capita
The first mission of this paper is to estimate CO2 emissions of 73 Chinese cities from 2002 to 2012. The sample cities cover Anyang, Anshan, Baotou, Baoding, Beijing, Dalian, Foshan, Guangzhou, Guiyang, Guilin, Harbin, Handan, Hefei, Huzhou, Jilin, Jinan, Jining, Jiaxing, Jiaozuo, Jingzhou, Jiujiang, Kunming, Lianyungang, Luzhou, Ma’anshan, Mianyang, Nanjing, Nanning, Nantong, Ningbo, Panzhihua, Pingdingshan, Qinhuangdao, Qingdao, Quanzhou, Rizhao, Shantou, Shanghai, Shaoguan, Shaoxing, Shijiazhuang, Suzhou, Taizhou, Taiyuan, Tai’an, Tangshan, Tianjin, Urumqi, Weifang, Wenzhou, Wuxi, Wuhu, Wuhan, Xining, Xianyang, Xuzhou, Yantai, Yan’an, Yangzhou, Yibin, Yinchuan, Yueyang, Zaozhuang, Changsha, Changzhi, Zhongshan, Chongqing, Zhuhai, Zibo, and Zunyi. We selected these representative cities by means of their regional distribution, as well as economic development levels.
2.1. Estimating CO2 Emissions
According to Global Protocol for Community-Scale Greenhouse Gas Emissions (GPC) prepared by C40 Cities Climate Leadership Group and ICLEI Local Governments for Sustainability in collaboration with the World Resources Institute, World Bank, UNEP, and UN-HABITAT, we propose to account for carbon emissions from energy consumption, major industrial products production, urban garbage disposal, and carbon sink ability for 73 cities. All data used to measure CO2 emissions and GDP per capita come from cities’ Statistical Yearbook, Economic Statistical Yearbook, and Economic and Social Statistical Yearbook. The detailed method of measuring CO2 emissions in 73 Chinese cities from 2002 to 2012 is presented.
Firstly, we measure carbon emissions from energy consumption. We adopt the Tier 1 approach from the Intergovernmental Panel on Climate Change (IPCC) to calculate the carbon emission in energy consumption by using:
where denotes the total carbon emission of all fuels, represents the amount of each fuel combusted (TJ), and is the carbon emission factor of each fuel (kg/TJ).
All fuels cover coal, cleaned coal, other washing coal, coal products, coke, gas, raw oil, petrol, diesel, kerosene, fuel oil, and so on, in China. Data concerning energy consumption are obtained from energy purchasing, consumption, and inventory of industrial enterprises tables in the cities’ Statistical Yearbook, Economic Statistical Yearbook, and Economic and Social Statistical Yearbook during the period of 2002–2012. For each type of fuel, we calculate the average emission factor in different industrial sectors as its emission factor. Data of emission factors in different industrial sectors comes from IPCC.
Secondly, we measure carbon emissions contained in major industrial products. This paper primarily calculates the carbon emissions contained in iron and steel production, cement production, and ammonia production to represent the whole carbon emission in the cities’ industry production. To avoid double counting, such carbon emissions come from the chemical reaction instead of energy combustion.
To be specific, we adopt the Tier 1 approach from the IPCC to calculate the carbon emissions in iron and steel production:
where represents the total carbon emission in iron and steel production, BOF, EAF, and OHF represents iron and steel production, respectively, from basic oxygen furnaces (BOF), electric arc furnaces (EAF), and open hearth furnaces (OHF), and EF denotes an emission factor for each kind of the abovementioned steel production. Hereby, the values of EF in BOF, EAF, and OHF are, respectively, 1.46, 0.08, and 1.72, according to the environmental performance evaluation index, announced by the international Iron and Steel Institute, which supposes that about 63% of iron and steel production in Chinese cities is produced in BOF, about 33% in EAF, and the remaining 4% in OHF.
Then, the carbon emissions in cement production are measured by:
where is the quantity of cement clinker production. According to the IPCC, 0.54 tons CO2 are emitted by the decomposition of silicate when 1 ton of cement clinker is produced. Nine hundred kilograms of clinker are produced from 1000 kg of cement. Therefore, from cement production is 0.486.
Next, the carbon emissions in ammonia production are calculated by:
where represents the carbon emission in ammonia production (kg), AP is the amount of ammonia production (tons), FR is fuel requirement per unit of output (GJ/ton), CCF represents the carbon content factor of the fuel (kg C/GJ), COF represents the carbon oxidation factor of the fuel, and represents the CO2 recovered for downstream use (kg). According to the IPCC, we respectively choose FR, CCF, and COF as 36, 21, and 1, since the ammonia production process in China for the period 2002–2012 is similar to partial oxidation production process in modern plants in Europe.
All data concerning quantities of steel products, cement, and ammonia output come from the output of major industrial products tables in various cities’ Statistical Yearbook, Economic Statistical Yearbook, and Economic and Social Statistical Yearbook during the period of 2002–2012.
Thirdly, we measure the carbon emissions from urban garbage disposal. The carbon emissions from urban garbage disposal are calculated by:
where corresponds to the i-th disposal of municipal solid waste, hazardous waste, and sewage sludge, respectively; represents for the amount of waste by type incinerated; represents the fraction of carbon in waste of type ; FCFi represents the fraction of fossil carbon in the total carbon of the waste of type ; represents the oxidation factor related to the combustion efficiency of type .
The emission factor of each municipal waste (i.e. urban garbage) comes from the provincial greenhouse gas inventories prepared by National Development and Reform Commission. Thus, is designated as 20%, as 39%, and as 95%. The quantity of waste collection and transportation mostly come from urban infrastructure information table in various the cities’ Statistical Yearbook during the period of 2002–2012.
Finally, we measure the carbon sink ability of each city. The carbon sink of each city equals to the CO2 sink per unit leaf area multiplied by grassland area, leaf area index, and photosynthesis time [30]. Leaf area index is defined as the one-sided green leaf area per unit ground surface area. We suppose that there is 12-h photosynthesis in one day. Similarly, grassland area also comes from the urban infrastructure information table.
2.2. Descriptive Analysis
The CO2 emission in 73 cities over 2002–2012 are calculated by subtracting the carbon sink from the sum of Equations (1)–(5). Figure 1 provides a boxplot to describe the distribution of cross-city CO2 emissions over the years. The 11 boxes correspond to years from 2002 to 2012. In general, the average level (i.e., the median) of CO2 emission in Chinese cities increased annually, and we notice that the sample cities differ from each other in terms of emission amounts regardless of years, according to the not-too-small variation of each box.
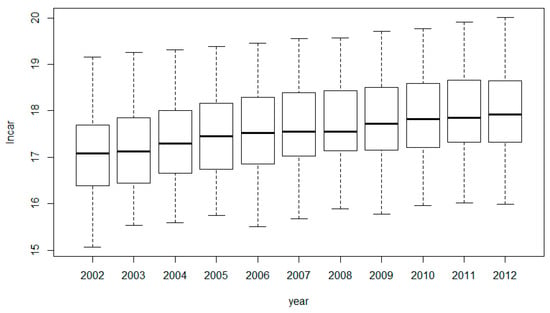
Figure 1.
CO2 emissions on a log scale of 73 Chinese cities from 2002 to 2012. Note: In this graph, the log-scale CO2 emissions are plotted. Each box describes emissions of 73 cities in each year.
When pooling the 803 observations in our dataset (73 cities × 11 years), we observe that CO2 emission per capita ranges from 3.5 million tons to 489.0 million tons, with a mean of 65.5 million tons. We display the distribution of CO2 emission per capita on a log scale in Figure 2. Apparently, the presence of multimodality is shown in this picture, which indicates that heterogeneity probably exists in the cross-city distribution of CO2 emission per capita. As a consequence, we intend to apply a linear mixed effect model to describe such multimodality embodied in the cross-city CO2 emissions and its influential factors, the details of which will be introduced in the following context.
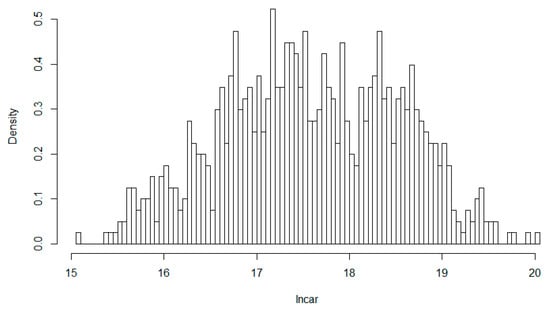
Figure 2.
CO2 emissions distribution: pooled observation.
As for the determinants of CO2 emissions, economic development has long been considered as one of the most important factors. The relationship between these two variables are visualized in Figure 3. Obviously, there exists a positive effect as well as a nonlinear structure in the relationship between CO2 emissions and GDP per capita. Some clear patterns have aroused our interests in that, firstly, it provides good evidence of the existence of an EKC in China, which indicates an inverted U-shaped relationship between carbon emissions and the level of economic development [5]. Secondly, only the left-hand side EKC of CO2 emission is presented according to the pooling dataset, which implies that the overall CO2 emission in China has not yet arrived at its peak. To better describe these patterns, we propose to add a quadratic term of GDP per capita in our model.
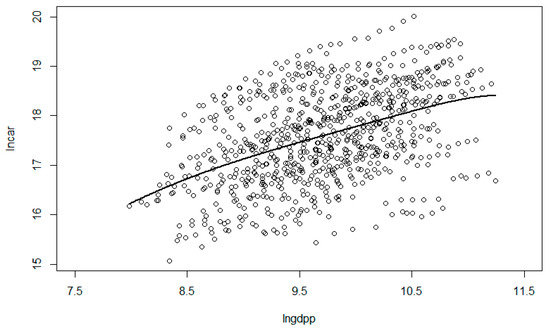
Figure 3.
Relationship on CO2 emissions versus GDP per capita: pooled observation.
When looking at each city, we expect to identify more complex relationships between emissions and economic development. We simply selected 16 cities, which come from four regions in China (Northeast, Eastern, West Central, and Southern China), and draw city-specific scatterplots of carbon emissions versus GDP per capita as well as curves fitted non-parametrically by means of kernel smoothing. As can be seen in Figure 4, nonlinear relationships can be detected regardless of cities and, more notably, the curve shapes are distinct for each city, which represents different patterns on their nonlinear trends. Although the smooth curves of Chongqing and Urumchi seem to be straight lines, we cannot ignore that there exists a scatter in the right-upper corner in each of the two plots, which is located right below the line and probably indicates a forthcoming downward trend.
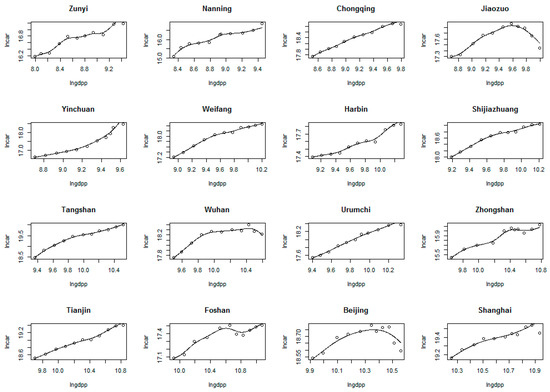
Figure 4.
Relationship between carbon emissions and GDP per capita across cities. Note: in this graph, we present the relationship between CO2 emission and GDP per capita in 16 subplots, each of which corresponds to a city selected from the whole sample of 73 cities. The selected cities come from four regions in China, i.e., the Northeast, Eastern, West Central, and Southern China. All subplots are distinct in terms of the vertical scale and the horizontal scale of their own.
From the above, we can conclude that the characteristics of nonlinearity and heterogeneity are embedded in the relationship between carbon emissions and economic development across cities. Therefore, we propose to apply a linear mixed effect model with both quadratic term the linear term of GDP per capita. Details of the model will be addressed in the next section.
3. Models
3.1. STIRPAT Model and its Extended Model
The well-known IPAT equation was initially proposed in the 1970s [19,20], which describes how the environment is affected by social economic factors. The model decomposes the impact of environment (I) into three factors: Population (P), Affluence (A), and Technology level (T), i.e.,
The IPAT model is the first to specify three driving forces that influence the environmental pressure. However, the key limitation of the IPAT model is the form of mathematical identities and the assumption of unit elasticity. Therefore, the IPAT model was modified into a stochastic model measuring the stochastic impact by regression on population, affluence and technology, named the STIRPAT model for short [21,31], i.e.,
where scales the model, are the exponents of , , and , respectively, is the error term. The four parameters need to be estimated. The subscript indicates that these quantities vary across observational units (for example, across cities in this paper). To facilitate estimation and hypothesis testing, Equation (7) can be converted to an additive regression model in which all variables are in logarithmic form, i.e.,
In this paper, we use the STIRPAT model as an analytic tool to study the determinants of carbon emissions in 73 Chinese cities. Considering the city-specific situation in China and learning from past research experience, we add some additional factors to the basic STIRPAT model. To be specific, we use CO2 emissions to represent . Concerning population , we propose to adopt both population structure (urbanization level) and population size. The change of population size and the growth of urbanization level are the two most significant phenomena in Chinese cities. In this paper, the variable of resident population size, rather than household registered population, is used to measure the real population size. As for affluence , generally speaking, GDP per capita is used to reflect this factor. More importantly, a major concern for many scholars is whether the EKC exists in China. In order to verify this issue, this paper puts the first power term and the quadratic term of GDP per capita together into the extended model. Finally, the technology factor is broken down into industrial structure and energy consumption structure. Above all, the STIRPAT model is extended as:
where refers to emission, stands for average resident population, denotes urbanization level, represents the share of secondary industry in GDP, means the energy structure, i.e., the share of coal consumption in energy consumption, and is the real GDP per capita. represent the to-be-estimated regression coefficients and .
3.2. Linear Mixed Effect Model
Equation (9) does not allow for slope heterogeneity and imposes a common structure for all 73 cities. This implies that the expected effect of a given increment in any variable of , , , , and over the environment when the other variables keep constant is the same for all cities. However, as we present in Section 2.2, these panel data about 73 Chinese cities for the period 2002–2012 show the existence of heterogeneity across cities and over time. Thus, we should apply a linear mixed effect model to relax the homogeneity assumption in Equation (9), and to present the multimodality embodied in the cross-city CO2 emissions and its influential factors [32,33,34].
Consider the general form of a linear mixed effect regression model
where is the dependent variable for the -th subject, is the design matrix representing for -th fixed-effect known values, are the fixed effects parameters. is the design matrix representing for -th random-effect known values, is the random effects parameters. is the residual for -th subject.
The linear mixed effect model describes both the overall effect, i.e., , and the particular effect concerning each object, i.e., . Therefore, we use the linear mixed effect model to establish the STIRPAT model for average population, urbanization level, industry structure, energy consumption structure, GDP per capita, and CO2 emissions. The extended STIRPAT model based on the linear mixed effect regression model is described as follow:
where represents the city covering 73 Chinese cities, and is the time index corresponding to the period from 2002 to 2012. Other variables are similar as denoted in the Equations (9) and (10).
4. Data
According to the above model, the empirical analysis requires data of population, real GDP per capita, urbanization, share of industry in GDP, energy consumption structure, and CO2 emissions for each sample city during the period of 2002–2012. Table 1 shows a list of variables with an explanation. In particular, real GDP per capita in each city is deflated by the region purchasing power parity (PPP) index [35], and the city’s GDP deflator index that comes from China Statistical Yearbook for Regional Economy during the period of 2002–2012.

Table 1.
Declaration of independent variables.
Table 2 gives the descriptive statistics of the above variables, mainly on their means and standard deviations across 73 cities. Mean of average annual resident population increases from 572.60 in 2002 to 651.90 in 2012, with a rise in its standard deviation. Concerning the urbanization and industry structure, we notice that their average levels steadily raise, and that the standard deviations almost-invariably change, which indicates that all cities are synchronous in terms of urbanization as well as industry structure. On the aspects of energy consumption structure, a presence of minor changes in both mean and standard deviation is probably due to the fact that some cities have made an improvement on energy consumption structure.

Table 2.
Mean and standard deviation of variables across cities in each year.
5. Empirical Results
5.1. Model Selection
To estimate the linear mixed effect model as shown in Equation (11), the first step is model specification, i.e., to determine which effect should be treated as fixed and which one as random. A commonly used method is to firstly consider different combinations of both fixed and random effects, and then achieve model selection based on a certain criteria [36]. Considering that we aim to examine the influence of factors on carbon emissions in Chinese cities, the fixed effect design matrix is composed of all the independent variables as listed in Table 1. As for the random effect design matrix, since we have no idea about the exact factors whose influences will differ significantly from city to city, an appropriate method is to set several forms of the random effect design matrix as alternative options. As shown in Table 3, the CORREML1 model only contains the intercept of the random effect. Each new model includes a new variable until the intercept and full independent variables are all included in the CORREML7 model. We also assume that the new variable added in the random effect design matrix is correlated with the previous part.

Table 3.
Alternative options of random effect design matrix.
To identify the favored model, it is better to use multiple criterion [34,37,38]. The criterion of the Akaike Information Criterion (AIC) [39] and Bayesian Information Criterion (BIC) [40] have been widely used, both of which penalize the deviance, but in different ways. Their small values correspond to optimal models in alternative options. We calculate the AIC and BIC for each possible model stated in Table 3. As the number of variables contained in random effect design matrix increases, the values of AIC and BIC all decrease (see Figure 5). Accordingly, the CORREML7 model is the optimal model. Thus, our final model has seven independent variables in the fixed effects design matrix and seven correlated variables in random effect design matrix, which is exactly as shown in Equation (11).
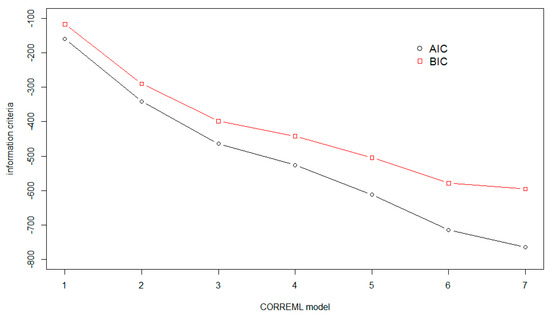
Figure 5.
Information criteria values of CORREML models. Note: the x-axis represents for CORREML model from 1 to 7 in Table 3. The y-axis represents information criteria. The black circles represents for AIC criterion. The red squares represent for BIC criterion. Smaller value for both AIC and BIC means better choice in model selection.
5.2. Empirical Results
The model established in Equation (11) is estimated by MATLAB software. To avoid biased estimation of variance-covariance matrix D of random effect, we used the Restricted Maximum Likelihood method (REML), which is considered more powerful than Maximum Likelihood (ML) [33,41]. The estimated results include both fixed-effect parameters and random-effect parameters, details of which will be presented.
Table 4 displays the estimations of fixed-effect parameters, i.e., (i = 1, 2, ..., 6), each of which represent an overall impact on CO2 emissions. As can be seen, population size, secondary industry proportion, energy structure, urbanization level and economic level positively influence CO2 emission on average in Chinese cities, but urbanization level is not significant of CO2 emission. This conclusion is consistent with previous studies [14,15,16,17]. Concerning the variable of GDP per capita, both the linear term and the quadratic term are statistically significant. This output well testifies to the existence of the Kuznets curve, which means that, from an overall aspect, carbon emission will first increase then decrease with the growth of GDP per capita.

Table 4.
Estimated fixed-effect parameters.
Population size has a distinctive positive influence on the CO2 emissions in China’s 73 cities. The elastic coefficient of population scale is 0.585 on average, which refers to the responsiveness of CO2 emissions to a change in population size. This coefficient, being less than 1.0, is indicative of an inelastic relationship, where the impact is less responsive to changes in the driving force. A one percent increase in the share of the industrial sector in the economy raises carbon emissions by 0.567% on average. The rapid development in industrialization in China drives the growth of energy consumption and further promotes a rapid increase in CO2 emissions. The elastic coefficient of CO2 emissions to energy consumption structure is 0.204 on average, which means that every 1% increase in the share of coal consumption results in a 0.204% increase in CO2 emissions. As for GDP per capita, it contributes a rather prominent influence on the CO2 emissions in 73 Chinese cities with an elastic coefficient of , which can be deduced from the partial derivative of lncar with respect to lngdpp, . This implies that the elastic coefficient of carbon emissions to GDP per capita is negatively affected by GDP per capita, and there is an inverted U-shaped relationship between carbon emissions and economic growth.
As can be seen, GDP per capita is the most influencing factor. Additionally, the quadratic term of GDP per capita contributes a negative effect. This means that EKC exists in CO2 emissions in China with the growth of GDP per capita. The result indicates that as per capita income increases, per capita CO2 emission first increases at low income level and then slightly decrease.
In a linear mixed effect model, there exists a basic assumption for random-effect parameters, i.e., zero mean and D variance, where D is a non-zero variance-covariance matrix. The assumption indicates that the averaged influence of each variable is equal to the fixed effects, whereas the specific influences by city differ from each other and correlate to each other. We report both the standard deviation and the correlation coefficient for random effects parameters in the CORREML7 model (see Table 5). The diagonal of this matrix displays the standard deviation of each variable, most of which are away from zero except for the variable of urbanization. The lower triangle displays the random-effect parameters’ correlation between each other. The correlation values in bold (e.g., correlation of lnenc and lngdpp is −0.686) support the assumption that random effect parameters correlate to each other.

Table 5.
Estimated standard deviation and correlation for random-effect parameters.
In order to report the specific impact pattern embedded in one city, the mixed effect should be determined according to the above estimations. For each city, we add up the estimations of the overall fixed-effect parameter and random-effect parameter, and therefore, obtain 73 coefficients for each variables which are the so-called mixed effects. A boxplot of the mixed effects by six variables is shown in Figure 6. Apparently, urbanization has the least variety from city to city, and then comes energy consumption and the quadratic term of GDP per capita. The linear term of GDP per capita varies dramatically in different cities, after which are industrialization and population.
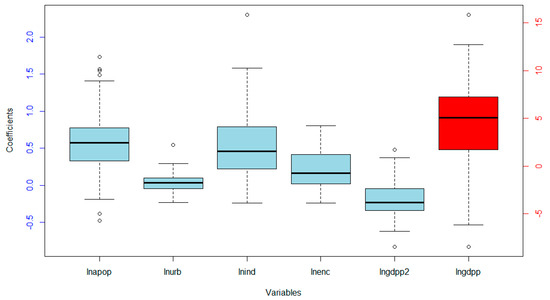
Figure 6.
Mixed effects of each variable. Note: The left y-axis marked in blue show the variety of lnapop, lnurb, lnind, lnenc and (lngdpp)2 ranged from −1 to 2.5. The right y-axis marked in red show the variety of lngdpp ranged from −10 to 15.
To make it clearer, we further summarized some descriptive statistics of mixed effects in Table 6. As can be seen, the mixed effects for each variable varies from city to city. For example, the confidence interval of the mixed effect for population size covers the range from −0.189 to 1.408. This proves the presence of the heterogeneity embedded in the effect of population growth, industry structure, energy consumption structure, and per capita income across Chinese cities. Accordingly, the linear mixed effect model enables us to analyze the different impact pattern of CO2 emissions for each sample city.

Table 6.
Descriptive statistics of each variable’s mixed effects in 73 cities’ models.
It is particularly worthy of our attention that, for each sample city, the nonlinear relationship between CO2 emissions and economic growth is distinct, according to the non-zero standard deviations for the quadratic term of GDP per capita. In other words, the phenomenon of EKC varies across the sample cities. Commonly, the emission curve linked with GDP per capita is assumed as an inverted U-type structure. Accordingly, the estimated coefficients for the quadratic term of GDP per capita should be negative. However, we surprisingly noticed some estimated results in the opposite direction (see the positive upper whisker of (lngdpp)2). This indicates that there exists a group of 14 cities with a U-shaped relationship between CO2 emissions and economics; this phenomenon has already been well discussed in [42], who argues that the emission curves for such cities are very likely to be associated with a cubic term of GDP per capita and, therefore, experience a U-shaped stage first and then an inverted U-shaped stage. Due to this special impact pattern, such cities form a group, named Group I.
As for the rest of the sample cities, all of which are associated with inverted U-shaped emission curves, we are highly concerned about when each city will reach its carbon emissions peak. We try to figure out the answer using the economic development level variable, i.e., GDP per capita. According to the model established in Equation (11), for the i-th sample city, GDP per capita corresponding to the emission peak can be estimated by . Taking Shanghai city as an example, it is estimated that its peak-value CO2 emission will occur along with its GDP per capita arriving at 93,357.2 Yuan (Beijing price in 2002). The histogram of estimated results for all sample cities except for cities in Group I are shown in Figure 7. A remarkable appearance of bimodal distribution is observed, with a boundary of lngdpp approximately equal to 12. Based on this observation, the remaining 59 cities naturally form two groups, i.e., Group II (lngdpp less than 12) and Group III (lngdpp no less than 12).
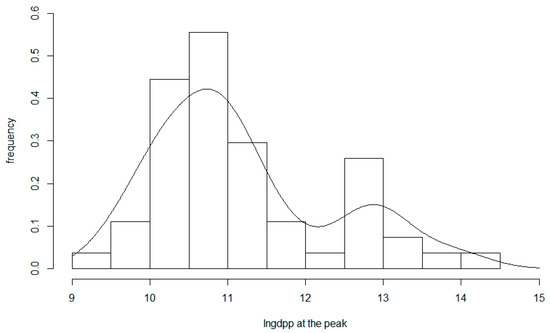
Figure 7.
Distribution of lngdpp at carbon emission peak for sample cities in Group II and Group III (with inverted U-shaped emission curves).
As a consequence, the whole sample is now classified into three city groups, each with a unique feature associated with its nonlinear relationship between carbon emission and economic development level. The next question is whether these three groups are distinct from each other in terms of other factors, including population size, urbanization, industrialization, and energy consumption structure. Figure 8 displays the average mixed effects of each group for these four variables. Additionally, we report the average values of all variable involved in our models as well as the estimated GDP per capita at emission peaks for each of the three groups (see Table 7). Apparently, there are many striking differences among the three groups.
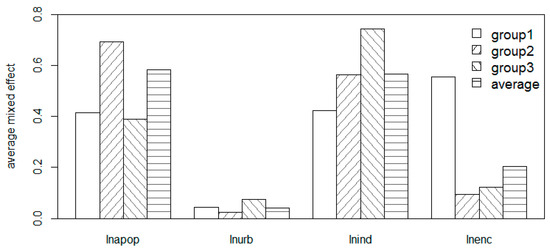
Figure 8.
Average mixed effects of each group for population size, urbanization, industrialization, and energy structure.

Table 7.
Mean values of each city group in terms of five variables and the estimated GDP per capita at the emission peak.
First, a remarkably superior contribution from the energy consumption structure is detected in Group I, i.e., the city group with U-shaped emission curve. It indicates that a one percent point increase in energy consumption structure for Group I leads to much more growth of carbon emissions than for Group II or Group III. According to Table 7, the averaged energy consumption structure of Group I in 2012 is 68.59%, whereas the average values of the other two groups are much lower, respectively 51.28% and 50.77% (see Table 7). Therefore, the major task for cities in Group I is to improve its energy structure.
Second, Group II is significantly different from other two groups at the aspect of strong population effect but weak urbanization and energy structure effect on carbon emissions (see Figure 8). Generally speaking, the factors of population size and industrialization will show their prominent influence on emissions, after the energy structure has been improved to a better condition. Therefore, it provides benefits for cities in Group II in terms of emission reduction to control their population sizes as well as to improve industry structure. Additionally, the difference between actual GDP per capita and estimated GDP per capita at emission peak is around 20,000 yuan (see Table 7). This indicates that cities in this group need a fast pace in terms of economic development in order to achieve the target of emission reduction. Since a smaller population size will contribute to a higher level of GDP per capita, a good way for these cities to achieve emission reduction is to control their population sizes as well as to improve industry structure.
Third, Group III shows its unique characteristics of relatively higher industrialization impact on emissions and the highest industrial proportions (see Figure 8 and Table 7, respectively). As is known to all, a larger proportion of secondary industry contributes to a higher level of economic development, and eventually gives rise to more carbon emissions. Hence, it is key to make an improvement in industrial structure for cities in Group III. Concerning the large gap between the actual GDP per capita and the estimated GDP per capita at the emission peak, we suspect that cities in Group III probably will not achieve their emission peaks through the standard trajectory of EKC.
6. Conclusions
In this paper, we estimate carbon emissions from energy consumption, major industrial product production, urban garbage disposal, and carbon sink ability for 73 cities in China from 2002 to 2012 according to the GPC. The estimation results show that CO2 emissions in Chinese cities increased annually and heterogeneously, and that multimodality probably exists in the cross-city emission distribution. Accordingly, we use a linear mixed effect model for the extended STIRPAT model, and examine the determinants of the cross-city CO2 emissions. Some important conclusions are drawn.
First, we found that population size, secondary industry proportion, energy structure, urbanization level and economic level positively influence CO2 emission on average in Chinese cities. However, urbanization level is of no significance. No evidence has been provided in support of the urban compaction theory. The major reason probably lies in the fact that Chinese cities are at low levels of GDP per capita [6].
Another finding of this paper is that EKC exists in CO2 emissions with the growth of GDP per capita, from a macro point of view. On average, the emission peak will arrive when GDP per capita hits 94,749.4 yuan. However, EKCs are different across cities. Accordingly, three city groups are formed. For each city group, unique patterns exist not only on the nonlinear relationship between GDP and emission but also on the influence effects from factors of industry structure, energy consumption structure and population size. We propose some policies for decreasing carbon emission in China according to our research. First, we should tolerate the diversity of time it takes to reach the carbon emission peak, for there exist different economy-emission types among cities. The three groups mentioned above clearly show the variety of GDP per capita at the carbon emission peak, bringing out a distinct gap contrast to real GDP per capita in 2012. This takes quite a different time to reach the gap for each city. Second, each city should adopt a self-adaption strategy to reduce its carbon emissions. Our research reveals that the determinant of carbon emissions in cities are not the same, which was controlled by cities’ characteristics. The growth of GDP per capita still matters significantly to carbon emission, as the existence of the EKC curve proved in cities that transfer the reduction target of carbon emission into the growth target of GDP per capita. At the same time, other factors should be taken into account by importance ranking and kept in a reasonable range. Nevertheless, such classification is just a preliminary result. Rigorous augmentations of it will become the focus of study in future research.
Acknowledgments
This work was financially supported in part by the National Natural Science Foundation of China (Grant No. 71401192, 71420107025, 71371021, 71333014, 11501586) and the National High Technology Research and Development Program of China (863 Program, Grant No. SS2014AA012303). The first author would also like to thank the supports of the Generalized Virtual Economy Research Program of China (Grant No. GX2014-1007(M)) and Beijing Planning Program of Philosophy and Social Science (Grant No. 11JGC102).
Author Contributions
Haitao Zheng conceived and designed the empirical study; Jie Hu performed the empirical study; Rong Guan analyzed the data; Shanshan Wang contributed analysis tools; Rong Guan, Jie Hu and Haitao Zheng wrote the paper.
Conflicts of Interest
The authors declare no conflict of interest.
References
- Carlsson, F.; Lundström, S. The Effects of Economic and Political Freedom on CO2 Emissions; Economic Studies, Department of Economics, School of Economics and Commercial Law, Göteborg University: Gothenburg, Sweden, 2003; p. 79. [Google Scholar]
- Quadrelli, R.; Peterson, S. The energy–climate challenge: Recent trends in CO2 emissions from fuel combustion. Energy Policy 2007, 35, 5938–5952. [Google Scholar] [CrossRef]
- Shi, A. The impact of population pressure on global carbon dioxide emissions, 1975–1996: Evidence from pooled cross-country data. Ecol. Econ. 2003, 44, 29–42. [Google Scholar] [CrossRef]
- Fan, Y.; Liu, L.-C.; Wu, G.; Wei, Y.-M. Analyzing impact factors of CO2 emissions using the stirpat model. Environ. Impact Assess. Rev. 2006, 26, 377–395. [Google Scholar] [CrossRef]
- Liao, H.; Cao, H.-S. How does carbon dioxide emission change with the economic development? Statistical experiences from 132 countries. Glob. Environ. Chang. 2013, 23, 1073–1082. [Google Scholar] [CrossRef]
- Poumanyvong, P.; Kaneko, S. Does urbanization lead to less energy use and lower CO2 emissions? A cross-country analysis. Ecol. Econ. 2010, 70, 434–444. [Google Scholar] [CrossRef]
- Lin, S.; Zhao, D.; Marinova, D. Analysis of the environmental impact of China based on stirpat model. Environ. Impact Assess. Rev. 2009, 29, 341–347. [Google Scholar] [CrossRef]
- Zhu, Q.; Peng, X.; Lu, Z.; Yu, J. Analysis model and empirical study of impacts from population and consumption on carbon emissions. China Popul. Resour. Environ. 2010, 20, 98–102. [Google Scholar]
- Li, H.; Mu, H.; Zhang, M.; Gui, S. Analysis of regional difference on impact factors of China’s energy–related CO2 emissions. Energy 2012, 39, 319–326. [Google Scholar] [CrossRef]
- Song, X.; Zhang, Y.; Wang, Y.; Feng, Y. Analysis of impacts of demographic factors on carbon emissions based on the ipat model. Res. Environ. Sci. 2012, 5, 109–115. [Google Scholar]
- Li, H.; Mu, H.; Zhang, M.; Li, N. Analysis on influence factors of China’s CO2 emissions based on path–stirpat model. Energy Policy 2011, 39, 6906–6911. [Google Scholar] [CrossRef]
- Zhu, Q.; Peng, X. The impacts of population change on carbon emissions in China during 1978–2008. Environ. Impact Assess. Rev. 2012, 36, 1–8. [Google Scholar] [CrossRef]
- Wei, T. What stirpat tells about effects of population and affluence on the environment? Ecol. Econ. 2011, 72, 70–74. [Google Scholar] [CrossRef]
- Wang, M.; Che, Y.; Yang, K.; Wang, M.; Xiong, L.; Huang, Y. A local-scale low-carbon plan based on the stirpat model and the scenario method: The case of minhang district, shanghai, china. Energy Policy 2011, 39, 6981–6990. [Google Scholar] [CrossRef]
- Shao, S.; Yang, L.-L.; Cao, J.-H. Study on influencing factors of CO2 emissions from industrial energy consumption: An empirical analysis based on stirpat model and industrial sectors’ dynamic panel data in Shanghai. J. Financ. Econ. 2010, 11, 16–27. [Google Scholar]
- Wang, Z.; Yin, F.; Zhang, Y.; Zhang, X. An empirical research on the influencing factors of regional CO2 emissions: Evidence from Beijing city, China. Appl. Energy 2012, 100, 277–284. [Google Scholar] [CrossRef]
- Wang, P.; Wu, W.; Zhu, B.; Wei, Y. Examining the impact factors of energy-related CO2 emissions using the stirpat model in Guangdong province, China. Appl. Energy 2013, 106, 65–71. [Google Scholar] [CrossRef]
- Liang, J.; Zheng, W.; Cai, J. The decomposition of energy consumption growth in China: Based on input–output model. J. Natl. Resour. 2007, 22, 853–864. [Google Scholar]
- Ehrlich, P.; Holdren, J. The people problem. Saturday Rev. 1970, 4, 42–43. [Google Scholar]
- Ehrlich, P.; Holdren, J. A bulletin dialogue on the ‘closing circle’. Critique: One dimensional ecology. Bull. At. Sci. 1972, 28, 16–27. [Google Scholar]
- Dietz, T.; Rosa, E.A. Rethinking the environmental impacts of population, affluence and technology. Hum. Ecol. Rev. 1994, 1, 277–300. [Google Scholar]
- York, R.; Rosa, E.A.; Dietz, T. Stirpat, ipat and impact: Analytic tools for unpacking the driving forces of environmental impacts. Ecol. Econ. 2003, 46, 351–365. [Google Scholar] [CrossRef]
- Zhang, Z. Why did the energy intensity fall in China’s industrial sector in the 1990s? The relative importance of structural change and intensity change. Energy Econ. 2003, 25, 625–638. [Google Scholar] [CrossRef]
- Ang, B.W. The lmdi approach to decomposition analysis: A practical guide. Energy Policy 2005, 33, 867–871. [Google Scholar] [CrossRef]
- Wang, C.; Chen, J.; Zou, J. Decomposition of energy-related CO2 emission in China: 1957–2000. Energy 2005, 30, 73–83. [Google Scholar] [CrossRef]
- Tan, Z.; Li, L.; Wang, J.; Wang, J. Examining the driving forces for improving China’s CO2 emission intensity using the decomposing method. Appl. Energy 2011, 88, 4496–4504. [Google Scholar] [CrossRef]
- Liu, X.Q.; Ong, H.L. The application of the divisia index to the decomposition of changes in industrial energy consumption. Energy J. 1992, 13, 161–178. [Google Scholar] [CrossRef]
- Ang, B.W.; Liu, F.L.; Chung, H.S. A generalized fisher index approach to energy decomposition analysis. Energy Econ. 2004, 26, 757–763. [Google Scholar] [CrossRef]
- Kaya, Y. Impact of Carbon Dioxide Emission Control on GNP Growth: Interpretation of Proposed Scenarios; IPCC Energy and Industry Subgroup, Response Strategies Working Group: Paris, France, 1990; Volume 76. [Google Scholar]
- Yang, S. Primary study on effect of C-O balance of afforestatal trees in cities. Urban Environ. Urban Ecol. 1996, 1, 37–39. [Google Scholar]
- Rosa, E.A.; Dietz, T. Climate change and society speculation, construction and scientific investigation. Int. Sociol. 1998, 13, 421–455. [Google Scholar] [CrossRef]
- Eisenhart, C. The assumptions underlying the analysis of variance. Biometrics 1947, 3, 1–21. [Google Scholar] [CrossRef] [PubMed]
- Laird, N.M.; Ware, J.H. Random-effects models for longitudinal data. Biometrics 1982, 963–974. [Google Scholar] [CrossRef]
- West, B.T.; Welch, K.B.; Galecki, A.T. Linear Mixed Models: A Practical Guide Using Statistical Software; CRC Press: Boca Raton, FL, USA, 2014. [Google Scholar]
- Huang, J. Regional Price Difference and Calculation of the Regional Economic Disparity; Jinan University: Guangzhou, China, 2010. [Google Scholar]
- Hsiao, C.; Sun, B.-H. To pool or not to pool panel data. In Panel Data Econometrics: Future Directions; Springer: Berlin/Heidelberg, Germany, 2000. [Google Scholar]
- Gurka, M.J. Selecting the best linear mixed model under reml. Am. Stat. 2006, 60, 19–26. [Google Scholar] [CrossRef]
- Steele, R. Model selection for multilevel models. In The Sage Handbook of Multilevel Modeling; Scott, M.A., Simonoff, J.S., Marx, B.D., Eds.; SAGE Publications Ltd.: London, UK, 2013. [Google Scholar]
- Akaike, H. Information theory and an extension of the maximum likelihood principle. Int. Symp. Inform. Theory 1973, 1, 610–624. [Google Scholar]
- Schwarz, G. Estimating the dimension of a model. Ann. Stat. 1978, 6, 15–18. [Google Scholar] [CrossRef]
- Harville, D.A. Bayesian inference for variance components using only error contrasts. Biometrika 1974, 61, 383–385. [Google Scholar] [CrossRef]
- Martinez-Zarzoso, I.; Maruotti, A. The environmental kuznets curve: Functional form, time-varying heterogeneity and outliers in a panel setting. Environmetrics 2013, 24, 461–475. [Google Scholar] [CrossRef]
© 2016 by the authors; licensee MDPI, Basel, Switzerland. This article is an open access article distributed under the terms and conditions of the Creative Commons Attribution (CC-BY) license (http://creativecommons.org/licenses/by/4.0/).