
Integrating Big Data into a Sustainable Mobility Policy 2.0 Planning Support System


Abstract
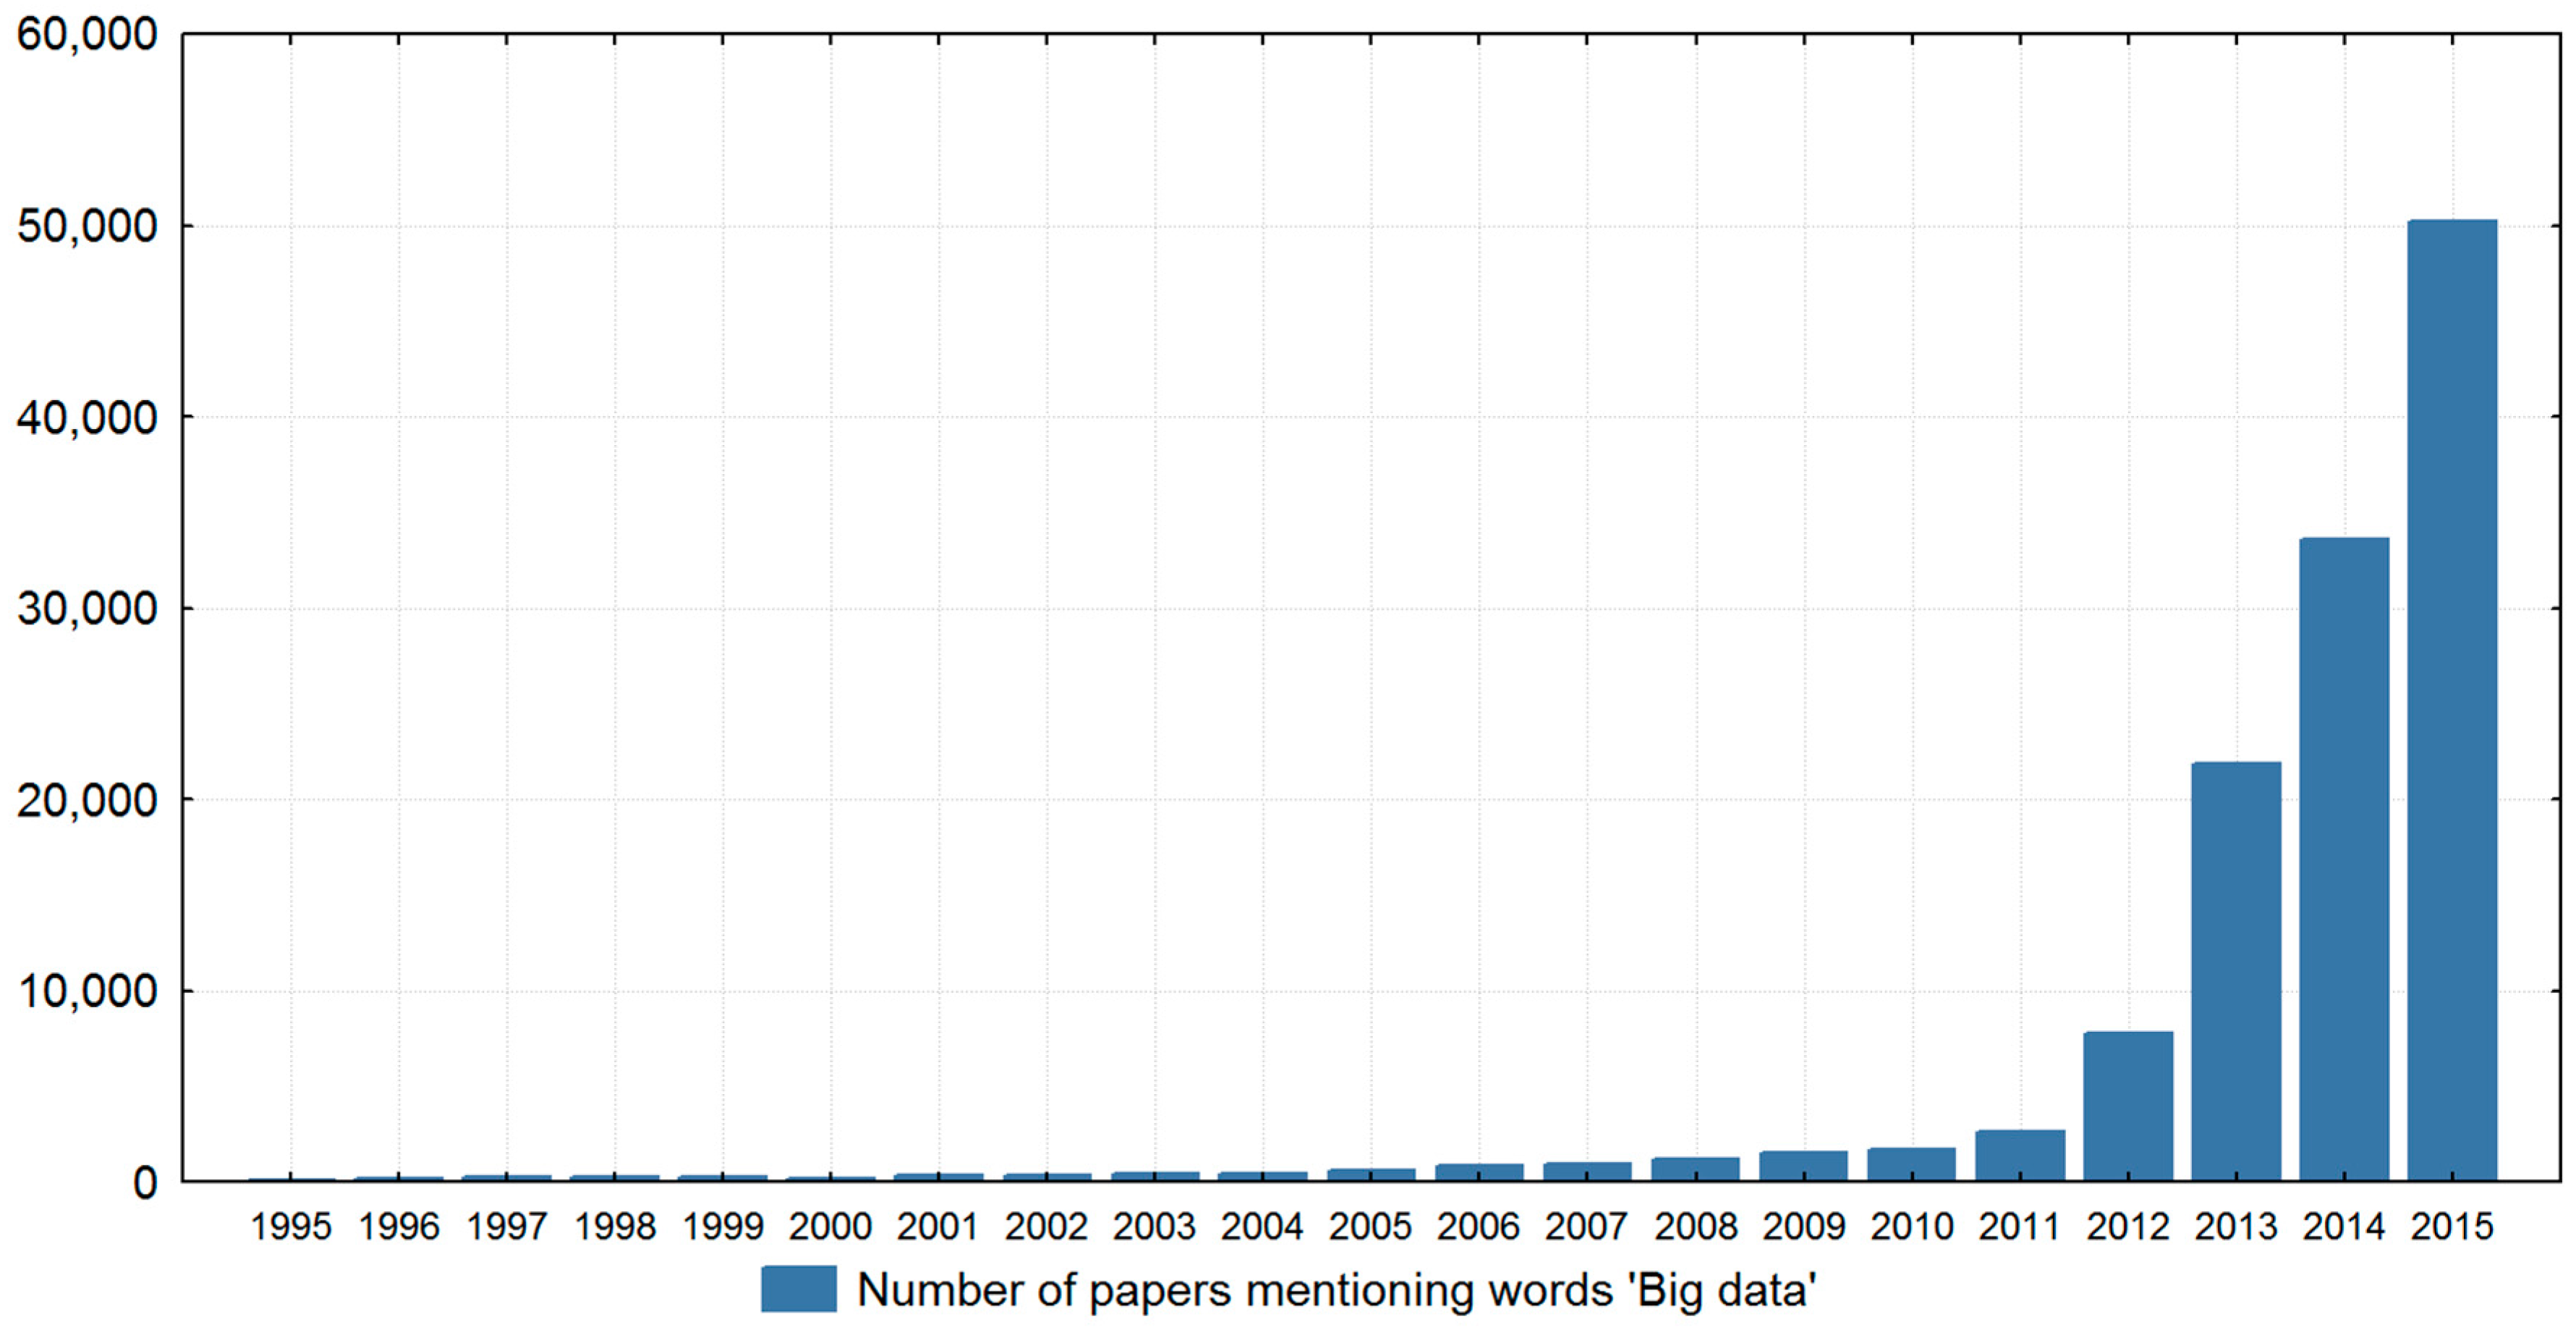
:1. Introduction
2. Policy 2.0
- Strategic activities by providing high level aggregated information that is extracted from user generated big data. Hence, such data are able to give insight into long term time series (e.g., spatial movements of population or environmental conditions) and ensure effective use of prediction models to support long-term planning.
- Tactical decision making by ensuring coverage of diverse aspects of user related activities. Thus big data are being able to support different administrative departments with relevant information needed to implement strategic decisions (e.g., evaluating infrastructure and how it operates, establishing communication channels, structuring workflows, acquisition of resources, etc.).
- Operational decisions by supporting day-to-day operations with short-term horizon insights (e.g., real time information on the status of public transport service).
3. Policy 2.0 Platform
3.1. Sustainable Mobility Campaign
- Extent to which a person believes that the behaviour in question is under his or her control;
- Person’s attitude toward the behaviour; and
- Perceived social pressure to perform or not to perform the behaviour in question.
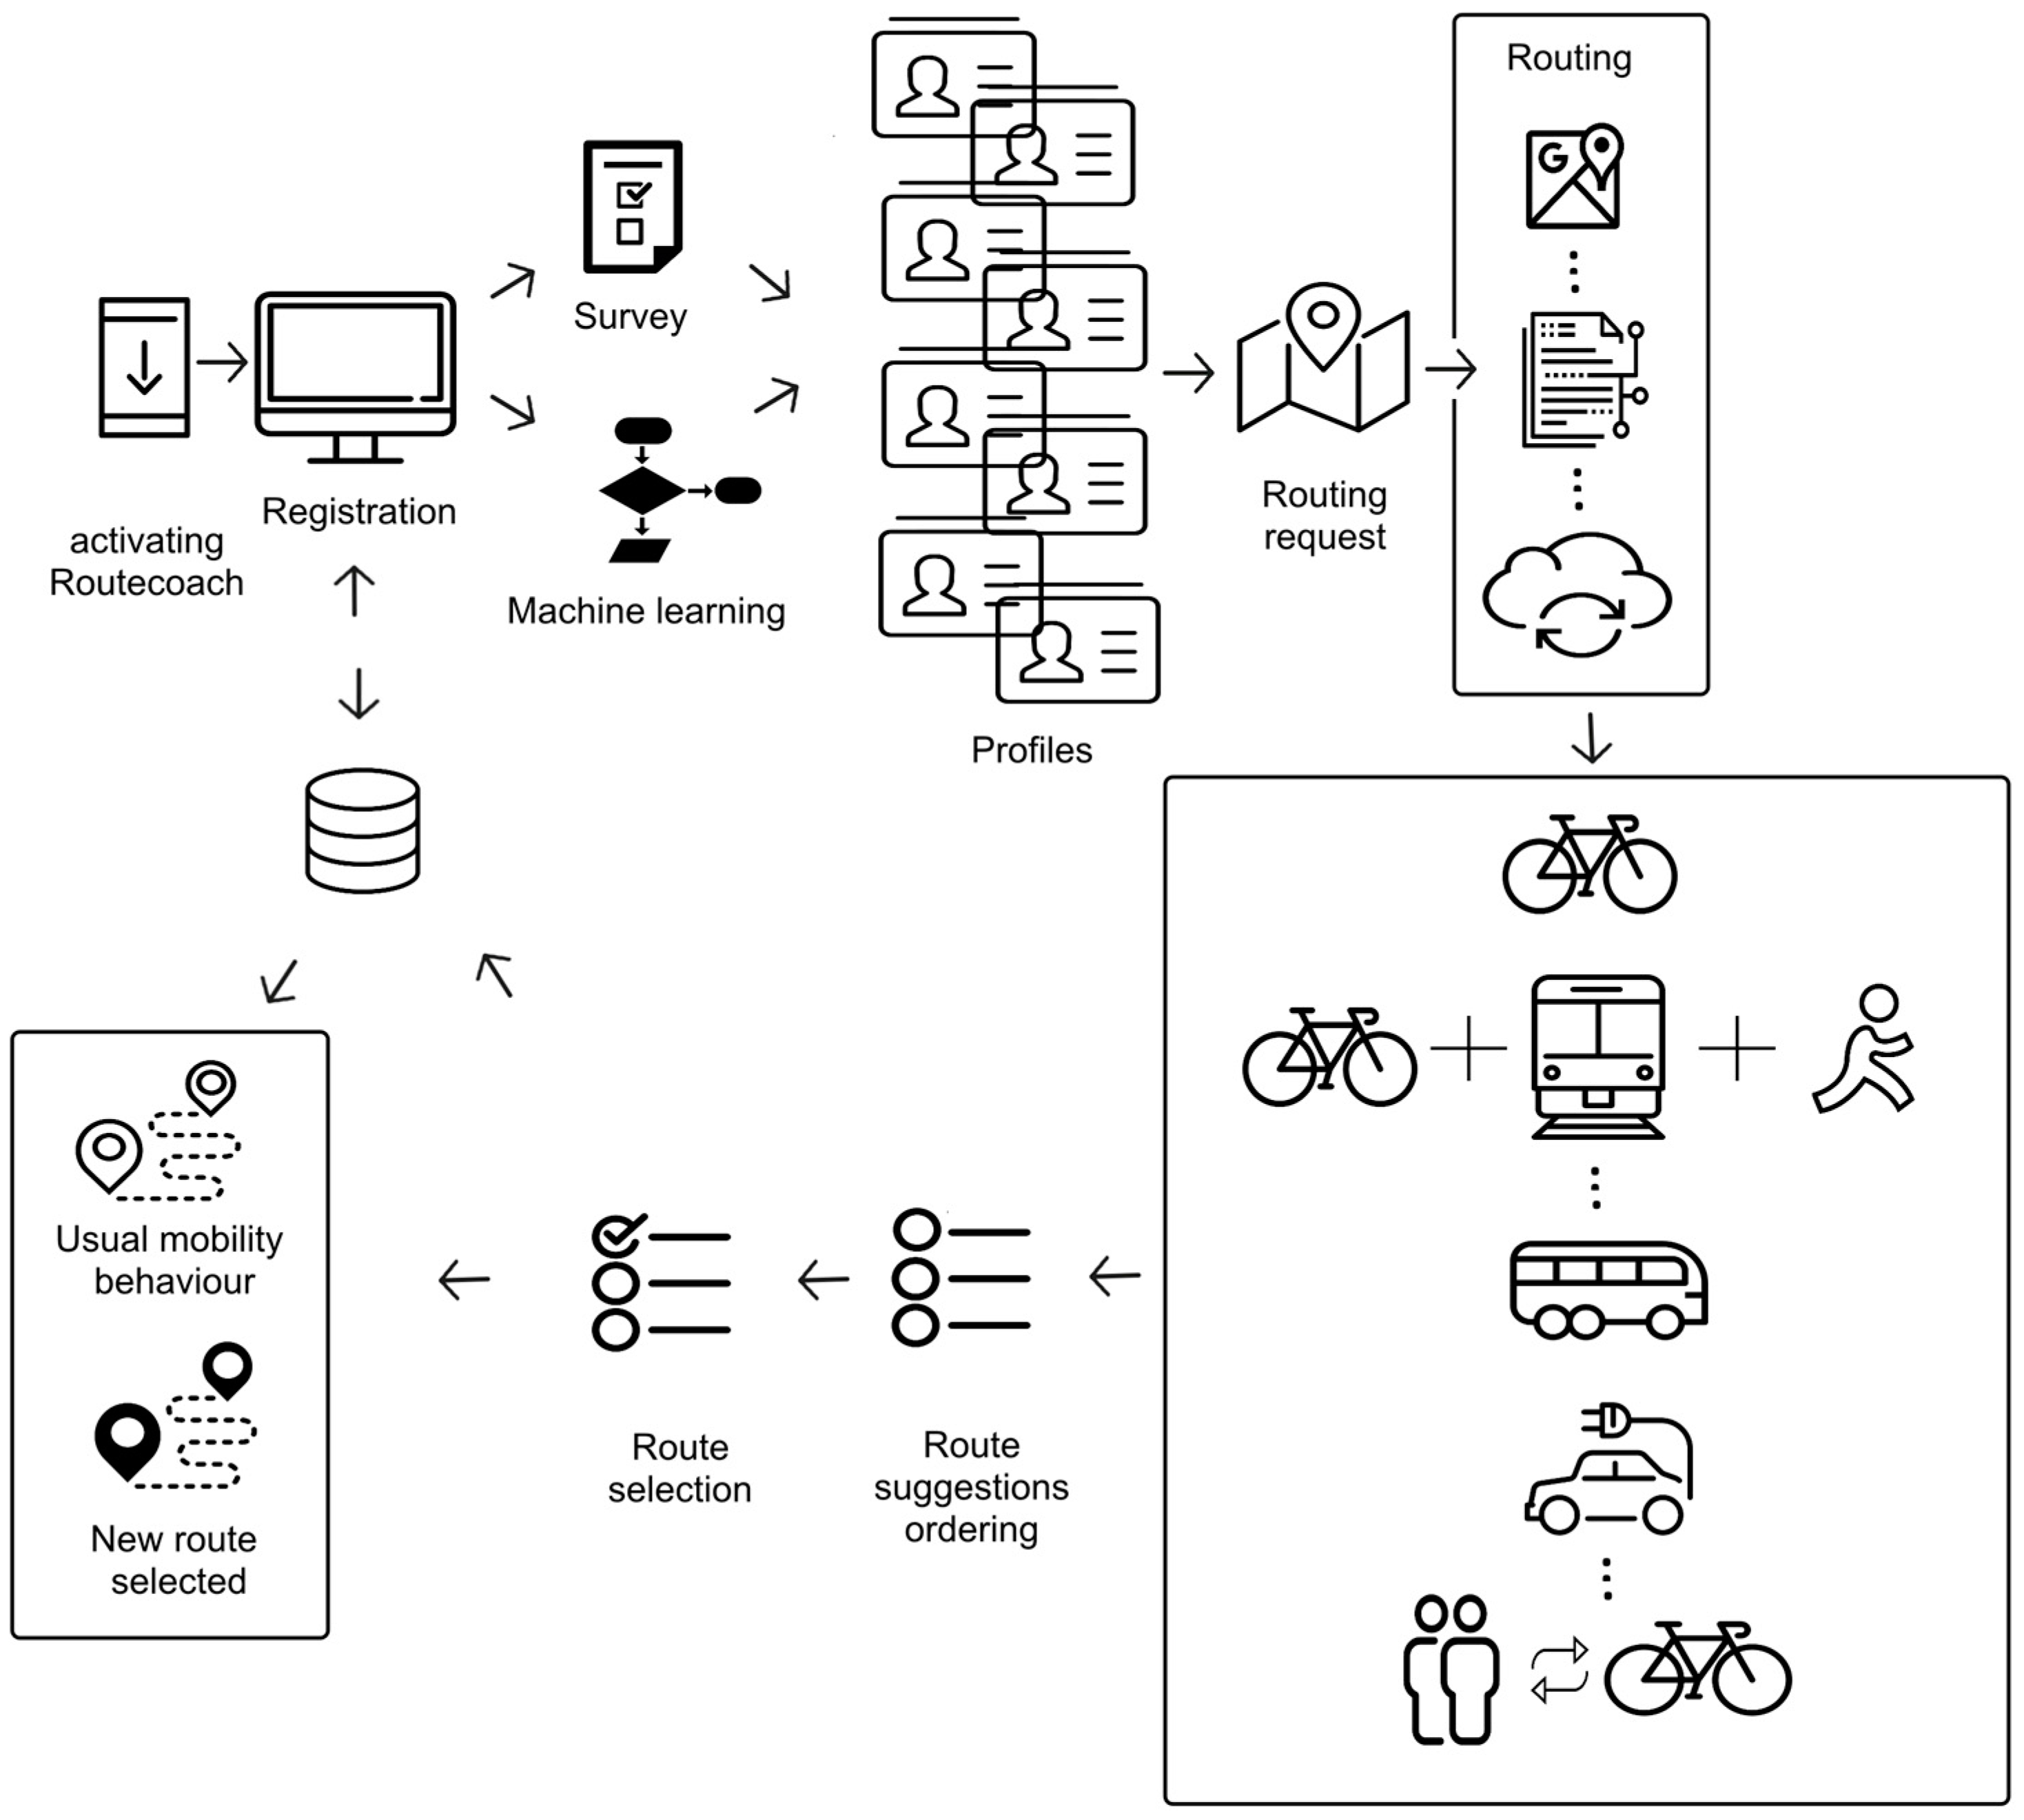
3.2. Data Collection
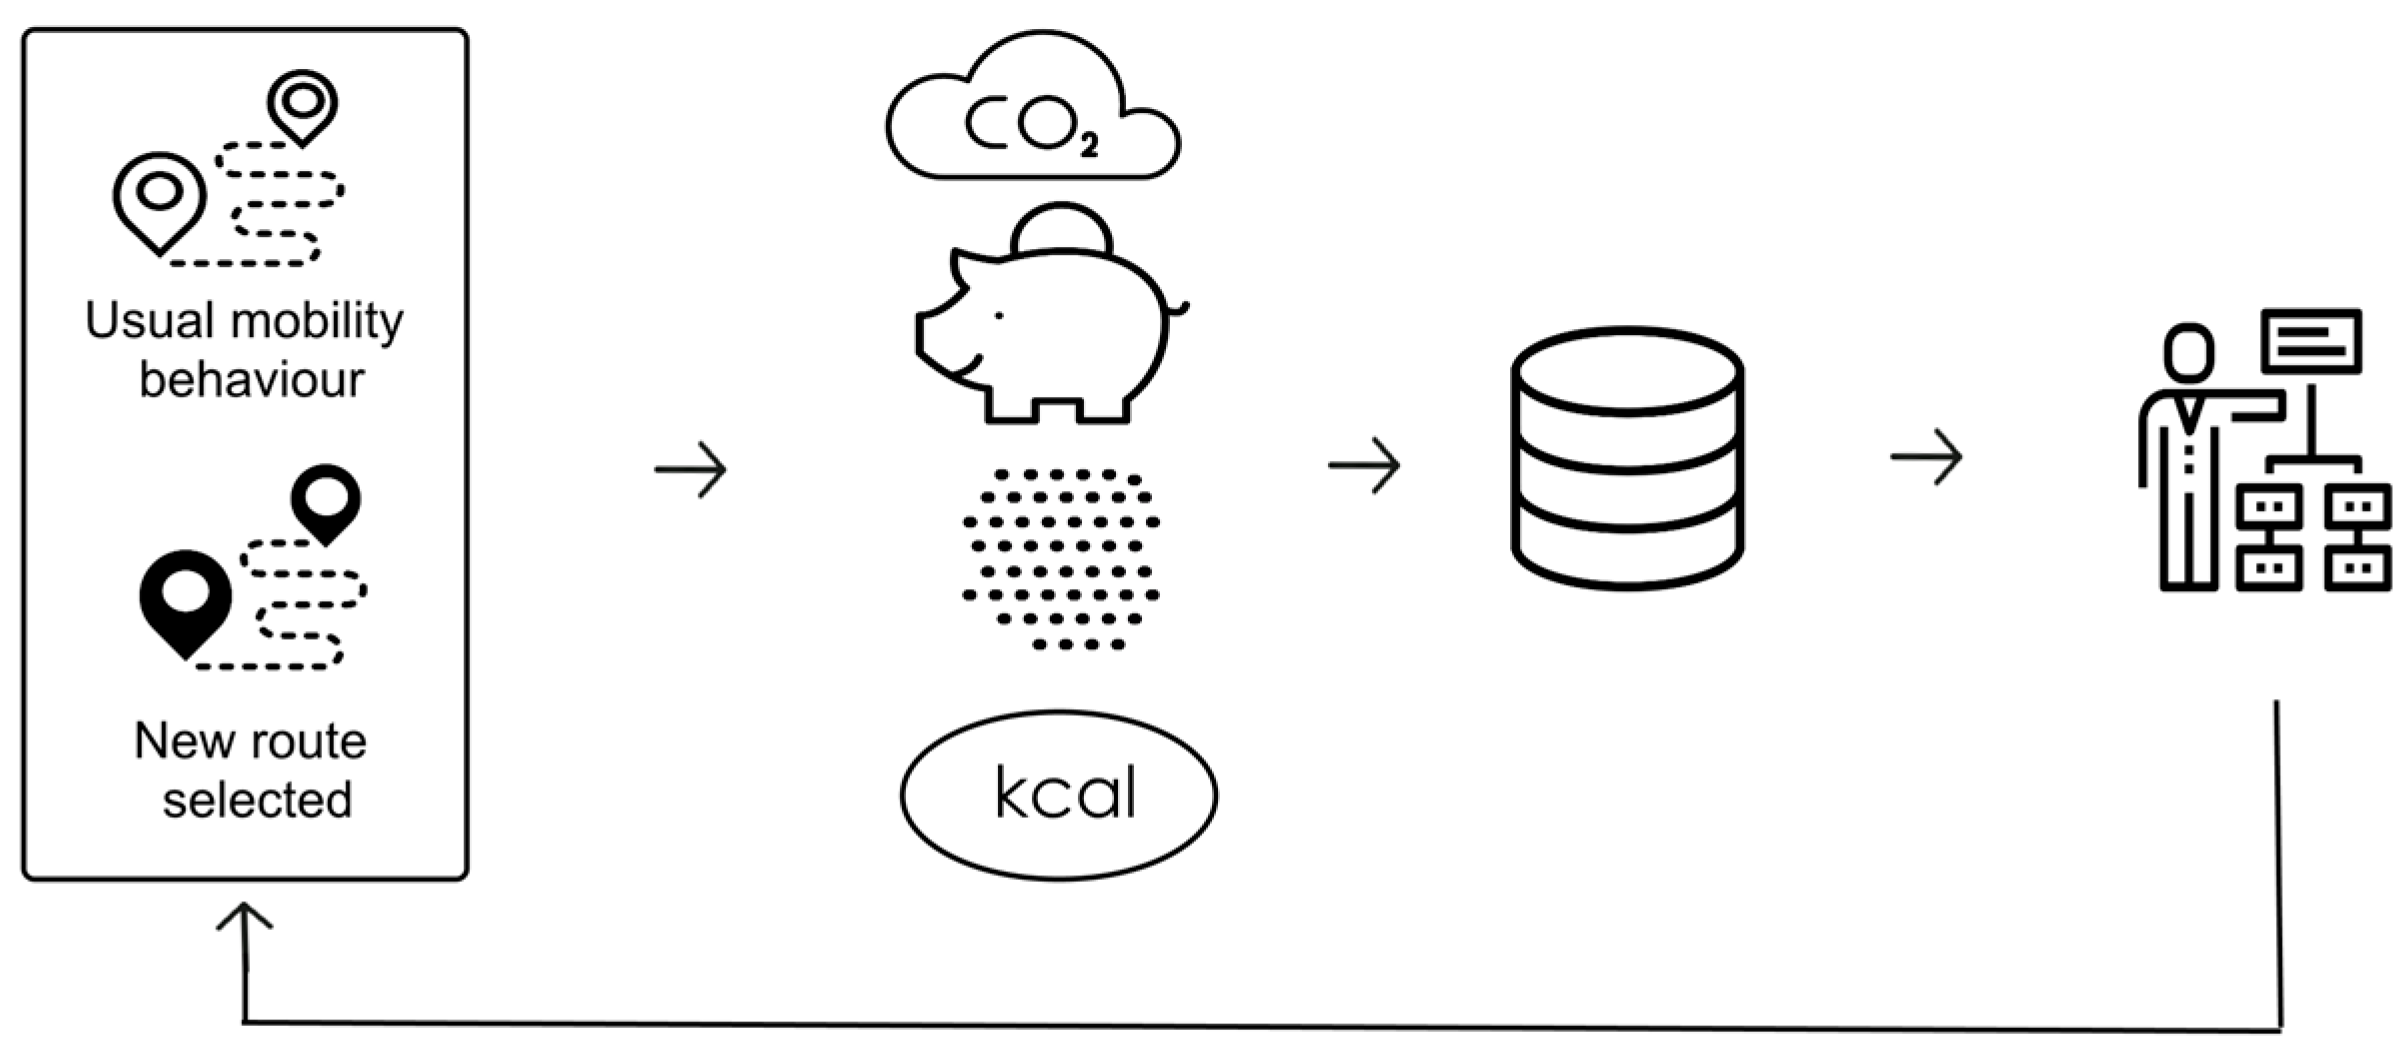
3.3. Big Data Driven Insignts
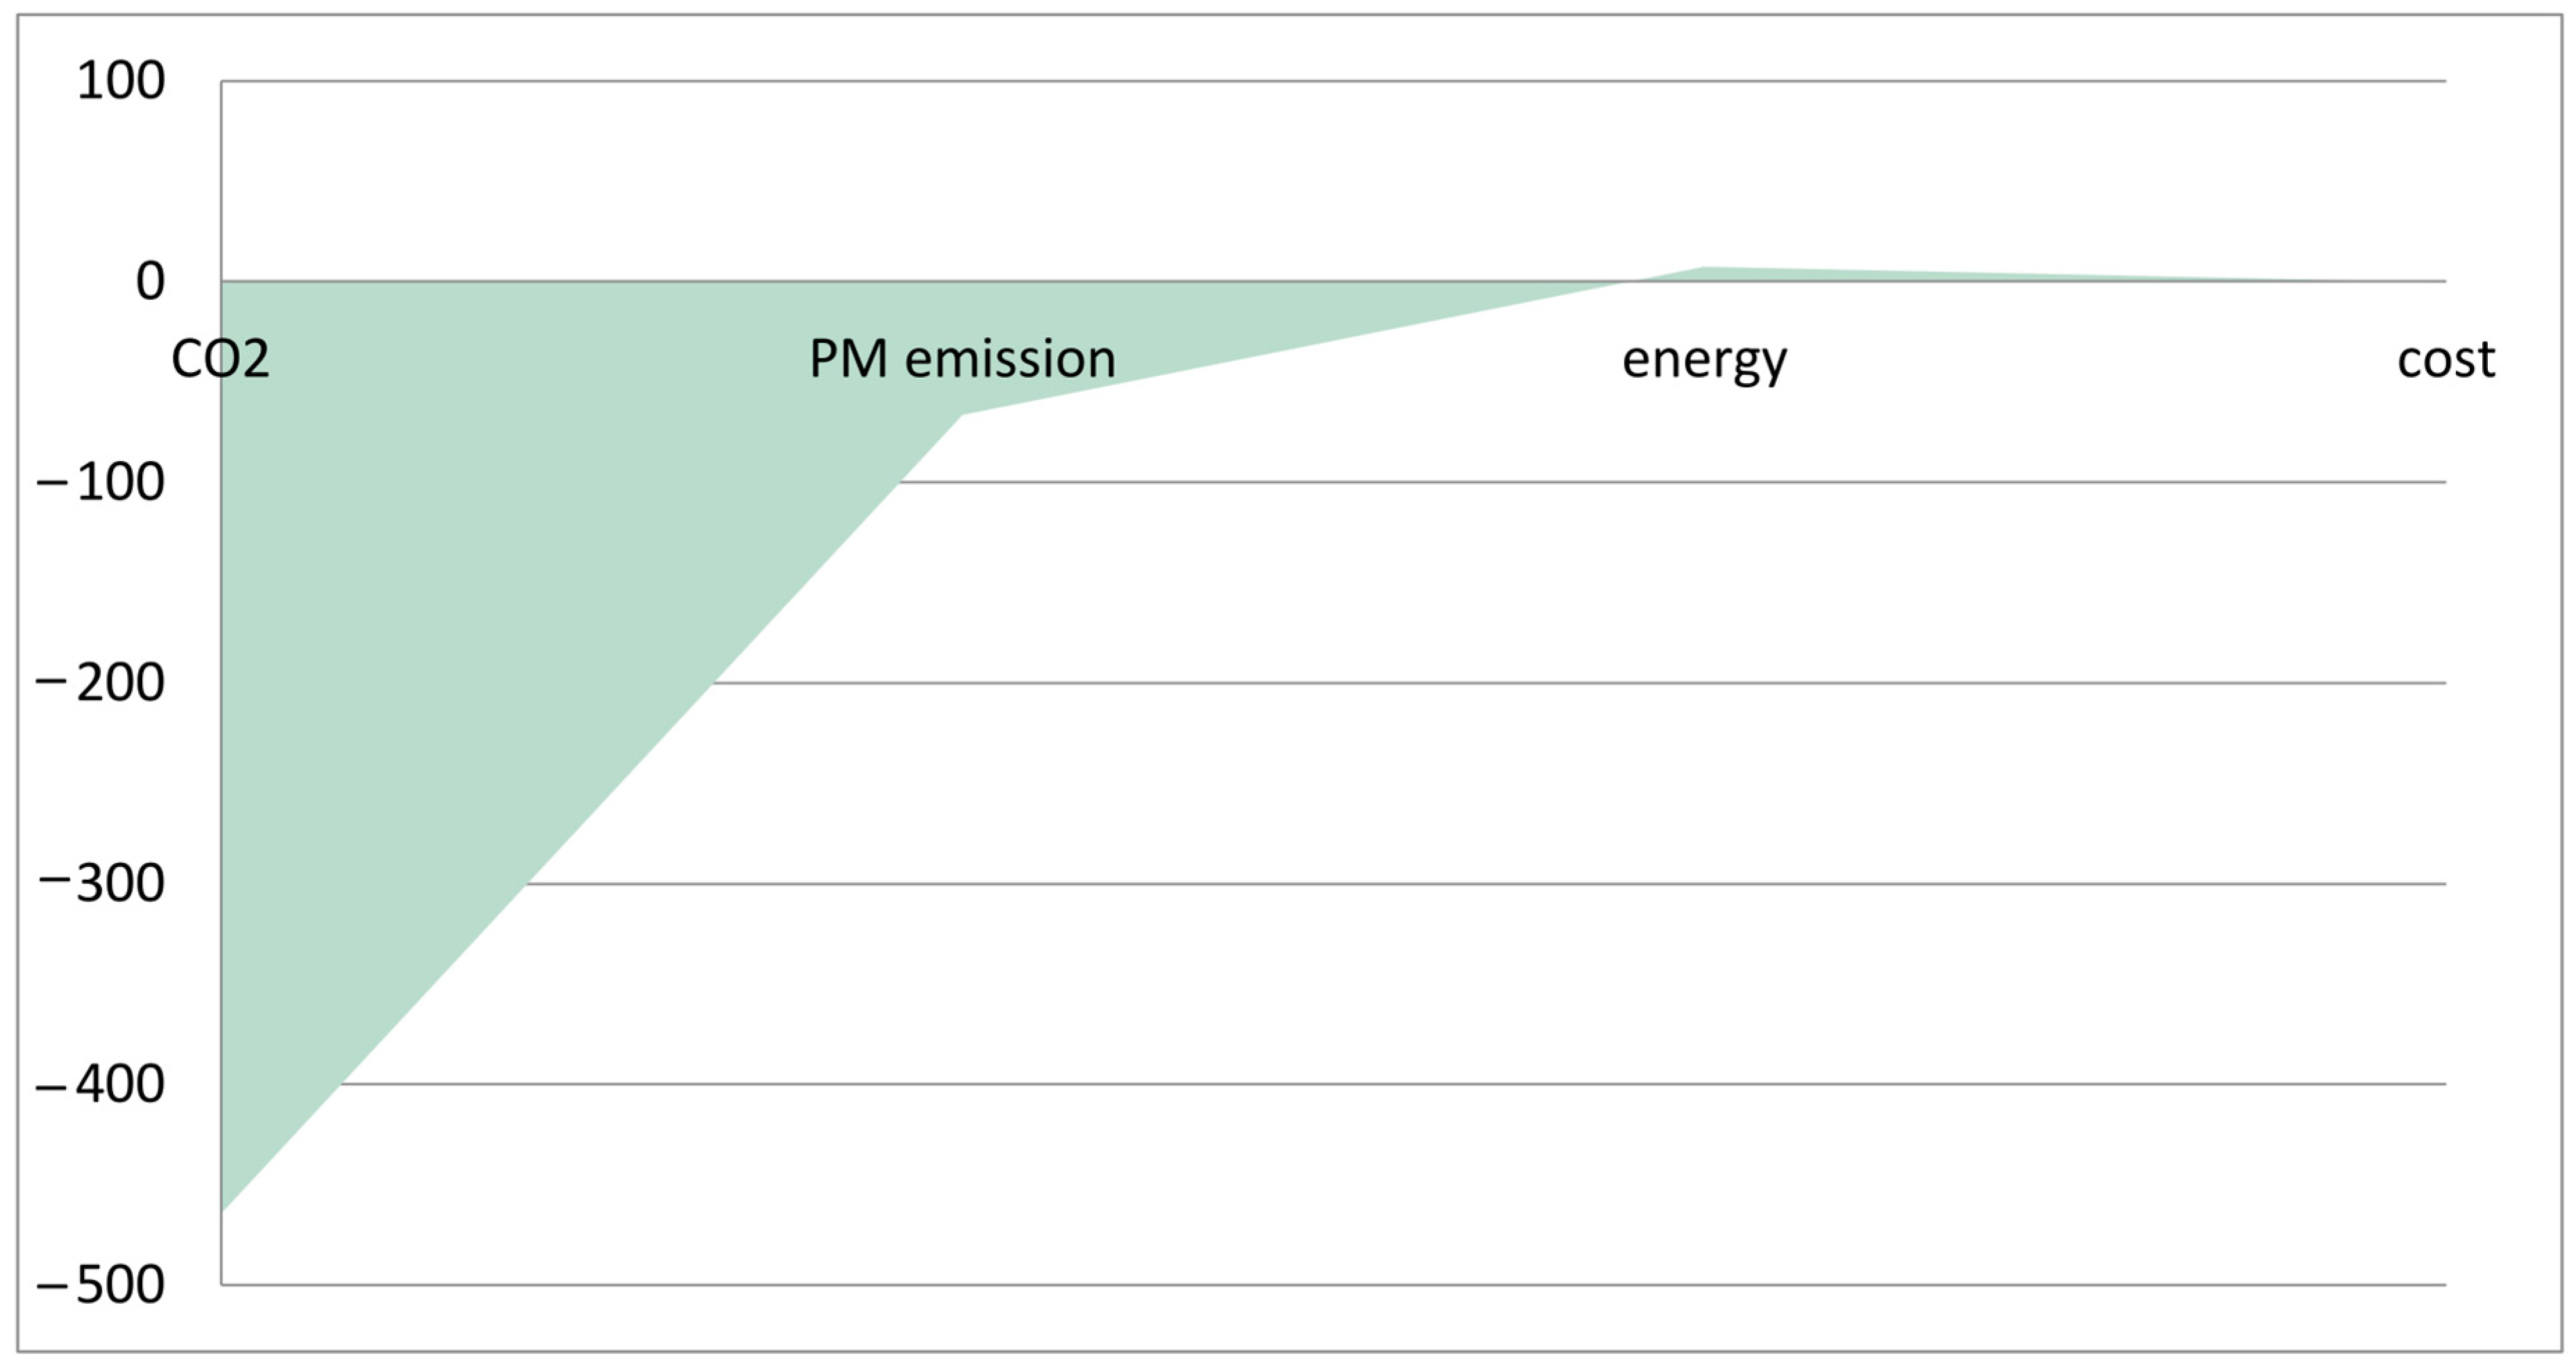
- Carbon dioxide (CO2) emissions;
- Particulate matter with less than 2.5 micrometres in diameter emissions (PM2.5);
- Calories burned by the user (kcal);
- Cost per trip in euros (€).
3.3.1. Carbon Dioxide (CO2) Emissions
3.3.2. Particulate Matter (PM2.5) Emissions
3.3.3. Calories Burned
- increased capacity, and reduced congestion, in the overall transport network;
- reduced environmental impacts;
- improved public health and reduced healthcare costs;
- improved community wellbeing and social cohesion.
3.3.4. Cost per Trip
4. Enhancing the Urban Sustainability Planning Process with Big Data
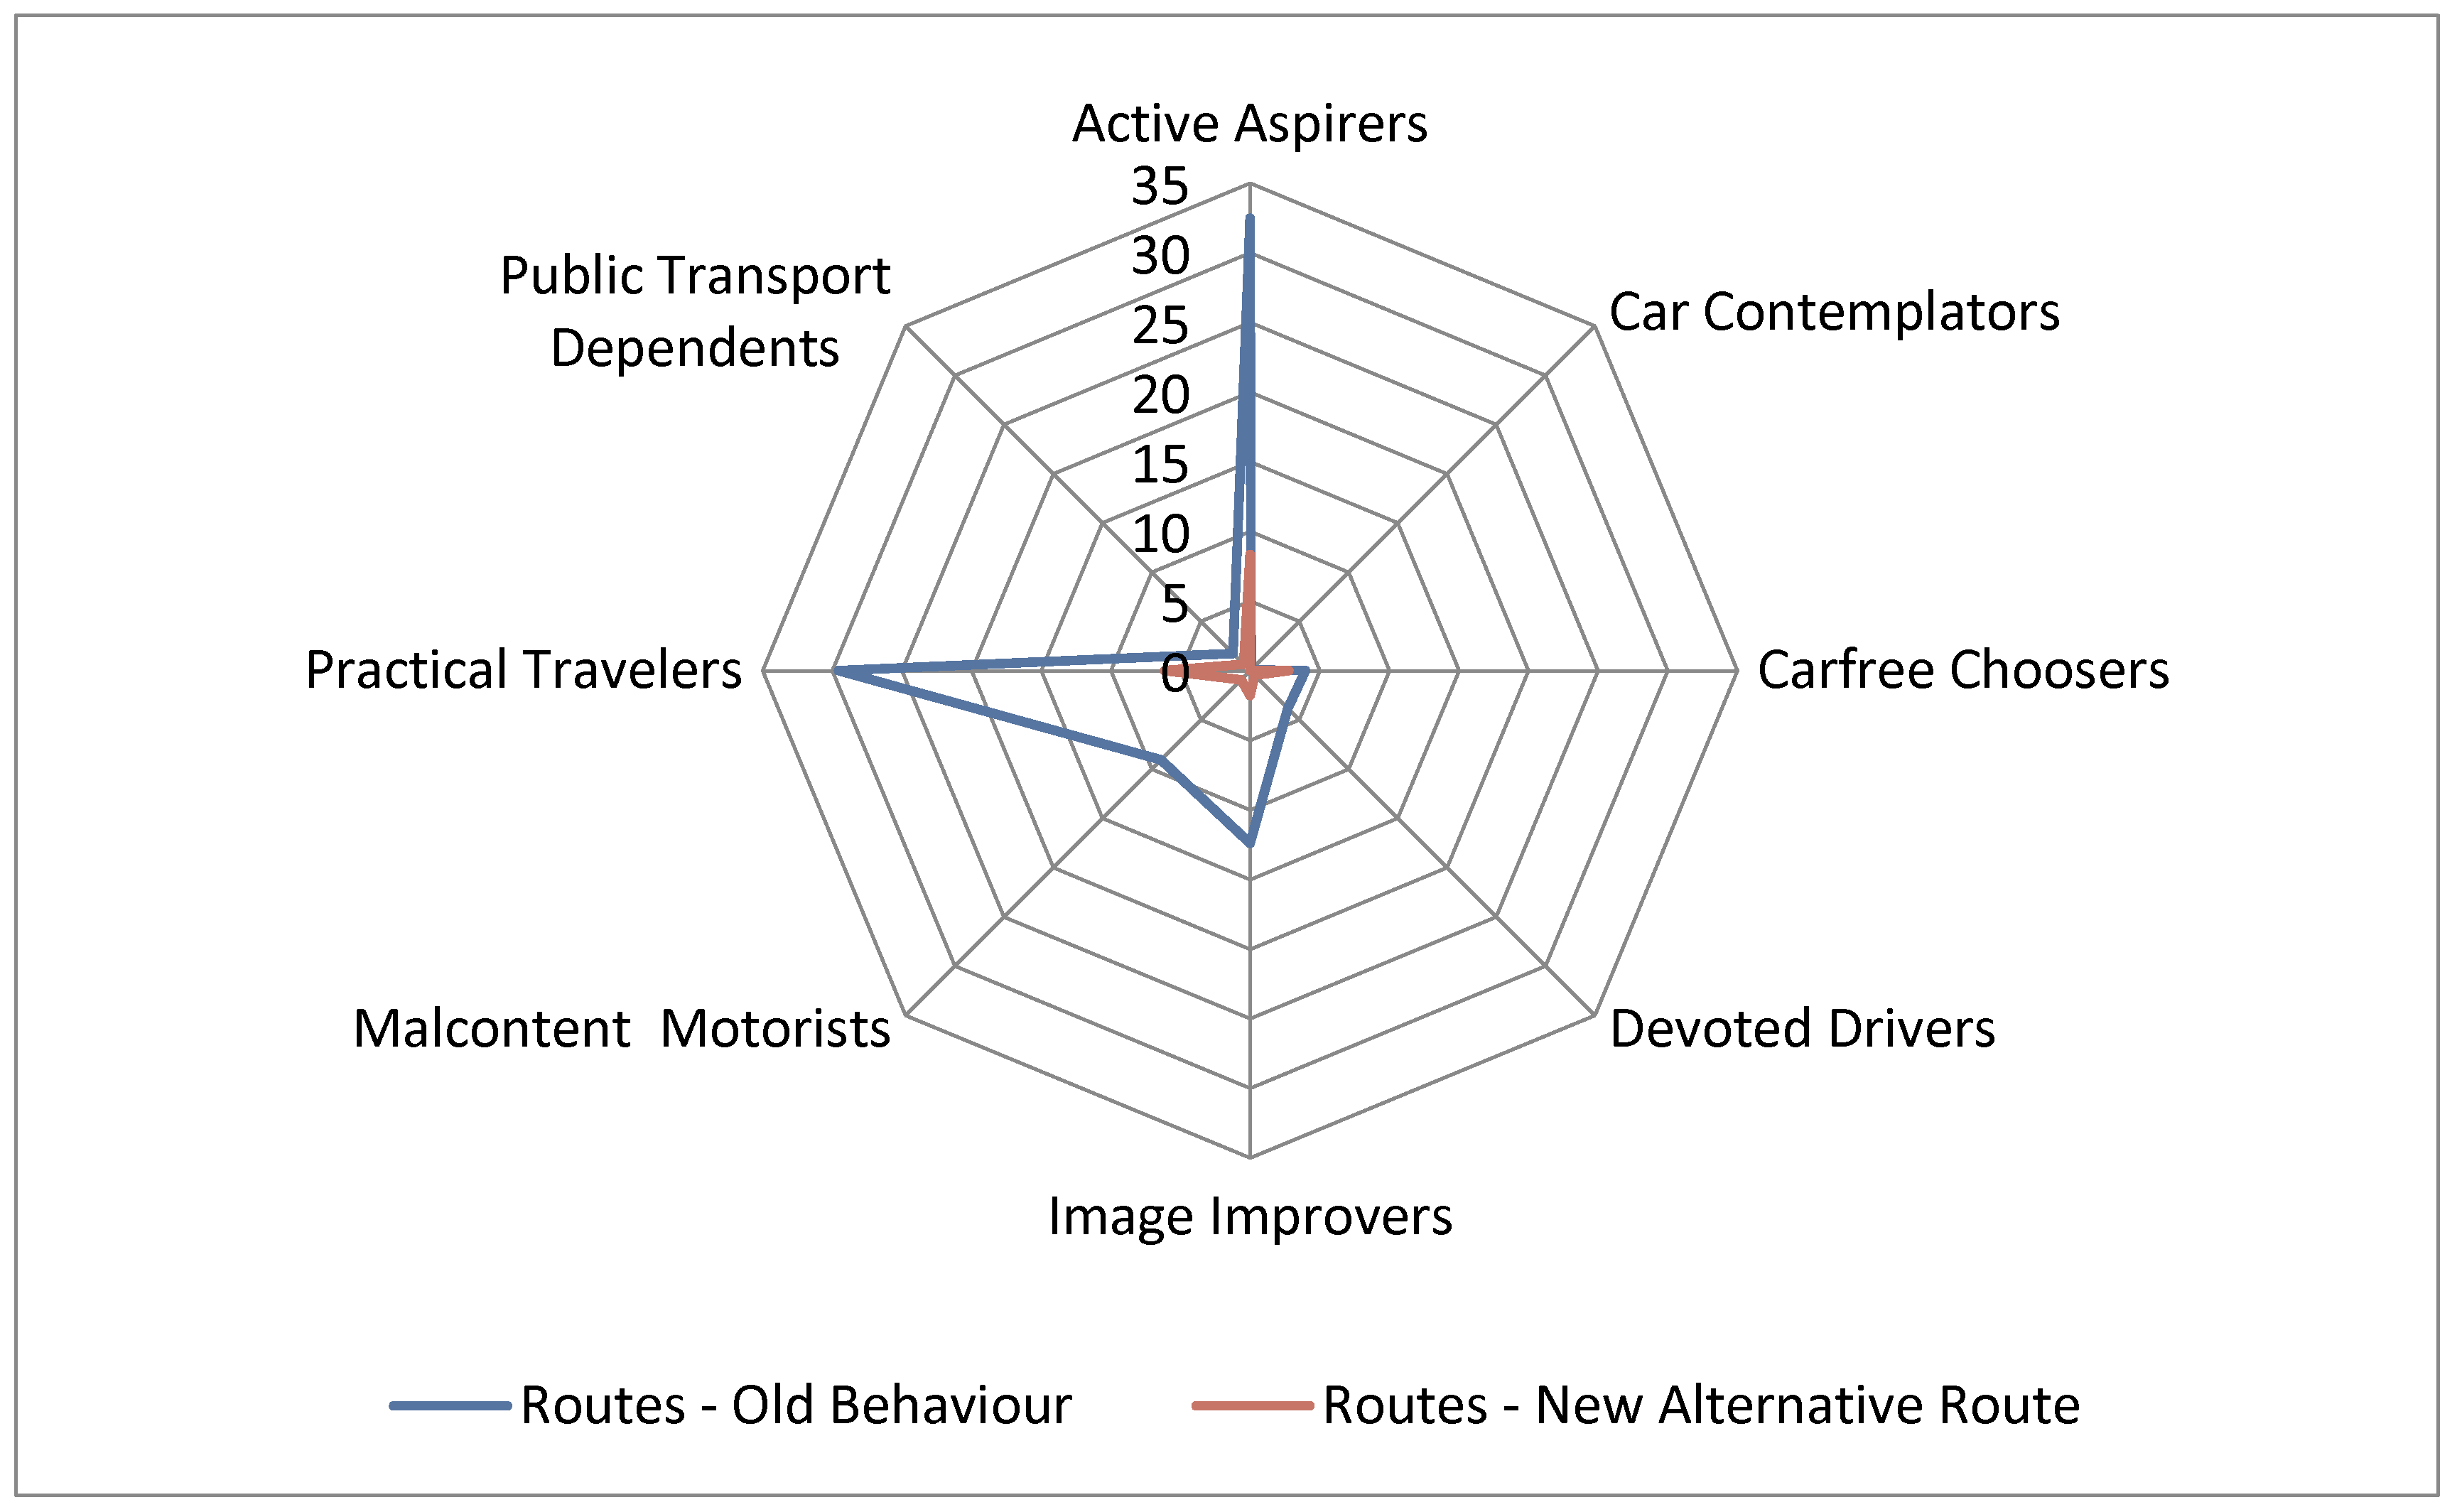
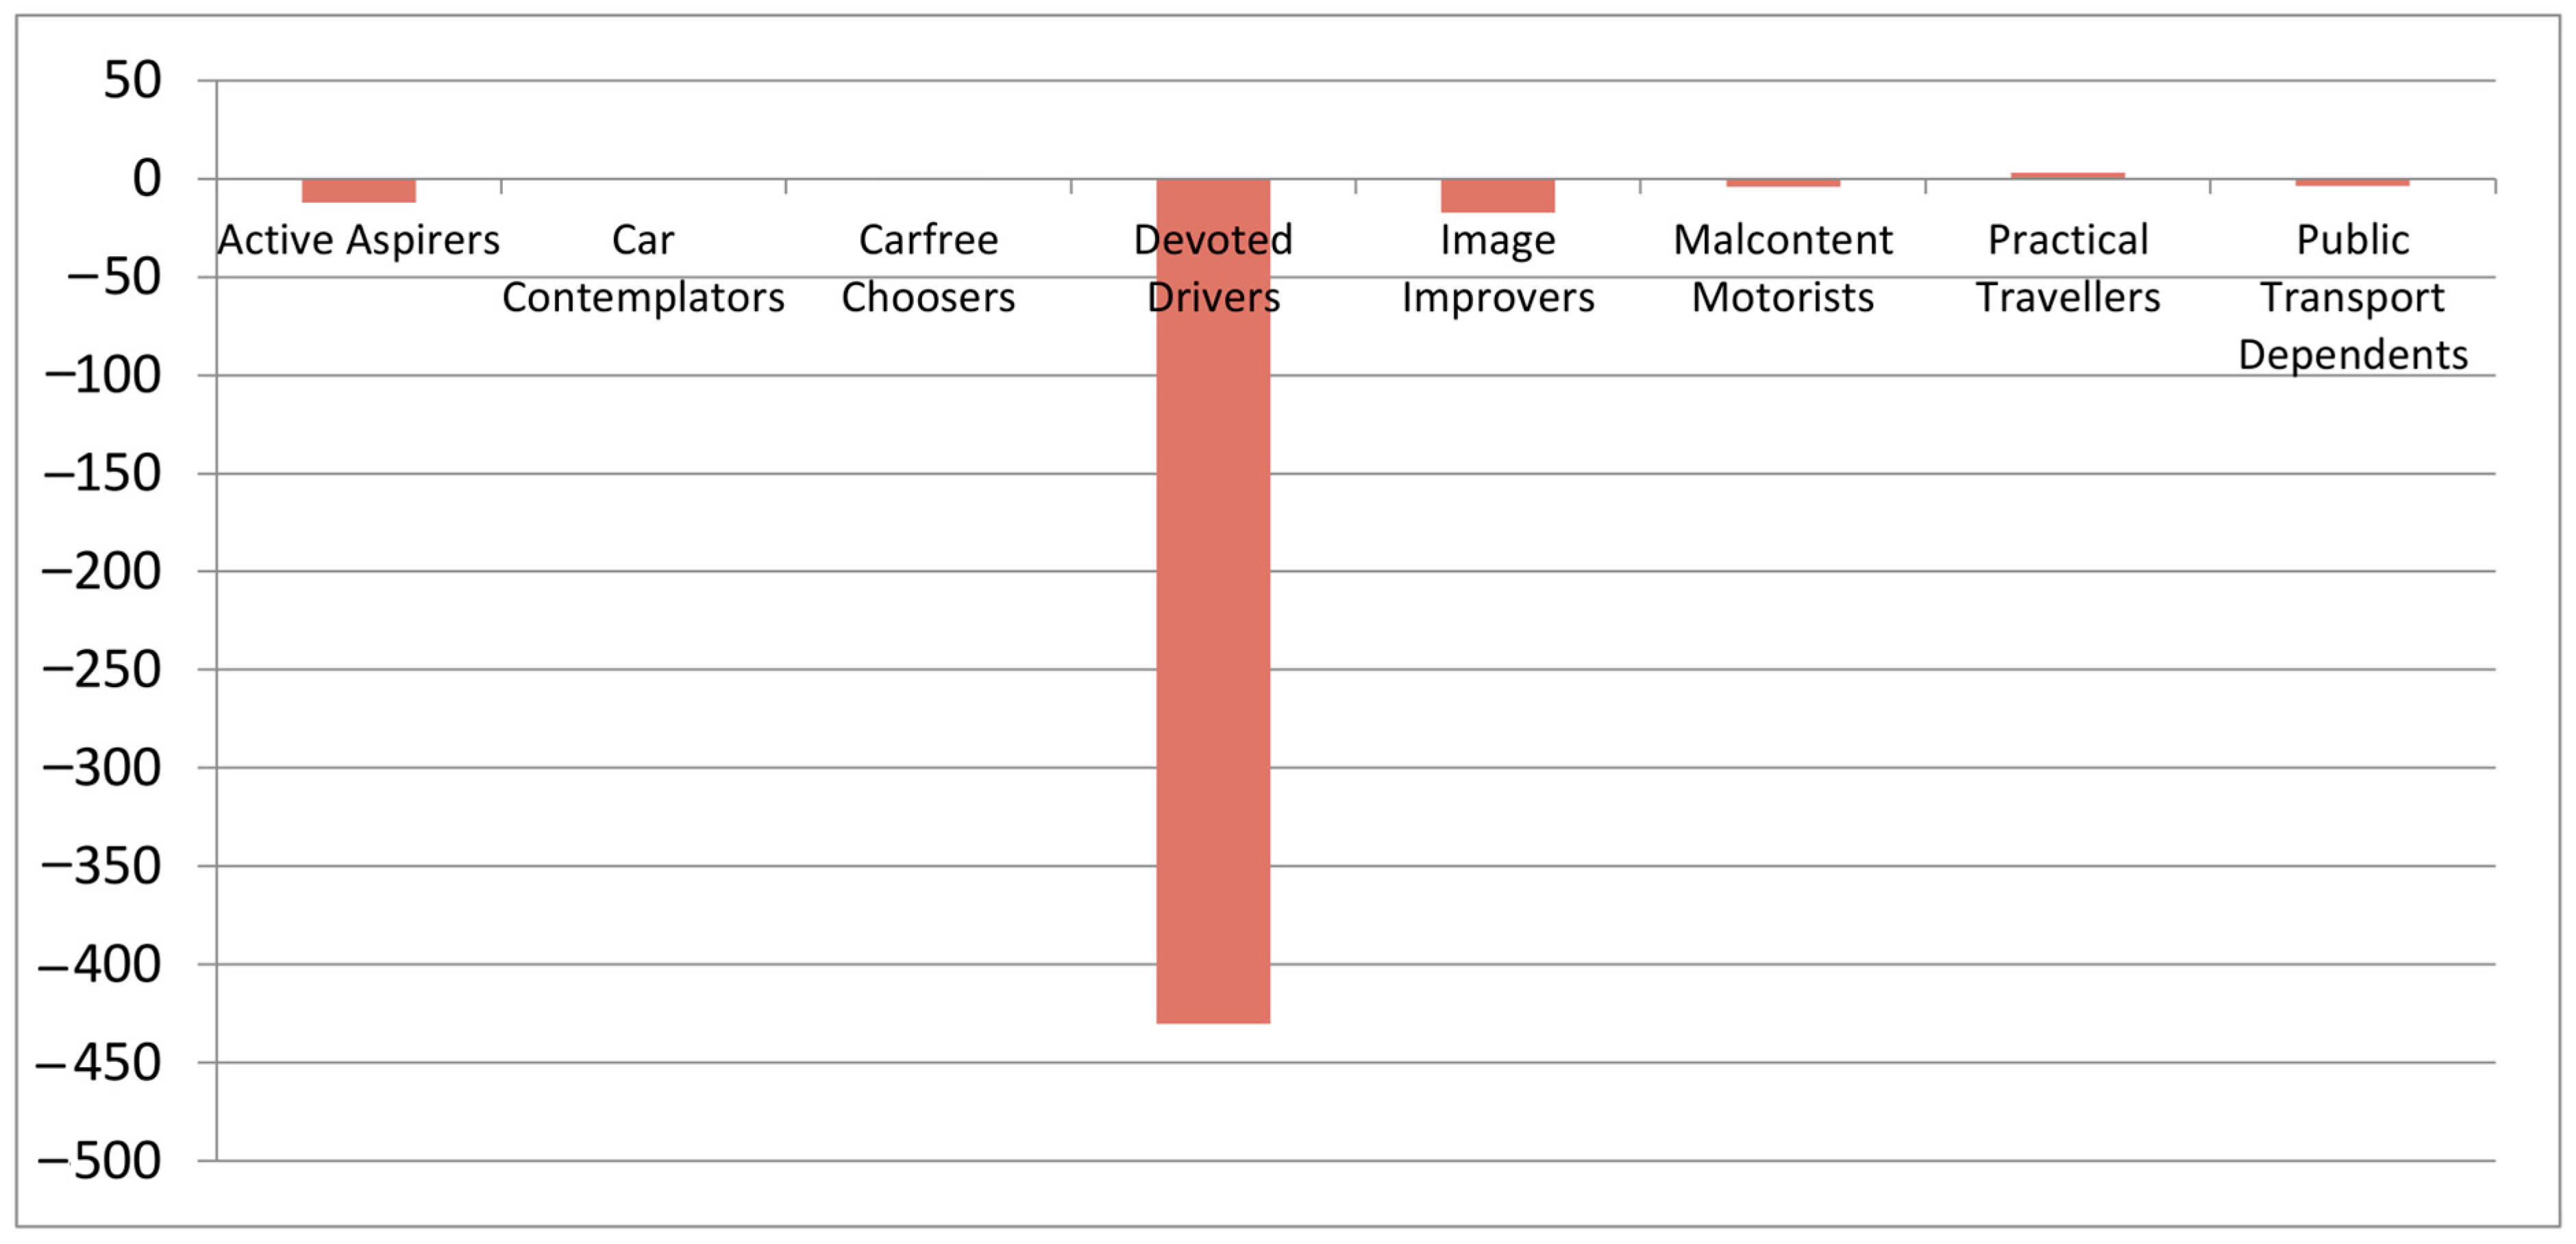
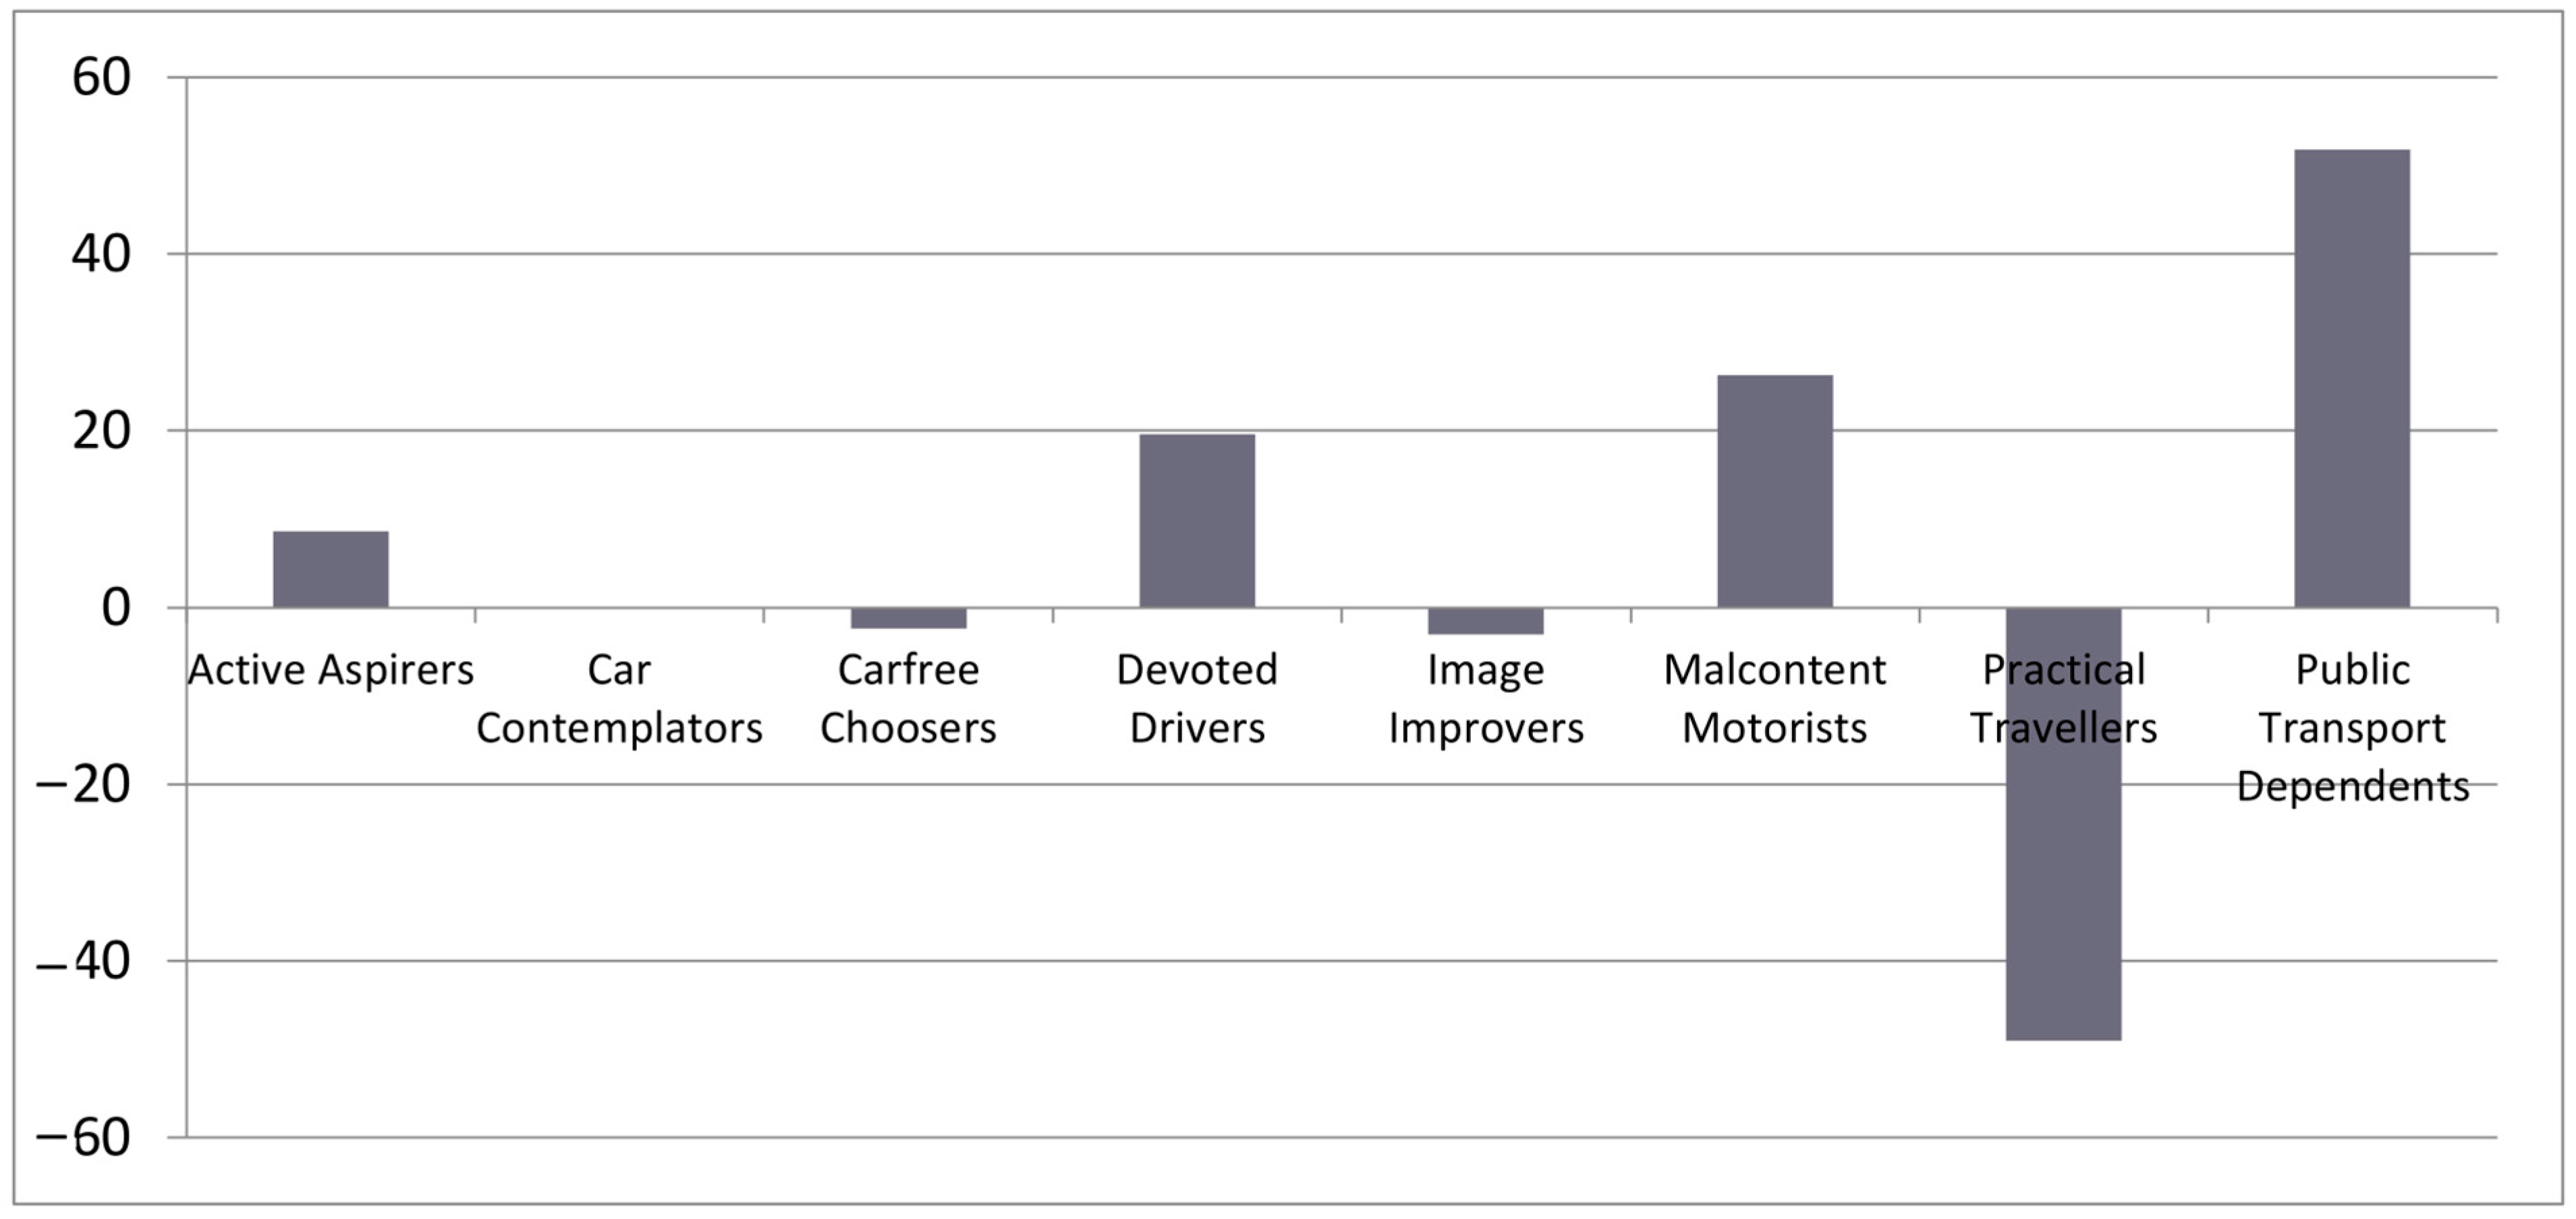
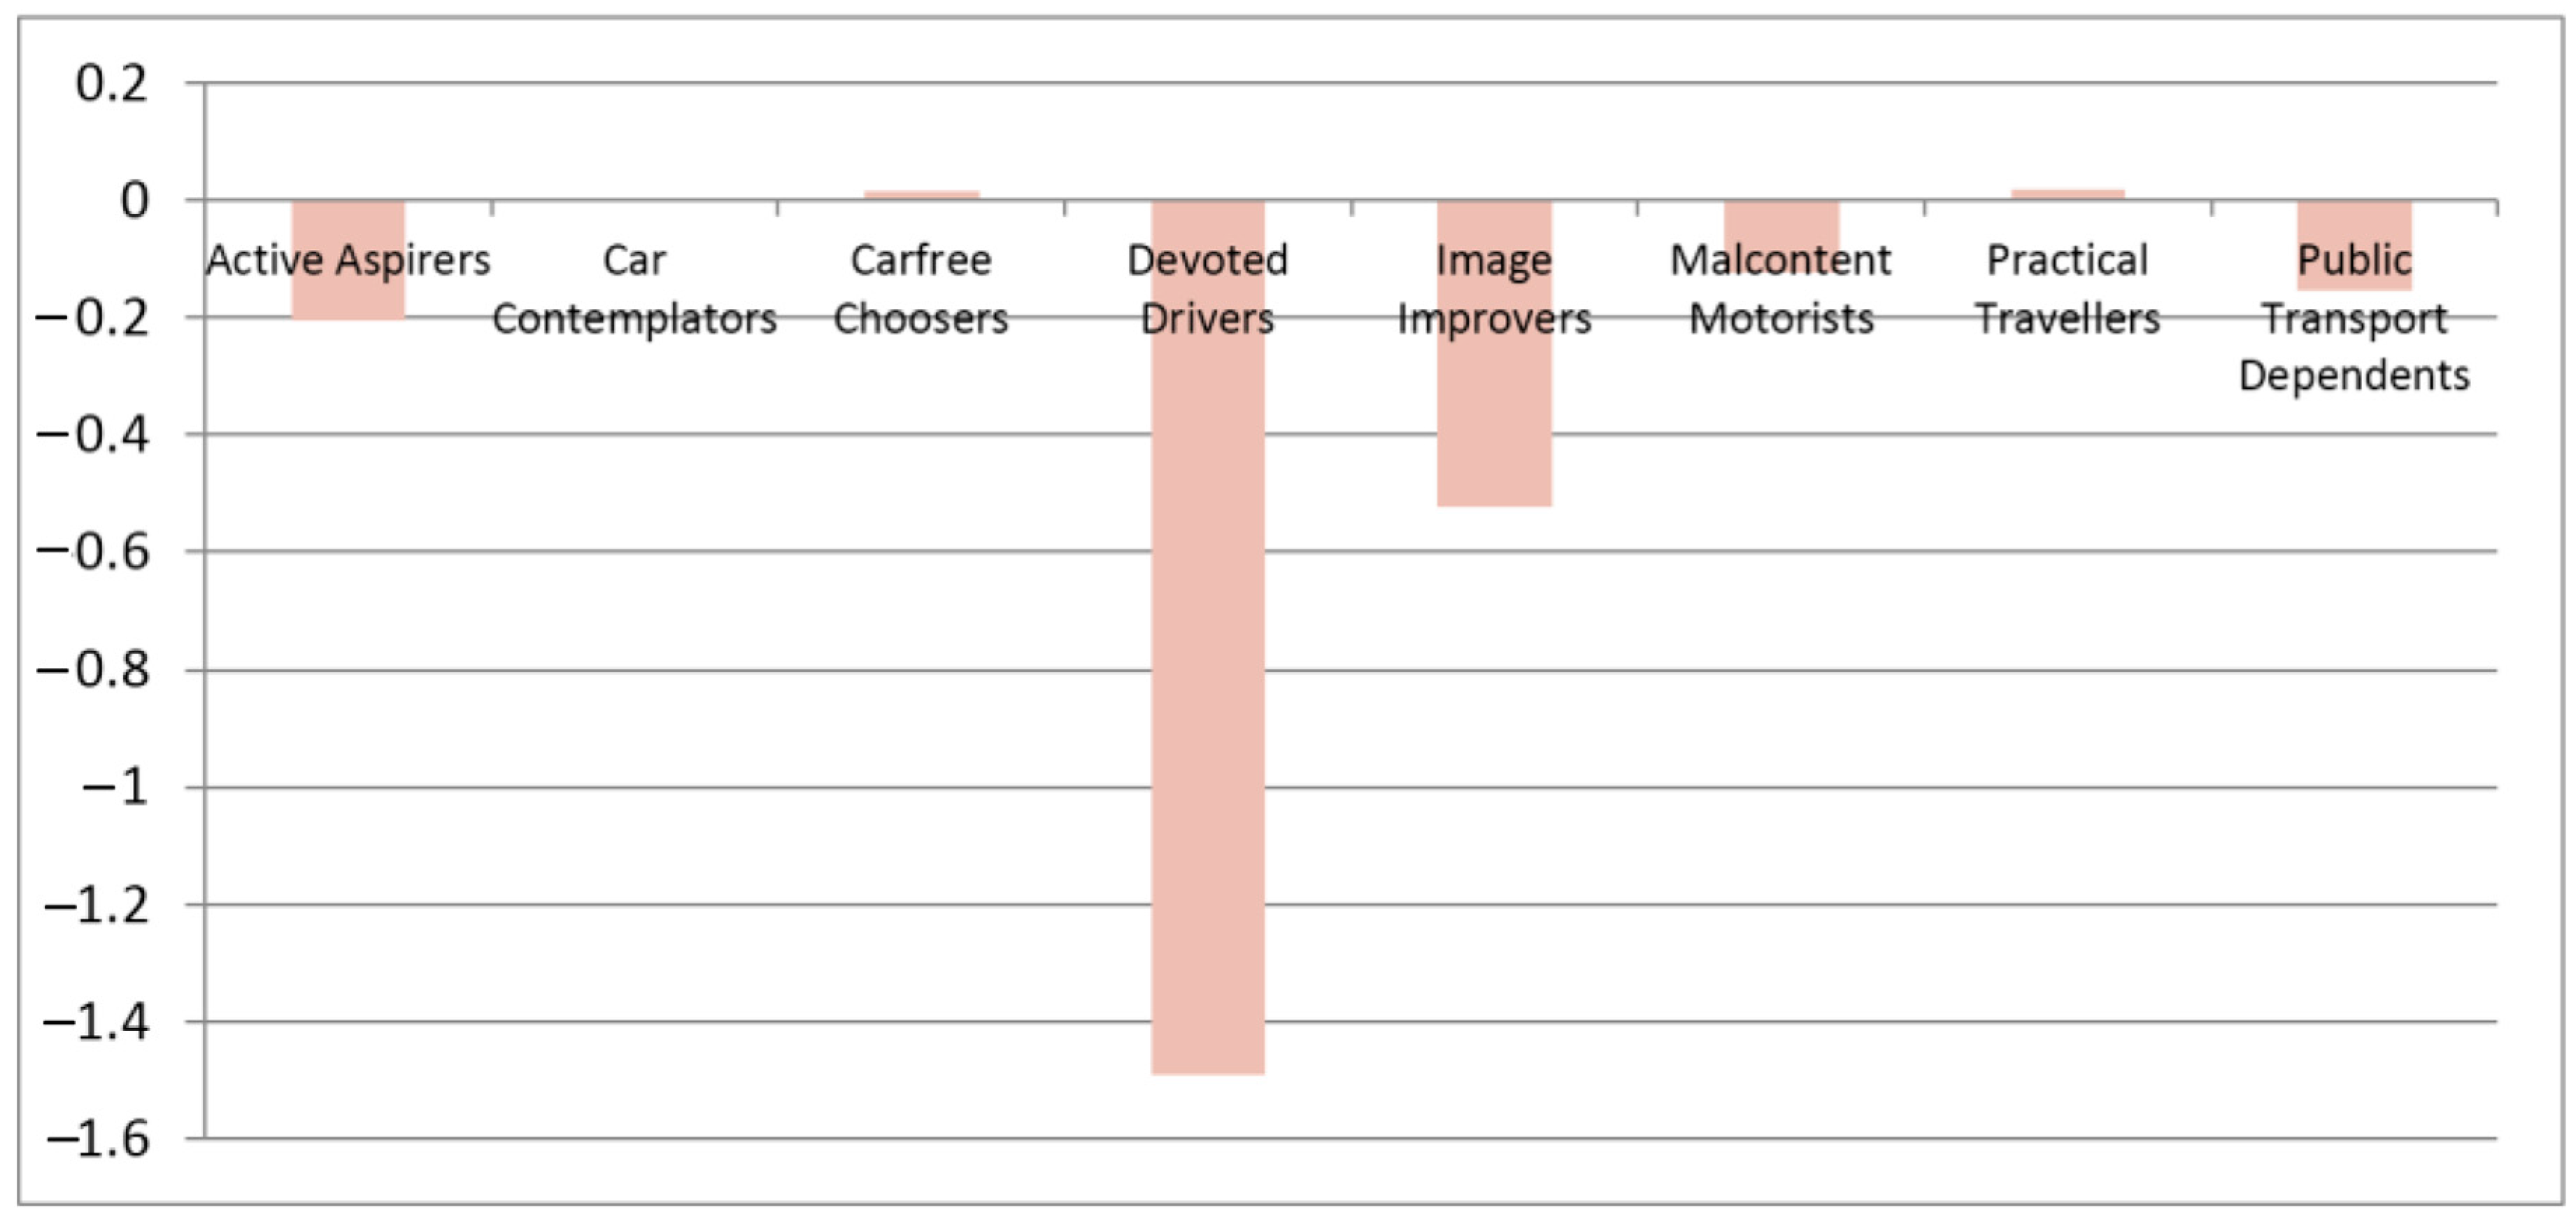
4.1. Behavioural Change Evaluation
4.2. Urban Sustainability Planning Support
5. Discussion
6. Conclusions
Acknowledgments
Author Contributions
Conflicts of Interest
References
- Gantz, J.; Reinsel, D. Extracting Value from Chaos; IDC iView: Framingham, MA, USA, 2011. [Google Scholar]
- Witlox, F. Beyond the Data Smog? Transp. Rev. 2015, 35, 245–249. [Google Scholar] [CrossRef]
- Laney, D. 3-D Data Management: Controlling Data Volume, Velocity and Variety. Available online: https://blogs.gartner.com/doug-laney/files/2012/01/ad949-3D-Data-Management-Controlling-Data-Volume-Velocity-and-Variety.pdf (accessed on 31 October 2016).
- Chen, H.; Roger, C.; Storey, V. Business intelligence and analytics: From big data to big impact. MIS Q. 2012, 36, 1165–1188. [Google Scholar]
- Chen, M.; Mao, S.; Liu, Y. Big data: A survey. Mob. Netw. Appl. 2014, 19, 171–209. [Google Scholar] [CrossRef]
- Linden, G.; Smith, B.; York, J. Amazon.com Recommendations Item-to-Item Collaborative Filtering. IEEE Internet Comput. 2003, 7, 76–80. [Google Scholar] [CrossRef]
- Hasan, L.; Morris, A.; Probets, S. Using Google Analytics to Evaluate the Usability of E-Commerce Sites. In Human Centered Design; Springer: Berlin, Germany, 2009; pp. 697–706. [Google Scholar]
- Provost, F.; Fawcett, T. Data Science and its Relationship to Big Data and Data-Driven Decision Making. Data Sci. Big Data 2013, 1, 51–59. [Google Scholar] [CrossRef]
- McAfee, A.; Brynjolfsson, E. Big Data: The Management Revolution. Harv. Bus. Rev. 2012, 2012, 59–69. [Google Scholar]
- Google. Google Scholar. Available online: http://scholar.google.com (accessed on 24 July 2016).
- Allwinkle, S.; Cruickshank, P. Creating Smart-er Cities: An Overview. J. Urban Technol. 2011, 18, 1–16. [Google Scholar] [CrossRef]
- Hollands, R.G. Will the real smart city please stand up? City 2008, 12, 303–320. [Google Scholar] [CrossRef]
- Komninos, N.; Pallot, M.; Schaffers, H. Open Innovation towards Smarter Cities. In Open Innovation; Publications Office of the European Union: Luxemburg, 2013; pp. 34–41. [Google Scholar]
- Lombardi, P.; Giordano, S.; Farouh, H.; Yousef, W. Modelling the smart city performance. Innov. Eur. J. Soc. Sci. Res. 2012, 25, 137–149. [Google Scholar] [CrossRef]
- Nam, T.; Pardo, T.A. Smart city as urban innovation: Focusing on management, policy, and context. In Proceedings of the 5th International Conference on Theory and Practice of Electronic Governance, Tallinn, Estonia, 26–28 September 2011.
- Papa, R.; Gargiulo, C.; Galderisi, A. Towards an Urban Planners’ Perspective on Smart City. TeMA J. Land Use Mobil. Environ. 2013, 6, 5–17. [Google Scholar]
- Angelidou, M. Smart city policies: A spatial approach. Cities 2014, 41, S3–S11. [Google Scholar] [CrossRef]
- Debnath, A.K.; Chin, H.C.; Haque, M.M.; Yuen, B. A methodological framework for benchmarking smart transport cities. Cities 2014, 37, 47–56. [Google Scholar] [CrossRef]
- Neirotti, P.; de Marco, A.; Cagliano, A.C.; Mangano, G.; Scorrano, F. Current trends in Smart City initiatives: Some stylised facts. Cities 2014, 38, 25–36. [Google Scholar] [CrossRef]
- Yamagata, Y.; Seya, H. Simulating a future smart city: An integrated land use-energy model. Appl. Energy 2013, 112, 1466–1474. [Google Scholar] [CrossRef]
- Dameri, R.P. Searching for Smart City definition: A comprehensive proposal. Int. J. Comput. Technol. 2013, 11, 2544–2551. [Google Scholar]
- Gibbs, D.; Krueger, R.; MacLeod, G. Grappling with Smart City Politics in an Era of Market Triumphalism. Urban Stud. 2013, 50, 2151–2157. [Google Scholar] [CrossRef]
- Lazaroiu, G.C.; Roscia, M. Definition methodology for the smart cities model. Energy 2012, 47, 326–332. [Google Scholar] [CrossRef]
- Piro, G.; Cianci, I.; Grieco, L.; Boggia, G.; Camarda, P. Information centric services in Smart Cities. J. Syst. Softw. 2014, 88, 169–188. [Google Scholar] [CrossRef]
- Filipponi, L.; Vitaletti, A.; Landi, G.; Memeo, V.; Laura, G.; Pucci, P. Smart City: An Event Driven Architecture for Monitoring Public Spaces with Heterogeneous Sensors. In Proceedings of the 4th International Conference on Sensor Technologies and Applications, Venice, Italy, 18–25 July 2010.
- Wan, J.; Li, D.; Zou, C.; Zhou, K. M2M communications for smart city: An event-based architecture. In Proceedings of the 12th International IEEE Conference on Computer and Information Technology, Chengdu, Sichuan, China, 27–29 October 2012.
- Versichele, M.; Neutens, T.; Delafontaine, M.; van de Weghe, N. The use of Bluetooth for analysing spatiotemporal dynamics of human movement at mass events: A case study of the Ghent Festivities. Appl. Geogr. 2012, 32, 208–220. [Google Scholar] [CrossRef]
- Balakrishna, C. Enabling Technologies for Smart City Services and Applications. In Proceedings of the 6th International Conference on Next Generation Mobile Applications, Services, and Technologies, Paris, France, 12–14 September 2012.
- Semanjski, I.; Gautama, S. Smart City Mobility Application—Gradient Boosting Trees for Mobility Prediction and Analysis Based on Crowdsourced Data. Sensors 2015, 15, 15974–15987. [Google Scholar] [CrossRef]
- GSMA; Accenture; Cisco. Smart Mobile Cities: Opportunities for Mobile Operators to Deliver Intelligent Cities. Available online: http://www.gsma.com/connectedliving/wp-content/uploads/2012/03/intelligentcitiesreport0411lores.pdf (accessed on 31 October 2016).
- Lee, J.H.; Hancock, M.G.; Hu, M.C. Towards an effective framework for building smart cities: Lessons from Seoul and San Francisco. Technol. Forecast. Soc. Chang. 2014, 89, 80–99. [Google Scholar] [CrossRef]
- Vanolo, A. Smartmentality: The Smart City as Disciplinary Strategy. Urban Stud. 2013, 1–16. [Google Scholar] [CrossRef]
- Semanjski, I.; Lopez Aguirre, A.J.; de Mol, J.; Gautama, S. Policy 2.0 Platform for Mobile Sensing and Incentivized Targeted Shifts in Mobility Behavior. Sensors 2016, 16, 1035. [Google Scholar] [CrossRef]
- DiNucci, D. Fragmented Future. Print 1999, 53, 220–222. [Google Scholar]
- Van Peborgh, E. Sustainability 2.0; Odiseo: Buenos Aires, Argentina, 2008. [Google Scholar]
- Nidumolu, R.; Prahalad, C.; Rangaswami, M. Why Sustainability Is Now the Key Driver of Innovation. Harv. Bus. Rev. 2009, 9, 13–26. [Google Scholar]
- OpenStreetMap Foundation. OpenStreetMap. Available online: https://www.openstreetmap.org (accessed on 31 July 2016).
- Humanitarian OpenStreetMap Team. Earthquake in Ecuador, Manta—Post-Event Imagery. Available online: http://tasks.hotosm.org/project/2042 (accessed on 1 August 2016).
- Humanitarian OpenStreetMap Team. Nepal Earthquake Mapping—Langtang Rasuwa (Highly Effected Area). Available online: http://tasks.hotosm.org/project/1016 (accessed on 1 August 2016).
- Humanitarian OpenStreetMap Team. Adamawa Region Cameroon—Polio Outbreak and Preparedness for other Outbreaks. Available online: http://tasks.hotosm.org/project/1087 (accessed on 1 August 2016).
- Joshi, P. Brussels Lockdown Hashtag Sparks Hilarious Cat-Storm on Social Media. Available online: http://www.ibtimes.co.uk/brussels-lockdown-hashtag-sparks-hilarious-cat-storm-social-media-1529980 (accessed on 16 July 2016).
- Tutt, P.; Pramuk, J. Brussels Lockdown: Highest Alert Level Maintained. Available online: http://www.cnbc.com/2015/11/22/brussels-lockdown-arrests-made-shots-fired-in-salah-abdeslam-hunt.html (accessed on 16 July 2016).
- Baert, D.; van Poucke, S. Politie Bedankt Hulpvaardige Katten op Twitter. Available online: http://deredactie.be/cm/vrtnieuws/cultuur%2Ben%2Bmedia/1.2504148 (accessed on 16 July 2016).
- New Integrated Smart Transport Options. Available online: http://www.nisto-project.eu/en/home.html (accessed on 2 August 2016).
- Ghent University. Routecoach. Ghent University: Ghent, Belgium, 2015. Available online: http://www.routecoach.be/ (accessed on 2 August 2016).
- City of Leuven. Leuven Population Statistics. 2015. Available online: http://www.leuven.be/bestuur/leuven-in-cijfers/bevolking/aantal-inwoners/ (accessed on 29 August 2016).
- Segment. Segmented Marketing for Energy Efficient Transport. 2013. Available online: http://www.segmentproject.eu/ (accessed on 1 December 2015).
- Ajzen, I. The theory of planned behaviour. Organ. Behav. Hum. Decis. Process. 1991, 50, 179–211. [Google Scholar] [CrossRef]
- Anable, J.; Wright, S. Segment. 2013. Available online: http://www.segmentproject.eu/hounslow/segment.nsf/Files/SFF-266/$file/Deliverable%207.8.4%20GOLDEN%20QUESTIONS%20AND%20SOCIAL%20MARKETING%20GUIDANCE%20REPORT.pdf (accessed on 18 November 2015).
- Ladbury, P. Segment Toolkit. 1 July 2013. Available online: http://www.segmentproject.eu/hounslow/segment.nsf/Files/SFF-318/$file/Deliverable%207-8.3%20Social%20Marketing%20Toolkit.pdf (accessed on 20 May 2015).
- Semanjski, I.; Gautama, S. Crowdsourcing mobility insights—Reflection of attitude based segments on high resolution mobility behaviour data. Transp. Res. Part C Emerg. Technol. 2016, 71, 434–446. [Google Scholar] [CrossRef]
- Move. Google Play, Routecoach; Ghent University: Ghent, Belgium, 2015. Available online: https://play.google.com/store/apps/details?id=com.move.routecoach&hl=nl_BE (accessed on 2 February 2016).
- Cioca, L.I.; Ivascu, L.; Rada, E.C.; Torretta, V.; Ionescu, G. Sustainable development and technological impact on CO2 reducing conditions in Romania. Sustainability 2015, 7, 1637–1650. [Google Scholar] [CrossRef]
- United Nations. Kyoto Protocol to the United Nations Framework Convention on Climate Change; United Nations: Bonn, Germany, 1998. [Google Scholar]
- Gillis, D.; Semanjski, I.; Lauwers, D. How to Monitor Sustainable Mobility in Cities? Literature Review in the Frame of Creating a Set of Sustainable Mobility Indicators. Sustainability 2016, 8, 29. [Google Scholar] [CrossRef]
- Mira Milieurapport Vlaanderen. Achtergrond Rapport Transport (Environmental Report Flanders—Background Report on Transport); Milieurapport Vlaanderen MIRA: Mechelen, Belgium, 2010. [Google Scholar]
- Worldbank. Worldbank. 2013. Available online: http://data.worldbank.org/indicator/EN.CO2.TRAN.MT (accessed on 20 May 2015).
- United States Environmental Protection Agency. Guide to Sustainability Transportation Performance Measures; United States Environmental Protection Agency: Washington, DC, USA, 2011.
- European Commission & AmbientItalia. European Common Indicators; European Commission: Brussels, Belgium, 2003. [Google Scholar]
- NMBS Group. CO2-Emissies Treinverkeer. Available online: http://www.belgianrail.be/nl/corporate/duurzaamheid/planet/~/media/C6FAF258787F41FAB7A6CADDB409422D.ashx (accessed on 31 October 2016).
- NMBS-Groep. Plan Duurzaam Ondernemen; NMBS: Brussel, Belgium, 2015. [Google Scholar]
- Flanders Environment Agency. MIRA Indicator Report; Flanders Environment Agency: Aalst, Belgium, 2012. [Google Scholar]
- De Lijn. CO2 Uitstoot Verkee. Available online: https://www.delijn.be/nl/overdelijn/organisatie/zorgzaam-ondernemen/milieu/co2-uitstoot-voertuigen.html (accessed on 20 August 2016).
- Goldemberg, J.; Lucon, O. Energy, Environment and Development; Cromwell Press Group: Trowbridge, UK, 2009. [Google Scholar]
- Bicycling. Cycling Calories Burned Calculator. Available online: http://www.bicycling.com/training/weight-loss/cycling-calories-burned-calculator (accessed on 1 September 2016).
- ShapeSense. Walking Calorie Burn Calculator. Available online: http://www.shapesense.com/fitness-exercise/calculators/walking-calorie-burn-calculator.shtml (accessed on 1 September 2016).
- Raaschou-Nielsen, O.; Andersen, Z.J.; Beelen, R.; Samoli, E.; Stafoggia, M.; Weinmayr, G.; Hoffmann, B.; Fischer, P.; Nieuwenhuijsen, M.J.; Brunekreef, B.; et al. Air pollution and lung cancer incidence in 17 European cohorts: Prospective analyses from the European Study of Cohorts for Air Pollution Effects (ESCAPE). Lancet Oncol. 2013, 14, 813–822. [Google Scholar] [CrossRef]
- European Environment Agency. National Emissions Reported to the Convention on Long-Range Transboundary Air Pollution (LRTAP Convention); European Environment Agency: Copenhagen, Denmark, 2016. [Google Scholar]
- Mobiel Vlaanderen. Onderzoek Verplaatsingsgedrag Vlaams-Brabant; Mobiel Vlaanderen: Brussel, Belgium, 2014. [Google Scholar]
- Vankerkom, J.; de Vlieger, I.; Schrooten, L.; Vliegen, J.; Styns, K. Beleidsondersteunend Onderzoek: Aanpassingen aan het Emissiemodel Voor Wegtransport MIMOSA; VITO: Mol, Belgium, 2009. [Google Scholar]
- Gillies, J.A.; Gertler, A.W.; Sagebiel, J.C.; Dippel, W.A. On-road particulate matter (PM2.5 and PM10) emissions in the Sepulveda Tunnel, Los Angeles, California. Environ. Sci. Technol. 2001, 35, 1054–1063. [Google Scholar] [CrossRef]
- Cai, H.; Burnham, A.; Wang, M. Updated Emission Factors of Air Pollutants from Vehicle Operations in GREETTM Using MOVES; Argonne National Laboratory: Lemont, IL, USA, 2013.
- Department of Infrastructure and Transport. Walking, Riding and Access to Public Transport; Department of Infrastructure and Transport: Canberra, Australia, 2013.
- Belgian Federal Government. Statistics Belgium; Belgian Federal Government: Brussels, Belgium, 2013.
- Federal Planning Bureau. The Fiscal Treatment of Company Cars in Belgium; Federal Planning Bureau: Brussels, Belgium, 2016. [Google Scholar]
- Victoria Transport Policy Institute. Transportation Cost and Benefit Analysis II—Vehicle Costs; Victoria Transport Policy Institute: Victoria, BC, Canada, 2015. [Google Scholar]
- Ishfaq, S.; Anable, J. SEGMENT Work Package 6—Final Report; London Borough of Hounslow: London, UK, 2013.
- Stopher, P.; Greaves, S.P. Household travel surveys: Where are we going? Transp. Res. Part A Policy Pract. 2007, 41, 367–381. [Google Scholar] [CrossRef]
- Khan, Z.; Ludlow, D.; Loibl, W.; Soomro, K. ICT enabled participatory urban planning and policy development: The UrbanAPI project. Transform. Gov. People Process Policy 2014, 8, 205–229. [Google Scholar] [CrossRef]
- Järv, O.; Ahas, R.; Saluveer, E.; Derudder, B.; Witlox, F. Mobile phones in a traffic flow: A geographical perspective to evening rush hour traffic analysis using call detail records. PLoS ONE 2012, 7, e49171. [Google Scholar] [CrossRef]
- Järv, O.; Ahas, R.; Witlox, F. Understanding monthly variability in human activity spaces: A twelve-month study using mobile phone call detail records. Transp. Res. C Emerg. Technol. 2014, 38, 122–135. [Google Scholar] [CrossRef]
- Semanjski, I.; Gautama, S. Sensing Human Activity for Smart Cities’ Mobility Management. In Smart Cities Technologies; InTech: Rijeka, Croatia, 2016; in press. [Google Scholar]
- Ahas, R.; Armoogum, J.; Esko, S.; Ilves, M.; Karus, E.; Madre, J.-L.; Nurmi, O.; Potier, F.; Schmücker, D.; Sonntag, U.; et al. Feasibility Study on the Use of Mobile Positioning Data for Tourism Statistics; Eurostat: Luxemburg, 2014. [Google Scholar]


| Policy 1.0 | Policy 2.0 | |
|---|---|---|
| Interaction | Closed | Collaborative |
| Participation | Individual participation | Group (citizens) Participation |
| Communication | One-Way Communication | Two-Way Communication |
| Involvement | Passive Involvement | Active Involvement |
| Content | “Read-Only” Content | “User (citizens)-Generated” Content |
| Motives for change | Often include risk aversion and reputation management | Are more likely to include innovation, focus on creating shared value |
| External communication | External communication is dominated by public relations | External communication is driven by engagement |
| Sustainability | Sustainability is conceived as a responsibility | Sustainability is positioned central to strategy |
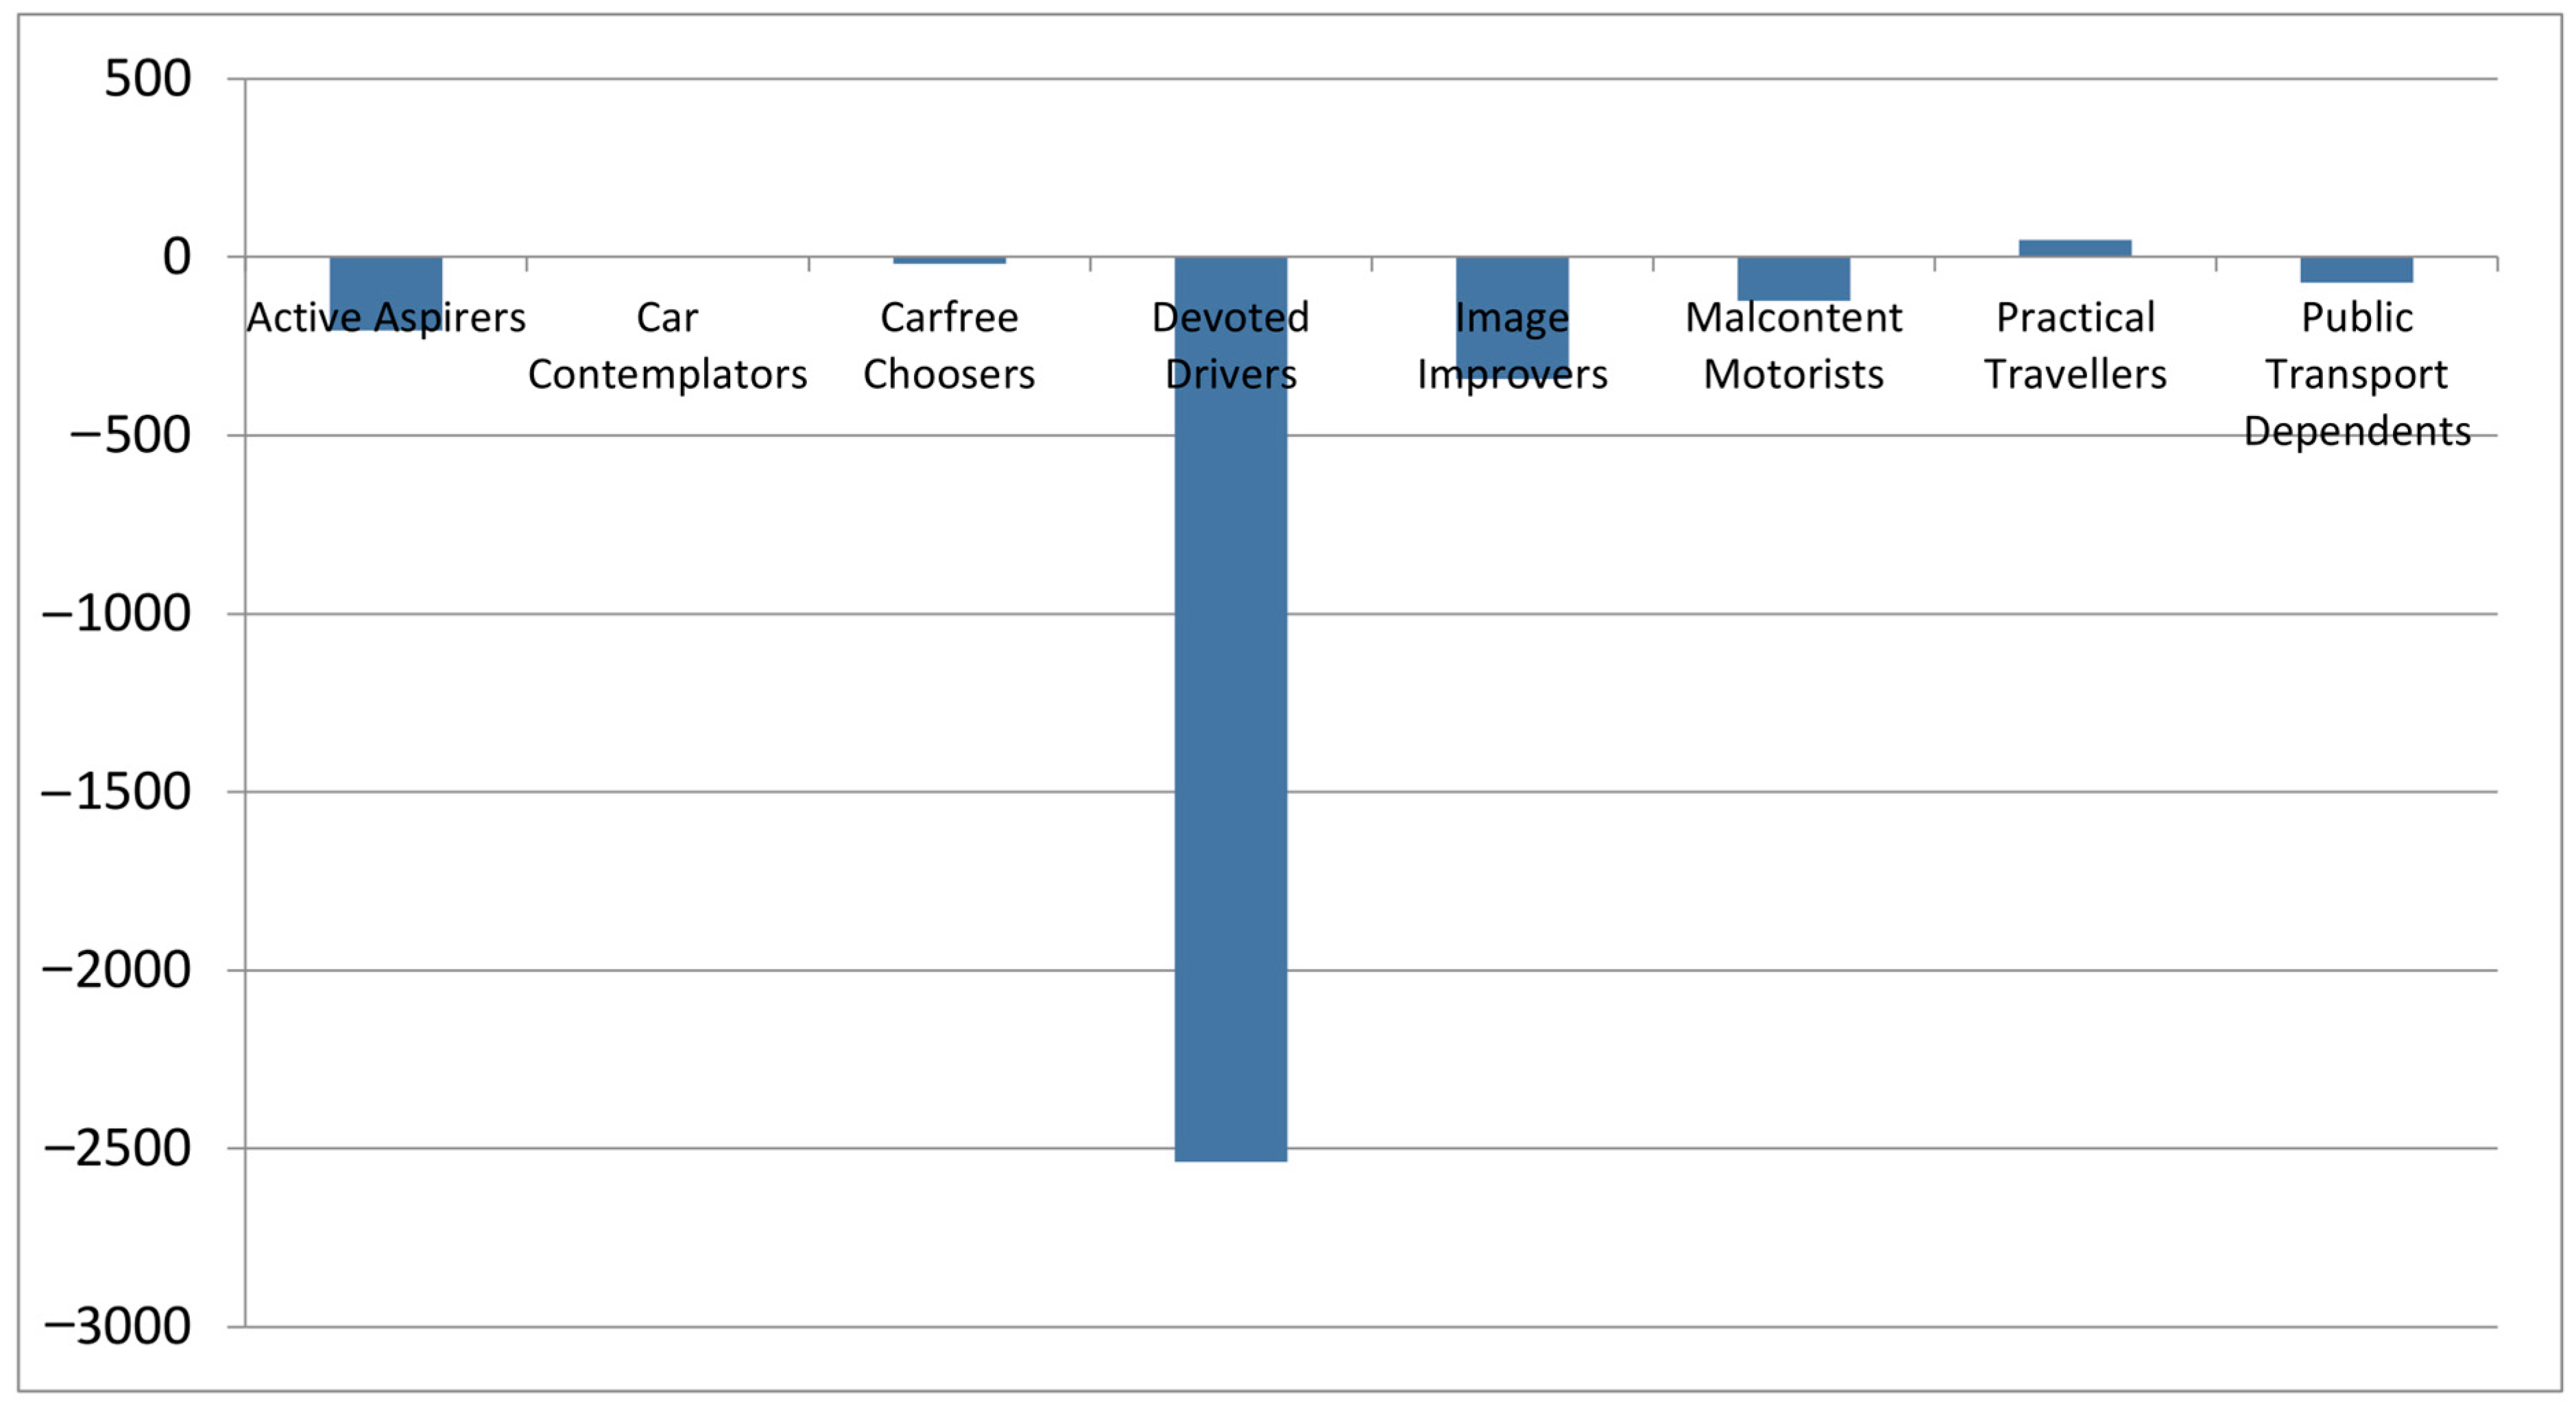
| Profile | Description |
|---|---|
| Devoted Drivers | They prefer to use a car and are not convinced that there are realistic alternatives to private car to most of the journeys they make. They tend to think successful people use cars and that it is a way of self-expression. They do not see themselves as a public transport (PT) user or a cyclist and consider modes, other than car, to be too slow and often stressful with few, if any, advantages over the car. They are not particularly motivated to use their travel time to get fit by using the bike or walking, and are also not particularly motivated by reducing their emissions of greenhouse gases. They believe that car use should not be restricted and would like to see more roads built to reduce congestion. |
| Image Improvers | They like to drive and do not want their ability to drive to be restricted. The main reason for this is largely practical but they also feel that car driving is part of who they are and their identity. They recognize that it would be good for the planet if we all would reduce our car use a little but are not entirely convinced about the scientific evidence on global warming. Thus, their motivation to act is not high, but at the same time they want to do the right thing. They do not relate to PT users but are likely to see cycling as a form of self-expression and are interested to keep fit. They are also likely to think they should walk more but consider walking to be too slow. |
| Malcontent Motorists | They drive a lot but find it increasingly stressful. They want to cut down their car use but find that there are a lot of practical problems with using alternative modes (e.g., they are likely to feel that PT provision in their area is inadequate). Although they consider that cycling might be beneficial to their health, it is not something they feel comfortable doing. They walk sometimes (rather for practical reasons than fitness), although they would like to walk more in the future. Environmental issues are something they are aware of and know a little bit about, but they do not feel it is practical to make decisions about their daily travel based on these issues. |
| Active Aspirers | They would like to decrease their car use, especially on short journeys, but they do not see the PT as a solution (even though they consider it can sometimes be quicker). The main reason for this is largely practical e.g., for carrying things or travelling with children. Their most preferred alternatives are walking and cycling. They walk a lot already because they see it as healthy and enjoyable and are likely to try and fit it into their daily routine as much as possible. They consider cycling to offer freedom, speed and fitness. They are likely to be motivated by environmental issues. |
| Practical Travellers | They regard the car merely as a practical means for travelling and largely use it only when necessary. They walk and cycle a lot as they believe these modes can often be faster, cheaper and generally more convenient than the car. However, the PT is something they feel is often inferior because of the time it takes. They do not tend to walk or cycle for fitness, but keeping fit is important to them. They would not change much about how they currently travel as they feel they are already making optimum choices given their commitments and what they have available to them. |
| Car Contemplators | They are likely to not be able to afford a car at the moment. However, they aspire to own a car in a near future as they believe it is a sign of being successful and will provide independence and freedom. Cycling is not something they want to do more of and see it as impractical and stressful mode. They see walking as practical, good for fitness and something they intend to do more of, but generally limited as a mode of transport. They see even more problems with using the PT and whilst they might use it a lot at the moment, they prefer the car for future. |
| PT Dependents | Although they are not against cars and think people should be allowed to use them freely, they don’t like driving very much. They consider the PT to be too slow and do not see themselves as a cyclist. They don’t mind walking and would like to do more of it, particularly for fitness. They have very little interest in environmental issues and do not think they concern them very much, although local pollution and congestion is a concern. |
| Car-free Choosers | They are not keen to use the car and believe that their impacts are something that needs to be urgently addressed. They can see benefits of travelling by walking (they see it as healthy and would like do more of it), cycling (they like the sense of freedom it gives you and feel it says something about who they are and how they feel about protecting the environment) and using the PT (they find it enjoyable and relaxing). |
| Train | Bus | Car | e-Car | Bike | Walk | Unit | |
|---|---|---|---|---|---|---|---|
| CO2 | 22.7 | 85 | 132 | 38 | 3 × 10⁻⁴ | 1 × 10⁻⁵ | g/km |
| Train | Bus | Car | e-Car | Bike | Walk | Unit | |
|---|---|---|---|---|---|---|---|
| PM2.5 emission | 0 | 1 × 10⁻⁵ | 7 × 10⁻⁶ | 0 | 0 | 0 | kg/km |
| Train | Bus | Car | e-Car | Bike | Walk | Unit | |
|---|---|---|---|---|---|---|---|
| energy | 3 | 3 | 4.5 | 4.5 | 20 | 57 | kcal/km |
| Train | Bus | Car | e-Car | Bike | Walk | Unit | |
|---|---|---|---|---|---|---|---|
| cost | 0.25 | 0.7 | 0.3461 | 0.287 | 0.039 | 0 | €/km |
© 2016 by the authors; licensee MDPI, Basel, Switzerland. This article is an open access article distributed under the terms and conditions of the Creative Commons Attribution (CC-BY) license (http://creativecommons.org/licenses/by/4.0/).
Share and Cite
Semanjski, I.; Bellens, R.; Gautama, S.; Witlox, F. Integrating Big Data into a Sustainable Mobility Policy 2.0 Planning Support System. Sustainability 2016, 8, 1142. https://doi.org/10.3390/su8111142
Semanjski I, Bellens R, Gautama S, Witlox F. Integrating Big Data into a Sustainable Mobility Policy 2.0 Planning Support System. Sustainability. 2016; 8(11):1142. https://doi.org/10.3390/su8111142
Chicago/Turabian StyleSemanjski, Ivana, Rik Bellens, Sidharta Gautama, and Frank Witlox. 2016. "Integrating Big Data into a Sustainable Mobility Policy 2.0 Planning Support System" Sustainability 8, no. 11: 1142. https://doi.org/10.3390/su8111142
APA StyleSemanjski, I., Bellens, R., Gautama, S., & Witlox, F. (2016). Integrating Big Data into a Sustainable Mobility Policy 2.0 Planning Support System. Sustainability, 8(11), 1142. https://doi.org/10.3390/su8111142