
Design and Implementation of a Microgrid Energy Management System

Abstract
:1. Introduction
- (1)
- We design a microgrid EMS with consideration of both the functional requirements and the engineering challenges. Many existing energy management systems have focused on one aspect. On the one hand, a system highlighting the functional requirements usually assumes the existence of computer systems, software, and communications and regards them as a black box. This setting, however, often uses proprietary technologies and thus is not extensible. Moreover, the system often provides predefined energy applications. It is hard to upgrade the system in order to support emerging applications. A microgrid EMS must be flexible from the software point of view to accommodate brand-new applications easily. There is an analogy in the cellular phone area. In the feature phone era, users used pre-installed applications that were very crude. Now, we observe that a user can develop any smartphone applications and sell them at APP stores. On the other hand, a system focusing on computer systems and communications usually implements specialized scheduling and control algorithms. Such algorithms are often customized to the underlying communication technologies and network topologies. In order to adopt new algorithms, the system may be rebuilt and these configurations are re-customized. To address these challenges, we design the MP with a modular system in mind. The MP is developed as a framework in which a variety of modules (e.g., scheduling algorithm module and communication module) are added and/or deleted seamlessly. For instance, a specific power generation model can be added and incorporated in an existing optimization module. In this way, the MP supports the functional requirements and addresses the engineering challenges.
- (2)
- We develop the MP prototype in a resource-oriented architecture (ROA) style [9]. Most previous microgrid systems have been implemented in a multi-agent system architecture or a service-oriented architecture (SOA) style that functions well in a homegeneous, proprietary, and server-centered system environment. However, an emerging microgrid environment includes deployment of heterogeneous energy devices using different communication technologies and use of a variety of standard message formats. A new microgrid system, therefore, must be able to cope with heterogeneity and diversity so as to communicate with energy devices seamlessly in an interoperable manner. A plug-and-play trend would be an example—say, a new smart meter from a random third-party vendor using new technologies is added to a microgrid. This device must be able to communicate with the microgrid system or with other energy devices (if necessary) with minimum configuration so as to be ready to be used. With traditional architecture styles, we must re-build a microgrid management system to customize so as to communicate with the brand-new device. The MP prototype addresses this system engineering issue by adopting the ROA that abstracts an energy device as a resource—a software conterpart of the hardware itself. Just as the concept of Class in a Java programming language, a resource in the ROA maintains states and takes actions. Unlike the Java, however, the resource makes real communications and interactions with other energy devices or the microgrid system. Because of this abstraction concept, our MP can work in a distributed environment. To implement the sofware part and the abstraction, we take an Energy Service Interface (ESI) technology [10].
- (3)
- We deploy the MP prototype in our testbeds and run experiments to evaluate performance of microgrid management and controls. A microgrid is a complicated and delicate system, and thus development, deployment, and evaluation of its management system must be carefully designed and performed. When deploying the prototype and connected energy devices, thus building a microgrid system testbed, we must consider how much data we can obatin from the testbed. The more we get data, the more accurately we are able to run and evaluate optimization algorithms. We also take into account the diversity of energy devices. Unlike a simulation study, there are many challenges in a testbed environment. For instance, it is not trivial to install EV charging stations on a testbed because of both technical problems and administrative issues. Even if installed, we may not obtain ample information mainly due to low penetration of EVs in the real world. The MP as an energy management system in a microgrid must be able to communicate with external systems such as a demand response server. For evaluation, we must consider what external signals are delivered into the microgrid because these signals directly affect performance of scheduling and control algorithms. This paper designs the deployment of the prototype and connected energy devices by taking into account all the major factors. As a result, we build two real-world testbeds of microgrid including the MP prototype.
2. Design of a Microgrid Energy Management System
2.1. Functional Requirements
2.1.1. Forecasting Energy Activities
2.1.2. Optimization: Making a Control Decision for Optimal Operations
2.1.3. Analysis on Energy Data
2.1.4. Human–Machine Interface
2.2. Engineering Challenges in Communications
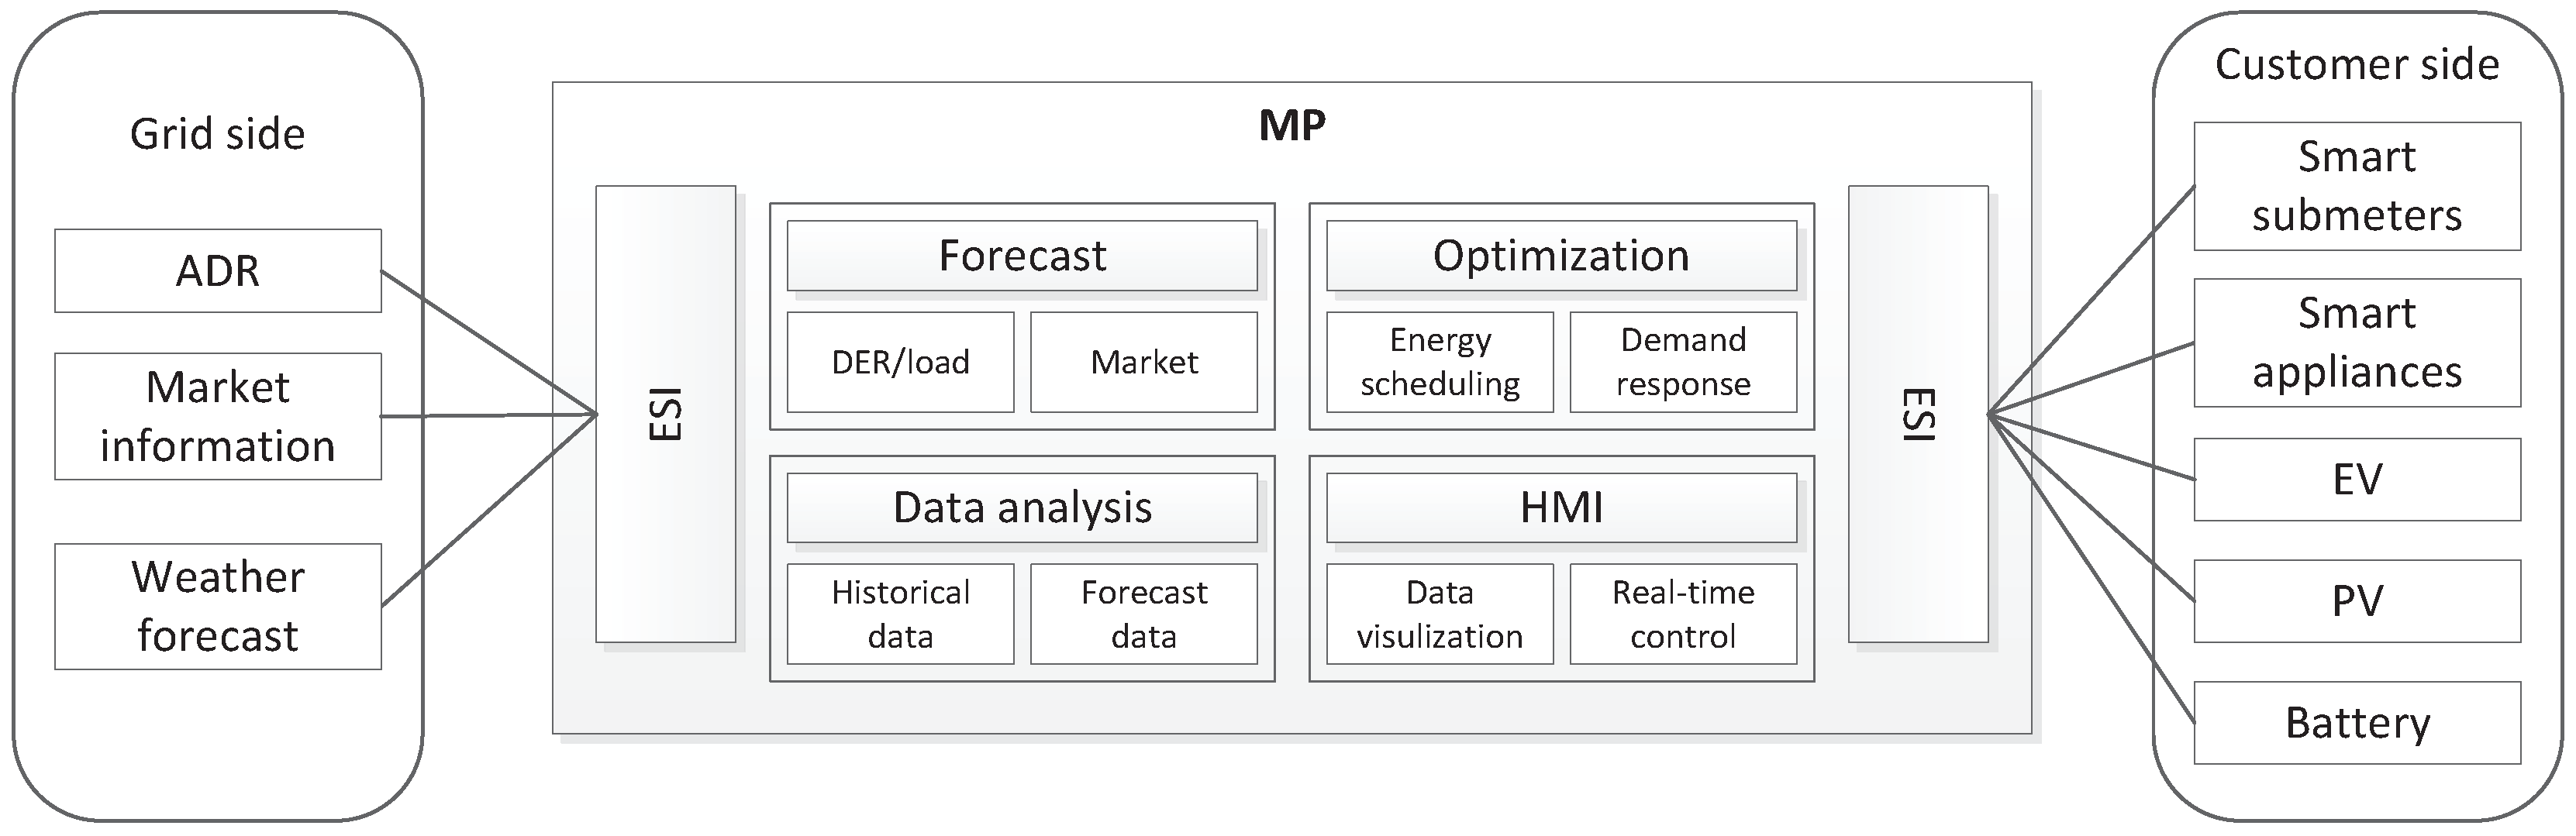
3. Microgrid Platform
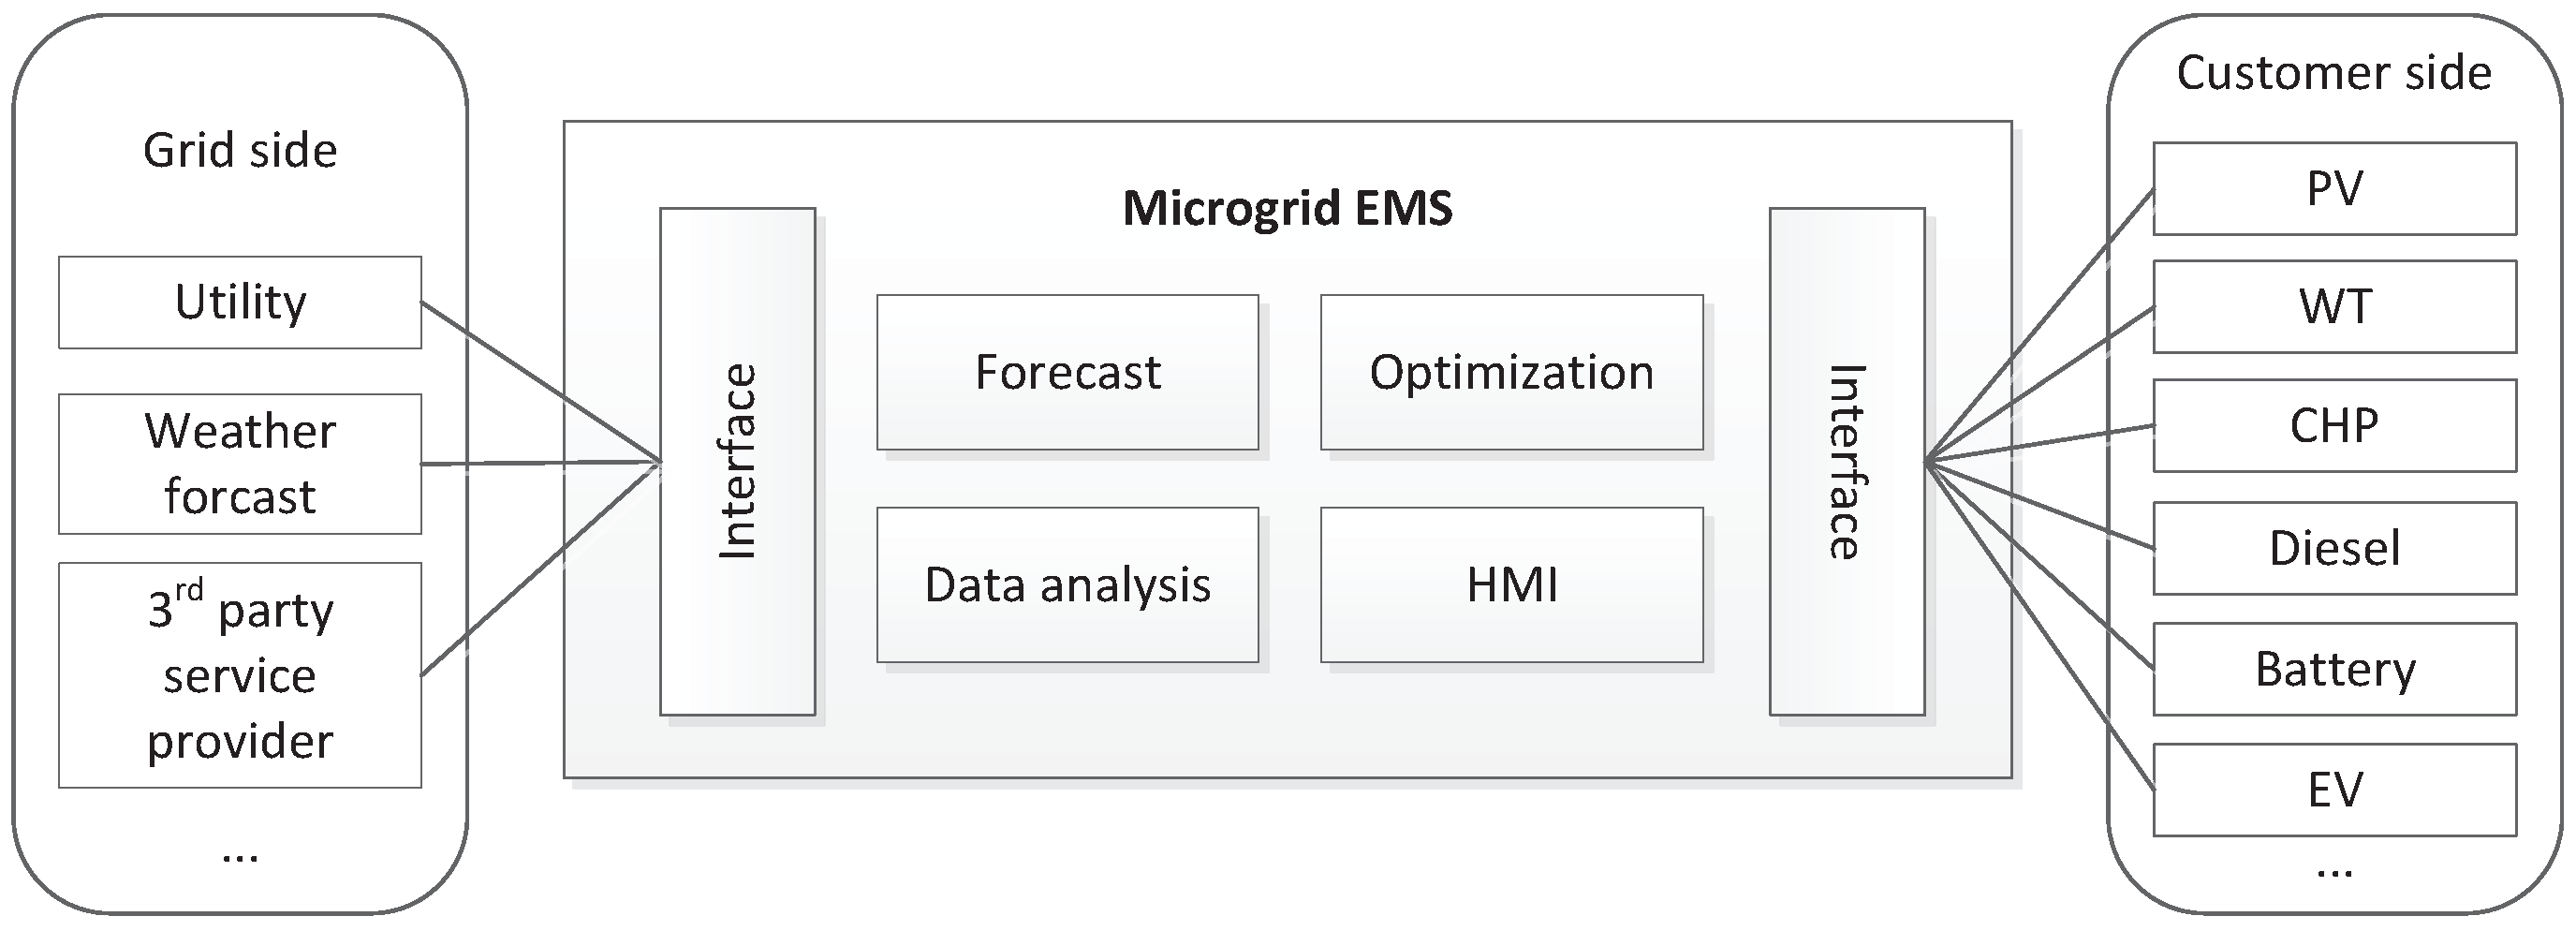
3.1. System Architecture
3.1.1. Interoperation—Energy Services from the Facility
Energy Services
Energy Service Interface
3.1.2. Interoperation—Energy Services from the Grid
Open Automated Demand Response
Real-Time Pricing for Retail Energy Market
Consuming the Service Data
3.1.3. Communication Model
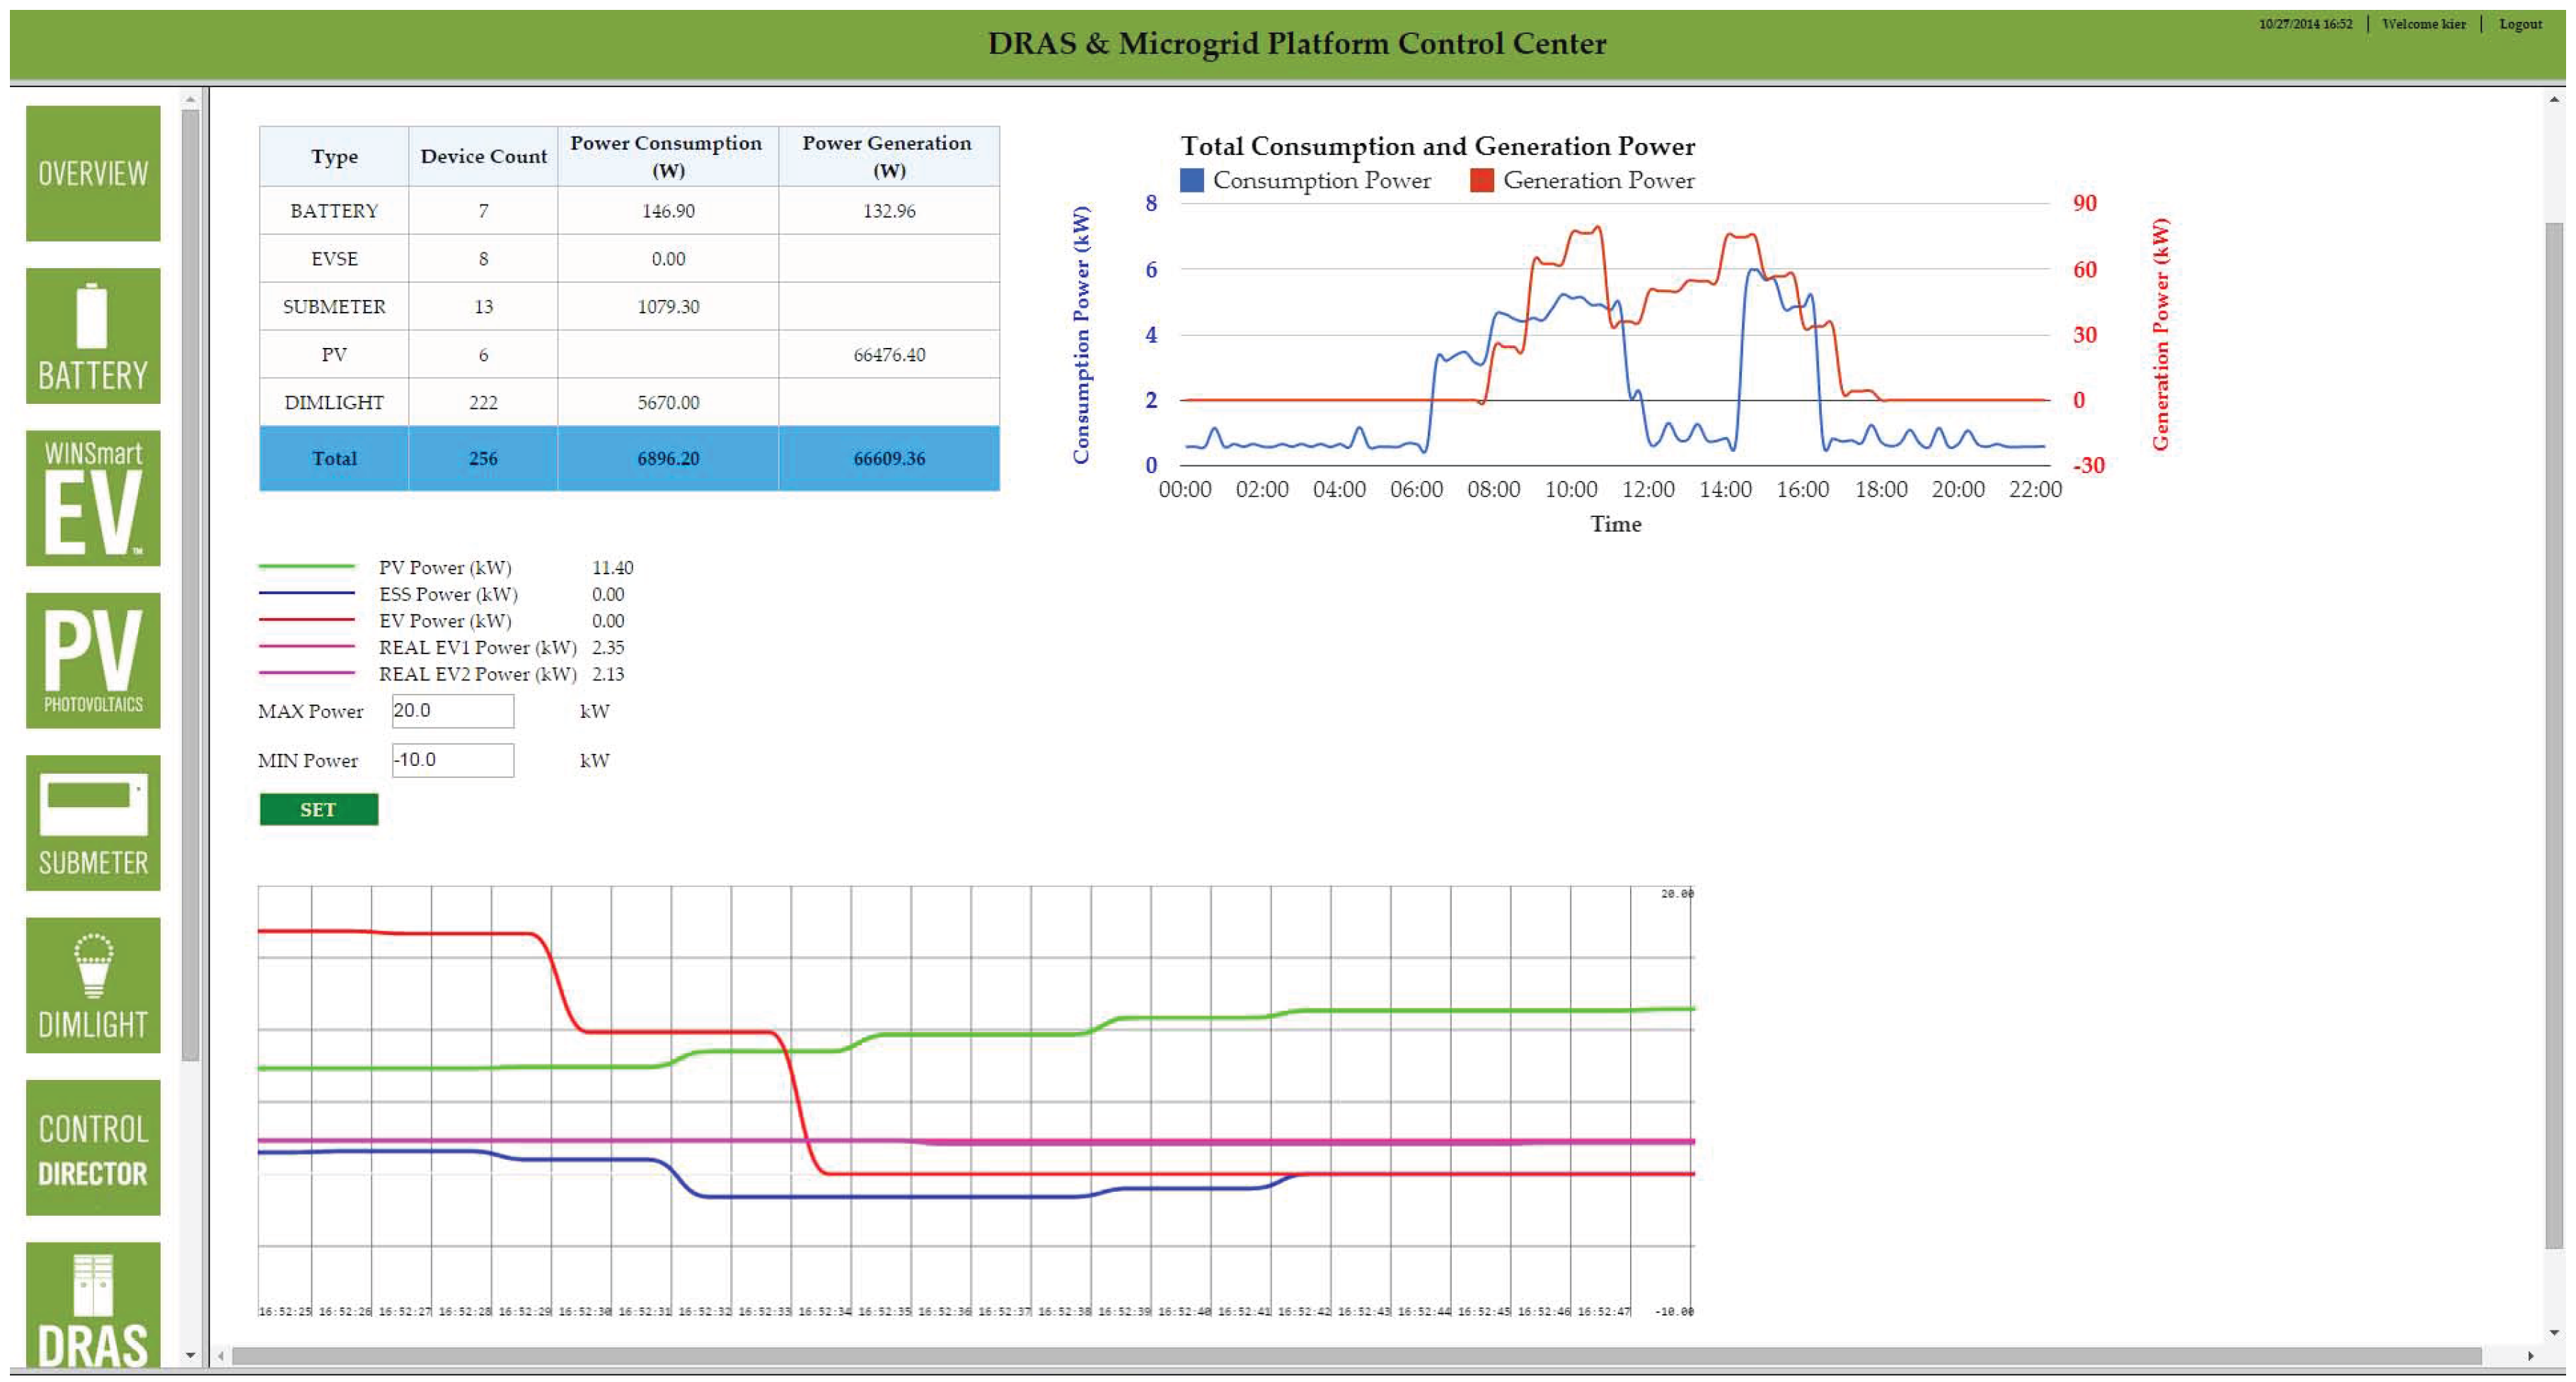
3.1.4. User Interface
3.2. Microgrid Control
3.2.1. System Model
3.2.2. Energy Scheduling
3.2.3. Demand Response
4. Testbeds and Experiments
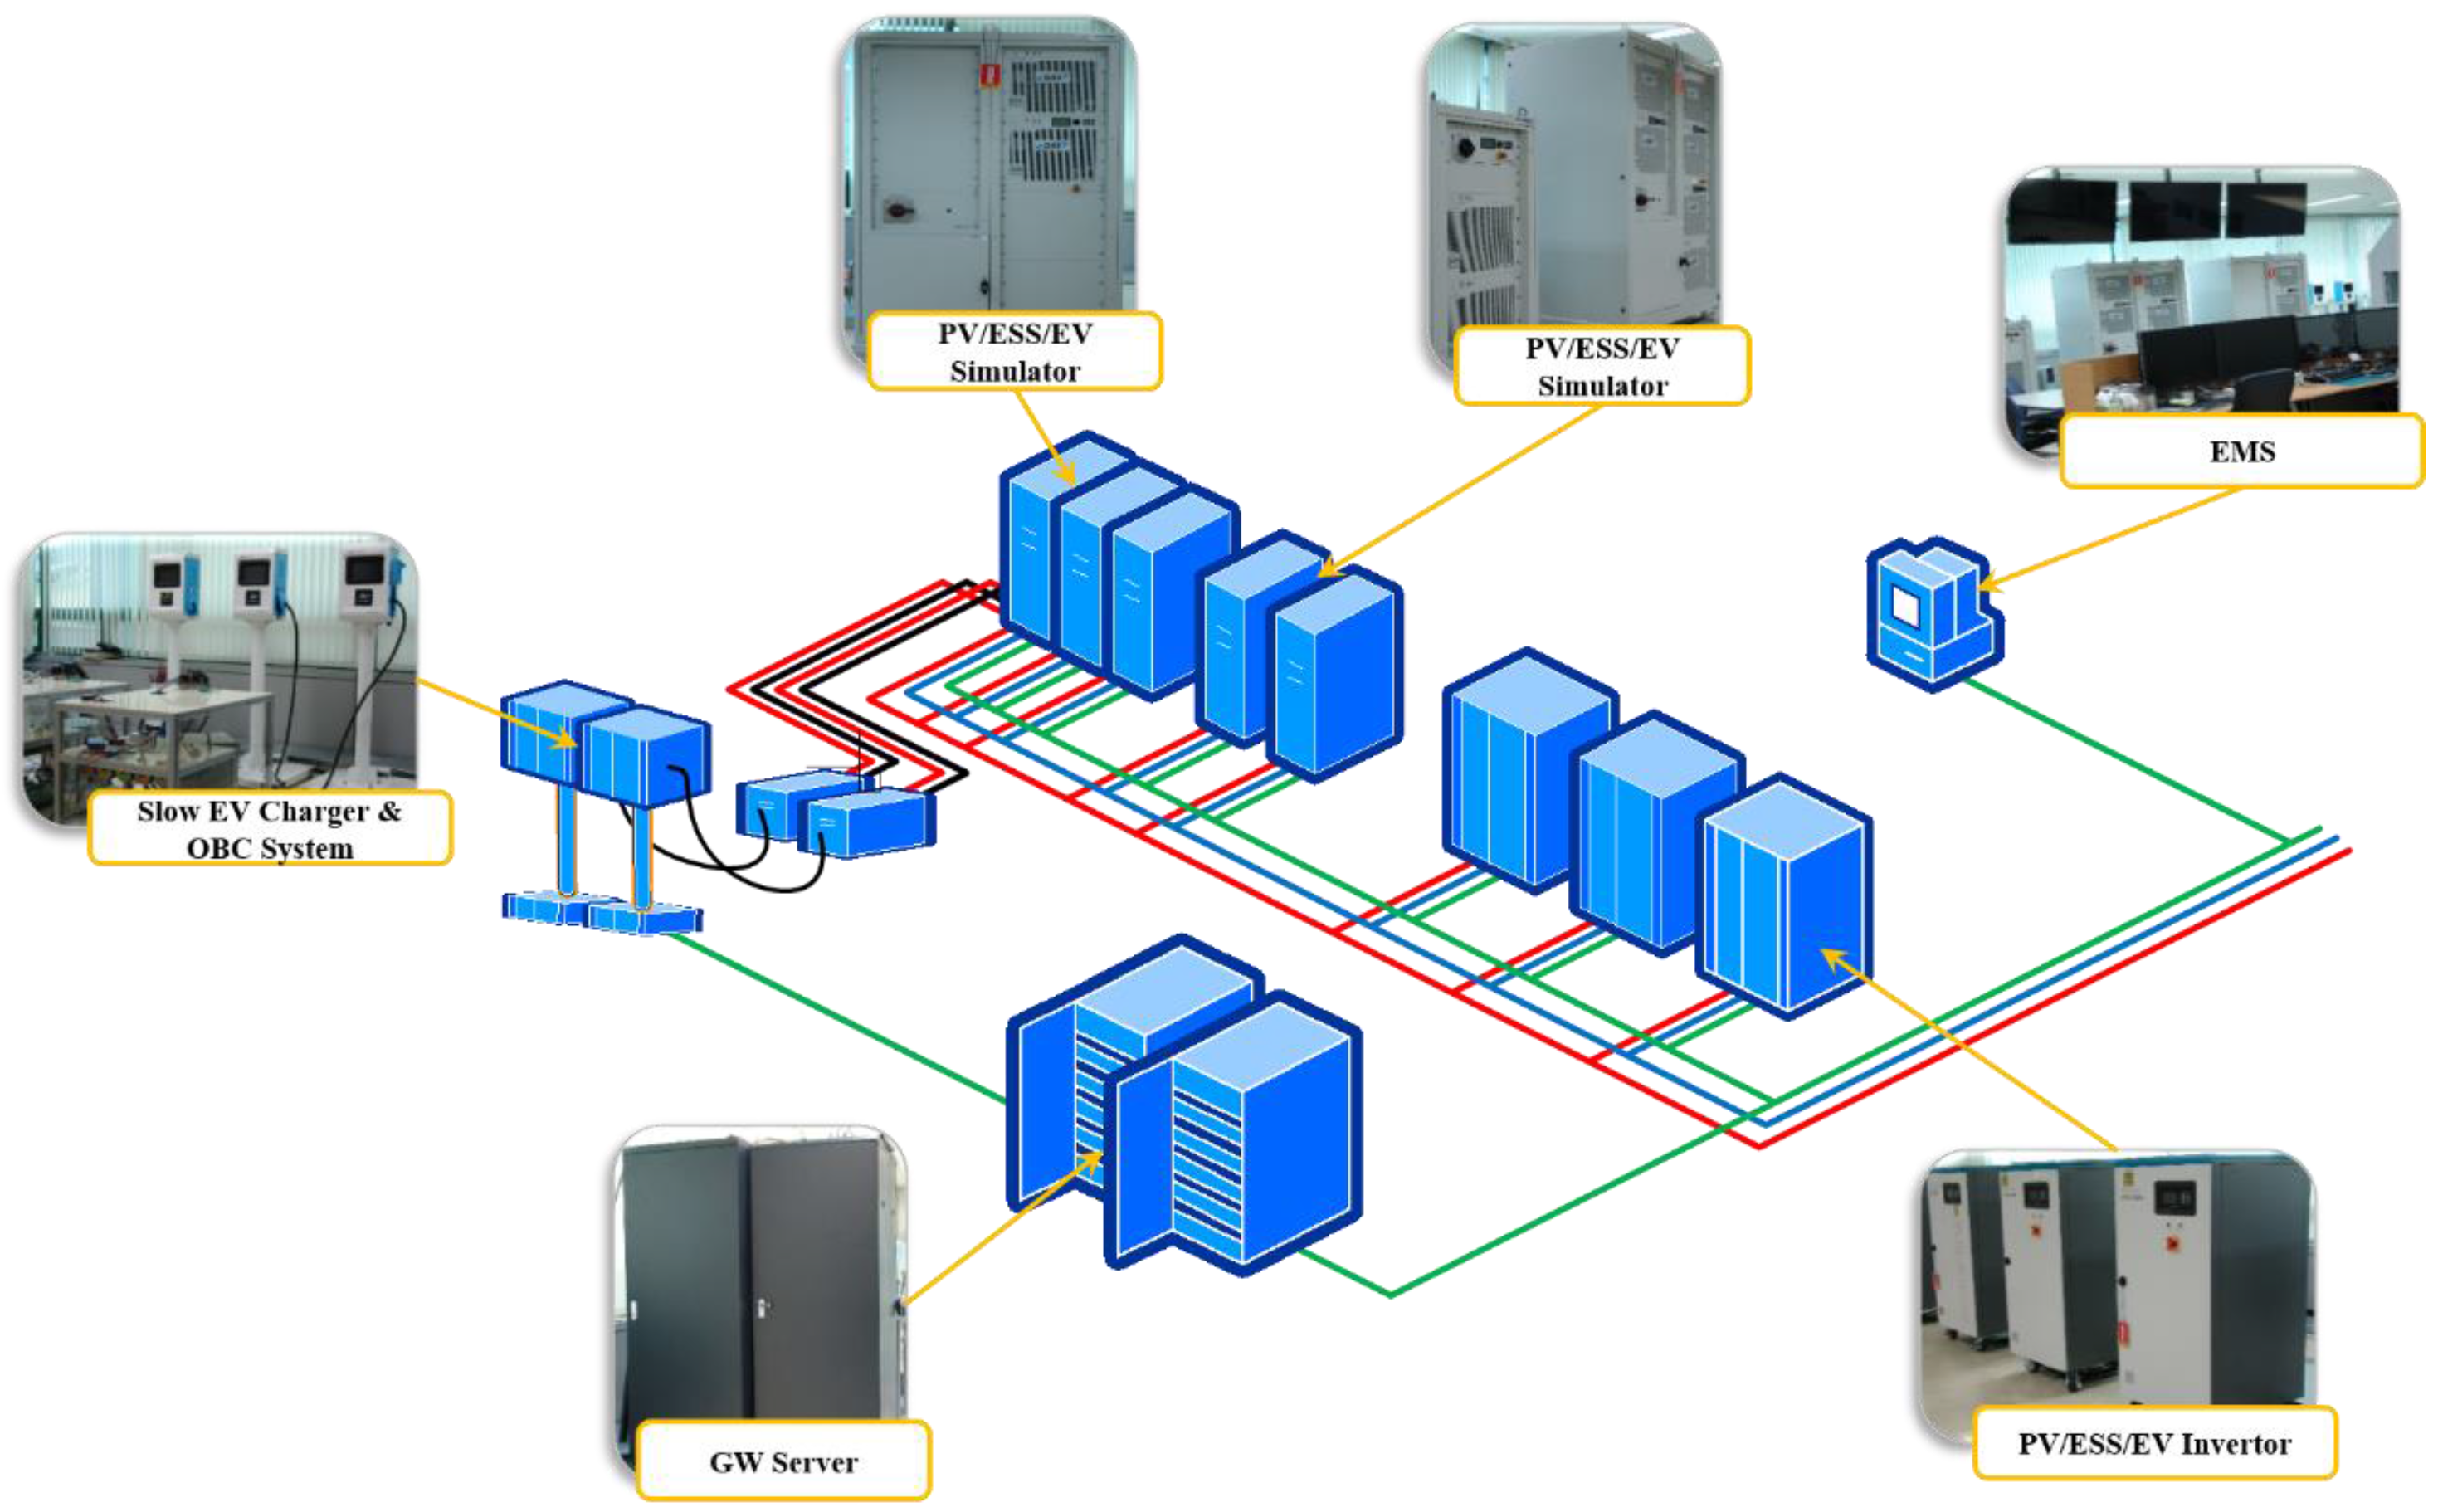
4.1. Microgrid Testbeds
4.1.1. UCLA Site
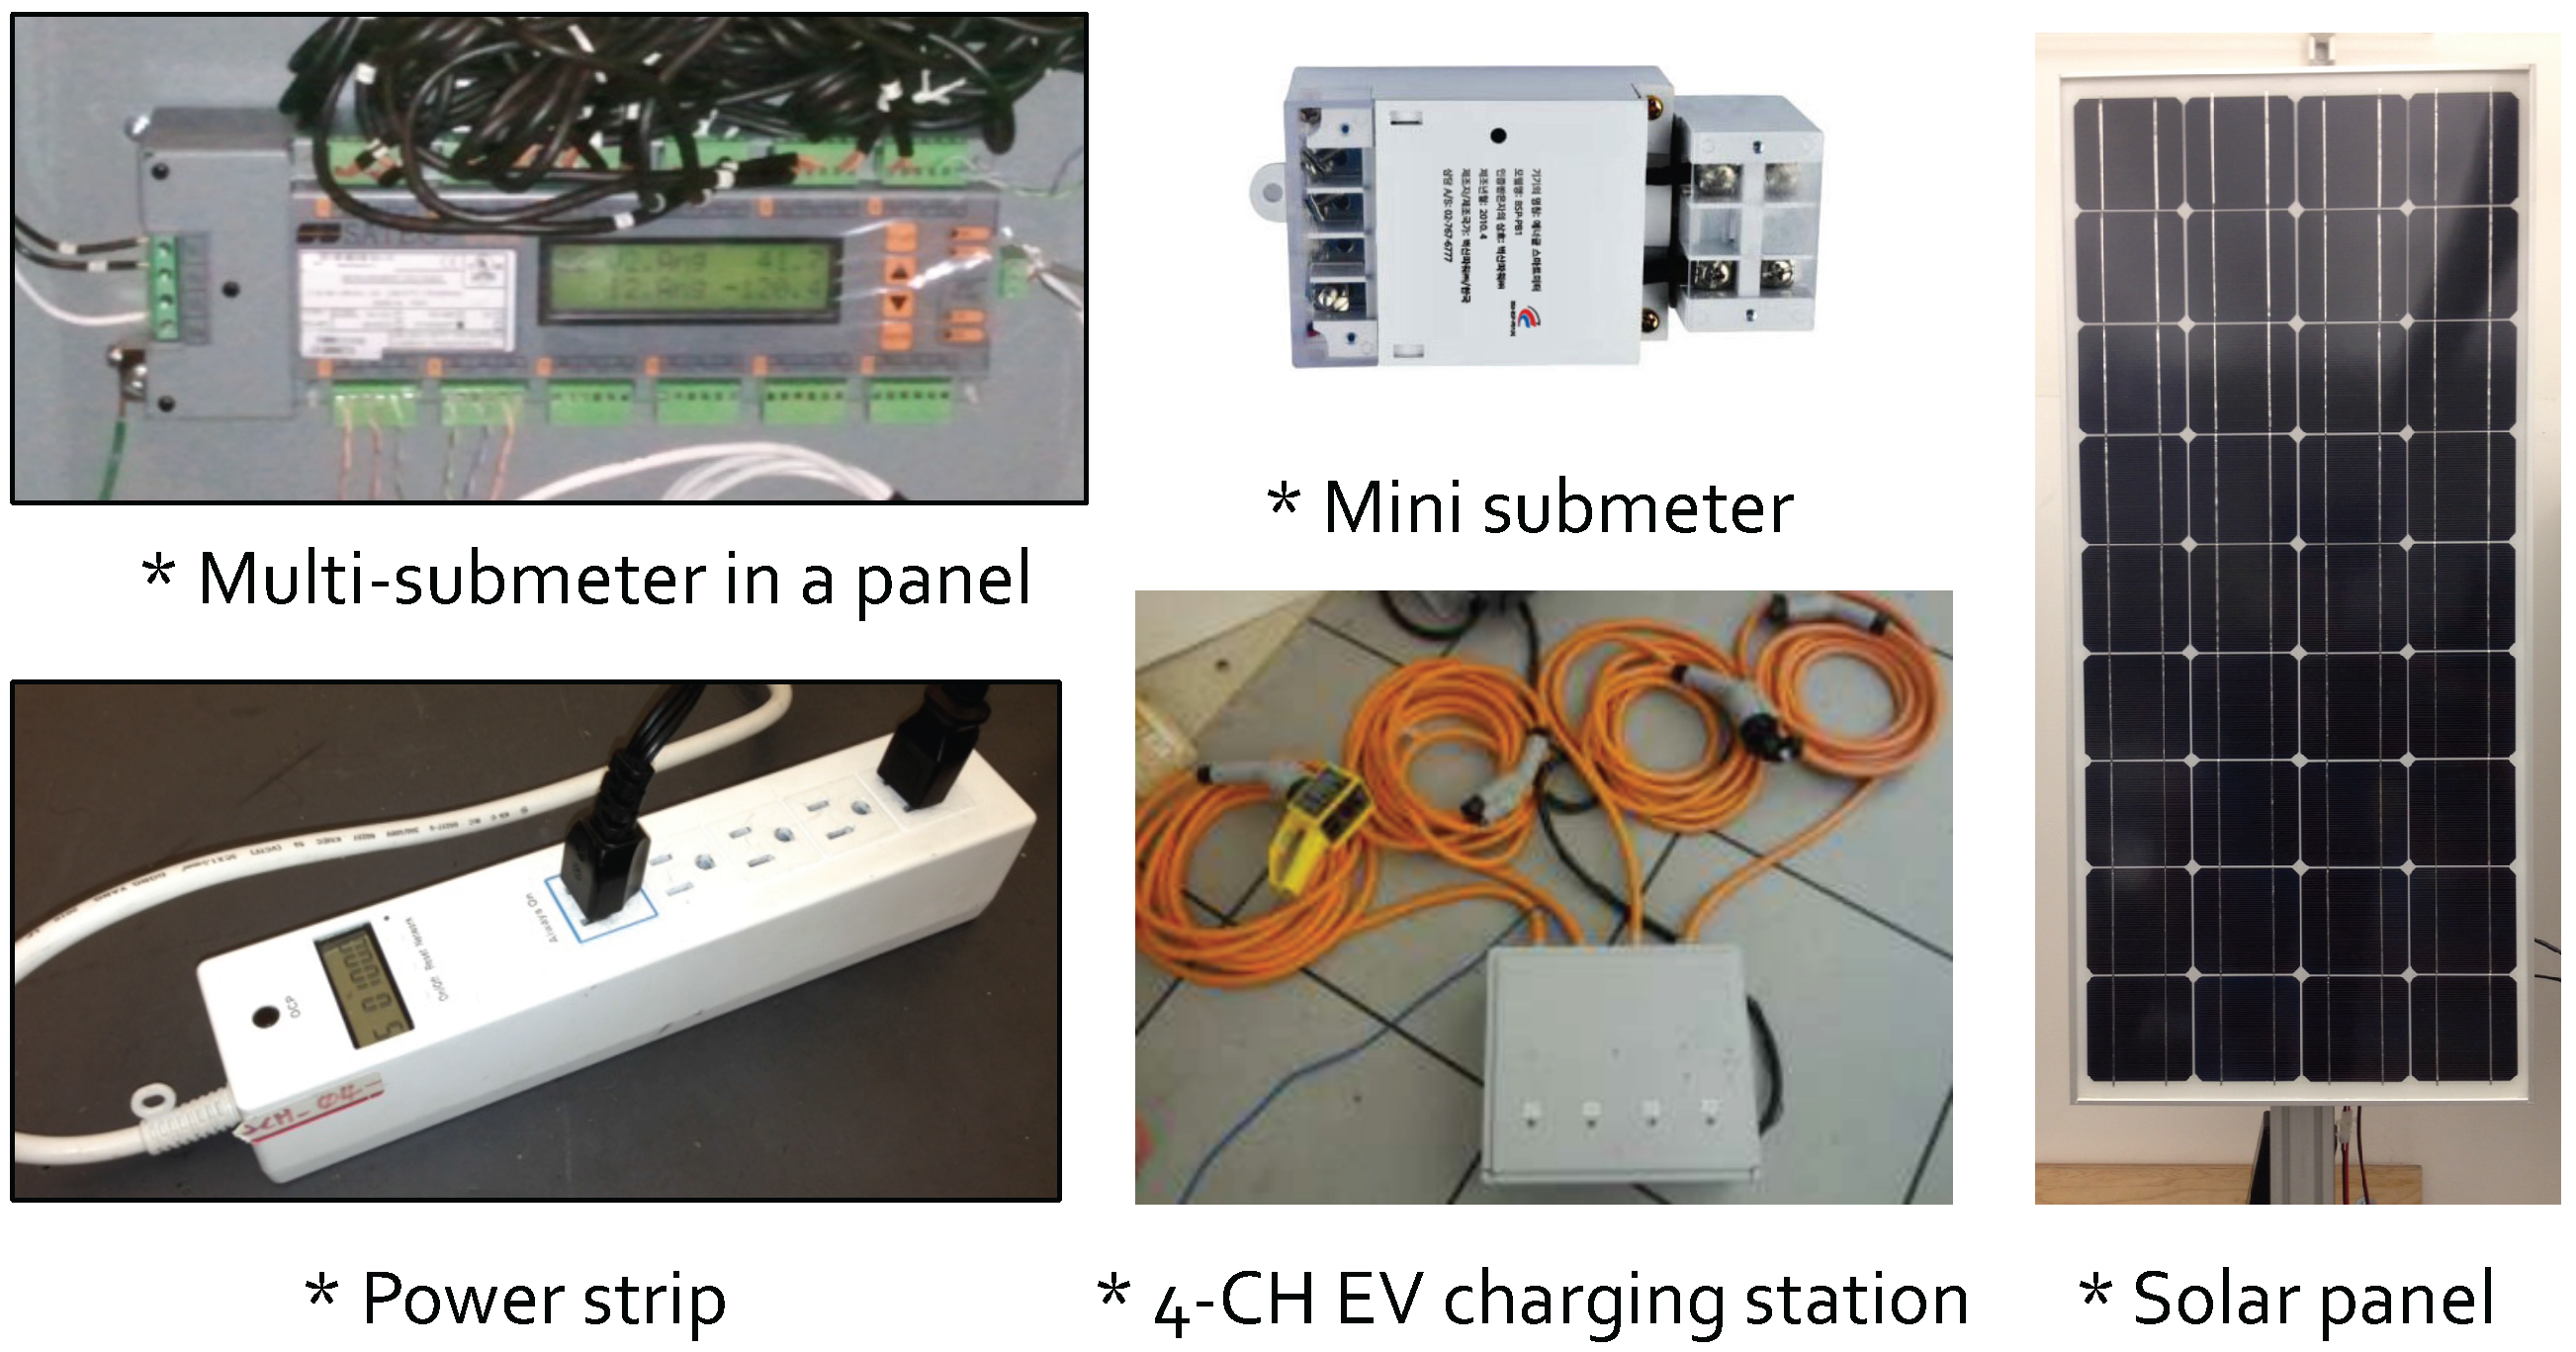
Smart Submeter
Office Appliance with Plug-Load Meter
Smart Equipment
Smart Home Appliance
EV Charging Station
Solar Panel and Battery
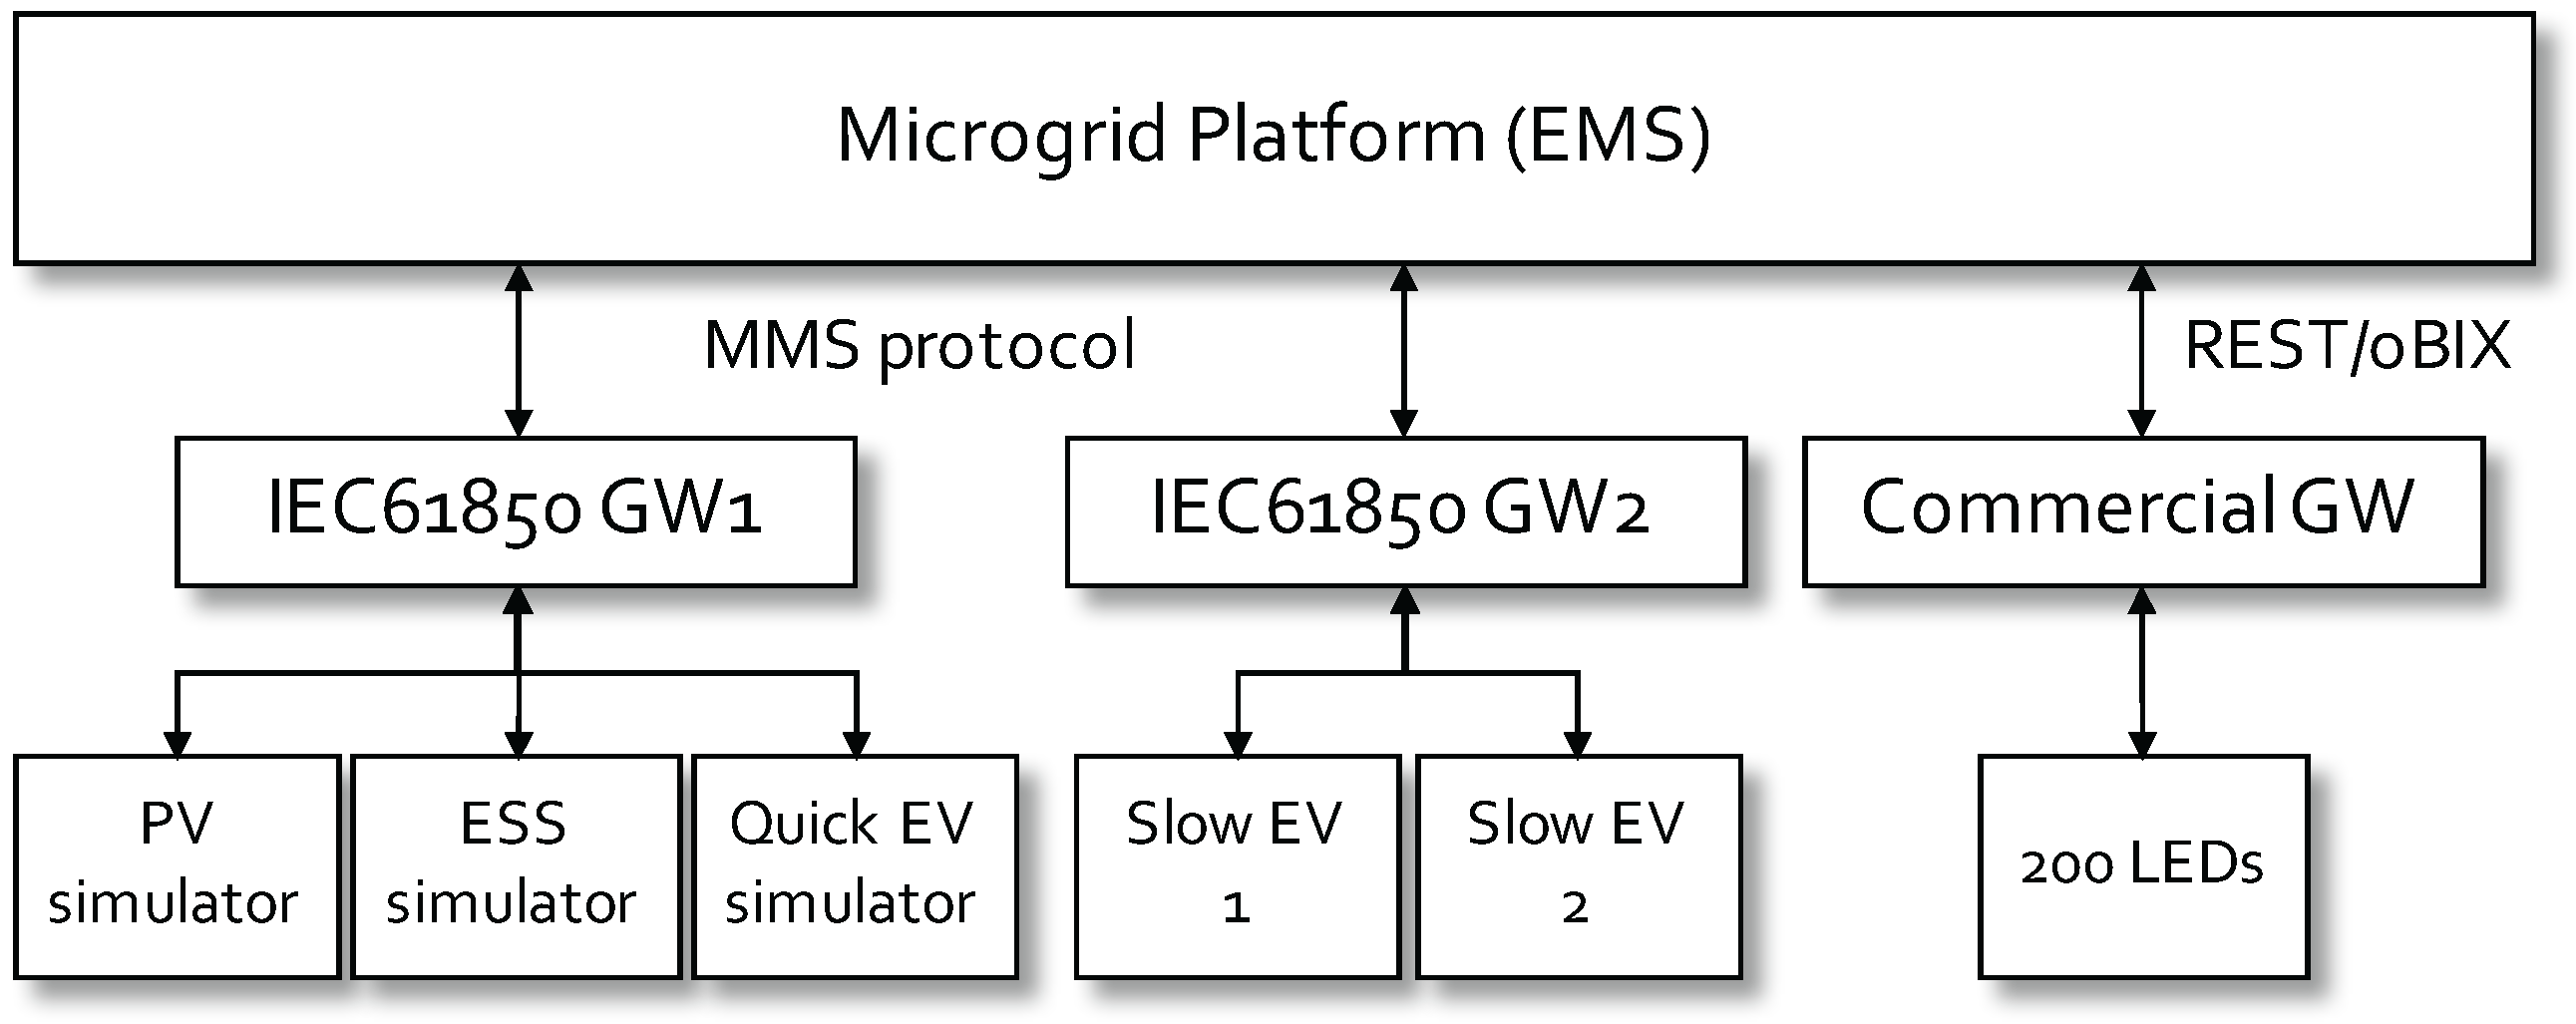
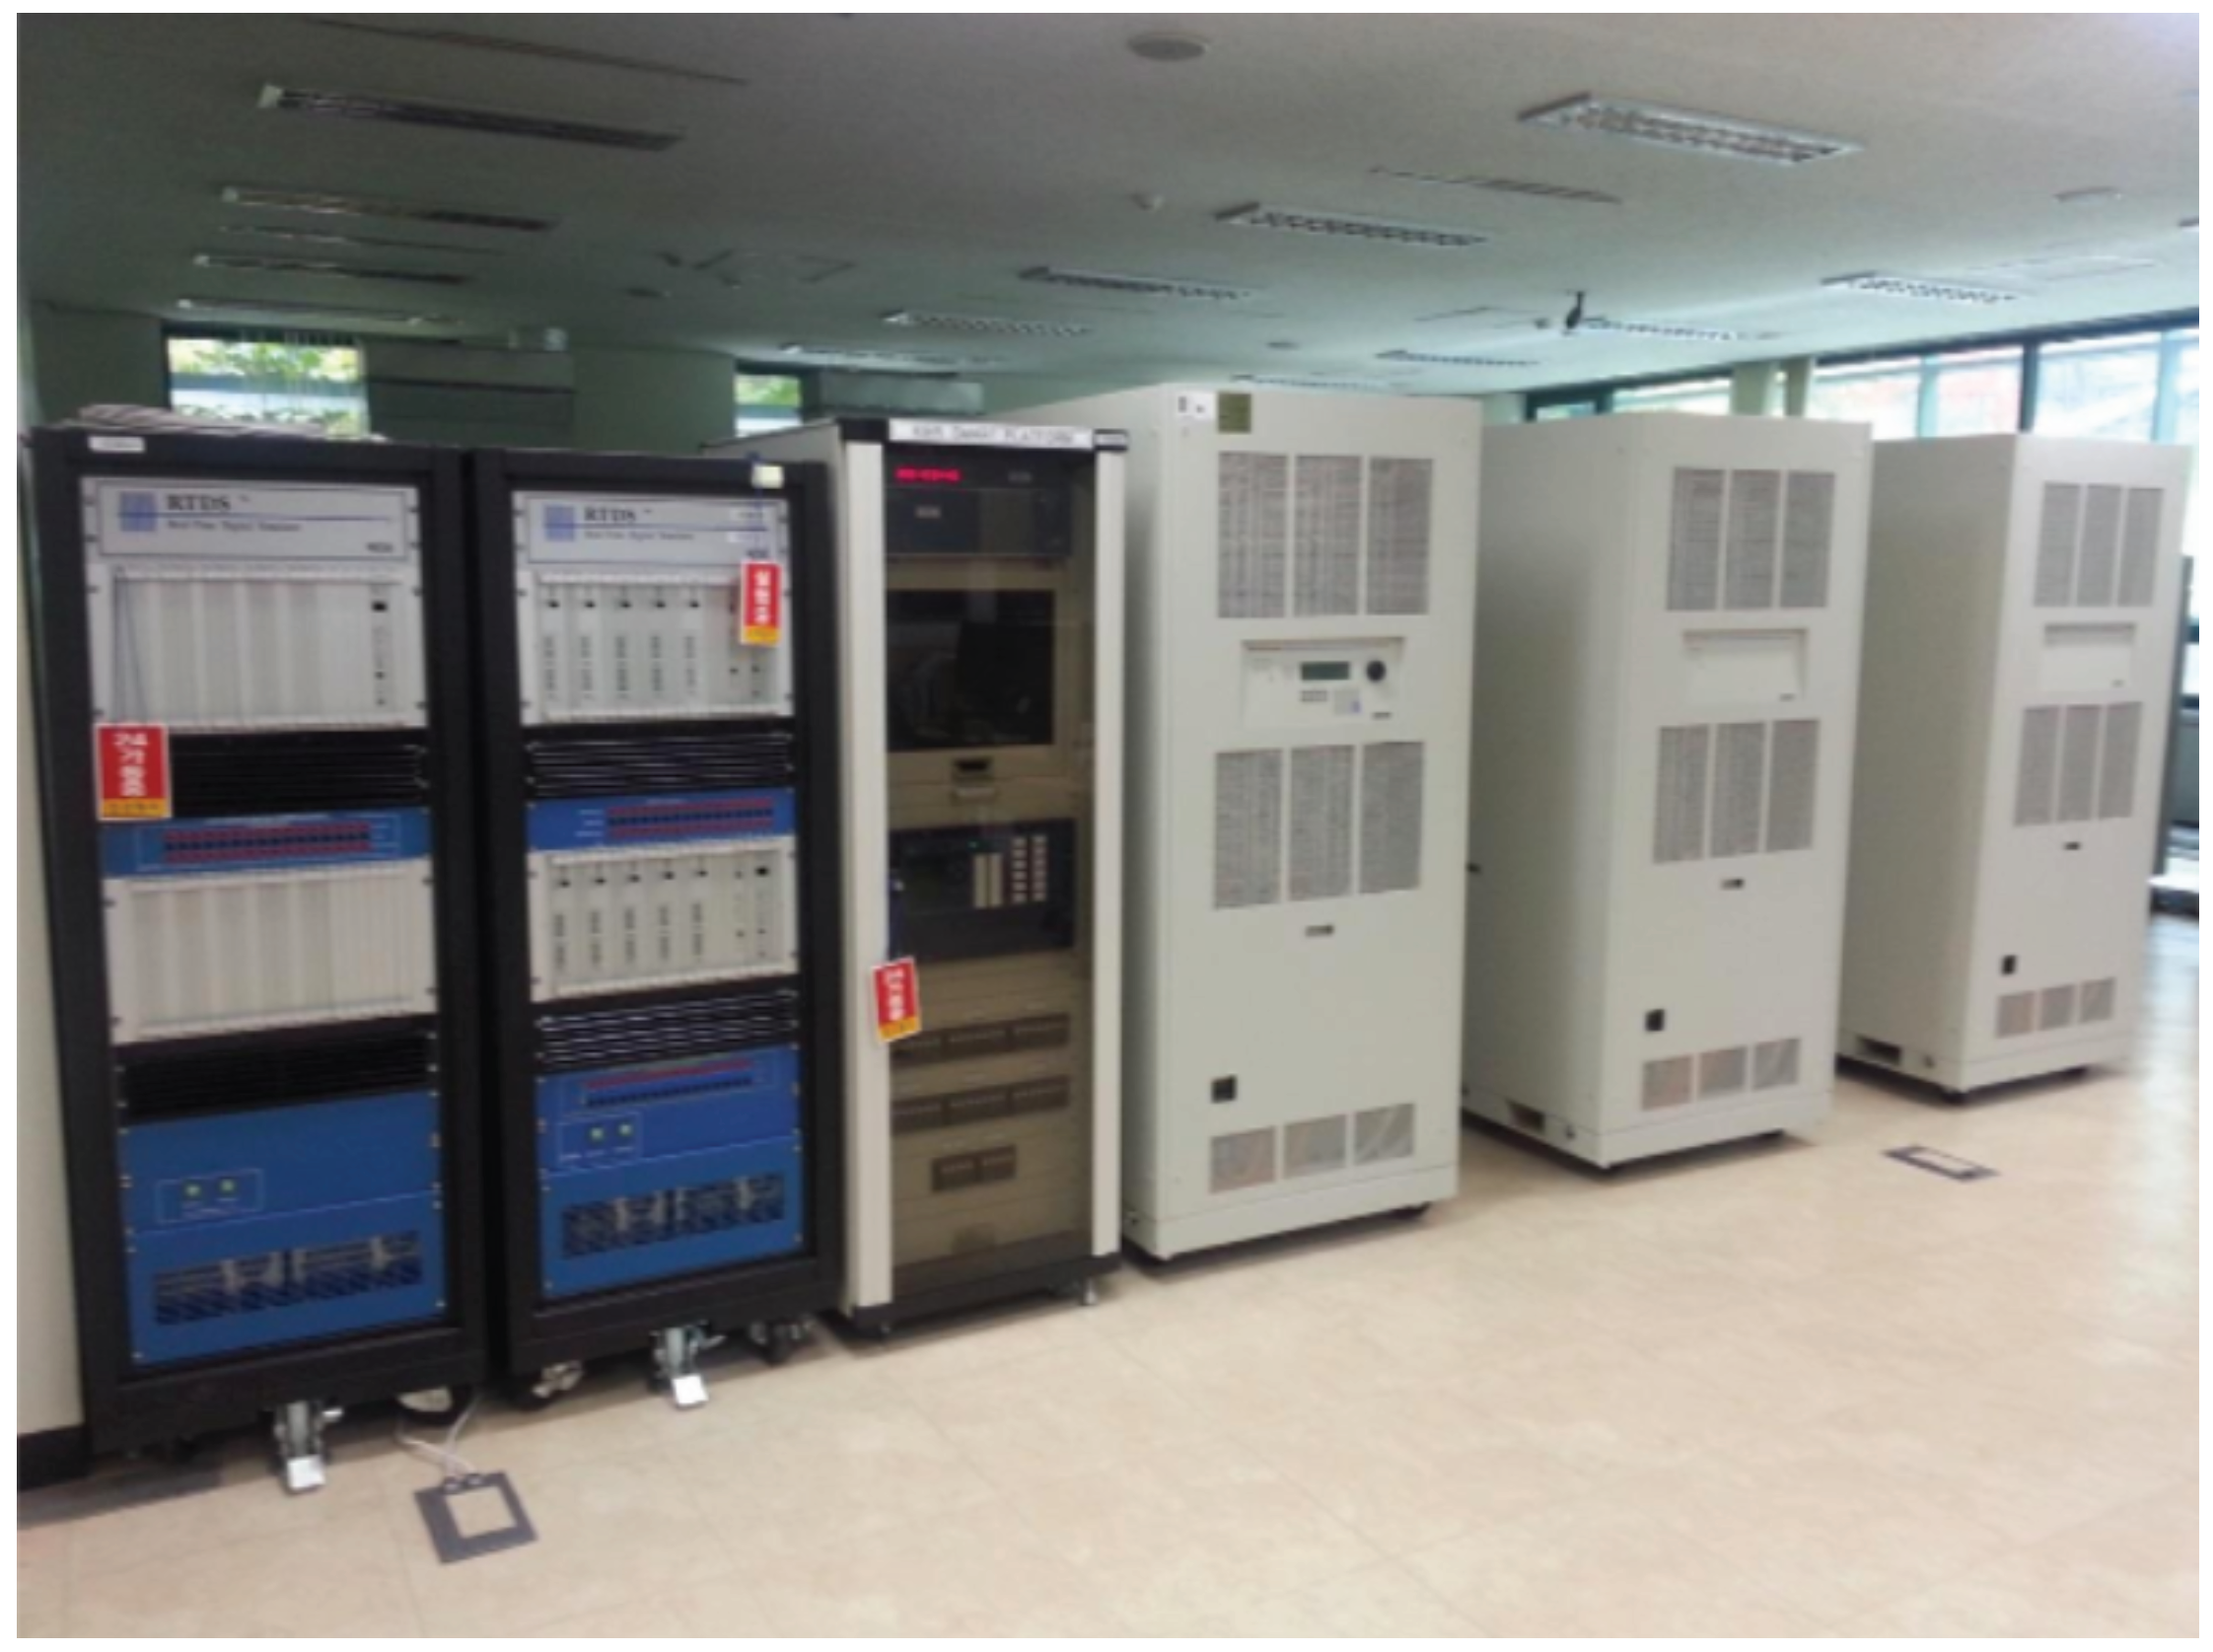
4.1.2. KIER Site
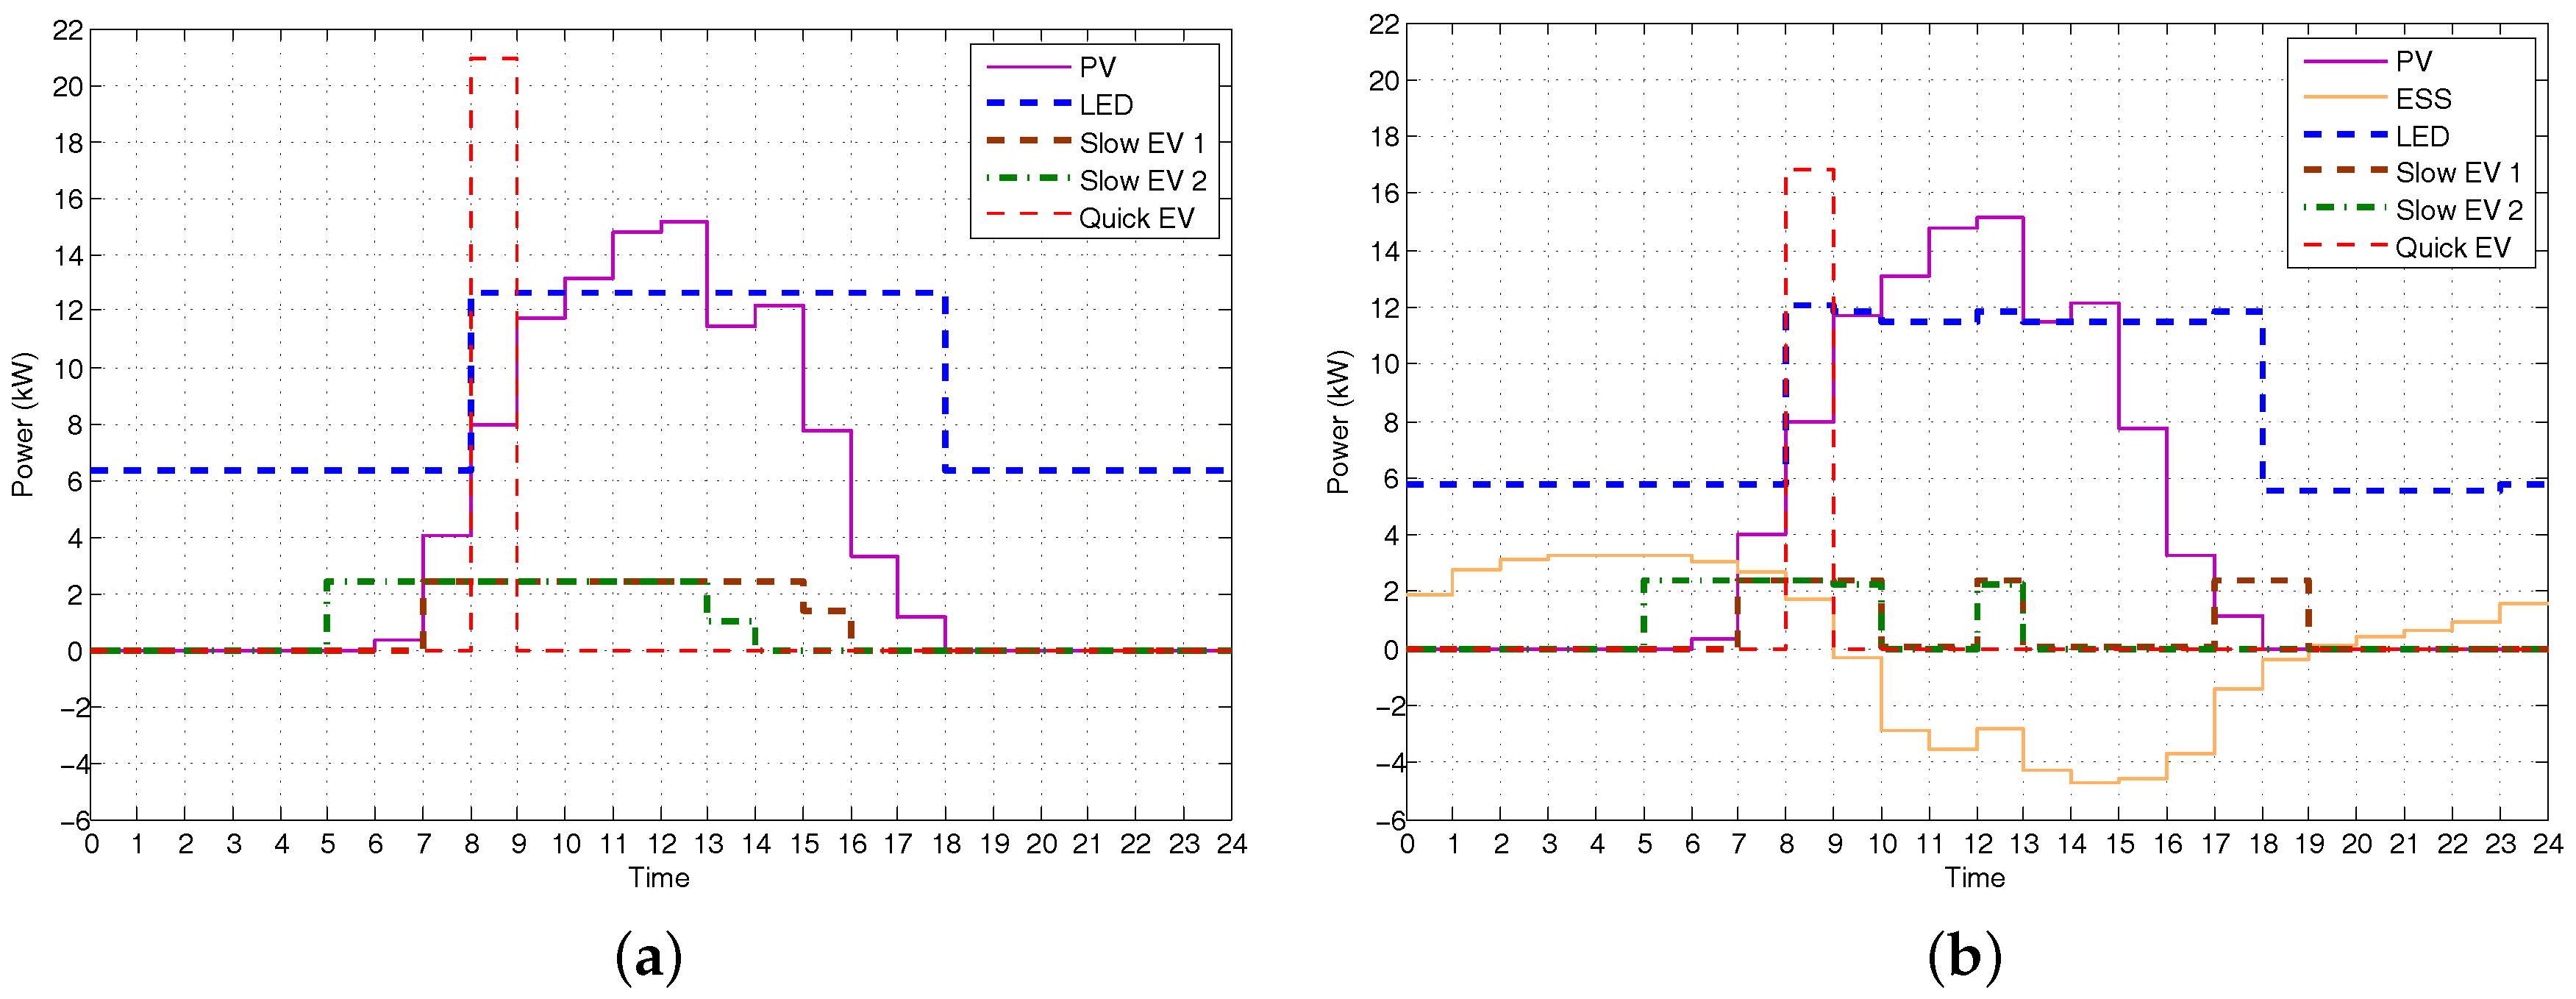
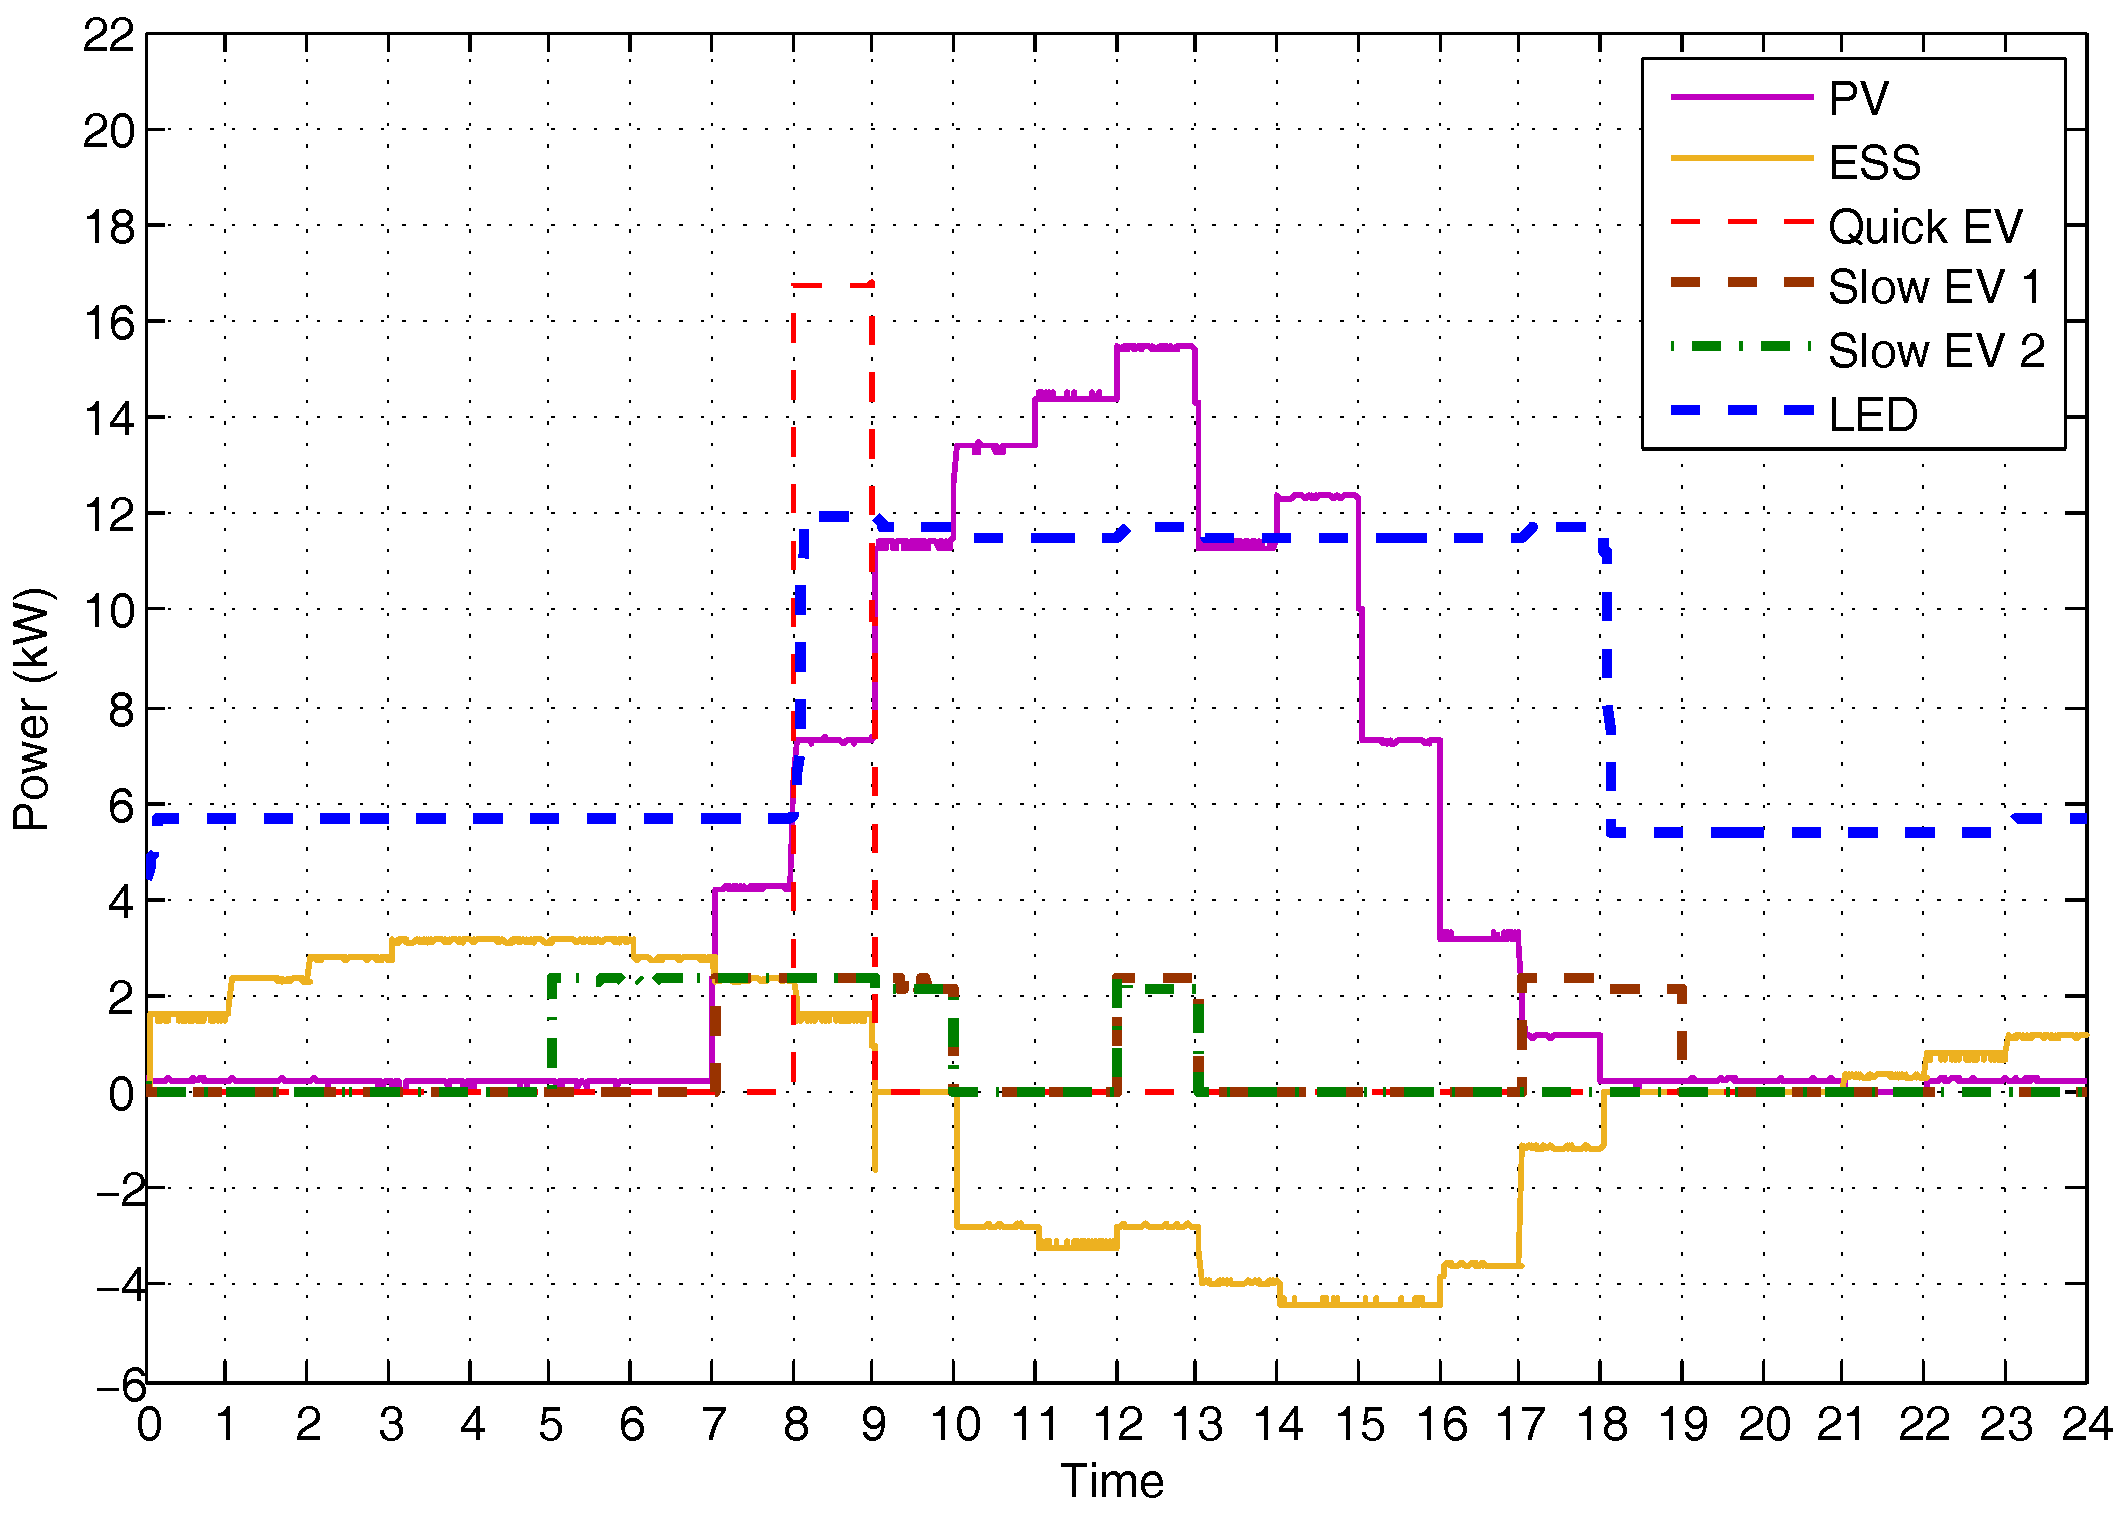
4.2. Energy Scheduling
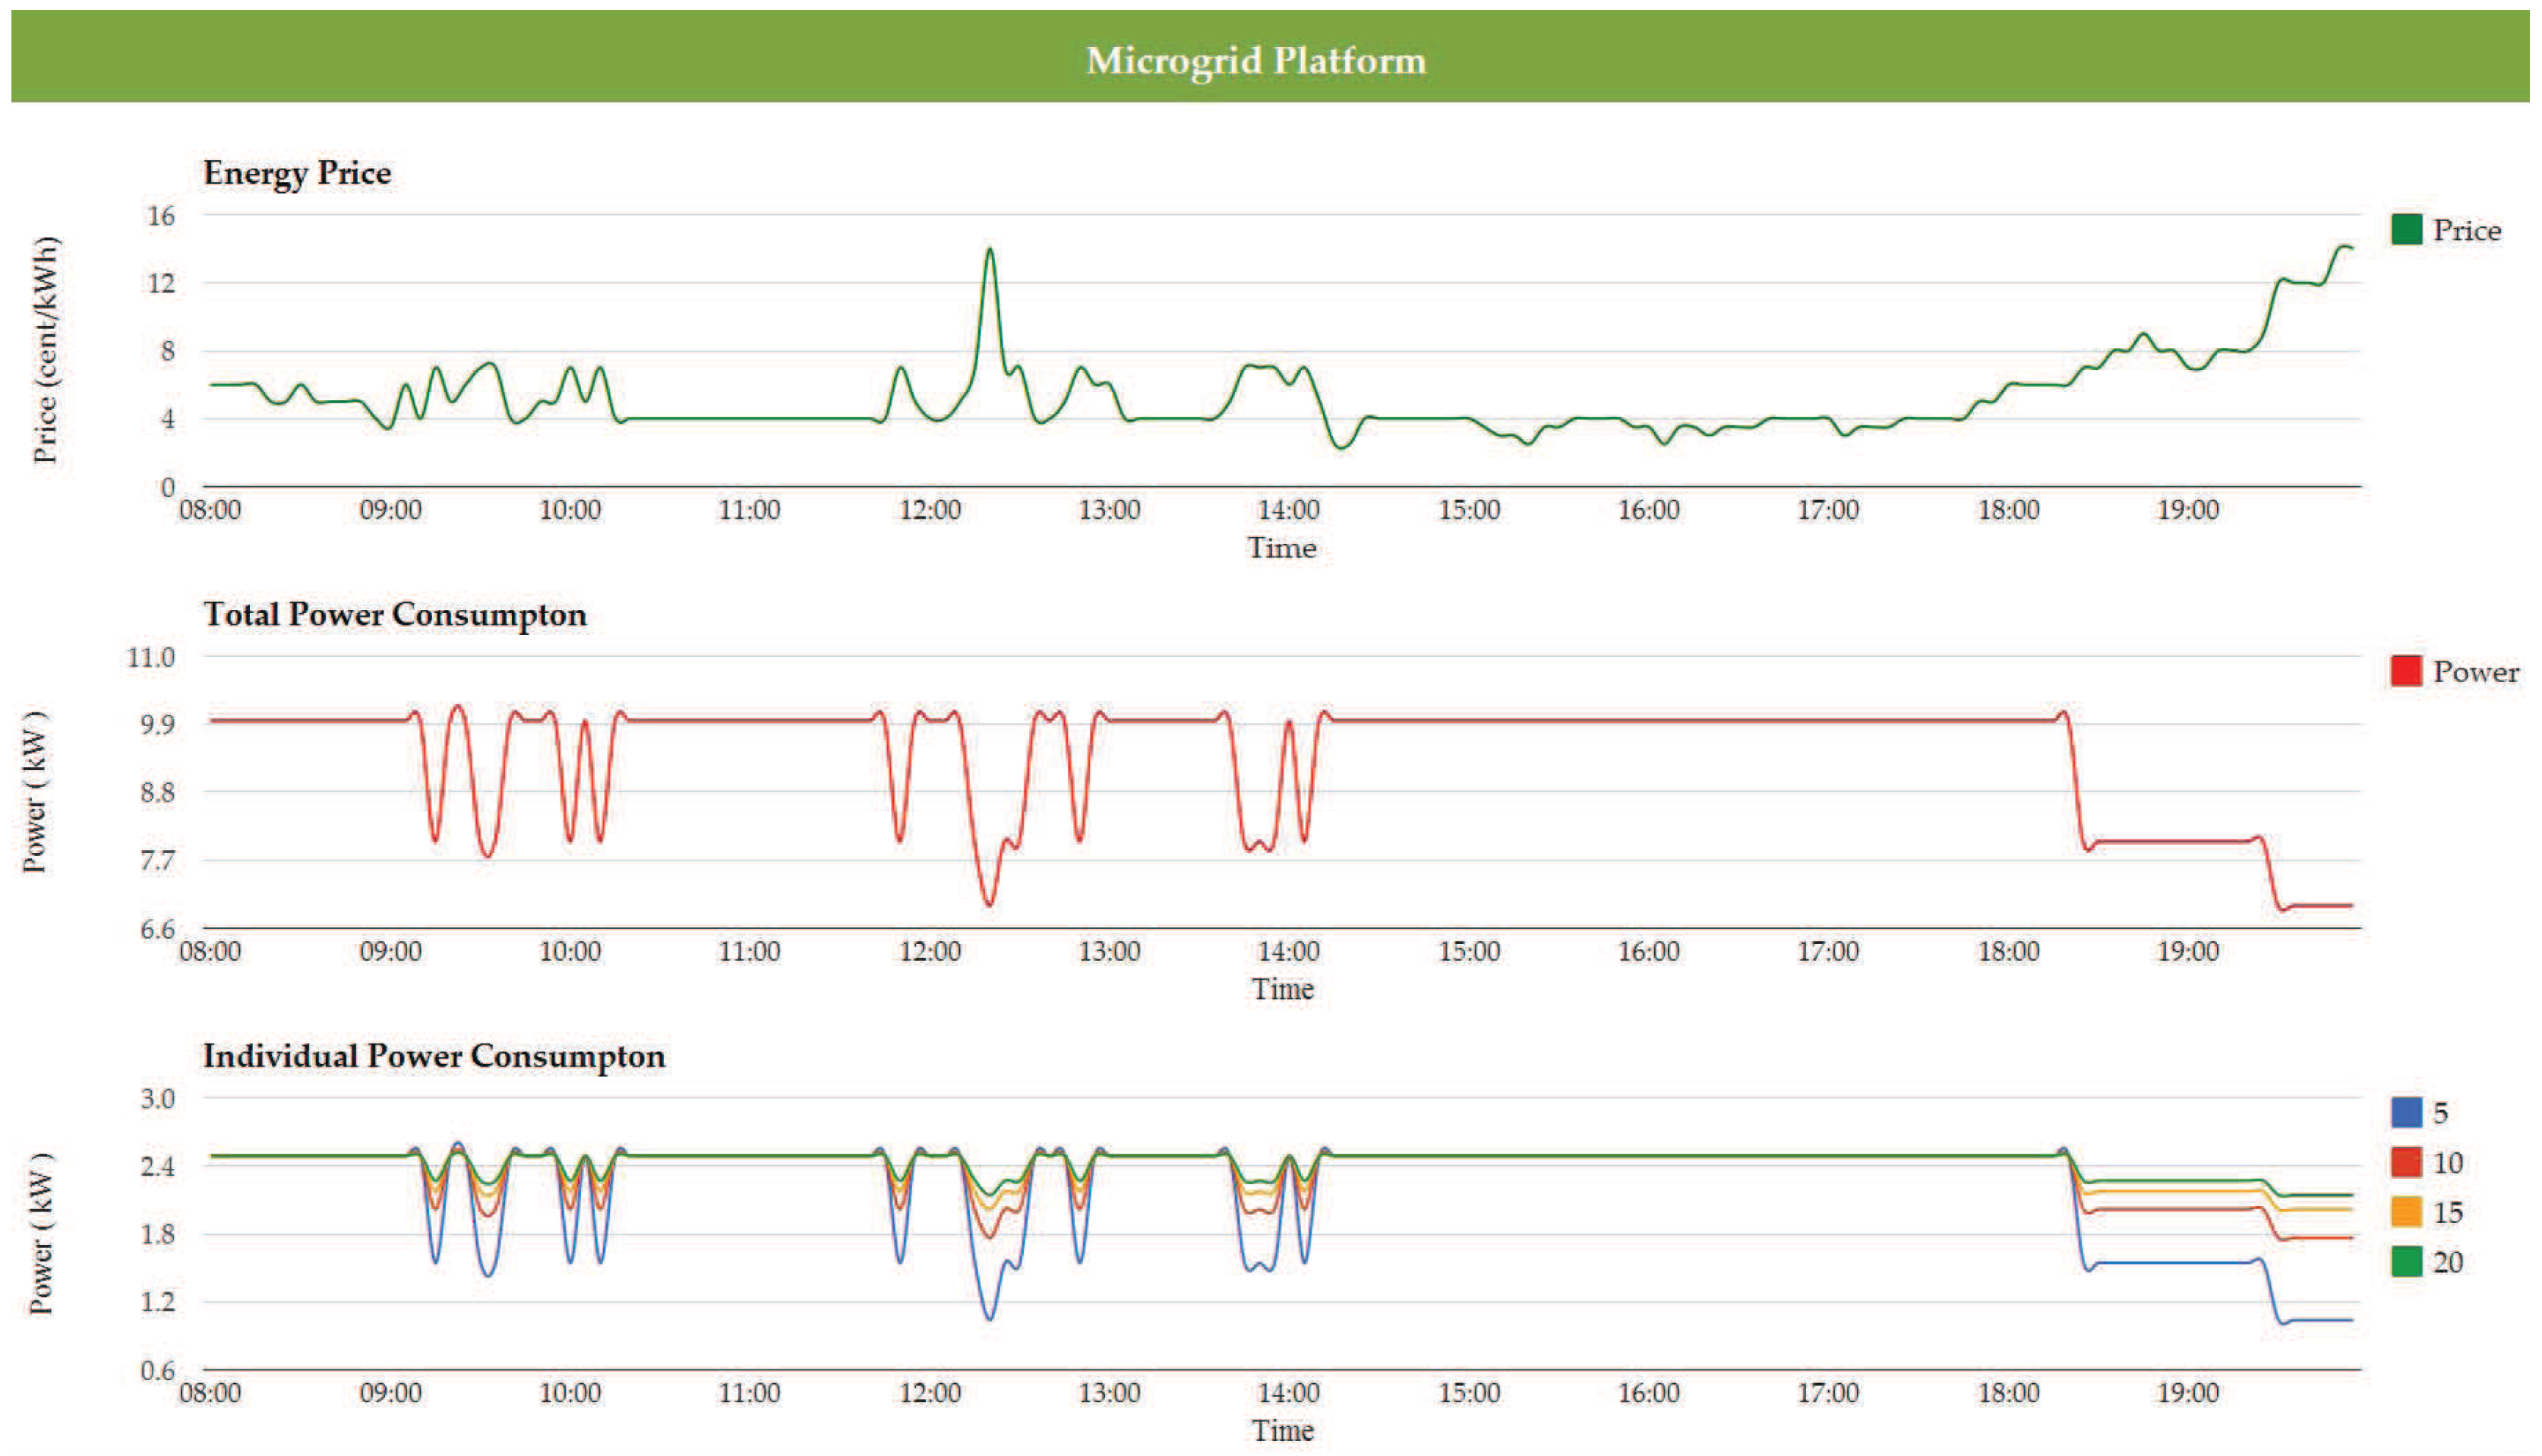
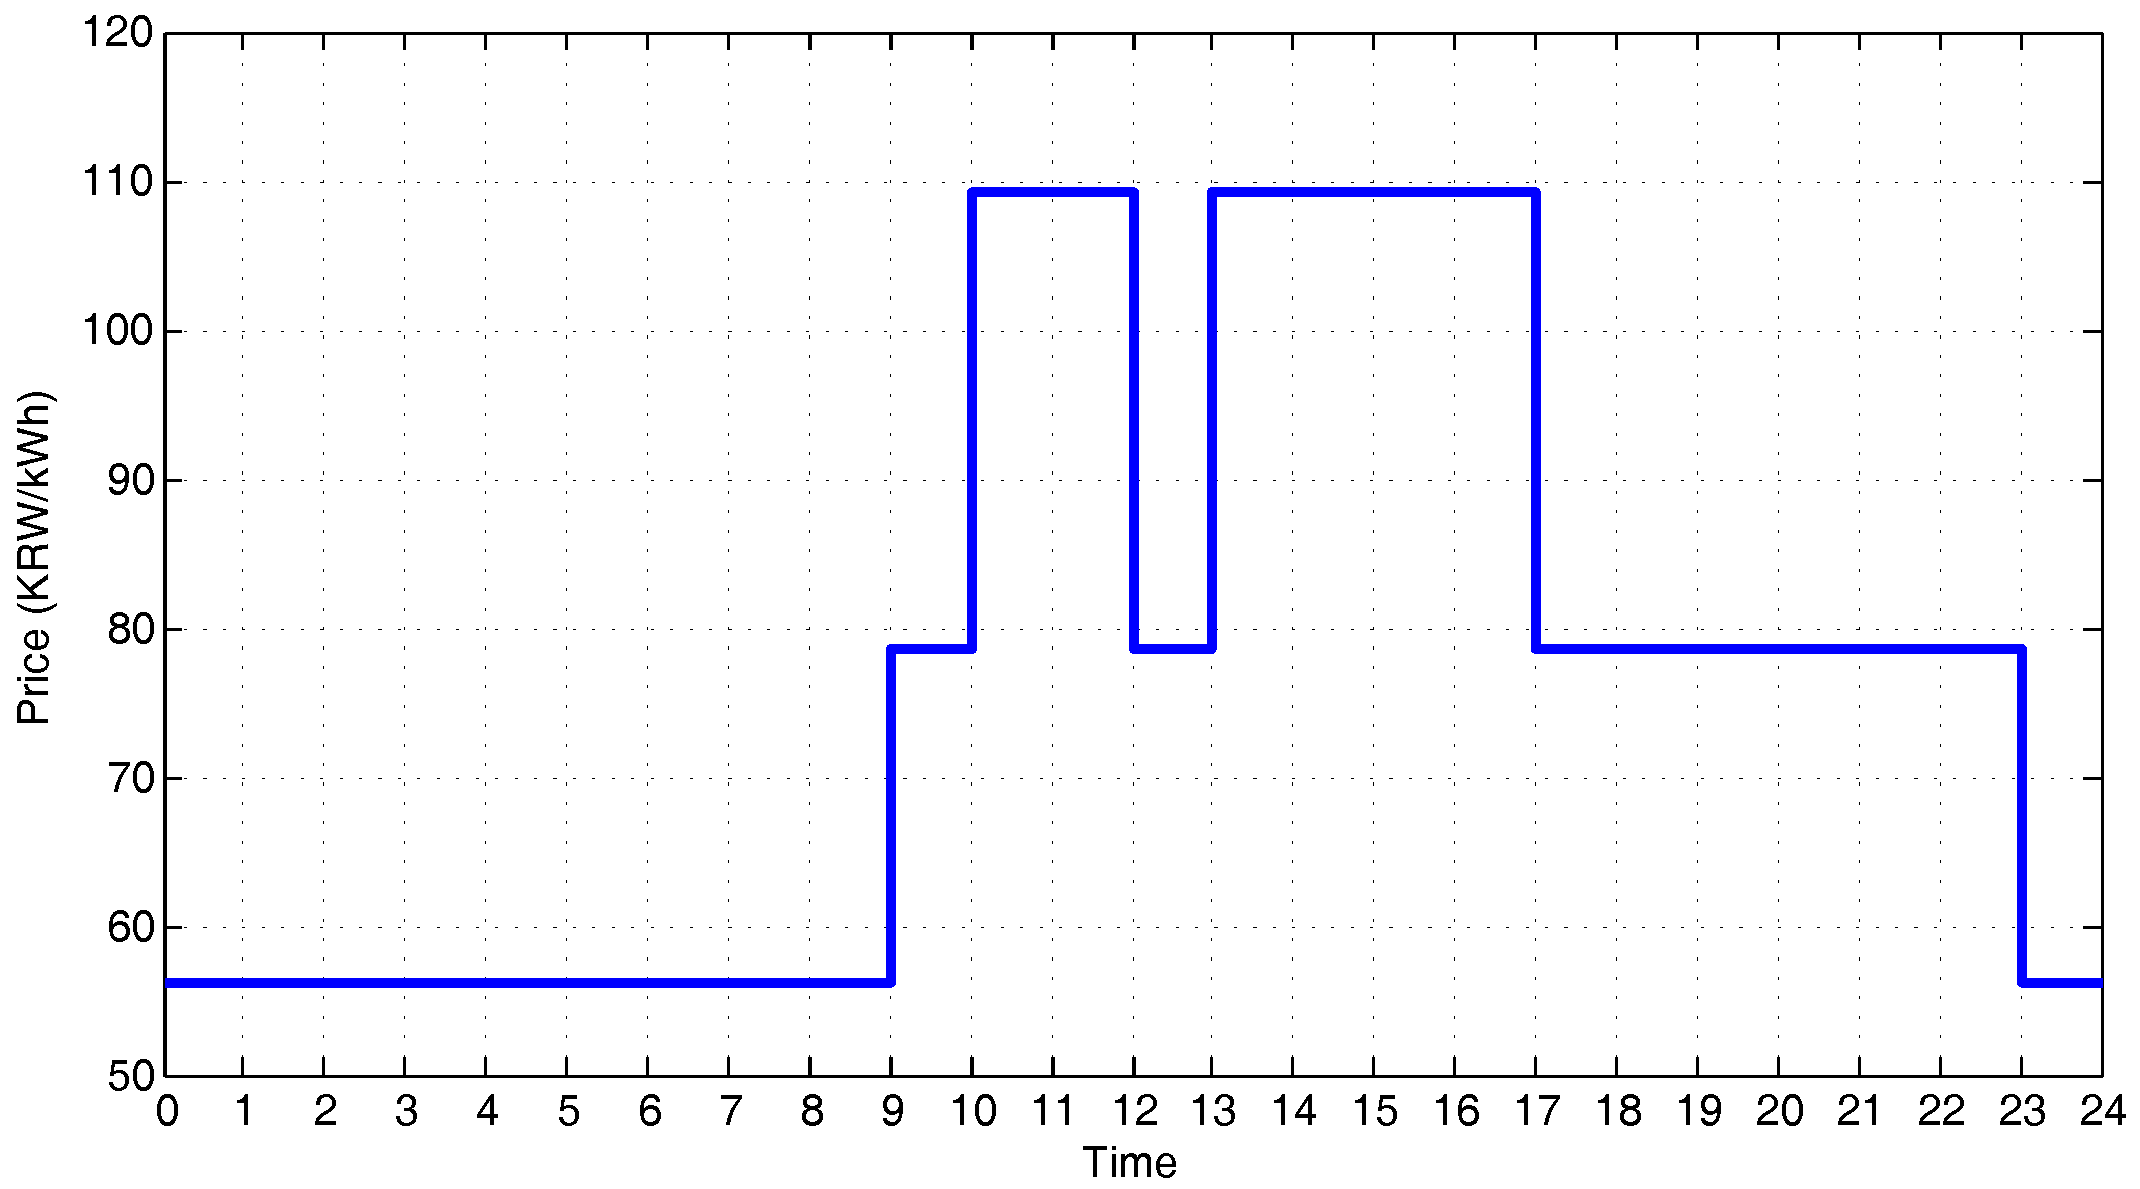
4.3. Demand Response Algorithm
5. Conclusions
Acknowledgments
Author Contributions
Conflicts of Interest
Abbreviations
| ADR | Automated Demand Response |
| DER | Distributed Energy Resource |
| DG | Distributed Generation |
| DR | Demand Response |
| DS | Distributed Storage |
| EV | Electric Vehicle |
| EMS | Energy Management System |
| ESI | Energy Service Interface |
| ESS | Energy Storage System |
| HMI | Human–Machine Interface |
| HVAC | Heating, Ventilation, and Air Conditioning |
| MP | Microgrid Platform |
| PV | Photovoltaics |
| ROA | Resource-Oriented Architecture |
| RTP | Real-Time Pricing |
| SOA | Service-Oriented Architecture |
| V2G | Vehicle-to-Grid |
| WT | Wind Turbine |
References
- Katiraei, F.; Iravani, R.; Hatziargyriou, N.; Dimeas, A. Microgrids management. IEEE Power Energy Mag. 2008, 6, 54–65. [Google Scholar] [CrossRef]
- Su, W.; Wang, J. Energy Management Systems in Microgrid Operations. Electr. J. 2012, 25, 45–60. [Google Scholar] [CrossRef]
- Vaccaro, A.; Popov, M.; Villacci, D.; Terzija, V.V. An Integrated Framework for Smart Microgrids Modeling, Monitoring, Control, Communication, and Verification. Proc. IEEE 2011, 99, 119–132. [Google Scholar] [CrossRef]
- Chen, Q.; Ghenniwa, H.; Shen, W. Web-services infrastructure for information integration in power systems. In Proceedings of the IEEE Power Engineering Society General Meeting, Montreal, QC, Canada, 18–22 June 2006.
- Yang, G.H.; Li, V.O. Energy management system and pervasive service-oriented networks. In Proceedigns of the First IEEE International Conference on Smart Gird Communications, Gaithersburg, MD, USA, 4–6 October 2010.
- Mercurio, A.; Di Giorgio, A.; Cioci, P. Open-Source Implementation of Monitoring and Controlling Services for EMS/SCADA Systems by Means of Web Services. IEEE Trans. Power Deliv. 2009, 24, 1148–1153. [Google Scholar] [CrossRef]
- Fang, X.; Misra, S.; Xue, G.; Yang, D. Smart Grid—The New and Improved Power Grid: A Survey. IEEE Commun. Surv. Tutor. 2012, 14, 944–980. [Google Scholar] [CrossRef]
- Shi, W.; Li, N.; Xie, X.; Chu, C.C.; Gadh, R. Optimal Residential Demand Response in Distribution Networks. IEEE J. Sel. Areas Commun. 2014, 32, 1441–1450. [Google Scholar] [CrossRef]
- Fielding, R.; Taylor, R. Principled Design of the Modern Web Architecture. ACM Trans. Internet Technol. 2002, 2, 115–150. [Google Scholar] [CrossRef]
- Lee, E.K.; Gadh, R.; Gerla, M. Energy Service Interface: Accessing to Customer Energy Resources for Smart Grid Interoperation. IEEE J. Sel. Areas Commun. 2013, 31, 1195–1204. [Google Scholar] [CrossRef]
- Huang, R.; Huang, T.; Gadh, R.; Li, N. Solar Generation Prediction using the ARMA Model in a Laboratory-level Micro-grid. In Proceedigns of the Third IEEE International Conference on Smart Gird Communications, Tainan City, Taiwan, 5–8 November 2012.
- Majidpour, M.; Qiu, C.; Chu, P.; Gadh, R.; Pota, H.R. Fast Demand Forecast of Electric Vehicle Charging Stations for Cell Phone Application. In Proceedings of the IEEE Power & Energy Society General Meeting, Natiional Harbor, MD, USA, 27–31 July 2014.
- Zhu, T.; Mishra, A.K.; Irwin, D.; Sharma, N.; Shenoy, P.; Towsley, D. The Case for Efficient Renewable Energy Management in Smart Homes. In Proceedigns of the 3rd ACM Workshop On Embedded Sensing Systems for Energy-Efficiency in Buildings, Seattle, WA, USA, 1 November 2011.
- Mal, S.; Chattopadhyay, A.; Yang, A.; Gadh, R. Electric vehicle smart charging and vehicle-to-grid operation. Int. J. Parallel Emerg. Distrib. Syst. 2012, 27, 249–265. [Google Scholar] [CrossRef]
- Bellala, G.; Marwah, M.; Arlitt, M.; Lyon, G.; Bash, C. Towards an understanding of campus-scale power consumption. In Proceedigns of the 3rd ACM Workshop On Embedded Sensing Systems for Energy-Efficiency in Buildings, Seattle, WA, USA, 1 November 2011.
- Mills, E.; Mathew, P. Monitoring-Based Commissioning: Benchmarking Analysis of 24 UC/CSU/IOU Projects; Technical Report LBNL-1972E; Lawrence Berkeley National Laboratory: Berkeley, CA, USA, 2009.
- Zhang, P.; Li, F.; Bhatt, N. Next-Generation Monitoring, Analysis, and Control for the Future Smart Control Center. IEEE Trans. Smart Grid 2010, 1, 186–192. [Google Scholar] [CrossRef]
- Krioukov, A.; Fierro, G.; Kitaev, N.; Culler, D. Building Application Stack (BAS). In Proceedigns of the 3rd ACM Workshop On Embedded Sensing Systems for Energy-Efficiency in Buildings, Toronto, ON, Canada, 6 November 2012.
- Agarwal, Y.; Gupta, R.; Komaki, D.; Weng, T. BuildingDepot: An Extensible and Distributed Architecture for Building Data Storage, Access and Sharing. In Proceedigns of the 3rd ACM Workshop On Embedded Sensing Systems for Energy-Efficiency in Buildings, Toronto, ON, Canada, 6 November 2012.
- Botts, M.; Robin, A. OpenGIS Sensor Model Language (SensorML) Implementation Specification v1.0.0; Open Geospatial Consortium Inc.: Wayland, MA, USA, 2007. [Google Scholar]
- Dawson-Haggerty, S.; Jiang, X.; Tolle, G.; Ortiz, J.; Culler, D. sMAP-a Simple Measurement and Actuation Profile for Physical Information. In Proceedigns of the 8th ACM Conference on Embedded Networked Sensor Systems, Zurich, Switzerland, 3–5 November 2010.
- EIS (Energy Information Standards) Alliance. Customer Domain Use Cases v3.01. Available online: https://www.linkedin.com/company/energy-information-standards-alliance (accessed on 6 October 2016).
- Hardin, D. Customer Energy Services Interface White Paper. In Proceedigns of the Sixth Annual Grid-Interop Forum, Phoenix, AZ, USA, 5–8 December 2011.
- Advancing open standards for the information society (OASIS). Open Building Information Exchange v1.0. Available online: http://www.oasis-open.org/committees/obix (accessed on 6 October 2016).
- Lee, E.K.; Gadh, R.; Gerla, M. Resource Centric Security to Protect Customer Energy Information in the Smart Grid. In Proceedigns of the Third IEEE International Conference on Smart Gird Communications, Tainan City, Taiwan, 5–8 November 2012.
- International Electrotechnical Commission (IEC). IEC 61850 Communication Networks and Systems in Substations. Available online: http://www.abb.com/cawp/seitp202/5a2f05a756741714c1256e5c00429c4e.aspx (accessed on 6 October 2016).
- Piette, M.A.; Ghatikar, G.; Kiliccote, S.; Koch, E.; Hennage, D.; Palensky, P.; McParland, C. Open Automated Demand Response Communications Specification v1.0. Available online: https://drrc.lbl.gov/publications/open-automated-demand-response-2 (accessed on 6 October 2016).
- McParland, C. OpenADR Open Source Toolkit: Developing Open Source Software for the Smart Grid, LBNL-5064E; Technical Report; Lawrence Berkeley National Laboratory: Berkeley, CA, USA, 2011.
- Introduction to NISTIR 7628 Guidelines for Smart Grid Cyber Security. Smart Grid Interoperability Panel—Cyber Security Working Group. Available online: http://dx.doi.org/10.6028/NIST.IR.7628r1 (accessed on 6 October 2016).
- Bracco, S.; Brignone, M.; Delfino, F.; Procopio, R. An Energy Management System for the Savona Campus Smart Polygeneration Microgrid. IEEE Syst. J. 2015. [Google Scholar] [CrossRef]
- Bonfiglio, A.; Brignone, M.; Delfino, F.; Girdinio, P.; Pampararo, F.; Procopio, R. An Energy Management System for the Savona Campus Smart Polygeneration Microgrid. In Proceedigns of the IEEE 15th International Conference on Environment and Electrical Engineering (EEEIC), Rome, Italy, 10–13 June 2015.
- Shi, W.; Xie, X.; Chu, C.C.; Gadh, R. Distributed Optimal Energy Management in Microgrids. IEEE Trans. Smart Grid 2015, 6, 1137–1146. [Google Scholar] [CrossRef]
- Lopes, J.A.P.; Moreira, C.L.; Madureira, A.G. Defining control strategies for MicroGrids islanded operation. IEEE Trans. Power Syst. 2006, 21, 916–924. [Google Scholar] [CrossRef]
- Boyd, S.; Vandenberghe, L. Convex Optimization; Cambridge University Press: Cambridge, UK, 2004. [Google Scholar]
- Cecati, C.; Citro, C.; Siano, P. Combined Operations of Renewable Energy Systems and Responsive Demand in a Smart Grid. IEEE Trans. Sustain. Energy 2011, 2, 468–476. [Google Scholar] [CrossRef]
- Agarwal, Y.; Weng, T.; Gupta, R.K. The Energy Dashboard: Improving the Visibility of Energy Consumption at a Campus-Wide Scale. In Proceedigns of the First ACM Workshop on Embedded Sensing Systems for Energy Efficiency in Buildings (BuildSys), Berkeley, CA, USA, 3 November 2009.
- ZigBee Alliance. Smart Energy Profile 2—Application Protocol Standard. Available online: http://www.zigbee.org/ (accessed on 6 October 2016).
- Chung, C.Y.; Chu, P.; Gadh, R. Design of Smart Charging Infrastructure Hardware And Firmware Design of The Various Current Multiplexing Charging System. In Proceedigns of the 3rd Global Conference on Power Control & Optimization, Gold Coast, Australia, 2–4 February 2013.
- Huang, R.; Lee, E.K.; Chu, C.C.; Gadh, R. Integration of IEC 61850 into a Distributed Energy Resources System in a Smart Green Building. In Proceedings of the IEEE Power & Energy Society General Meeting, Natiional Harbor, MD, USA, 27–31 July 2014.
- Shi, W.; Lee, E.K.; Yao, D.; Huang, R.; Chu, C.C.; Gadh, R. Evaluating Microgrid Management and Control with an Implementable Energy Management System. In Proceedigns of the 5th IEEE International Conference on Smart Grid Communications (SmartGridComm), Venice, Italy, 3–6 November 2014.


| Parameters | Description | Set Value |
|---|---|---|
| B | Capacity of BMS | 25 kWh |
| Initial state of charge in BMS | 25 kWh | |
| γ | Charging/discharging rate | 80% |
| Maximum state of charge in BMS | 22.5 kWh | |
| b_ | Minimum state of charge in BMS | 2.5 kWh |
| Device | Capacity | Power Max/Min | Energy Max/Min |
|---|---|---|---|
| PV simulator | 64 kW | - | - |
| ESS simulator | 64 kW | 10 kW/−10 kW | 50 kWh/5 kWh |
| Quick EV simulator | 64 kW | 64 kW/0 kW | [18 kWh, 23 kWh]/[13 kWh, 18 kWh] |
| Slow EV1 system | 2.5 kW | 2.5 kW/0 kW | [18 kWh, 23 kWh]/[13 kWh, 18 kWh] |
| Slow EV2 system | 2.5 kW | 2.5 kW/0 kW | [18 kWh, 23 kWh]/[13 kWh, 18 kWh] |
| 200 LEDs | 12.6 kW | 12.6 kW/0 kW | - |
| PV: Photovoltaic | ESS: Energy storage system | EV: Electric vehicle | LED: Light-emitting diode |
© 2016 by the authors; licensee MDPI, Basel, Switzerland. This article is an open access article distributed under the terms and conditions of the Creative Commons Attribution (CC-BY) license (http://creativecommons.org/licenses/by/4.0/).
Share and Cite
Lee, E.-K.; Shi, W.; Gadh, R.; Kim, W. Design and Implementation of a Microgrid Energy Management System. Sustainability 2016, 8, 1143. https://doi.org/10.3390/su8111143
Lee E-K, Shi W, Gadh R, Kim W. Design and Implementation of a Microgrid Energy Management System. Sustainability. 2016; 8(11):1143. https://doi.org/10.3390/su8111143
Chicago/Turabian StyleLee, Eun-Kyu, Wenbo Shi, Rajit Gadh, and Wooseong Kim. 2016. "Design and Implementation of a Microgrid Energy Management System" Sustainability 8, no. 11: 1143. https://doi.org/10.3390/su8111143
APA StyleLee, E.-K., Shi, W., Gadh, R., & Kim, W. (2016). Design and Implementation of a Microgrid Energy Management System. Sustainability, 8(11), 1143. https://doi.org/10.3390/su8111143