
Profitability of Management Systems on German Fenlands


Abstract
:1. Introduction
2. Materials and Methods
2.1. Land Use and Management Systems
2.2. Profitability Calculation Approach for Fenland Management Systems
2.2.1. Income, Costs and Net Return (Profit)
2.2.2. Economic Calculation Assumptions for Operations for Land Use
2.2.3. Economic Calculation Assumptions for Biomass Utilization
Milk Production
Beef Production
Calf Production
Biogas Production
Combustion
3. Results
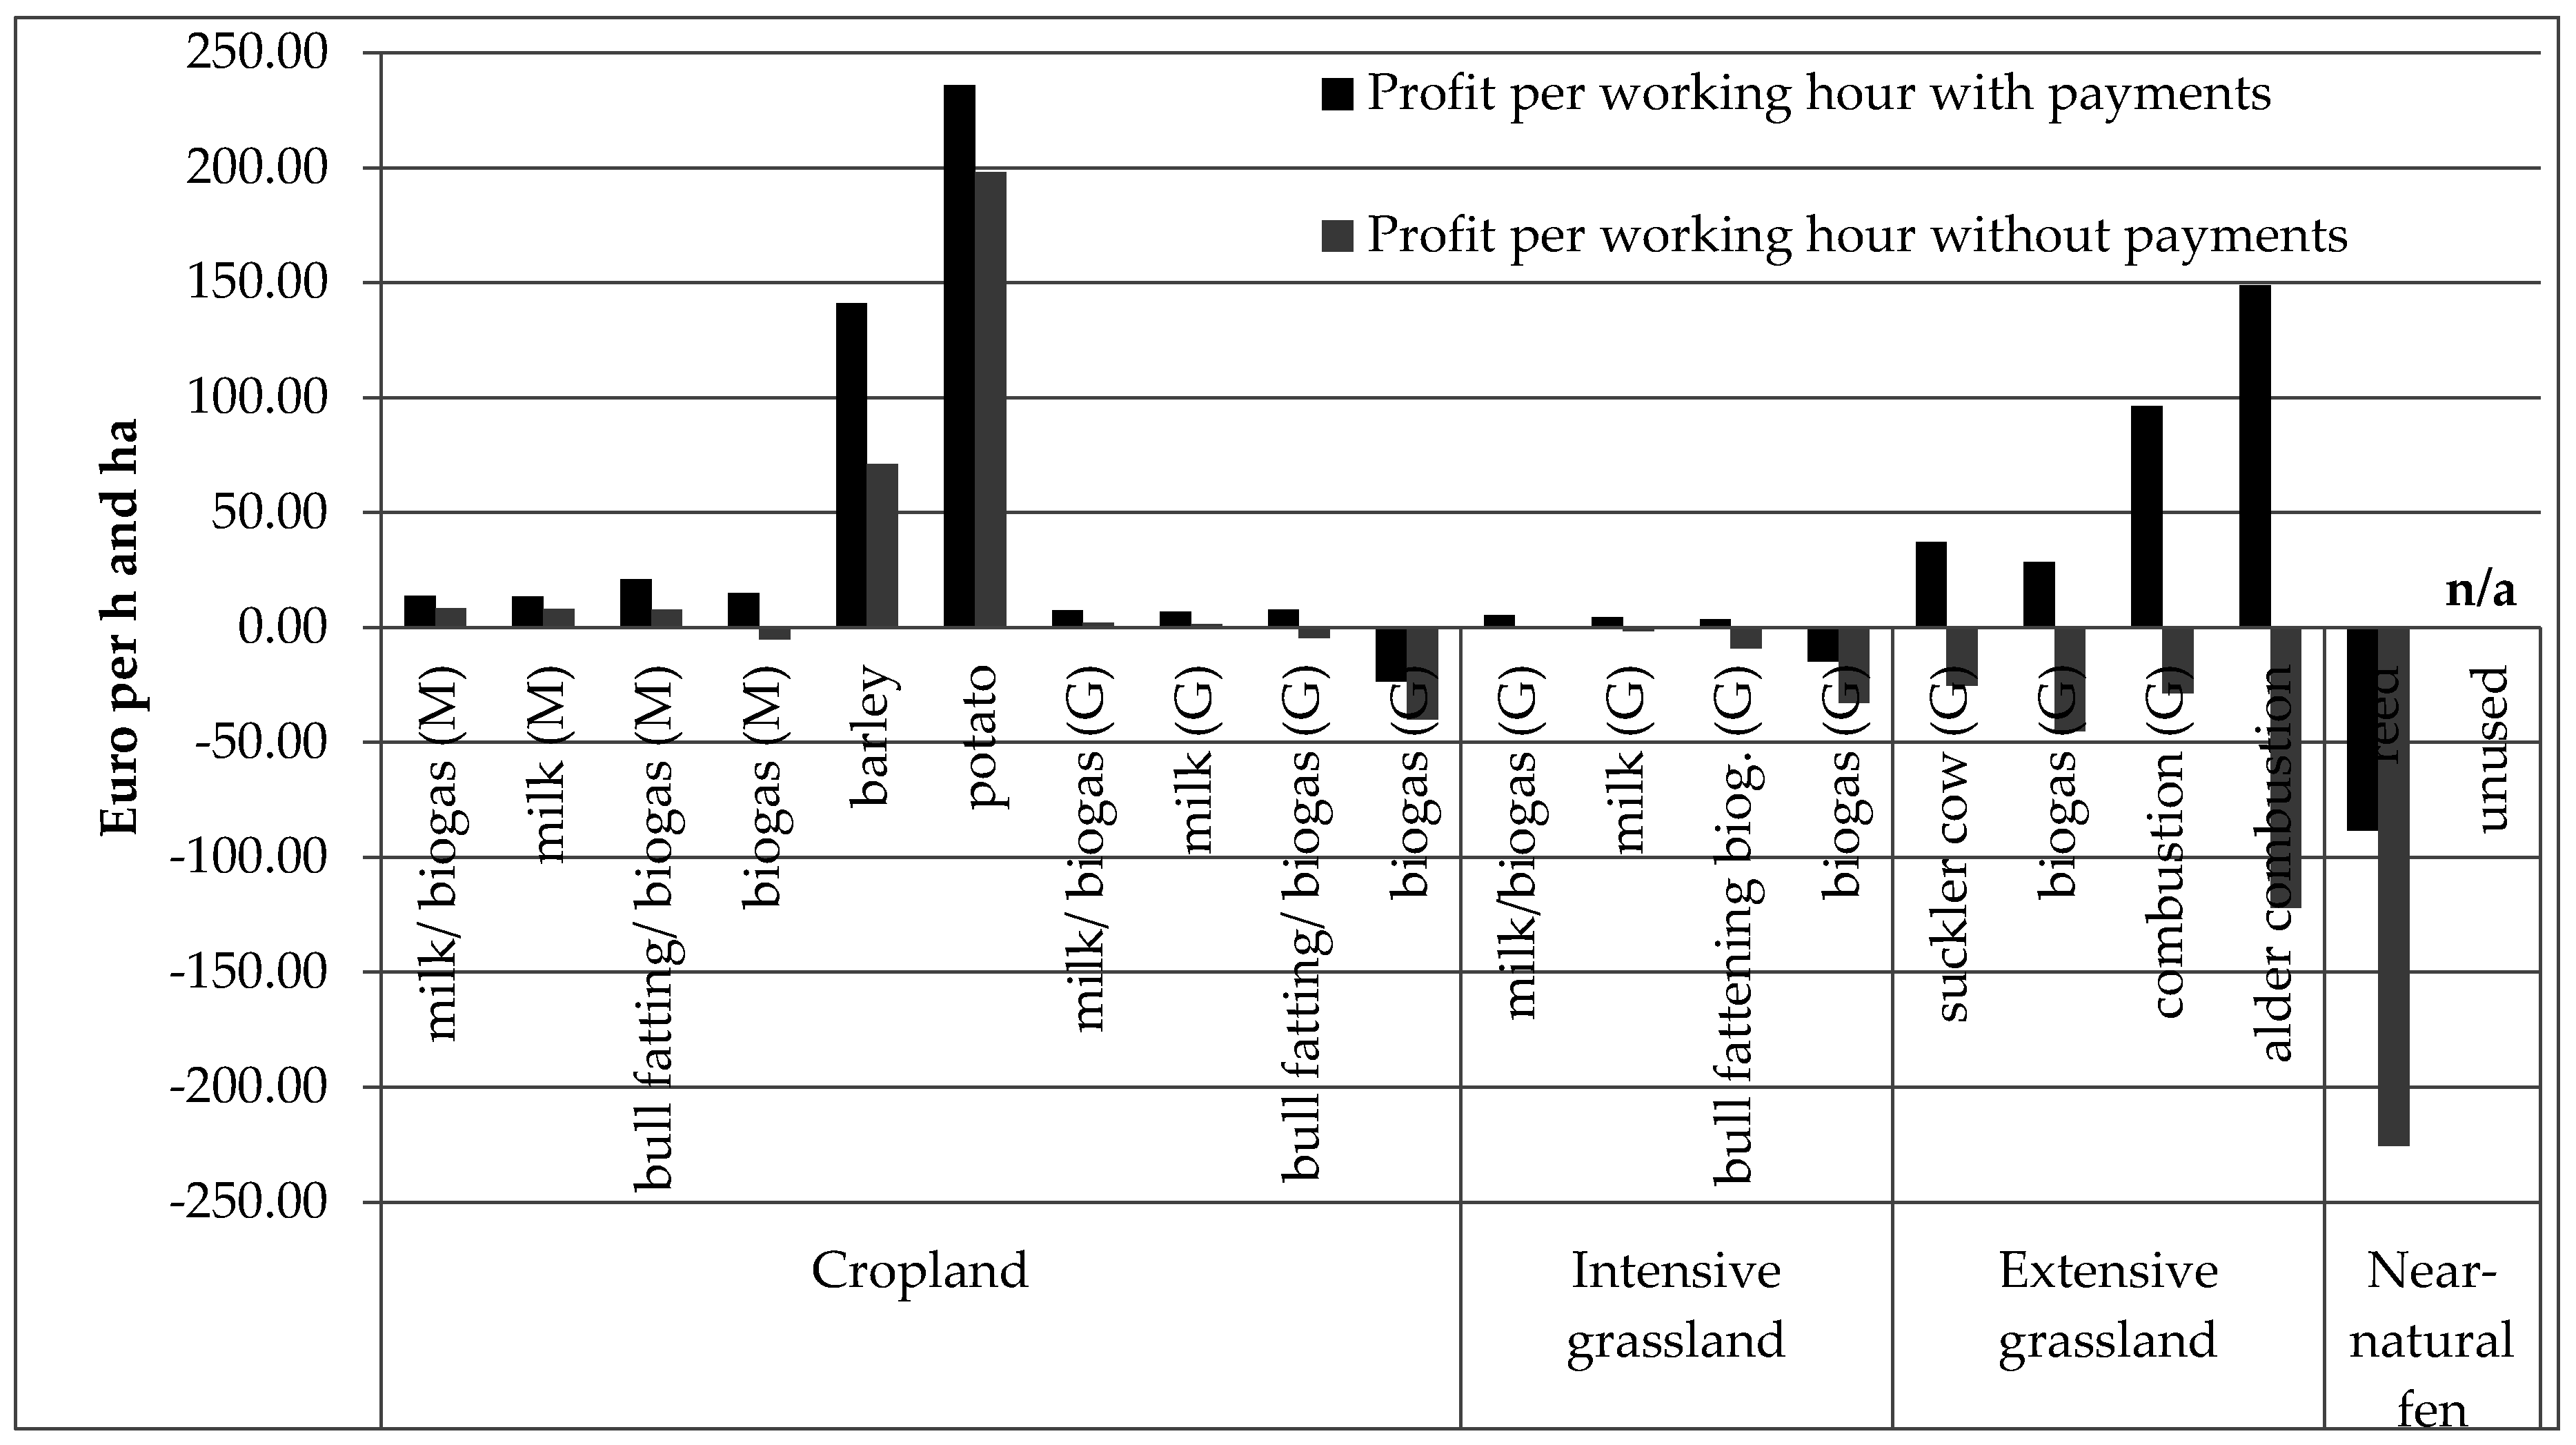
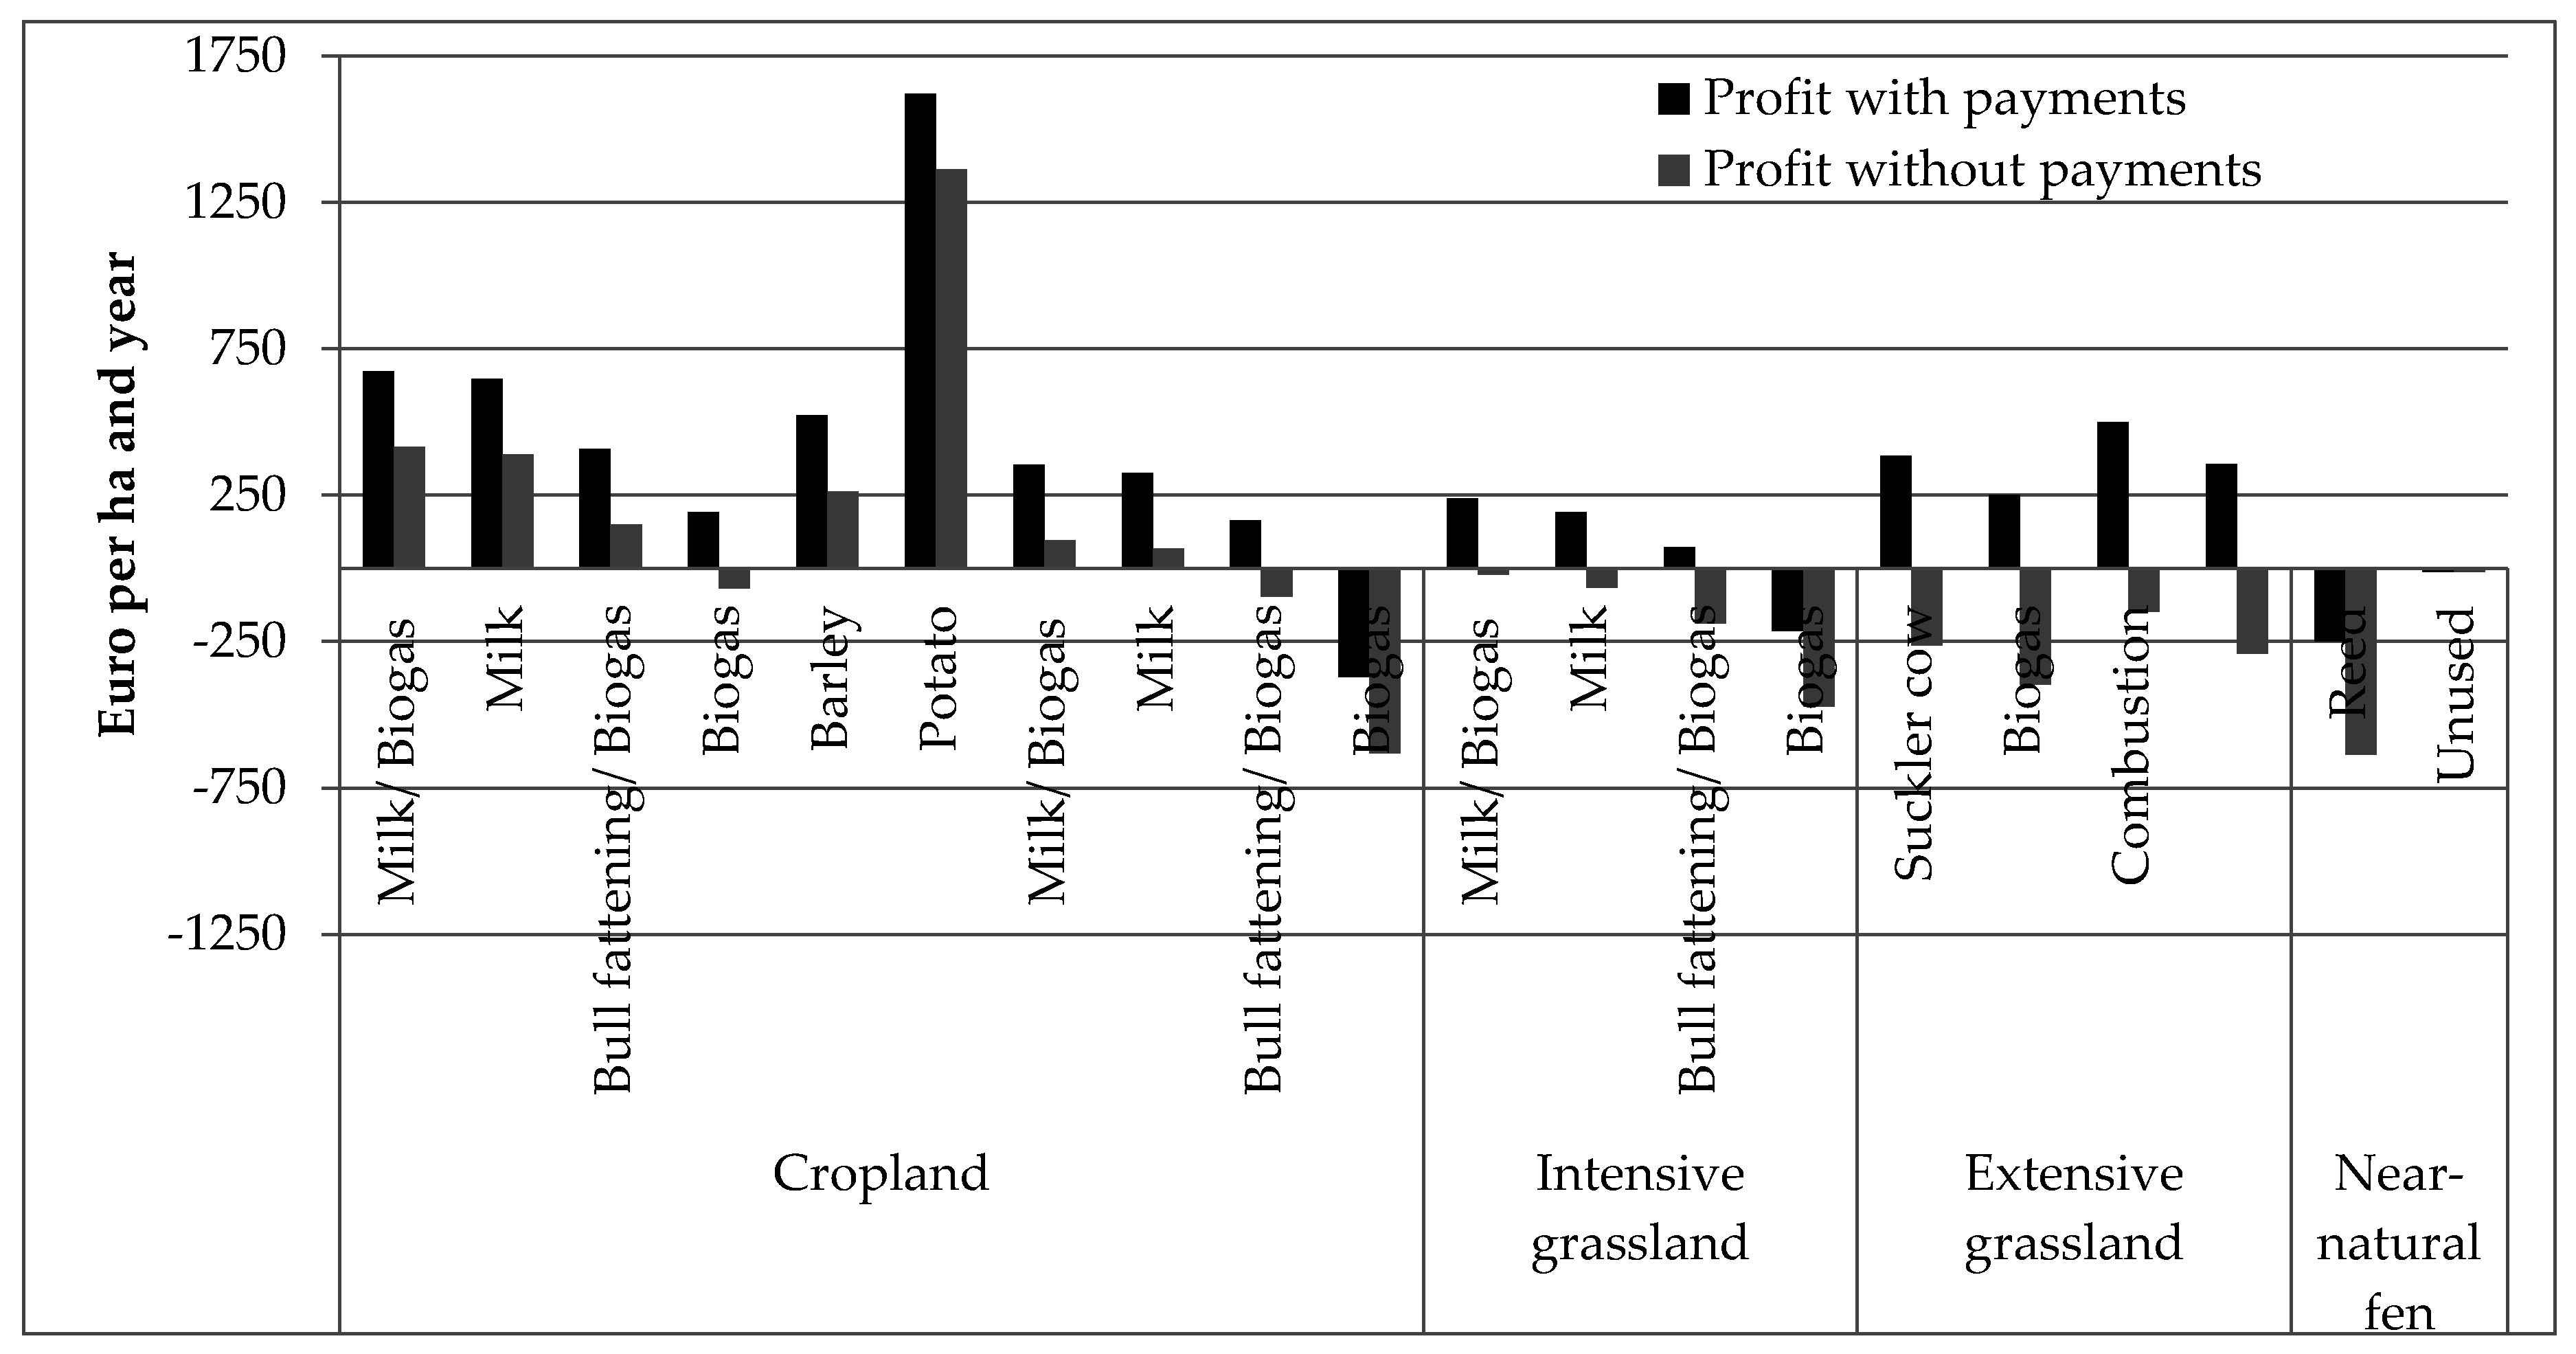
3.1. Costs, Income, and Profits of Management Systems on Fenlands
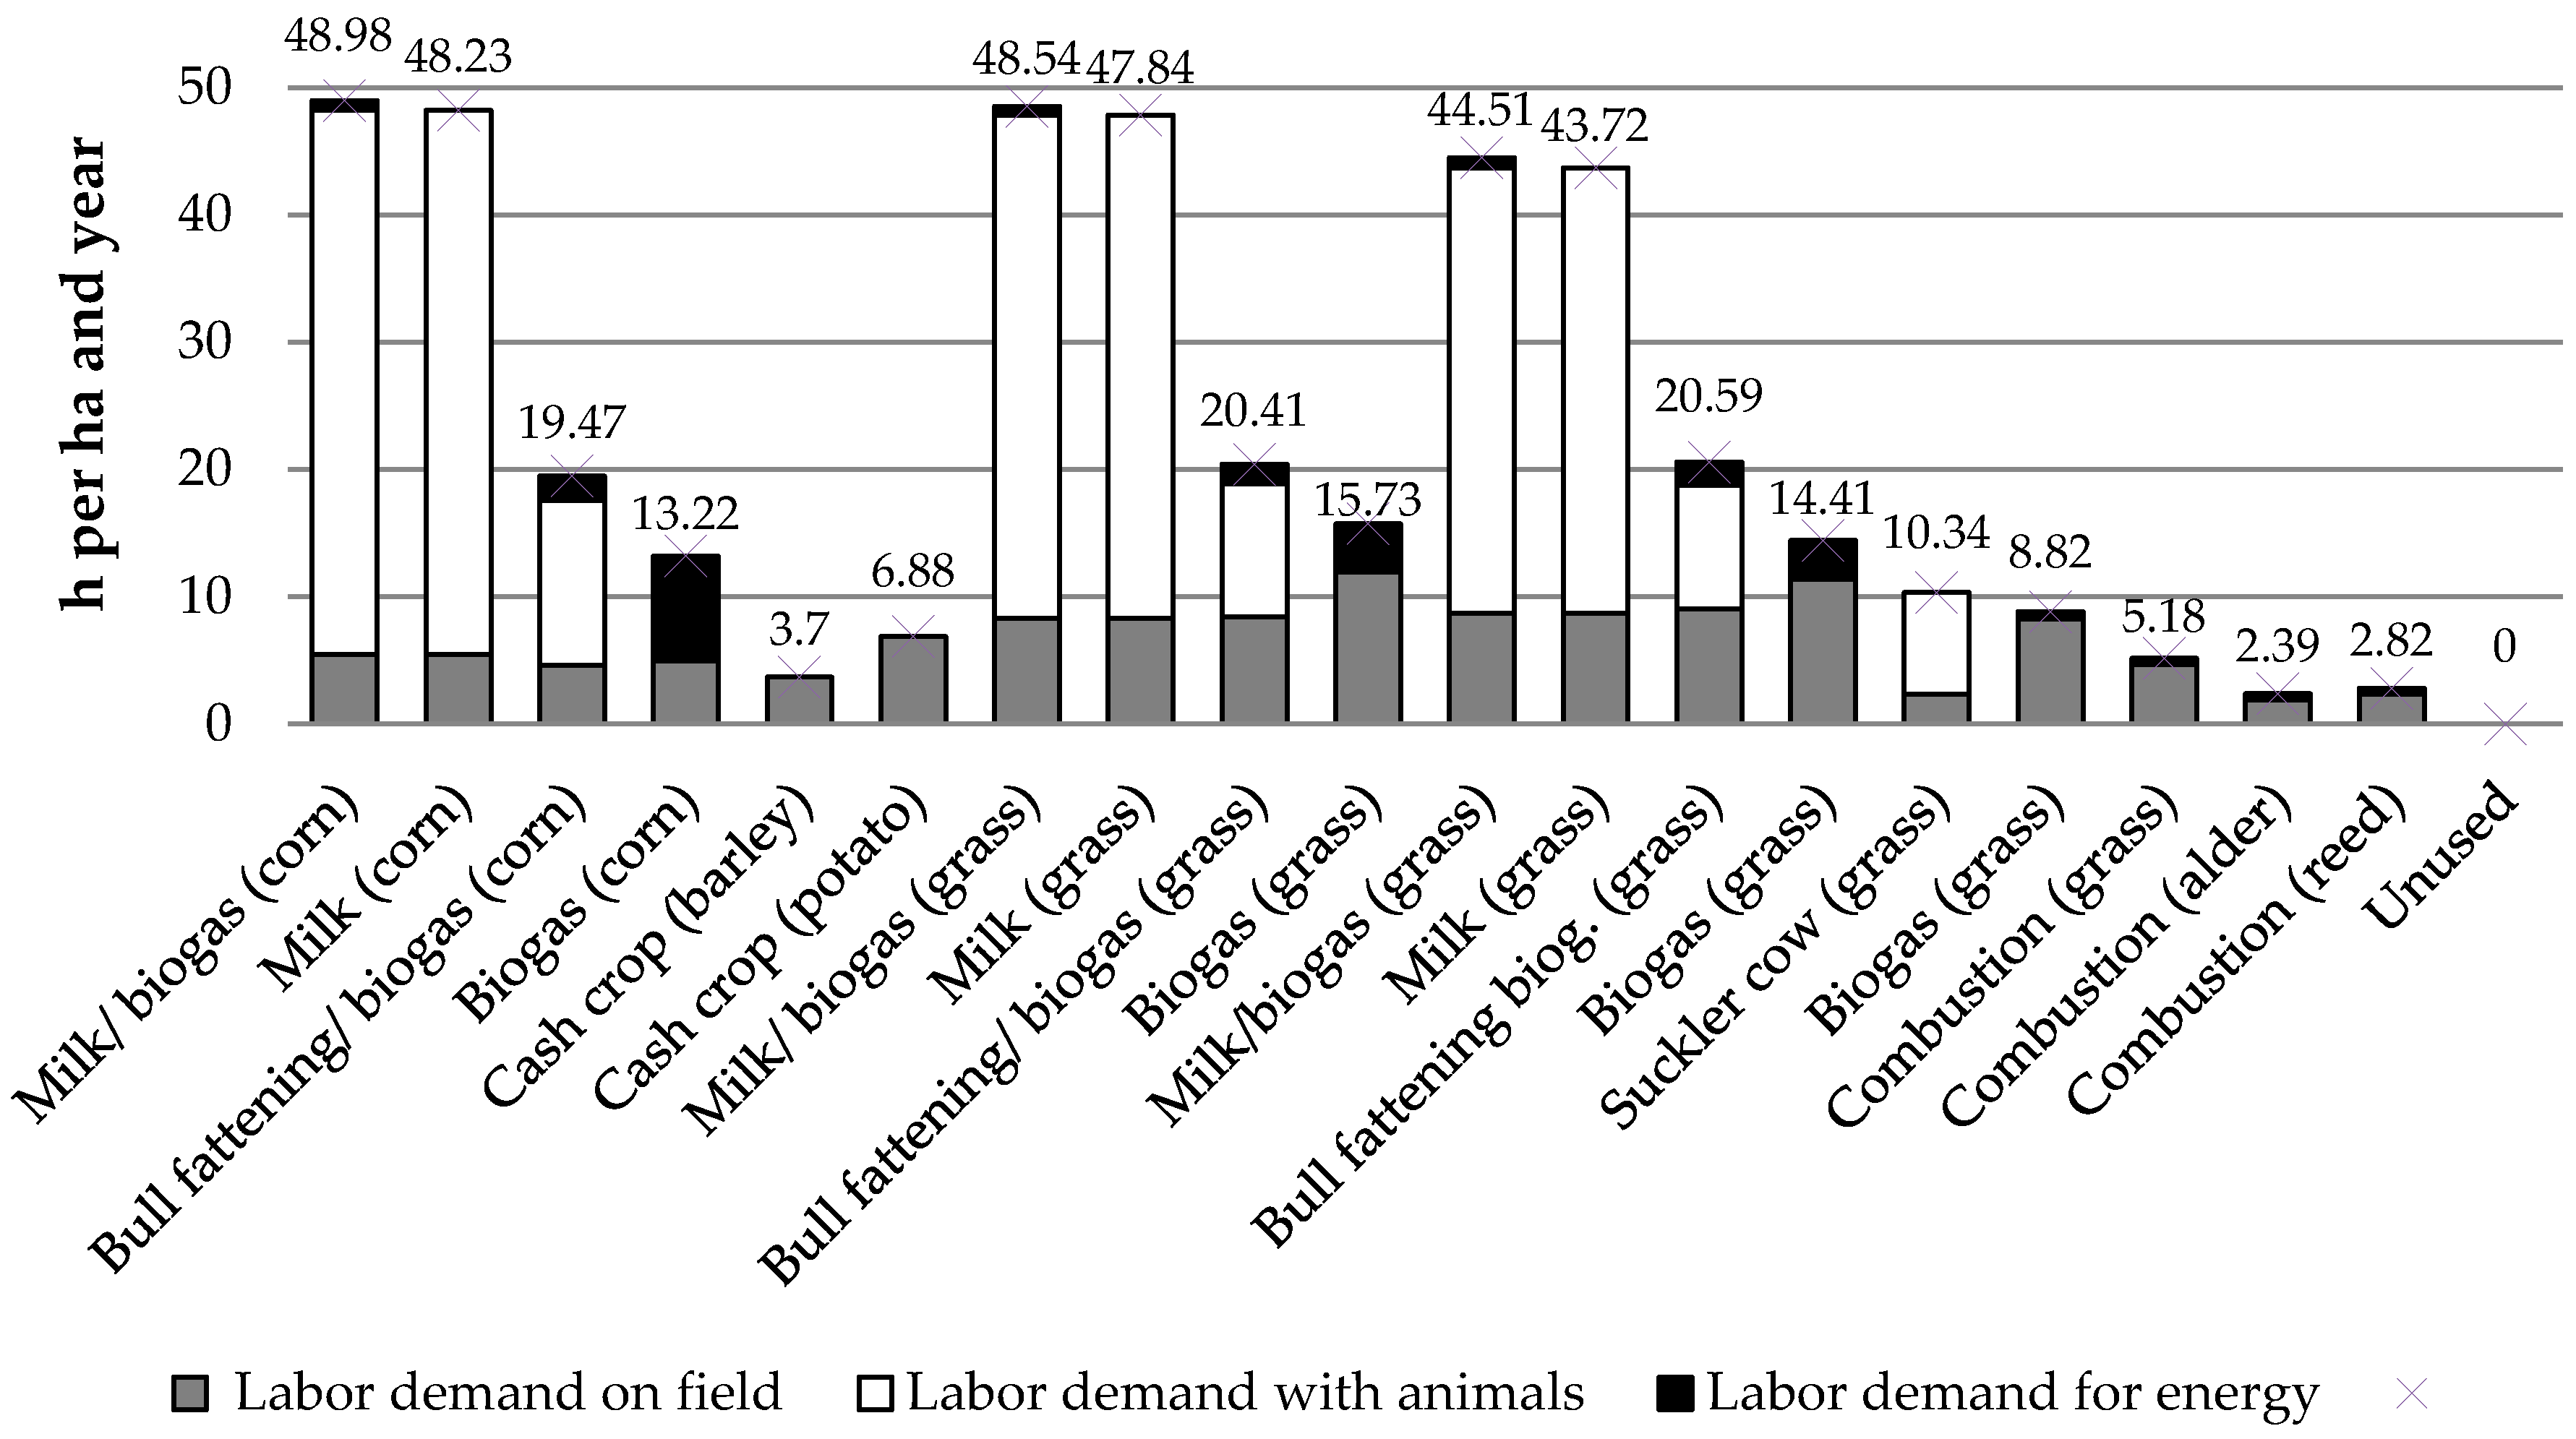
3.2. Labor Demand of Management Systems on Fens
4. Discussion
5. Conclusions
Acknowledgments
Author Contributions
Conflicts of Interest
References
- Josten, H. The Global Peatland CO2 Picture—Peatland Status and Drainage Related Emissions in All Countries of the World; Wetlands International: Ede, The Netherlands, 2009. [Google Scholar]
- Joosten, H.; Couwenberg, J. Peatlands and Carbon. In Assessment on Peatlands, Biodiversity and Climate Change—Main Report; Parish, F., Sirin, A., Charman, D., Joosten, H., Minayeva, T., Silvius, M., Stringer, L., Eds.; Global Environment Centre, Kuala Lumpur & Wetlands International, Wageningen: Wageningen, The Netherlands, 2008; pp. 99–117. [Google Scholar]
- Millennium Ecosystem Assessment. Ecosystems and Human Well-Being: Wetlands and Water Synthesis; World Resources Institute: Washington, DC, USA, 2005. [Google Scholar]
- Wheeler, B.D.; Shaw, S. Classification of British Wetlands, 2nd ed.; 1.3 Some Other Wetland Terms; National Rivers Authority: Bristol, UK, 1995; pp. 7–10. [Google Scholar]
- Bedford, B.L.; Godwin, K.S. Fens of the United States: Distribution, characteristics, and scientific connection versus legal isolation. Wetlands 2003, 23, 608–629. [Google Scholar] [CrossRef]
- Van den Pol-van Dasselaar, A.; van Beusichem, M.L.; Oenema, O. Methane emissions from wet grasslands on peat soil in a nature preserve. Biogeochemistry 1999, 44, 205–220. [Google Scholar] [CrossRef]
- Leiber-Sauheitl, K.; Fuß, R.; Voigt, C.; Freibauer, A. High CO2 fluxes from grassland on histic Gleysol along soil carbon and drainage gradients. Biogeosciences 2014, 11, 749–761. [Google Scholar] [CrossRef]
- Flessa, A.; Wild, U.; Kelmisch, M.; Pfadenhauer, J. Nitrouse oxid and methane fluxes from organic soils under agriculture. Eur. J. Soil Sci. 1998, 49, 327–335. [Google Scholar]
- Blain, D.; Boer, R.; Eggleston, S.; Gonzalez, S.; Hiraishi, T.; Irving, W.; Krug, T.; Krusche, A.; Mpeta, E.J.; Penman, J.; et al. 2013 Introduction. In 2013 Supplement to the 2006 IPCC Guidelines for National Greenhouse Gas Inventories: Wetlands; Hiraishi, T., Krug, T., Tanabe, K., Srivastava, N., Jamsranjav, B., Fukuda, M., Troxler, T., Eds.; Intergovernmental Panel on Climate Change: Geneva, Switzerland, 2014. [Google Scholar]
- Tubiello, F.; Biancalani, R.; Salvatore, M.; Rossi, S.; Conchedda, G. A worldwide assessment of greenhouse gas emissions from drained organic soils. Sustainability 2016, 8, 371. [Google Scholar] [CrossRef]
- Renger, M.; Wessolek, G.; Schwärzel, K.; Sauerbrey, R.; Siewert, C. Aspects of peat conservation and water management. J. Plant Nutr. Soil Sci. 2002, 165, 487–493. [Google Scholar] [CrossRef]
- Couwenberg, J. Emission Factors for Managed Peat Soils (Organic Soils, Histosols). An Analysis of IPCC Default Values; Wettlands International: Ede, The Netherlands, 2009. [Google Scholar]
- Eickenscheidt, T.; Heinichen, J.; Drösler, M. The greenhouse gas balance of a drained fen peatland is mainly controlled by land-use rather than soil organic carbon content. Biogeosci. Discuss. 2015, 12, 5201–5258. [Google Scholar] [CrossRef]
- Wichtmann, W.; Wichmann, S. Paludiculture—Site adapted management of re-wetted peatlands. TELMA 2011, 4, 215–234. [Google Scholar]
- Wichtmann, W.; Haberl, A. 1 Möglichkeit der standortgerechten Niedermoorbewirtschaftung (Paludikultur). In Aktivierung der Klimaschutzfunktion von Niedermoorflächen in der Landeshauptstadt Potsdam —Handlungsleitfaden “Paludikultur”; Stadtverwaltung Potsdam—Koordinierungsstelle Klimaschutz: Potsdam, Germany, 2012; pp. 6–20. (In German) [Google Scholar]
- Kowatsch, A.; Schäfer, A.; Wichtmann, W. Nutzungsmöglichkeiten auf Niedermoorstandorten—Umweltwirkungen, Klimarelevanz und Wirtschaftlichkeit Sowie Anwendbarkeit und Potenziale in Mecklenburg-Vorpommern; Ernst-Moritz-Arndt-Universität Greifswald: Greifswald, Germany, 2008. (In German) [Google Scholar]
- Hanff, H.; Neubert, G.; Brudel, H. Datensammlung für die Betriebsplanung und die Betriebswirtschaftliche Bewertung Landwirtschaftlicher Produktionsverfahren im Land Brandenburg. Ackerbau/Grünlandwirtschaft/Tierproduktion, 6; Ministerium für Infrastruktur und Landwirtschaft des Landes Brandenburg (MIL): Potsdam, Germany, 2010. (In German) [Google Scholar]
- Cooper, M.; Lindegaard, K. Wetland Biomass to Bioenergy: Efficient Harvesting, Processing and Conversion of Wetland Biomass; Department of Energy & Climate Change: Sheffield, UK, 2013. [Google Scholar]
- Krimly, T.; Angenendt, E.; Bahrs, E.; Dabbert, S. Global warming potential and abatement costs of different peatland management options: A case study for the Pre-alpine Hill and Moorland in Germany. Agric. Syst. 2016, 145, 1–12. [Google Scholar] [CrossRef]
- Röder, N.; Grützmacher, F. Emissionen aus landwirtschaftlich genutzten Mooren—Vermeidungskosten und Anpassungsbedarf. Natur und Landsch. 2012, 87, 56–61. (In German) [Google Scholar]
- Deutscher Wetterdienst, Climate Data Center. Precipitation and Temperature data in Brandenburg (Average 1986–2015). Available online: http://www.dwd.de/DE/klimaumwelt/cdc/cdc_node.html (accessed on 14 July 2016).
- Ministry of Rural Development, Environment and Agriculture of the Federal State of Brandenburg (2015) Peatland Map of Brandenburg. Available online: http://www.mlul.brandenburg.de/cms/detail.php/bb1.c.331615.de (accessed on 14 July 2016).
- Establishment and Management of Broadleaved Coppice. Available online: http://www.biomassenergycentre.org.uk/pls/portal/docs/page/bec_technical/best%20practice/broadleavedcoppiceguiderevision131007%20gph.pdf (accessed on 31 July 2016).
- Brix, H.; Sorrell, B.K.; Lorenzen, B. Are Phragmites-dominated wetlands a net source or net sink of greenhouse gases? Aquat. Bot. 2001, 69, 313–324. [Google Scholar] [CrossRef]
- Tanneberger, F.; Gatkowski, D.; Krogulec, J. 10.5 Poland—Paludiculture for biodiversity and peatland protection. In Paludiculture—Productive Use of Wet Peatlands Climate Protection—Biodiversity—Regional Economic Benefits; Wichtmann, W., Schröder, C., Joosten, H., Eds.; Schweizerbart Science Publishers: Stuttgart, Germany, 2016; pp. 207–211. [Google Scholar]
- Allen, V.G.; Batello, C.; Berretta, E.J.; Hodgson, J.; Kothmann, M.; Li, X.; McIvor, J.; Milne, J.; Morris, C.; Peeters, A.; et al. An international terminology for grazing lands and grazing animals. Grass Forage Sci. 2011, 66, 2–28. [Google Scholar] [CrossRef]
- Tölle, R.; Prochnow, A.; Kraschinski, S. Measuring techniques for the assessment of the trafficability of fen grasslands. Agrartech. Forsch. 2000, 55, 218–219. [Google Scholar]
- Elsgaard, L.; Görresa, C.M.; Hoffmann, C.C.; Blicher-Mathiesen, G.; Schelde, K.; Petersen, S.O. Net ecosystem exchange of CO2 and carbon balance for eight temperate organic soils under agricultural management. Agric. Ecosyst. Environ. 2012, 162, 52–67. [Google Scholar] [CrossRef]
- Schrier-Uijl, A.P.; Kroon, P.S.; Leffelaar, P.A.; van Huissteden, J.C.; Berendse, F.; Veenendaal, E.M. Methane emissions in two drained peat agro-ecosystems with high and low agricultural intensity. Plant Soil 2010, 329, 509–520. [Google Scholar] [CrossRef]
- Veenendaal, E.M.; Kolle, O.; Leffelaar, P.A.; Schrier-Uijl, A.P.; van Huissteden, J.; van Walsem, J.; Möller, F.; Berendse, F. CO2 exchange and Carbon balance in two grassland sites on eutrophic drained peat soils. Biogeosci. Discuss. 2007, 4, 1633–1671. [Google Scholar] [CrossRef]
- Schrier-Uijl, A.P.; Kroon, P.S.; Hendriks, D.M.D.; Hensen, A.; van Huissteden, J.; Berendse, F.; Veenendaal, E.M. Agricultural peatlands: Towards a greenhouse gas sink—A synthesis of a Dutch landscape study. Biogeosciences 2014, 11, 4559–4576. [Google Scholar] [CrossRef]
- Prochnow, A.; Kraschinski, S.; Tölle, R.; Hahn, J. Classes of load-input for agricultural machinery working on fen grasslands. Agrartech. Forsch. 1999, 5, 26–36. (In German) [Google Scholar]
- Käding, H.; Kaiser, T.; Werner, A. Model for calculating grassland yields and forage quality in North-East Germany on the basis of site and management characteristics. Arch. Agron. Soil Sci. 2005, 51, 417–431. [Google Scholar] [CrossRef]
- Statistical Office for Berlin-Brandenburg. 2013 Höhere Pachtpreise und Weniger Gepachtete Fläche in Brandenburg; Press Release No. 42; Amt für Statistik Berlin-Brandenburg: Potsdam, Germany, 2014. (In German) [Google Scholar]
- Municipality Memorandum of Möllenhagen on Drainage Fees. Available online: http://www.amt-penzliner-land.de/media/custom/2225_152_1.PDF?1366622112 (accessed on 27 July 2016).
- Kuratorium für Technik und Bauwesen in der Landwirtschaft e.V. Faustzahlen für die Landwirtschaft—14. Auflage; KTBL: Darmstadt, Germany, 2009. (In German) [Google Scholar]
- The German Farmers’ Association. Agricultural Subsidies—CAP Subsidy Estimator for Farmers until 2019—Direct Payments of Coming Years Calculated. Available online: http://www.bauernverband.de/praemienschaetzer (accessed on 26 July 2016).
- State Office for Environment. Peat-Conservation Payments. AUKM Peat-Conservation Weir. Available online: http://www.lfu.brandenburg.de/cms/detail.php/bb1.c.427130.de (accessed on 26 July 2016).
- Hanff, H.; Lau, H. Datensammlung für die Betriebsplanung und die Betriebswirtschaftliche Bewertung Landwirtschaftlicher Produktionsverfahren im Land Brandenburg. Ackerbau/Grünlandwirtschaft/Tierproduktion, 7; Ministerium für Infrastruktur und Landwirtschaft des Landes Brandenburg (MIL): Potsdam, Germany, 2016. (In German) [Google Scholar]
- Schlegel & Co. Gartenprodukte GmbH; (Basel, Switzerland). Personal communication, 2016.
- Couwenberg, J.; Thiele, A.; Tanneberger, F.; Augustin, J.; Bärisch, S.; Dubovik, D.; Liashchynskaya, N.; Michaelis, D.; Minke, M.; di Skuratovich, A.; et al. Assessing greenhouse gas emissions from peatlands using vegetation as a proxy. Hydrobiologia 2011, 674, 67–89. [Google Scholar] [CrossRef]
- Singh, S.P.; Deshpande, J.V. Break-even point. Econ. Polit. Wkly. 2016, 48, 123–128. [Google Scholar]
- Hytönen, J. Effects of wood, peat and coal ash fertilization on Scots pine foliar nutrient concentrations and growth on afforested former agricultural peat soils. Silva Fenn. 2003, 37, 219–234. [Google Scholar] [CrossRef]
- Svoboda, N.; Taube, R.; Wienforth, B.; Kluß, C.; Kage, H.; Herrmann, A. Nitrogen leaching losses after biogas residue application to maize. Soil Tillage Res. 2013, 130, 69–80. [Google Scholar] [CrossRef]
- Timmermann, T. 3.2.1. Biomasse- und Standortkatalog (Standortpotenziale). In Bericht zum Forschungs-und Entwicklungsprojekt Energiebiomasse aus Niedermooren (ENIM); Wichmann, S., Wichtmann, W., Eds.; Universität Greifswald: Greifswald, Germany, 2009; pp. 37–48. (In German) [Google Scholar]
- Historical EU Price Serie of COW’s RAW MILK in EURO/100 kg. Regulation (EC) No 479/2010 Article 2. Raw Milk Price in Germany: Average Price of June 2015—May 2016. Available online: http://www.ec.europa.eu/agriculture/market-observatory/milk/pdf/eu-historical-price-series_en.xls (accessed on 27 July 2016).
- FAOSTAT Online Database. Producer Price of Beef in Germany. Average Price of 2009–2013. Available online: http://www.faostat3.fao.org/download/P/PP/E (accessed on 27 July 2016).
- Deutscher Bundestag. Gesetz für den Ausbau erneuerbarer Energien (Erneuerbare-Energien-Gesetz—EEG 2014) EEG; Paragraph § 44 Biomass; Federal Ministry of Justice and Consumer Protection: Berlin, Germany. (In German)
- Naegele, H.J.; Lemmer, A.; Oechsner, H.; Jungbluth, T. Electric energy consumption of the full scale research biogas plant “Unterer Lindenhof”: Results of long-term and full detail measurements. Energies 2012, 5, 5198–5214. [Google Scholar] [CrossRef]
- Amon, T.; Amon, B.; Kryvoruchko, V.; Zollitsch, W.; Mayer, K.; Gruber, L. Biogas production from maize and dairy cattle manure—Influence of biomass composition on the methane yield. Agric. Ecosyst. Environ. 2007, 118, 173–182. [Google Scholar] [CrossRef]
- Meyer-Aurich, A.; Lochmann, Y.; Klauss, H.; Prochnow, A. Comparative advantage of maize- and grass-silage based feedstock for biogas production with respect to greenhouse gas mitigation. Sustainability 2016, 8, 1–14. [Google Scholar] [CrossRef]
- Miranda, N.D.; Granell, R.; Tuomisto, H.L.; McCulloch, M.D. Meta-analysis of methane yields from anaerobic digestion of dairy cattle manure. Biomass Bioenergy 2016, 86, 65–75. [Google Scholar] [CrossRef]
- Tufvesson, L.M.; Lantz, M.; Börjesson, P. Environmental performance of biogas produced from industrial residues including competition with animal feed—Life-cycle calculations according to different methodologies and standards. J. Clean. Prod. 2013, 53, 214–223. [Google Scholar] [CrossRef]
- Budde, J.; Prochnow, A.; Plöchl, M.; Suárez Quiñones, T.; Heiermann, M. Energy balance, greenhouse gas emissions, and profitability of thermobarical pretreatment of cattle waste in anaerobic digestion. Waste Manag. 2016, 49, 390–410. [Google Scholar] [CrossRef] [PubMed]
- Blokhina, Y.; Prochnow, A.; Plöchl, M.; Luckhaus, C.; Heiermann, M. Concepts and profitability of biogas production from landscape management grass. Bioresour. Technol. 2011, 102, 2086–2092. [Google Scholar] [CrossRef] [PubMed]
- Hartmann, H. Produktion, Bereitstellung und Eigenschaften biogener Festbrennstoffe. In Leitfaden Bioenergie Planung, Betrieb und Wirtschaftlichkeit von Bioenergieanlagen; Eltrop, L., Raab, K., Hartmann, H., Schneider, S., Schrüder, G., Fischer, J., Jahraus, B., Heinrich, P., Eds.; Fachagentur Nachwachsende Rohstoffe e. V.: Gülzow, Germany, 2000; pp. 52–89. (In German) [Google Scholar]
- Fritsche, U.; Rausch, L.; Simon, K.-H. Umweltwirkungsanalyse von Energiesystemen: Gesamt-Emissions-Modell Integrierter Systeme (GEMIS) Endbericht; Öko-Institut, Büro Darmstadt: Darmstadt, Germany, 1989; pp. 113–161. (In German) [Google Scholar]
- Hinge, J. Heating and Cooling with Biomass—Change of the Heating System on a Danish Pig Farm; EUBIONET III: Jyväskylä, Finland, 2010. [Google Scholar]
- Schaubach, K.; Zeymer, M. Basisinformationen für eine Nachhaltige Nutzung von Landwirtschaftlichen Reststoffen zur Bioenergiebereitstellung, 13; 7 Technisch-ökonomische Analyse der Gesamtkonzepte; Deutsches Biomasseforschungszentrum: Leipzig, Germany, 2012; pp. 100–128. (In German) [Google Scholar]
- Federal Ministry of Food and Agriculture. Implementation of EU Agricultural Reforms in Germany. Available online: http://www.bmel.de/SharedDocs/Downloads/Broschueren/UmsetzungGAPinD.pdf;jsessionid=B32510459EAC3D29EA56680229242E35.2_cid367?__blob=publicationFile (accessed on 27 July 2016).
- European Commission. Renewable Energy. Available online: https://www.ec.europa.eu/energy/en/topics/renewable-energy (accessed on 20 July 2016).
- FAOSTAT Online Database. Producer Price of Milk in Germany. Average Price of 2010–2014. Available online: http://www.faostat3.fao.org/download/P/PP/E (accessed on 27 July 2016).
- Réquillart, V.; Bouamra-Mechemache, Z.; Jongeneel, R.; Penel, C. Economic Analysis of the Effects of the Expiry of the EU Milk Quota System; Final Report; Institut d’economie Industrielle: Brussels, Belgium, 2008. [Google Scholar]
- Jongeneel, R.; van Berkum, S. What Will Happen after the EU Milk Quota System Expires in 2015? An Assessment of the Dutch Dairy Sector; LEI Wageningen UR: Wageningen, The Netherlands, 2015. [Google Scholar]
- Hansen, B.G. An analysis of past world market prices of feed and milk and predictions for the future. Agribusiness 2016. [Google Scholar] [CrossRef]
- The European Parliament and the Council of the European Union. Regulation (EU) No 1306/2013 of the European Parliament and of the Council of 17 December 2013 on the Financing, Management and Monitoring of the Common Agricultural Policy and Repealing Council Regulations (EEC) No 352/78, (EC) No 165/94, (EC) No 2799/98, (EC) No 814/2000, (EC) No 1290/2005 and (EC) No 485/2008. Off. J. Eur. Union 2013, 347, 549–607. [Google Scholar]
- Prochnow, A.; Heiermann, M.; Plöchl, M.; Linke, B.; Idler, C.; Amon, T.; Hobbs, P.J. Bioenergy from permanent grassland—A review: 1. Biogas. Bioresour. Technol. 2009, 100, 4931–4944. [Google Scholar] [CrossRef] [PubMed]
- Joosten, H.; Brust, K.; Couwenberg, J.; Gerner, A.; Holsten, B.; Permien, T.; Schäfer, A.; Tanneberger, F.; Trepel, M.; Wahren, A. MoorFutures® Integration of Additional Ecosystem Services (Including Biodiversity) into Carbon Credits—Standard, Methodology and Transferability to Other Regions; BfN-Skripten 40; Bundesamt für Naturschutz (BfN) Federal Agency for Nature Conservation: Bonn, Germany, 2015. [Google Scholar]
- FAOSTAT Online Database. Producer Price Indices in the Selected Country (2004-2006=100) 2002–2012. Available online: http://www.faostat3.fao.org/download/P/PP/E (accessed on 27 July 2016).


| 1 | 2 | 3 | 4 | 5 | 6 | 7 | 8 | 9 | 10 | ||
| Land Use | Cropland | ||||||||||
| Main farm focus | Milk | Milk | Beef | Energy | Food/feed | Milk | Milk | Beef | Energy | ||
| Products | Milk, biogas | Milk | Bulls, biogas | Biogas | Cash crops | Milk, biogas | Milk | Bulls, biogas | Biogas | ||
| Main crop | Maize | Maize | Maize | Maize | Barley | Potato c | Grass | Grass | Grass | Grass | |
| Biomass yield | t DM a ha−1·year−1 | 13 | 13 | 13 | 13 | 5.04 | 6.6 | 10 | 10 | 10 | 10 |
| t FM b ha−1·year−1 | 37.14 | 37.14 | 37.14 | 37.14 | 6 | 30 | 28.57 | 28.57 | 28.57 | 28.57 | |
| Reference | [17] | [17] | [17] | [17] | [17] | [17] | [17] | [17] | [17] | [17] | |
| Number of harvests per year | 1 | 1 | 1 | 1 | 1 | 1 | 4 | 4 | 4 | 4 | |
| Milk yield per cow | kg·year−1 | 9000 | 9000 | - | - | - | - | 8000 | 8000 | - | - |
| 11 | 12 | 13 | 14 | 15 | 16 | 17 | 18 | 19 | 20 | ||
| Land Use | Intensive Grassland | Extensive Grassland | Near-Natural Fen | ||||||||
| Main farm focus | Milk | Milk | Beef | Energy | Calf | Energy | Energy | ||||
| Products | Milk, biogas | Milk | Bulls, biogas | Biogas | Suckler cow | Biogas | Combustion | Combustion | Unused | ||
| Main crop | Grass | Grass | Grass | Grass | Grass/herbs | Grass | Grass/herbs | Alder | Reed | Grass/herbs | |
| Biomass yield | t DM a ha−1·year−1 | 8 | 8 | 8 | 8 | 5.8 | 5.8 | 5.8 | 3.5 | 12.5 | 1.5 |
| t FM b ha−1·year−1 | 22.86 | 22.86 | 22.86 | 22.86 | 16.57 | 16.57 | 16.57 | 6 | 14.71 | - | |
| Reference | [17] | [17] | [17] | [17] | [17] | [17] | [17] | [23] | [24] | [25] | |
| Number of harvests per year | 4 | 4 | 4 | 4 | 1 | 1 | 1 | 0.166 | 1 | 0 | |
| Milk yield per cow | kg·year−1 | 8000 | 8000 | - | - | - | - | - | - | - | - |
| Parameter | Unit | Value | Reference |
|---|---|---|---|
| Overhead costs | |||
| Rent for cropland | €·ha−1 | 131.00 | [34] |
| Rent for intensive grassland | €·ha−1 | 90.00 | [34] |
| Rent for extensive grassland | €·ha−1 | 45.00 | [34] |
| Tax | €·ha−1·year−1 | 7.67 | [15] |
| Payment for ditch maintenance | €·ha−1·year−1 | 9.05 | [35] |
| Payment for ditch maintenance on natural fen | €·ha−1·year−1 | 4.87 | [35] |
| Labor costs | €·h−1 | 15.00 | [36] |
| Government payments | |||
| EU basic payment (Brandenburg) | €·ha−1 | 159.58 | [37] |
| Greening payment | €·ha−1 | 87.11 | [37] |
| Shifting payment (first 30 ha) | €·ha−1 | 13.40 | [37] |
| Extensive peat-saving management a | €·ha−1 | 387.00 | [38] |
| Producer prices | |||
| Barley | €·t−1·FM | 158.40 | [39] |
| Potato (food) | €·t−1·FM | 142.00 | [39] |
| Potato (feed) | €·t−1·FM | 15.00 | [39] |
| Seed/plant costs | |||
| Maize seed | €·ha−1 | 136.00 | [39] |
| Barley seed | €·ha−1 | 60.00 | [39] |
| Potato seed | €·ha−1 | 856.00 | [39] |
| Grass seed | €·ha−1 | 56.00 | [39] |
| Young alder plants (4000 plants per hectare) | €·ha−1 | 2680.00 | [40] |
| Other supplies | |||
| Diesel costs | €·L−1 | 0.80 | [36] |
| Nitrogen fertilizer | €·t−1 | 960.00 | [39] |
| Net for round bale | €·m−1 | 0.08 | [17] |
| Cropland | Intensive Grassland | Extensive Grassland | Near Natural Fen | |||||||||||
|---|---|---|---|---|---|---|---|---|---|---|---|---|---|---|
| Crop | Maize | Barley | Potato | Grass | Grass | Grass for Combustion | Grass for Sucker Cow Husbandry | Grass Biogas | Grass for Combustion | Short Rotation Coppice | Reed | Unused | ||
| €·ha−1 * | h·ha−1 | Number of cultivation steps per year | ||||||||||||
| Tillage | ||||||||||||||
| Rotary cultivator (Ww 2.5 m; Ep 45 kW) | 15.30 | 0.93 | - | - | - | - | - | - | - | - | - | 0.042 | - | - |
| Ploughing (Ww 3.5 m; Ep 120 kW) | 54.88 | 0.66 | - | - | - | 1 | - | - | - | - | - | - | - | - |
| Mulching (Ww 2.5 m; Ep 45 kW) | 32.18 | 1.22 | - | - | - | - | - | - | 1 | 1 | 1 | 0.083 | - | - |
| Rolling (Ww 3 m; Ep 54 kW) | 15.30 | 0.68 | - | - | - | - | - | - | 1 | 1 | 1 | - | - | - |
| Rolling (Ww 6 m; Ep 54 kW) | 9.94 | 0.34 | - | - | - | - | 1 | 1 | - | - | - | - | - | - |
| 1. disc harrow (Ww 6 m; Ep 120 kW) | 17.82 | 0.22 | 1 | 1 | 1 | - | - | - | - | - | - | - | - | - |
| 2. disc harrow (Ww 6 m; Ep 120 kW) | 19.09 | 0.25 | 1 | 1 | 1 | - | - | - | - | - | - | - | - | - |
| Fertilizer application | ||||||||||||||
| Pump (Ep 25 kW) | 0.27 | - | 1 | - | - | 1 | 1 | - | - | - | - | - | - | - |
| Transport of digestate (Lc 27 m3; Ep 200 kW) | 2.00 | 0.20 | 1 | - | - | 3 | 3 | - | - | - | - | - | - | - |
| Digestate application (Lc 20 m3; induction tool, Ww 24 m; Ep157 kW) | 10.23 | 0.10 | 1 | - | - | 3 | 3 | - | - | - | - | - | - | - |
| Mineral fertilizer transport (Lc trailer 8 t; Ep 54 kW) | 4.30 | 0.30 | 1 | 3 | 1 | 1 | 1 | 1 | - | - | - | - | - | - |
| Mineral fertilizer application (Lc 1.7 m3, Ww 24 m; Ep 83 kW) | 6.49 | 0.08 | 1 | 3 | 1 | 1 | 1 | 1 | - | - | - | - | - | - |
| Seeding/planting | ||||||||||||||
| Seeding Maize (8 lines, Ww 6 m; Ep 54 kW) | 45.28 | 0.35 | 1 | - | - | 1 | - | - | - | - | - | - | - | - |
| Seeding barley (Ww 3 m; Ep 120 kW) | 58.12 | 0.85 | - | 1 | - | - | - | - | - | - | - | - | - | - |
| Seeding potato (Ww 6 lines; Ep 120 kW) | 62.38 | 0.60 | - | - | 1 | - | - | - | - | - | - | - | - | - |
| Seeding grass (Ww 3 m; Ep 120 kW) | 58.12 | 0.85 | - | - | - | - | 0.333 | 0.333 | - | 0.333 | - | - | - | - |
| To hill up potato (Ww 6 lines; Ep 54 kW) | 20.08 | 0.53 | - | - | 1 | - | - | - | - | - | - | - | - | - |
| Pesticide application | ||||||||||||||
| Herbicide application (Ww 24 m, Lc 3000 L; Ep 54 kW) | 6.38 | 0.21 | 1 | 1 | 1 | - | - | - | - | - | - | - | - | - |
| Fungicide/ insecticide application (Ww 24 m, Lc 3000 L; Ep 54 kW) | 6.38 | 0.21 | - | 2 | 5 | - | - | - | - | - | - | - | - | - |
| Harvest | ||||||||||||||
| Mowing grass (Ww 3 m; Ep 45 kW) | 15.68 | 0.40 | - | - | - | 4 | 4 | 4 | - | - | - | - | - | - |
| Mowing grass (Ww 2.4 m; Ep 45 kW) | 12.17 | 0.48 | - | - | - | - | - | - | 0.5 | 1 | 1 | - | 1 | - |
| Turning grass (Ww 10.75 m; Ep 67 kW) | 8.65 | 0.22 | - | - | - | 4 | 4 | 4 | - | - | - | - | - | - |
| Turning grass (Ww 5.5 m; Ep 45 kW) | 8.02 | 0.29 | - | - | - | - | - | - | 0.5 | 1 | 1 | - | - | - |
| Swathing hay (Ww 12.5 m; Ep 120 kW) | 12.70 | 0.10 | - | - | - | 4 | 4 | 4 | - | - | - | - | - | - |
| Swathing hay (Ww 4 m; Ep 45 kW) | 9.64 | 0.32 | - | - | - | - | - | - | 0.5 | 1 | 1 | - | - | - |
| Baling of hay (Lc round bales 1.2 m; Ep 54 kW) | 19.46 | 0.33 | - | - | - | - | - | 4 | 0.5 | - | 1 | - | - | - |
| Harvest by chipper for grass silage (Ep 275 kW) | 33.21 | 0.20 | - | - | - | 4 | 4 | - | - | 1 | - | - | - | - |
| Harvest by chipper for maize silage (Ww 8 lines, Ep 350 kW) | 115.98 | 0.33 | 1 | - | 1 | - | - | - | - | - | - | - | - | - |
| Harvest by chipper for short rotation coppice (Ww 1 line, Ep 83 kW) | 85.21 | 2.43 | - | - | - | - | - | - | - | - | - | 0.167 | - | - |
| Transport of grass silage to silo (Lc 2 Trailer 8 t; Ep 67 kW) | 10.56 | 0.40 | - | - | - | 1 | 1 | - | - | - | - | - | - | - |
| Transport of grass silage to silo (Lc Trailer 8 t; Ep 54 kW) | 29.71 | 2.29 | - | - | - | - | - | - | - | 1 | - | - | - | - |
| Transport of maize silage to silo (Lc Trailer 40 m3; Ep 120 kW) | 78.31 | 1.94 | 1 | - | - | - | - | - | - | - | - | - | - | - |
| Transport of barley to dealer (Lc Trailer 18 t; Ep 120 kW) | 1.22 | 0.02 | - | - | 1 | - | - | - | - | - | - | - | - | - |
| Transport of potato storage (Lc Trailer 8 t; Ep 67 kW) | 24.07 | 0.63 | - | - | - | 1 | - | - | - | - | - | - | - | - |
| Transport of hay (Lc Trailer 14 t; Front loader; Ep 67 kW) | 9.40 | 0.40 | - | - | - | 1 | - | 1 | - | - | - | - | 1 | - |
| Transport of hay (Lc 2 Trailer 8 t; Front loader; Ep 54 kW) | 28.67 | 1.36 | - | - | - | - | - | - | - | - | 1 | - | - | - |
| Transport of wood chips to storage (Lc Trailer 10 t; Ep 67 kW) | 33.96 | 2.42 | - | - | - | - | - | - | - | - | - | 0.167 | - | - |
| Compaction in silo (Loader, Lc 13.5 t, Ep 105 kW; front shovel 4 m3) | 18.39 | 0.97 | 1 | - | - | 1 | 1 | - | - | 1 | - | - | - | - |
| Reed harvester caterpillar (Ww 3 m) [45] | 408.76 | 2.00 | - | - | - | - | - | - | - | - | - | - | - | - |
| Combine harvester (Lc 9500 L; Ep 225 kW; Ww 7.5 m) | 86.31 | 0.51 | - | 1 | - | - | - | - | - | - | - | - | - | - |
| Leave chipping of potatoes (Ww 6 lines, Ep 54 kW) | 22.42 | 0.53 | - | - | 1 | - | - | - | - | - | - | - | - | - |
| Sorting of potato [39] | 416.00 | - | - | - | 1 | - | - | - | - | - | - | - | - | - |
| Cropland | Intensive Grassland | ||||||||||||
|---|---|---|---|---|---|---|---|---|---|---|---|---|---|
| Yield/ha a | Dairy Cow (Maize) | Hectare/Cow | Dairy Cow (Grass) | Hectare/Cow | Bull Fattening (Maize) | Hectare/Bull | Bull Fattening (Grass) | Hectare/Bull | Dairy Cow (Grass) | Hectare/Cow | Bull Fattening (Grass) | Hectare/Bull | |
| t DM ha−1 | % DM in Feed | ha·cow−1 | % DM in Feed | ha·cow−1 | % DM in Feed | ha·bull−1 | % DM in Feed | ha·bull−1 | % DM in Feed | ha·cow−1 | % DM in Feed | ha·bull−1 | |
| Barley | 5.16 | 4.9 | 0.0685 | 5.6 | 0.0735 | 5.0 | 0.03 | 5.35 | 0.03 | 5.62 | 0.0735 | 4.86 | 0.0286 |
| Wheat | 5.418 | 12.2 | 0.1630 | 14.0 | 0.1749 | 12.4 | 0.07 | 13.37 | 0.08 | 14.04 | 0.1749 | 12.16 | 0.0682 |
| Pea meal | 2.58 | 6.4 | 0.1815 | 7.4 | 0.1946 | 6.6 | 0.08 | 7.09 | 0.09 | 7.44 | 0.1946 | 6.44 | 0.0759 |
| Rapeseed meal | 1.3932 | 0.1 | 0.0063 | 0.1 | 0.0068 | 0.1 | 0.00 | 0.13 | 0.00 | 0.14 | 0.0068 | 0.12 | 0.0027 |
| Maize silage | 13 | 61.6 | 0.3439 | 0.0 | 0.0000 | 75.2 | 0.17 | 0.00 | 0.00 | 0.00 | 0.0000 | 0.00 | 0.0000 |
| Grass silage | 10 | 14.1 | 0.1022 | 71.9 | 0.4855 | 0.0 | 0.00 | 73.26 | 0.23 | 71.92 | 0.6068 | 75.68 | 0.2874 |
| ha cattle−1 | 0.8654 | 0.9352 | 0.35 | 0.43 | 1.06 | 0.46 | |||||||
| Cattle ha−1 | 1.16 | 1.07 | 2.88 | 2.33 | 0.95 | 2.16 | |||||||
| Parameter | Unit | Value | Reference |
|---|---|---|---|
| Costs of dairy cow husbandry | |||
| Costs for stable (depreciation, interest, service) | €·cow−1 | 150.00 | [17] |
| Interest (rate 6%) | €·cow−1 | 60.00 | [17] |
| Energy/water | €·cow−1 | 96.00 | [17] |
| Animal health | €·cow−1 | 105.00 | [17] |
| Insemination | €·cow−1 | 50.00 | [17] |
| Purchase heifers | €·cow−1 | 1900.00 | [17] |
| Mineral feed | €·cow−1 | 120.00 | [17] |
| Labor demand | h·cow−1 | 37.00 | [36] |
| Other costs | €·cow−1 | 80.00 | [36] |
| Producer price of milk | €·kg−1 | 0.28 | [46] |
| Costs for beef production | |||
| Costs for stable (depreciation, interest, service) | €·bull−1 | 75.00 | [17] |
| Interest (rate 6%) | €·bull−1 | 50.00 | [17] |
| Energy/water | €·bull−1 | 30.00 | [17] |
| Animal health | €·bull−1 | 16.00 | [17] |
| Purchase young bulls | €·bull−1 | 563.00 | [39] |
| Mineral feed | €·bull−1 | 23.00 | [17] |
| Labor demand | h·bull−1 | 4.50 | [41] |
| Other costs | €·bull−1 | 15.00 | [17] |
| Producer price of beef | €·kg−1 | 3.30 | [47] |
| Costs of calf production | |||
| Costs of equipment (depreciation, interest, service) | €·suckler·cow−1 | 27.00 | [17] |
| Interest (rate 6%) | €·suckler·cow−1 | 20.00 | [17] |
| Energy/water | €·suckler·cow−1 | 20.00 | [17] |
| Animal health | €·suckler·cow−1 | 15.00 | [17] |
| Insemination | €·suckler·cow−1 | 20.00 | [36] |
| Mineral feed | €·suckler·cow−1 | 18.00 | [17] |
| Labor demand | h·suckler·cow−1 | 8.00 | [36] |
| Other costs | €·suckler·cow−1 | 40.00 | [17] |
| Producer price of calves | €·calf−1 | 82.50 | [36] |
| Costs of ensiling | |||
| Silage additives | €·m−3 FM | 1.50 | [39] |
| Silo foil | €·m−2 | 0.40 | [36] |
| Depreciation | €·m−2 | 42.00 | [36] |
| Service/repair silo | €·m−2 | 6.00 | [36] |
| Parameter | Unit | Value | Reference |
|---|---|---|---|
| Characteristics of biogas plant | |||
| Process energy demand | percent of gross energy | 8 | [49] |
| Methane yield of maize silage | L·kg−1 FM | 101.15 | [50] |
| Methane yield of grass silage from intensive grassland | L·kg−1 FM | 115 | [51] |
| Methane yield of grass silage from extensive grassland | L·kg−1 FM | 84 | [51] |
| Methane yield of cattle slurry | L·kg−1 FM | 16.90 | [52] |
| Biogas loss by leakage | % | 2 | [53] |
| Electrical efficiency | % | 38.70 | [54] |
| Thermal efficiency | % | 46.90 | [54] |
| Costs of biogas plant | |||
| Depreciation (30 years) | €·kWhel−1 | 0.0338 | [36] |
| Interest (rate 6%) | €·kWhel−1 | 0.0082 | [36] |
| Service/repair | €·kWhel−1 | 0.0197 | [36] |
| Insurance | €·kWhel−1 | 0.0020 | [36] |
| Laboratory analyses | €·kWhel−1 | 0.0004 | [36] |
| Operating materials | €·kWhel−1 | 0.0130 | [36] |
| Labor demand | h·kWhel−1 | 0.0007 | [36] |
| Revenues | |||
| Electricity (feed-in tariff) | €·kWhel−1 | 0.1166 | [48] |
| Heat (market price) | €·kWhth−1 | 0.04 | [55] |
| Unit | Reed/Hay | References | Wood Chips | References | |
|---|---|---|---|---|---|
| Characteristics of combustion plant | |||||
| Energy content hay | kWh·t−1 DM | 4000 | [56] | - | - |
| Energy content reed | kWh·t−1 DM | 3800 | [56] | - | - |
| Energy content wood chips | kWh·t−1 DM | - | - | 3800 | [55] |
| Thermal efficiency | % | 70 | [56,57] | 70 | [56,57] |
| Costs of biomass combustion | |||||
| Investment costs | €·kWhth−1 | 0.02 | [58] | 0.01 | [58] |
| Operating life | years | 7 | [58] | 15.00 | [58] |
| Rate of interest | % | 8 | [59] | 8 | [59] |
| Service | % of investment cost | 2 | [59] | 2 | [59] |
| Insurance | % of investment cost | 1 | [59] | 1 | [59] |
| Feeding | €·ha−1 | 11.90 | [36] | 16.20 | [36] |
| Administration | % of investment cost | 0.75 | [59] | 0.75 | [59] |
| Other/insurance/administration | €·kWhth−1 | 1.00 | [59] | 1.00 | [59] |
| Land Use | Cropland | ||||||||||
| Products | Milk/Biog. | Milk | Bull Fat./Biogas | Biogas | Barley | Potato | Milk/Biog. | Milk | Bull Fat./Biogas | Biogas | |
| Main Crop | Maize | Maize | Maize | Maize | Barley | Potato | Field Grass | Field Grass | Field Grass | Field Grass | |
| Cows fed per ha | cow·ha−1 | 1.16 | 1.16 | 2.88 | - | - | - | 1.07 | 1.07 | 2.33 | - |
| Costs | |||||||||||
| Field | €·ha−1 | 821 | 820 | 680 | 821 | 688 | 2516 | 838 | 838 | 842 | 875 |
| Storage/silo | €·ha−1 | 105 | 105 | 149 | 73 | - | - | 86 | 86 | 89 | 150 |
| Milk production | €·ha−1 | 2137 | 2137 | - | - | - | - | 1944 | 1901 | - | - |
| Beef production | €·ha−1 | - | - | 2869 | - | - | - | - | - | 2322 | - |
| Biogas plant | €·ha−1 | 99 | - | 247 | 1057 | - | - | 92 | - | 200 | 498 |
| Incineration plant | €·ha−1 | - | - | - | - | - | - | - | - | - | - |
| Income | |||||||||||
| Beef | €·ha−1 | 454 | 454 | 3658 | - | - | - | 420 | 420 | 2960 | - |
| Milk | €·ha−1 | 2912 | 2912 | - | - | - | - | 2395 | 2395 | - | - |
| Calves sale | €·ha−1 | 84 | 84 | - | - | - | - | 78 | 78 | - | - |
| Electricity | €·ha−1 | 133 | - | 332 | 1416 | - | - | 123 | - | 268 | 670 |
| Heat | €·ha−1 | 42 | - | 105 | 470 | - | - | 39 | - | 85 | 222 |
| Cash crops | €·ha−1 | - | - | - | - | 950 | 3879 | - | - | - | - |
| EU-Subsidies | €·ha−1 | 260 | 260 | 260 | 260 | 260 | 260 | 260 | 260 | 260 | 260 |
| Environmental programs | €·ha−1 | - | - | - | - | - | - | - | - | - | - |
| Income with payments | €·ha−1 | 3885 | 3710 | 4354 | 2245 | 1210 | 4139 | 3315 | 3153 | 3573 | 1151 |
| Income without payments | €·ha−1 | 3625 | 3450 | 4095 | 1886 | 950 | 3879 | 3055 | 2893 | 3313 | 892 |
| Total costs | €·ha−1 | 3211 | 3062 | 3946 | 1953 | 688 | 2516 | 2960 | 2826 | 3453 | 1523 |
| Variable costs | €·ha−1 | 1812 | 1774 | 2936 | 846 | 381 | 1567 | 1538 | 1503 | 2419 | 453 |
| Profit with payments | €·ha−1 | 674 | 648 | 409 | 218 | 522 | 1622 | 355 | 327 | 136 | −371 |
| Profit without payments | 414 | 388 | 149 | −42 | 263 | 1363 | 95 | 67 | −96 | −631 | |
| Break-even price with payments | €·kWhel−1 | n/a | - | n/a | 0.1005 | - | - | n/a | - | 0.0611 | 0.1813 |
| Break-even price without payments | n/a | - | 0.0642 | 0.1219 | - | - | 0.0264 | - | 0.1492 | 0.2265 | |
| Break-even price with payments | €·L−1 milk | 0.2152 | 0.2177 | - | - | - | - | 0.2385 | 0.2418 | - | - |
| Break-even price without payments | 0.2402 | 0.2427 | - | - | - | - | 0.2689 | 0.2721 | - | - | |
| Break-even price with payments | €·kg−1 beef | - | - | 2.9314 | - | - | - | - | - | 3.1178 | - |
| Break-even price without payments | - | - | 3.1656 | - | - | - | - | - | 3.4072 | - | |
| Break-even price with payments | €·t−1 FM | - | - | - | - | 71.37 | 75.23 | - | - | - | - |
| Break-even price without payments | - | - | - | - | 114.63 | 83.88 | - | - | - | - | |
| Land Use | Intensive Grassland | Extensive Grassland | Near-Natural Fen | ||||||||
| Products | Milk/ Biog. | Milk | Bull Fat./ Biogas | Biogas | Suckle Cow | Biogas | Combustion | Reed | Unused | ||
| Main crop | Grass | Grass | Grass | Grass | Grass Herbs | Grass | Grass Herbs | Alder | Reed | Grass Herbs | |
| Cows fed per ha | cow·ha−1 | 0.95 | 0.95 | 2.16 | - | 0.6 | - | - | - | - | - |
| Costs | |||||||||||
| Field | €·ha−1 | 849 | 849 | 859 | 665 | 173 | 403 | 225 | 331 | 581 | 13 |
| Storage/silo | €·ha−1 | 95 | 95 | 103 | 121 | 48 | 88 | 114 | 15 | 245 | - |
| Milk production | €·ha−1 | 1716 | 1683 | - | - | - | - | - | - | - | - |
| Beef production | €·ha−1 | - | - | 2153 | - | 168 | - | - | - | - | - |
| Biogas plant | €·ha−1 | 104 | - | 238 | 400 | - | 74 | - | - | - | - |
| Incineration plant | €·ha−1 | - | - | - | - | - | - | 539 | 254 | 1306 | - |
| Income | |||||||||||
| Beef | €·ha−1 | 372 | 372 | 2745 | - | 91 | - | - | - | - | - |
| Milk | €·ha−1 | 2120 | 2120 | - | - | - | - | - | - | - | - |
| Calves sale | €·ha−1 | 69 | 69 | - | - | 36 | - | - | - | - | - |
| Electricity | €·ha−1 | 140 | - | 319 | 536 | - | 99 | - | - | - | - |
| Heat | €·ha−1 | 44 | - | 101 | 178 | - | 33 | 730 | 309 | 1495 | - |
| Cash crops | €·ha−1 | - | - | - | - | - | - | - | - | - | - |
| EU-Subsidies | €·ha−1 | 260 | 260 | 260 | 260 | 260 | 260 | 260 | 260 | - | - |
| Environmental programs | €·ha−1 | - | - | - | - | 387 | 387 | 387 | 387 | 387 | 0 |
| Income with payments | €·ha−1 | 3004 | 2820 | 3425 | 973 | 774 | 815 | 1377 | 955 | 1882 | 0 |
| Income without payments | €·ha−1 | 2745 | 2561 | 3165 | 713 | 127 | 168 | 730 | 309 | 1495 | 0 |
| Total costs | €·ha−1 | 2765 | 2628 | 3353 | 1186 | 390 | 565 | 878 | 600 | 2132 | 13 |
| Variable costs | €·ha−1 | 1403 | 1364 | 2277 | 302 | 227 | 218 | 270 | 343 | 450 | 0 |
| Profit with payments | €·ha−1 | 239 | 193 | 72 | −213 | 384 | 250 | 499 | 355 | −249 | −13 |
| Profit without payments | −20 | −67 | -188 | −472 | −262 | −97 | −148 | −291 | −636 | −13 | |
| Break-even price with payments | €·kWhel−1 | n/a | - | 0.0904 | 0.1629 | - | n/a | - | - | - | - |
| Break-even price without payments | 0.1336 | - | 0.1854 | 0.2194 | - | 0.5852 | - | - | - | - | |
| Break-even price with payments | €·L−1 milk | 0.2484 | 0.2545 | - | - | - | - | - | - | - | - |
| Break-even price without payments | 0.2827 | 0.2888 | - | - | - | - | - | - | - | - | |
| Break-even price with payments | €·kg−1 beef | - | - | 3.2140 | - | n/a | - | - | - | - | - |
| Break-even price without payments | - | - | 3.5260 | - | 0.0128 | - | - | - | - | - | |
| Break-even price with payments | €·t−1 FM | - | - | - | - | - | - | - | - | - | - |
| Break-even price without payments | - | - | - | - | - | - | - | - | - | - | |
© 2016 by the authors; licensee MDPI, Basel, Switzerland. This article is an open access article distributed under the terms and conditions of the Creative Commons Attribution (CC-BY) license (http://creativecommons.org/licenses/by/4.0/).
Share and Cite
Rebhann, M.; Karatay, Y.N.; Filler, G.; Prochnow, A. Profitability of Management Systems on German Fenlands. Sustainability 2016, 8, 1103. https://doi.org/10.3390/su8111103
Rebhann M, Karatay YN, Filler G, Prochnow A. Profitability of Management Systems on German Fenlands. Sustainability. 2016; 8(11):1103. https://doi.org/10.3390/su8111103
Chicago/Turabian StyleRebhann, Marco, Yusuf Nadi Karatay, Günther Filler, and Annette Prochnow. 2016. "Profitability of Management Systems on German Fenlands" Sustainability 8, no. 11: 1103. https://doi.org/10.3390/su8111103
APA StyleRebhann, M., Karatay, Y. N., Filler, G., & Prochnow, A. (2016). Profitability of Management Systems on German Fenlands. Sustainability, 8(11), 1103. https://doi.org/10.3390/su8111103