Article

Analysis and Planning of Ecological Networks Based on Kernel Density Estimations for the Beijing-Tianjin-Hebei Region in Northern China

1
College of Information and Electrical Engineering, China Agricultural University, Beijing 100083, China
2
Key Laboratory for Agricultural Land Quality Monitoring and Control, Ministry of Land and Resources, Beijing 100035, China
*
Author to whom correspondence should be addressed.
Sustainability 2016, 8(11), 1094; https://doi.org/10.3390/su8111094
Submission received: 2 May 2016 / Revised: 17 October 2016 / Accepted: 19 October 2016 / Published: 25 October 2016
(This article belongs to the Section Social Ecology and Sustainability)

Abstract

:
With the continued social and economic development of northern China, landscape fragmentation has placed increasing pressure on the ecological system of the Beijing-Tianjin-Hebei (BTH) region. To maintain the integrity of ecological processes under the influence of human activities, we must maintain effective connections between habitats and limit the impact of ecological isolation. In this paper, landscape elements were identified based on a kernel density estimation, including forests, grasslands, orchards and wetlands. The spatial configuration of ecological networks was analysed by the integrated density index, and a natural breaks classification was performed for the landscape type data and the results of the landscape spatial distribution analysis. The results showed that forest and grassland are the primary constituents of the core areas and act as buffer zones for the region’s ecological network. Rivers, as linear patches, and orchards, as stepping stones, form the main body of the ecological corridors, and isolated elements are distributed mainly in the plain area. Orchards have transition effects. Wetlands act as connections between different landscapes in the region. Based on these results, we make suggestions for the protection and planning of ecological networks. This study can also provide guidance for the coordinated development of the BTH region.

1. Introduction

Ecological networks are frequently discussed with regard to nature conservation and land use planning [1,2,3,4] and represent an important element for resolving issues related to species and habitat protection [5,6]. Ecological networks are key factors for biodiversity protection and enhancement because of their ability to counteract fragmentation and create and strengthen relationships and exchanges among isolated elements [7]. The construction of ecological networks can effectively connect broken habitat patches and form spatially integrated landscapes and habitat networks that improve the quality of natural ecosystems [8,9,10,11]. Ecological network tools play a central role in landscape planning [4,12] and can serve as an approach to promoting ecological and functional integration [13]. Ecological networks can protect biological and landscape diversity and promote the sustainable development of land use patterns.
Over the past 40 years, China has experienced rapid urbanization and immense population growth [14,15], and rapid economic development and urban expansion have resulted in a series of environmental problems [16,17]. The fragmentation of natural habitats and landscapes is aggravated by urbanization, associated land development and transport network construction [18,19]. Irrational urban planning and land use patterns, excessive resource consumption and unexpected socio-economic development are the main factors underlying damage to regional ecosystems, including the island effect of urban areas on ecosystems [20,21].
The Beijing-Tianjin-Hebei (BTH) region has become the third growth pole of the Chinese economy because of the natural geographical advantages and great economic foundation of the region [22]. However, the rapid development of the region’s economy has caused traffic jams, serious pollution and continued environmental degradation [23]. Maintaining a balance between population growth, development, resources and the ecological environment is crucial for developing the BTH region [22,24]. The coordinated development of BTH is a national strategy that requires breakthroughs in key fields such as ecological and environmental protection. Between 2016 and 2020, China must resolve certain key issues, including eco-environmental protection, optimal land use planning, biological diversity protection, ecological security and ecological spatial continuity [25].
Numerous studies and investigations have been performed to develop methods of analysing and assessing ecological networks [26,27,28,29,30,31,32]. These methods mainly include empirical approaches based on field surveys, full mechanical approaches based on population viability analysis models, and statistical approaches based on landscape indexes [33]. However, these methods are non-standardized and difficult to validate, and these uncertainties reduce the suitability of these methods for the analysis of landscapes with serious fragmentation. Therefore, Verboom et al. proposed a hybrid method employing spatial standards representing a combination of landscape indexes based on ecological scale extrapolation, landscape aggregation, and key plaques [34]. This method combined a Geographic Information System (GIS) method with population activity simulation results and empirical analysis survey data for the Netherlands [5].
Recently, least-cost modelling has been applied to estimate the connectivity of landscape matrices [35,36,37,38] to provide support for ecological network planning and decision-making. Ferretti and Pomarico identified potential ecological networks and supported spatial planning by integrating GIS with multi-criteria analyses [28]. McHugh and Thompson proposed an ecological network assessment methodology that was used to locate habitat extension areas and changing landscapes [31]. Furthermore, complex landscapes have been simplified and systematized, connectivity has been improved, and guided urban planning for biodiversity conservation has been implemented using an ecological network based on graph theory and the gravity model [39,40]. However, because of the large area of the BTH region, the fragile spatial continuity in ecological land, serious habitat fragmentation, obvious landscape homogenization and strong interference from human activities, considering timeliness, operability, verifiability and economic factors, these methods cannot possibly enable easy analysis of the landscape elements and ecological networks in this region.
The kernel density estimation (KDE) method is based on research of the overall distribution of sample data [41]. The KDE method has been widely used in the analysis and detection of natural disasters and public health and industrial layout hotspots [42,43,44]. Recently, KDE has been used in landscape ecological network analyses based on the spatial distribution of landscape elements and was found to be suitable for analyses at the landscape and regional scales [45,46]. Biondi et al. used the KDE method to train pan-European ecological networks [47].
The major contributions of the present paper pertain to methodological development for analysing ecological networks, and the results are relevant for formulating suggestions for the protection and planning of ecological networks at the regional level. The objectives of this study were to (a) propose a feasible and rapid method for identifying landscape ecological network elements; (b) analyse the spatial configuration of ecological networks using an integrated density index of landscapes; and (c) propose significant suggestions for the protection and planning of ecological networks in the BTH region.

2. Study Area and Data
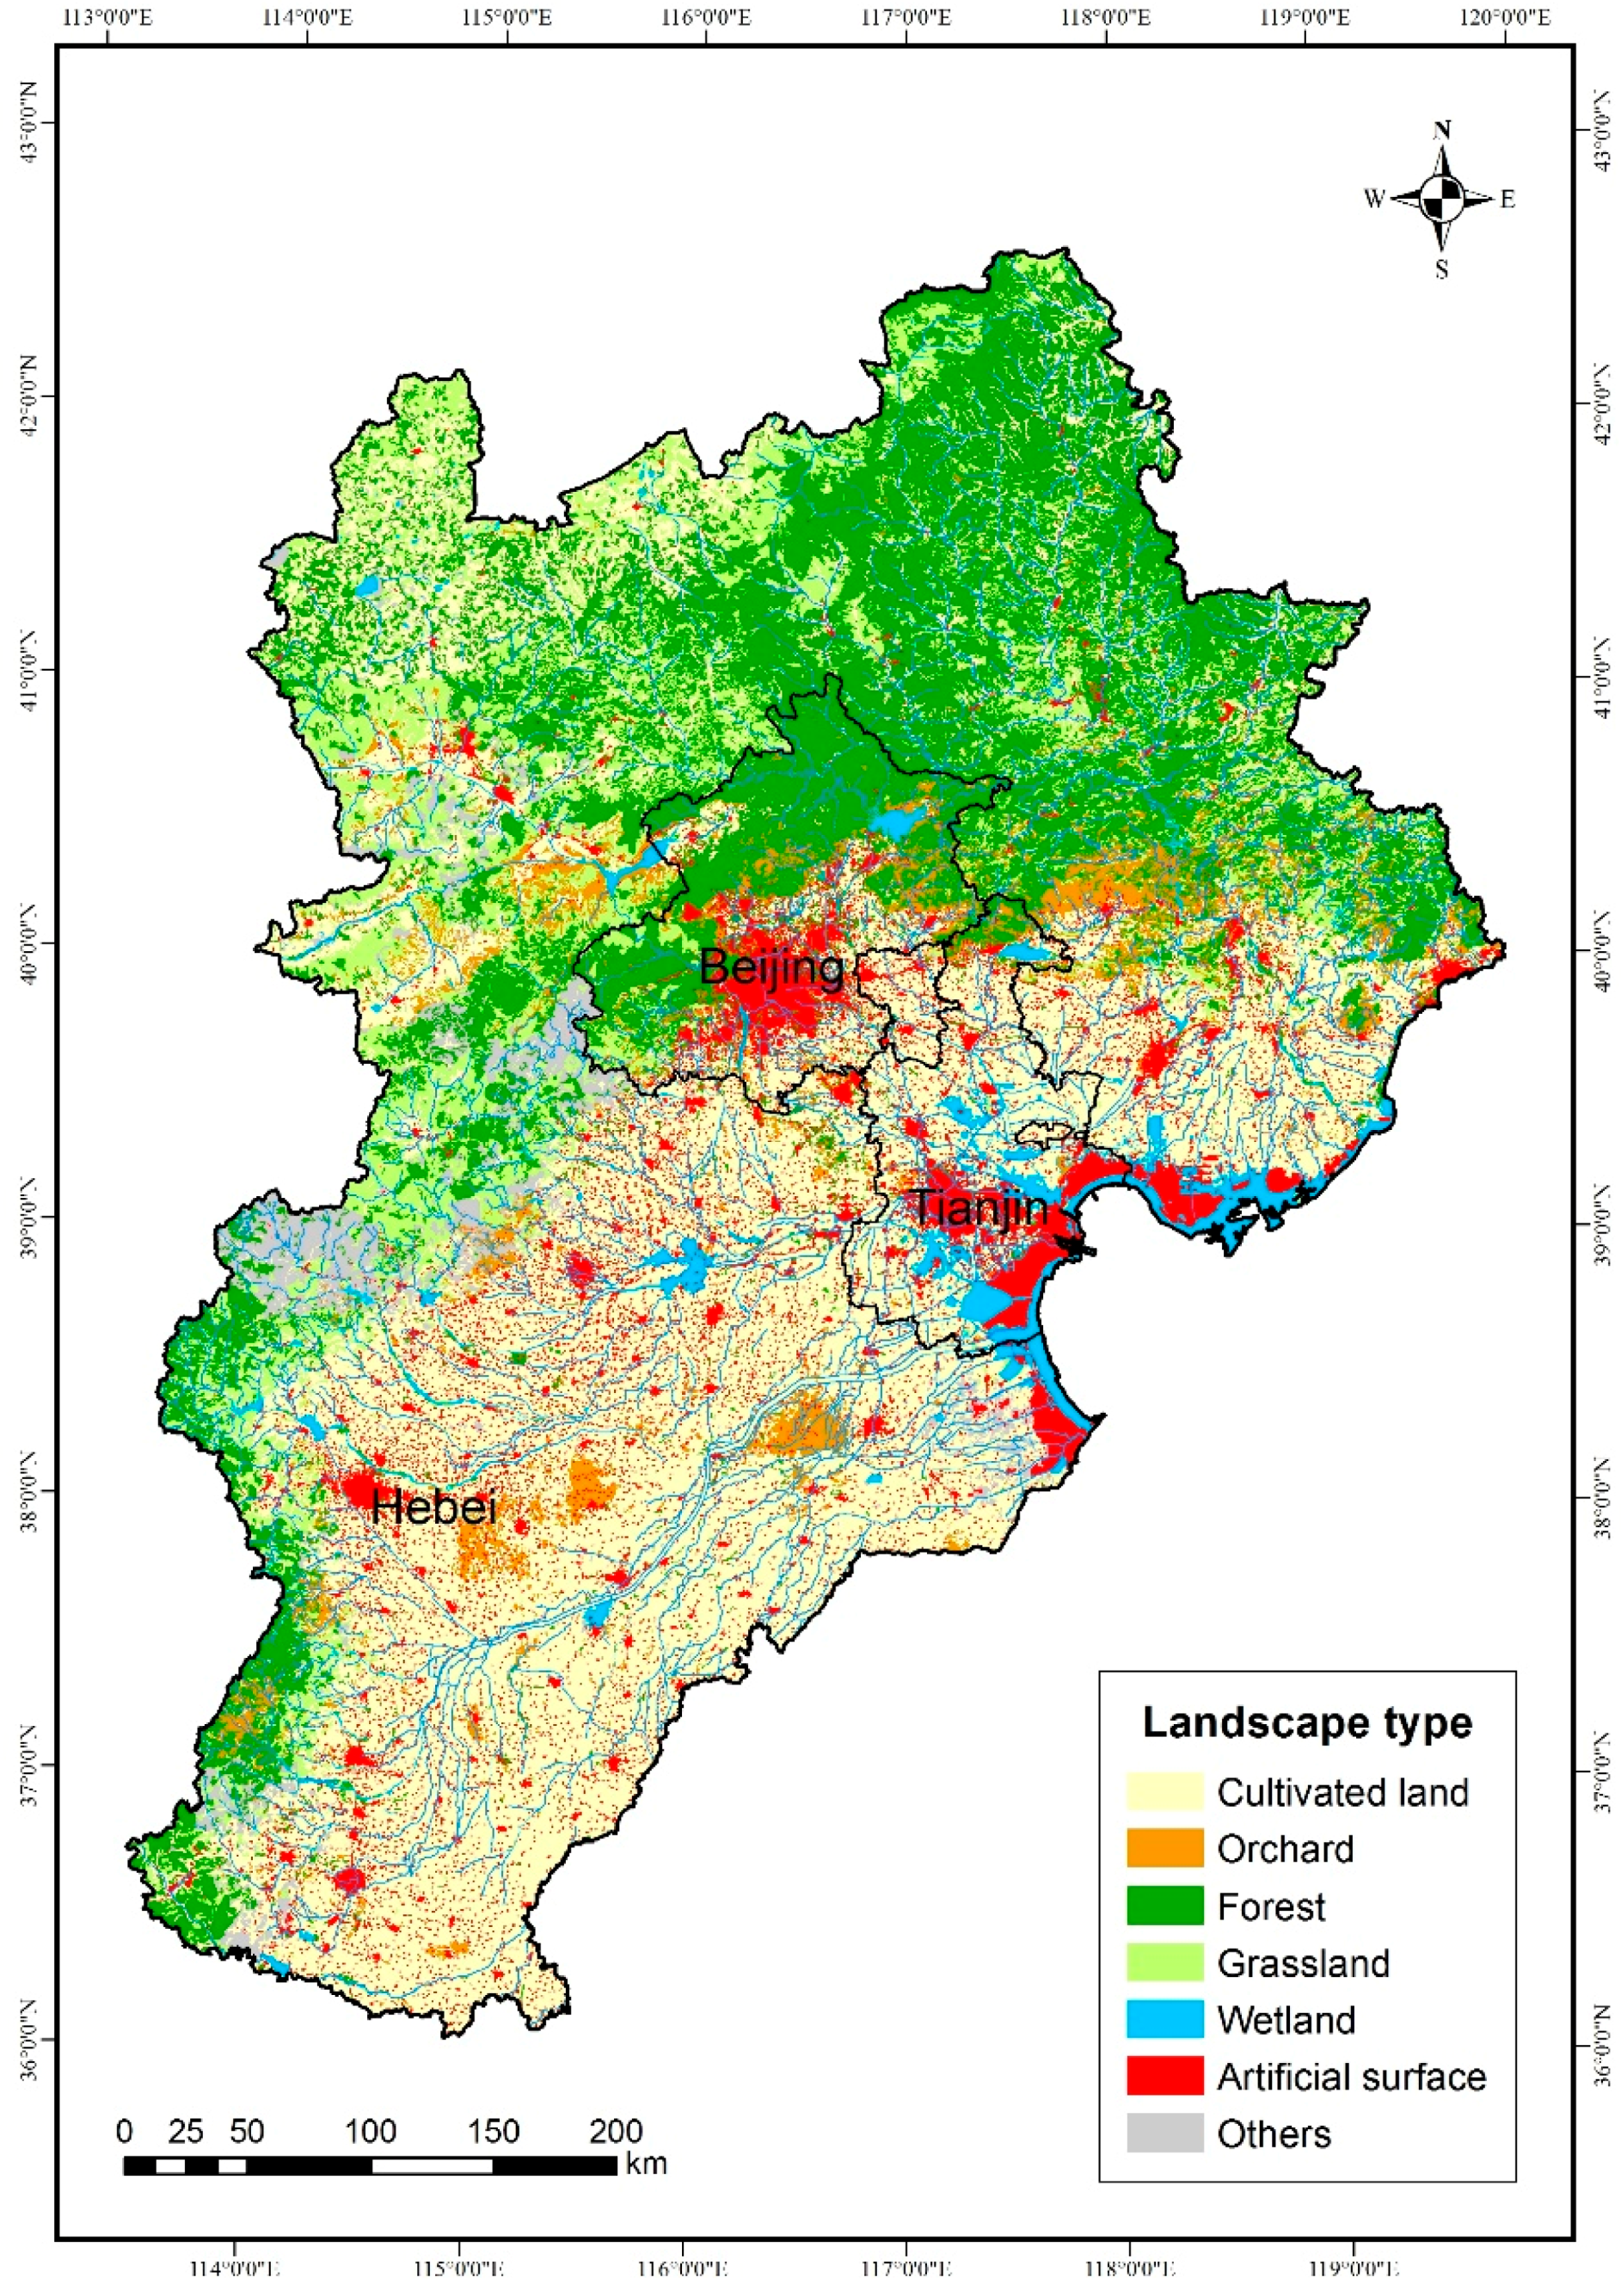
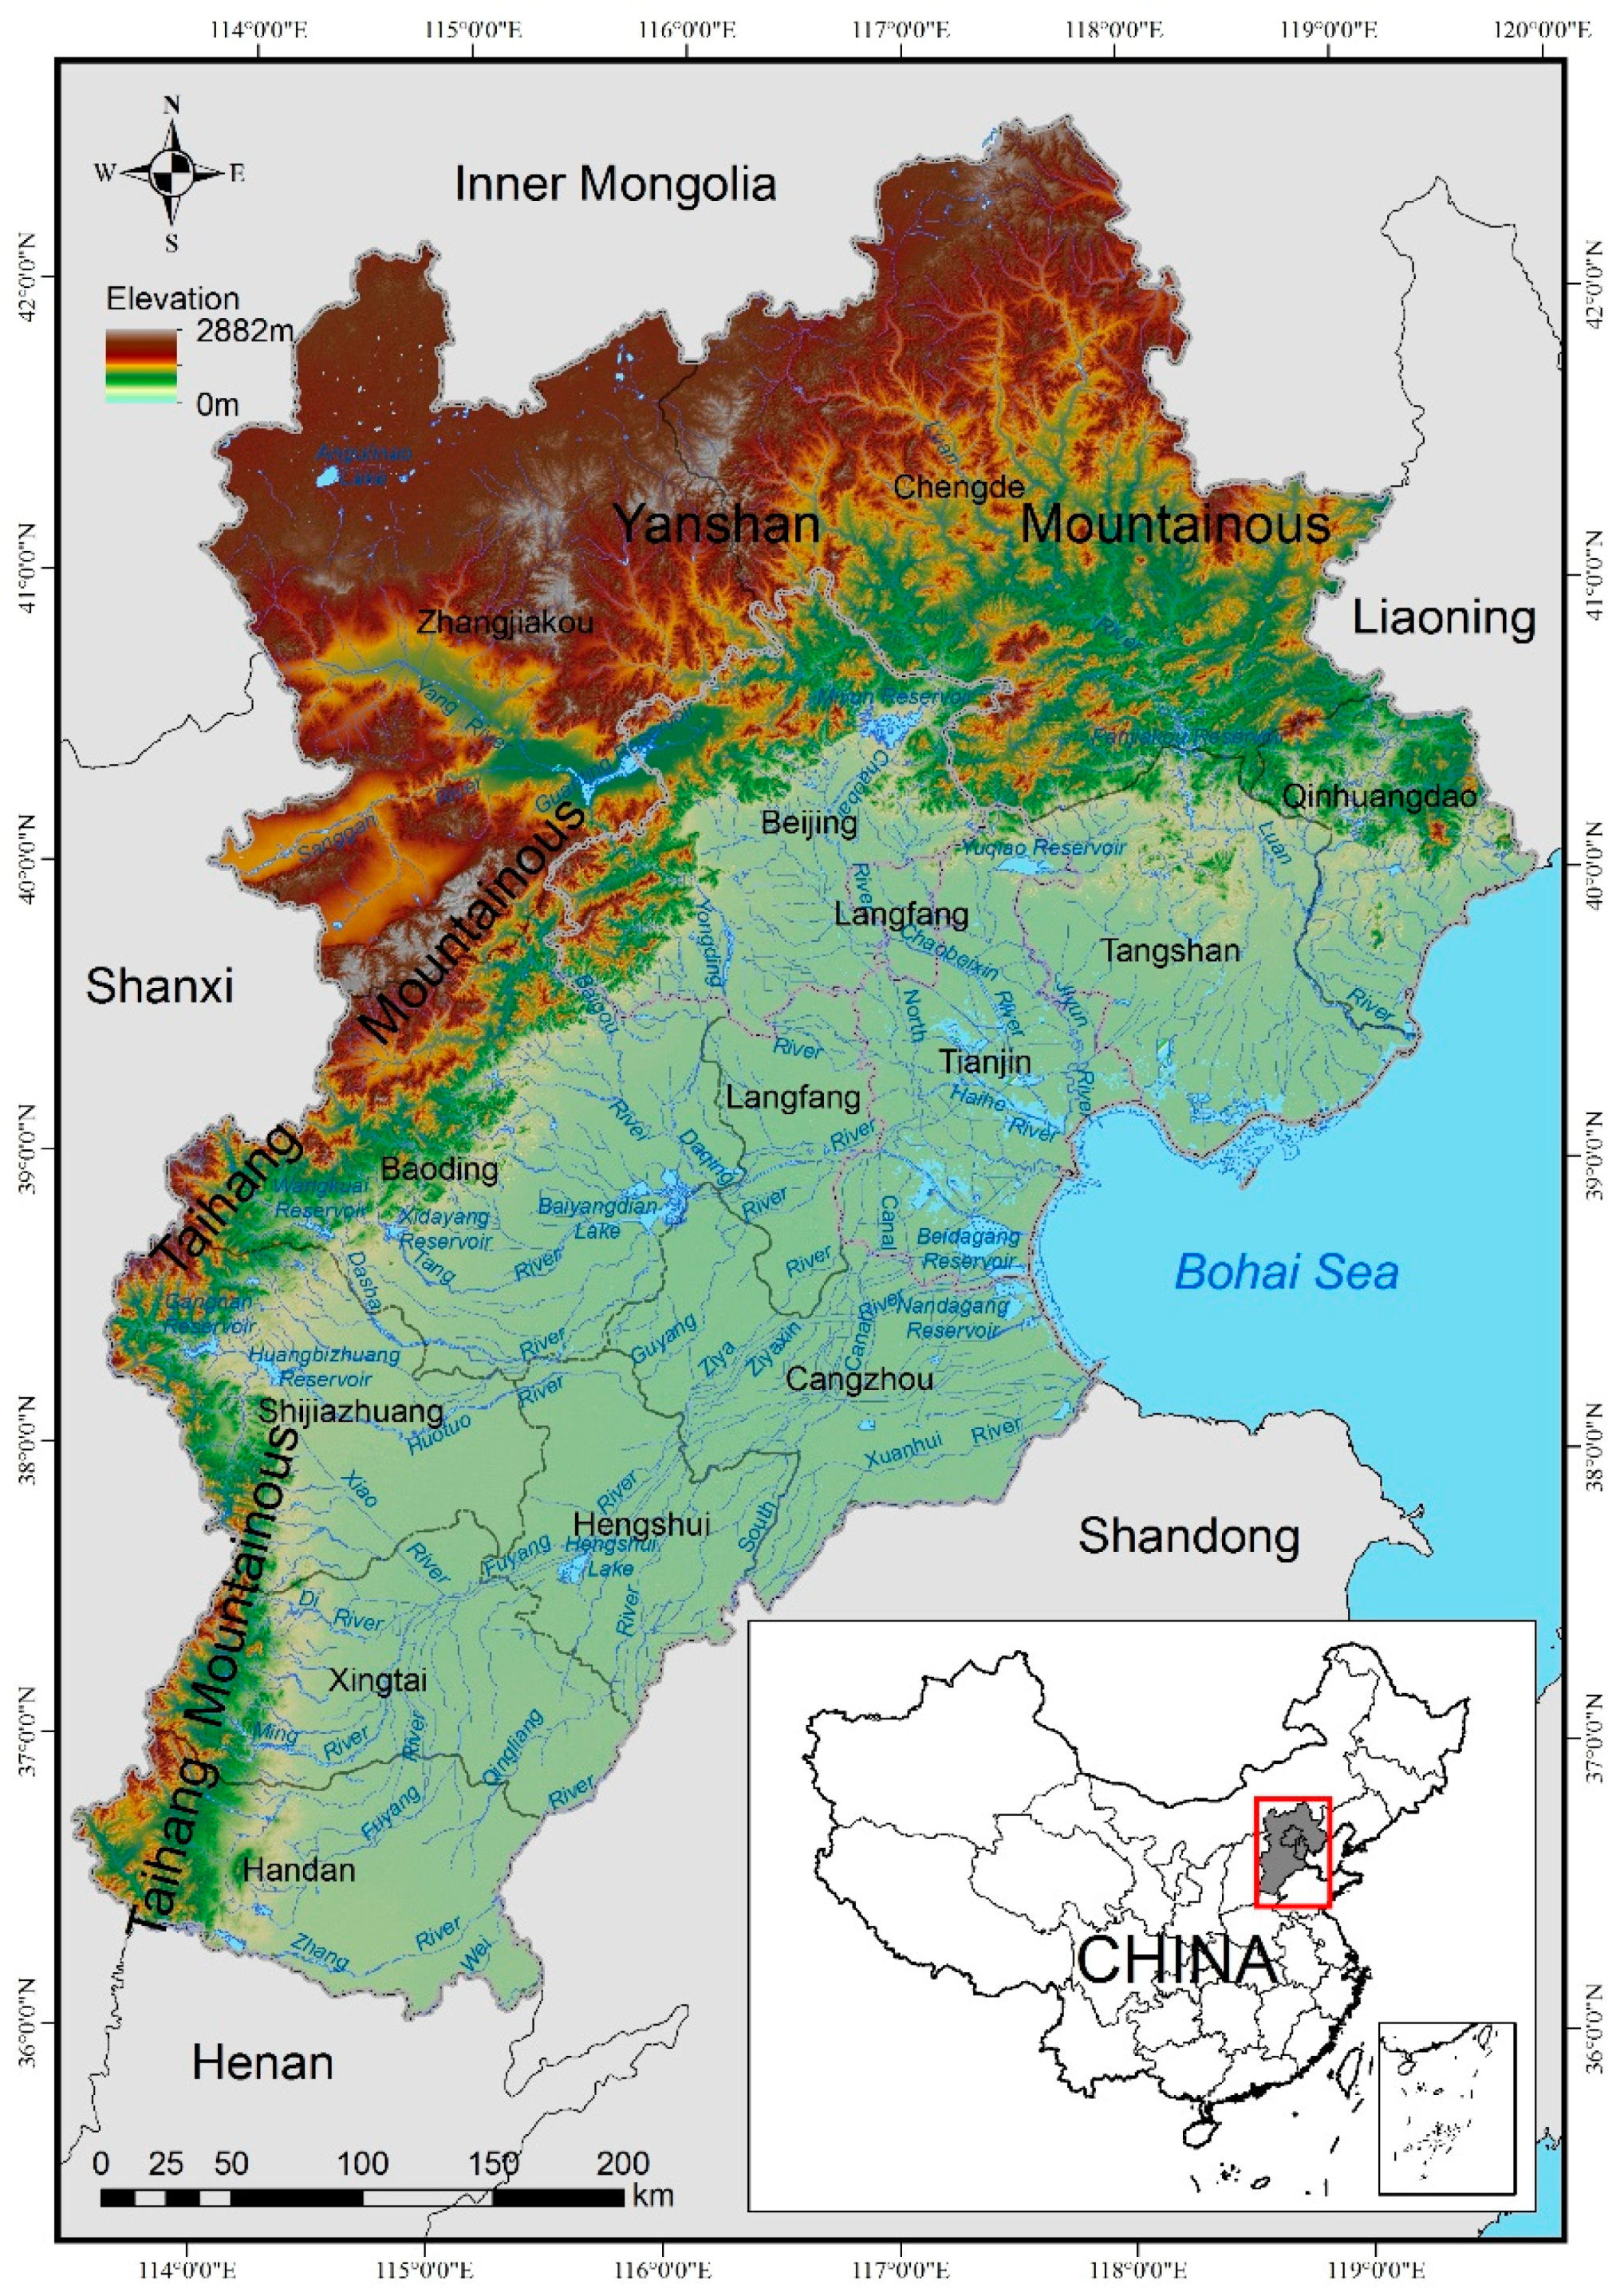
2.1. Study Area

The BTH region includes Beijing City, Tianjin City and Hebei Province and is located in the northern North China Plain between latitudes 36°05′ N and 42°37′ N and longitudes 113°11′ E and 119°45′ E. Figure 1 shows the location and nearby areas of the BTH region. The total area of the region is approximately 0.22 million km2. The terrain declines semi-circularly from the northwest to the southeast. Plateaus, mountains and plains are the main landforms of the region. The total area of northwest plateaus and of mountains and hills accounts for 54% of the entire region. The central and southeast plains account for 46% of the region. The water system in this region contains exterior drainage, including the Haihe River, Luanhe River and Liaohe River, and interior drainage in the Bashang Plateau.
Cultivated land constitutes the main landscape type of the BTH, particularly in the central and southeast plain area. The area of cultivated land is 89,719.48 km2 and accounts for 41% of the region. This landscape type serves as a site of intensive agriculture rather than ecological function. Thus, the ecological function of cultivated land is relatively weak [48,49], and cultivated land is not an object of analysis in this paper. Forests and grasslands are representative natural ecological landscapes in the region and account for 38% of the study area, and they are mainly distributed in the Yanshan Mountains, the Taihang Mountains and the southeast edge of the Inner Mongolia Plateau. Orchards account for 10,512.80 km2 and are mainly distributed in the northern and western foothill areas and inlays in the plains. Wetlands include areas near lakes, reservoirs, marshes and tidal flats and account for only 3% of the total area. Orchards and wetlands are representative of semi-natural landscapes [20,21]. Other landscapes account for 6882.15 km2 and primarily include saline-alkali land, sandy land and bare land. The area of artificial surfaces accounts for 9% of the region. There are significant regional differences in the ecological environments and natural resources of the BTH (Figure 2). In the south-eastern plain area, habitats are rarely continuous and are relatively isolated. High habitat isolation and landscape fragmentation are significant characteristics of the region.

2.2. Data and Pre-Processing
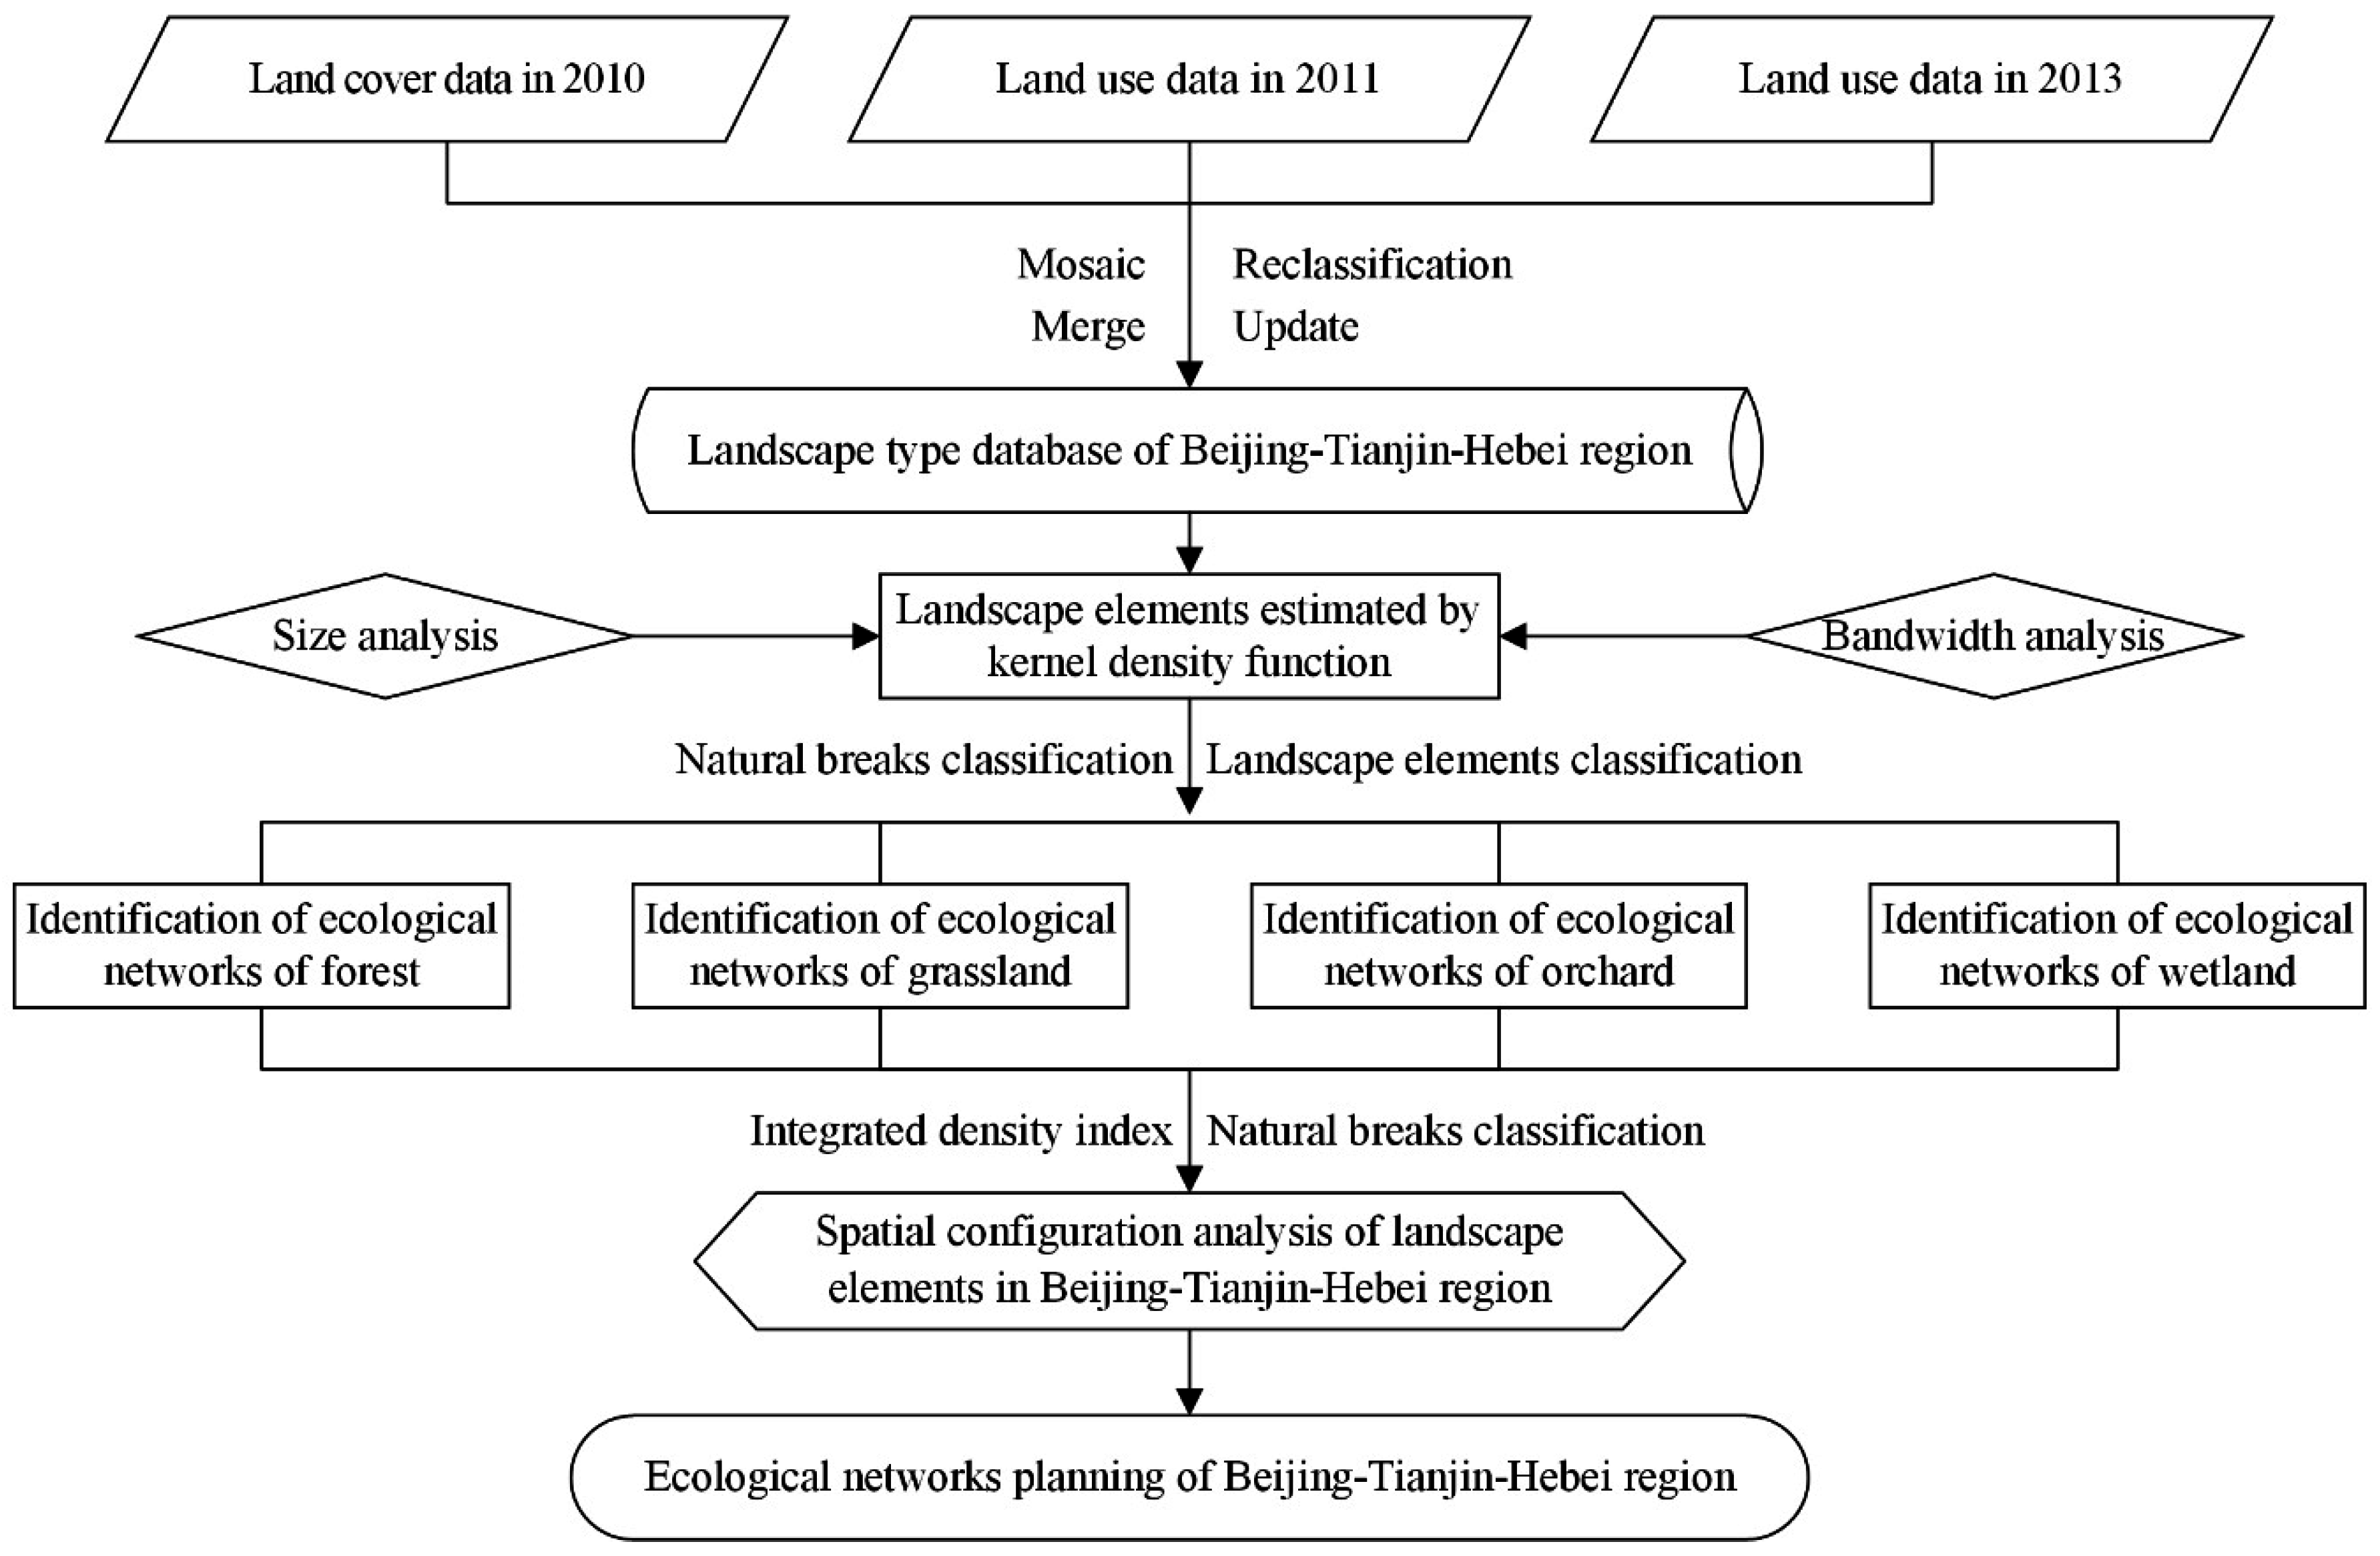
The basic data sets included land cover data, land use data and a digital elevation model (DEM). The 2010 land cover data (resolution 30 m) were obtained from the National Geomatics Centre of China. The provincial land use data for 2011 and 2013 at a 1:500,000 scale were obtained from the Key Laboratory for Agricultural Land Quality Monitoring and Control. The DEM dataset (resolution 30 m) was provided by Geospatial Data Cloud site, Computer Network Information Centre, Chinese Academy of Sciences. The road data and the population density data for 2010 were obtained from the National Science & Technology Infrastructure of China, National Earth System Science Data Sharing Infrastructure.
To improve the accuracy of the data, the data were pre-processed as follows. First, the 2010 land cover data (land cover types contain cultivated land, forest, shrub land, grassland, wetland, water bodies, artificial surface, and bare land) were mosaicked and clipped by the study region polygon. Second, the 2011 land use data (land use types including cultivated land, forest land, grassland, garden plot, water area, construction land, and other land) were intersected and merged with the 2010 land cover data using the Analysis Tools in ArcGIS 10.2 (ESRI, Redlands, CA, USA). Finally, the land use map was updated by the 2013 land use data (the type is the same as in 2011). The land use data were reclassified as cultivated land, orchard, forest, grassland, wetland, artificial surface, and others, and the landscape type database of the BTH was produced (Figure 2).

3. Methods

The density of landscape reflects the spatial aggregation degree of habitats. To identify the landscape elements and analyse the spatial configuration of the ecological networks, forests, grasslands, orchards and wetlands were selected from the landscape type database of the BTH region. The density of landscapes was calculated using the KDE method. The KDE results were divided into five levels by the natural break classification method. The landscapes with high density were regarded as core habitats, the landscapes with medium-high density were regarded as buffer habitats, the landscapes with medium density were regarded as ecological corridors, the landscapes with medium-low density were regarded as stepping stones, and the landscapes with low density were regarded as isolated elements. Then, the landscape elements of the ecological network were identified to analyse their spatial characteristics in the region.
The integrated density index (Landscape Density Index, LDI) was calculated by overlaying the above four landscape density maps and was applied to divide different ecological areas by the natural breaks method. The core area, buffer zone, corridor, and isolated area made up the spatial configuration of the ecological networks. Then, the characteristics of the spatial configuration were analysed by overlaying the current landscape, topography, road density and population density data. Finally, several suggestions for the protection and planning of ecological networks were made based on the results of the above analysis (Figure 3).

3.1. KDE Method

The density of forests, grasslands, orchards and wetlands was calculated using the KDE method. The KDE method was based on each sampling point i(x, y). The density contribution of each sampling point was calculated using kernel functions at each grid cell centre in the range of a specified radius (usually equal to the bandwidth h). Within the search radius range, sampling points that were closer to the grid cell centre had a higher density contribution value. The density at each point was calculated by adding the values of all kernel surfaces to obtain a cumulative density surface for all points. Thus, the densities were used in a continuous manner to create surfaces covering the entire study area [47]. The KDE function was applied to calculate the raster data of the landscapes in the study area [50]. The algorithm is presented in Formula (1).
f ^ ( x , y ) = 3 n h 2 π i = 1 n { 1 [ ( x x i ) 2 + ( y y i ) 2 h ] 2 } 2
In the formula, f ^ ( x , y ) represents the density contribution value of the estimated grid cell centre; h represents the bandwidth; n represents the number of sampling points within the range of bandwidth h; (xi, yi) represents the coordinates of the sampling point; i(x, y) represents the values of the estimated grid cell centre; and ( x x i ) 2 + ( y y i ) 2 represents the Euclidean distance between the sampling point i and the estimated grid cell centre. In the formula, the size of the raster data and the bandwidth of the kernel density function are the most important parameters.

3.1.1. Grid Size

In the KDE method, vector data must be converted to raster data. The results and the speed of the KDE calculation are affected by the raster size. The area difference between the vector data and raster data is the standard used to choose the grid size. The area differences obtained at 30 m × 30 m, 50 m × 50 m, 100 m × 100 m, 200 m × 200 m, 500 m × 500 m and 1000 m × 1000 m) were analysed, and 100 m × 100 m was chosen to perform KDE because it had the smallest area difference.

3.1.2. Bandwidth

In the KDE method, as the bandwidth h decreases, the density of each estimation point changes unevenly. As the bandwidth increases, the change in spatial point density becomes smoother, and the density structure is filtered [51]. To determine the influence of the search radius, SR = 2x was used to search the bandwidth h. Using different values of x (e.g., 0, 1, 2, 3, …), different experimental results were calculated using Formula (2) as follows:
S R = 0.9 × min ( S D , 1 ln ( 2 ) × D m ) × n 0.2
SR is the search radius, which is also the bandwidth h; SD is the standard distance; Dm is the median distance; and n is the number of points.

3.2. Integrated Density Index

The LDI is an equally weighted index in which the contributions of each landscape type to the entire area are considered. The LDI was applied to perform spatial overlay analyses of the KDE results of landscape elements. The calculation formula is presented in Formula (3).
L D I = i = 1 N D i
LDI is the integrated density index; Di is the kernel density value of a certain landscape; and N is the number of landscape types.

3.3. Natural Breaks Classification

In the natural breaks classification method, the statistical characteristics of the data distribution are the principal parameters. The summary of the variances was calculated, and to identify certain groups of breakpoints that produced the minimum sum of squares of the deviations, different breakpoints in the data set were iterated [52]. The data set was classified by analysing the break points in the data and aggregating the values. By comparing the sum of variances, the rationality of different classifications was determined [53]. The calculation formula is presented in Formula (4).
S S D i j = k = i j ( A k M e a n i j ) 2
SSDij is the sum of squares of the deviations; A is an array; N is the number of values in the array; Ak is the value of number k in the array; and 1 ≤ ijN, Meanij is the average of Ai to Aj.

4. Results

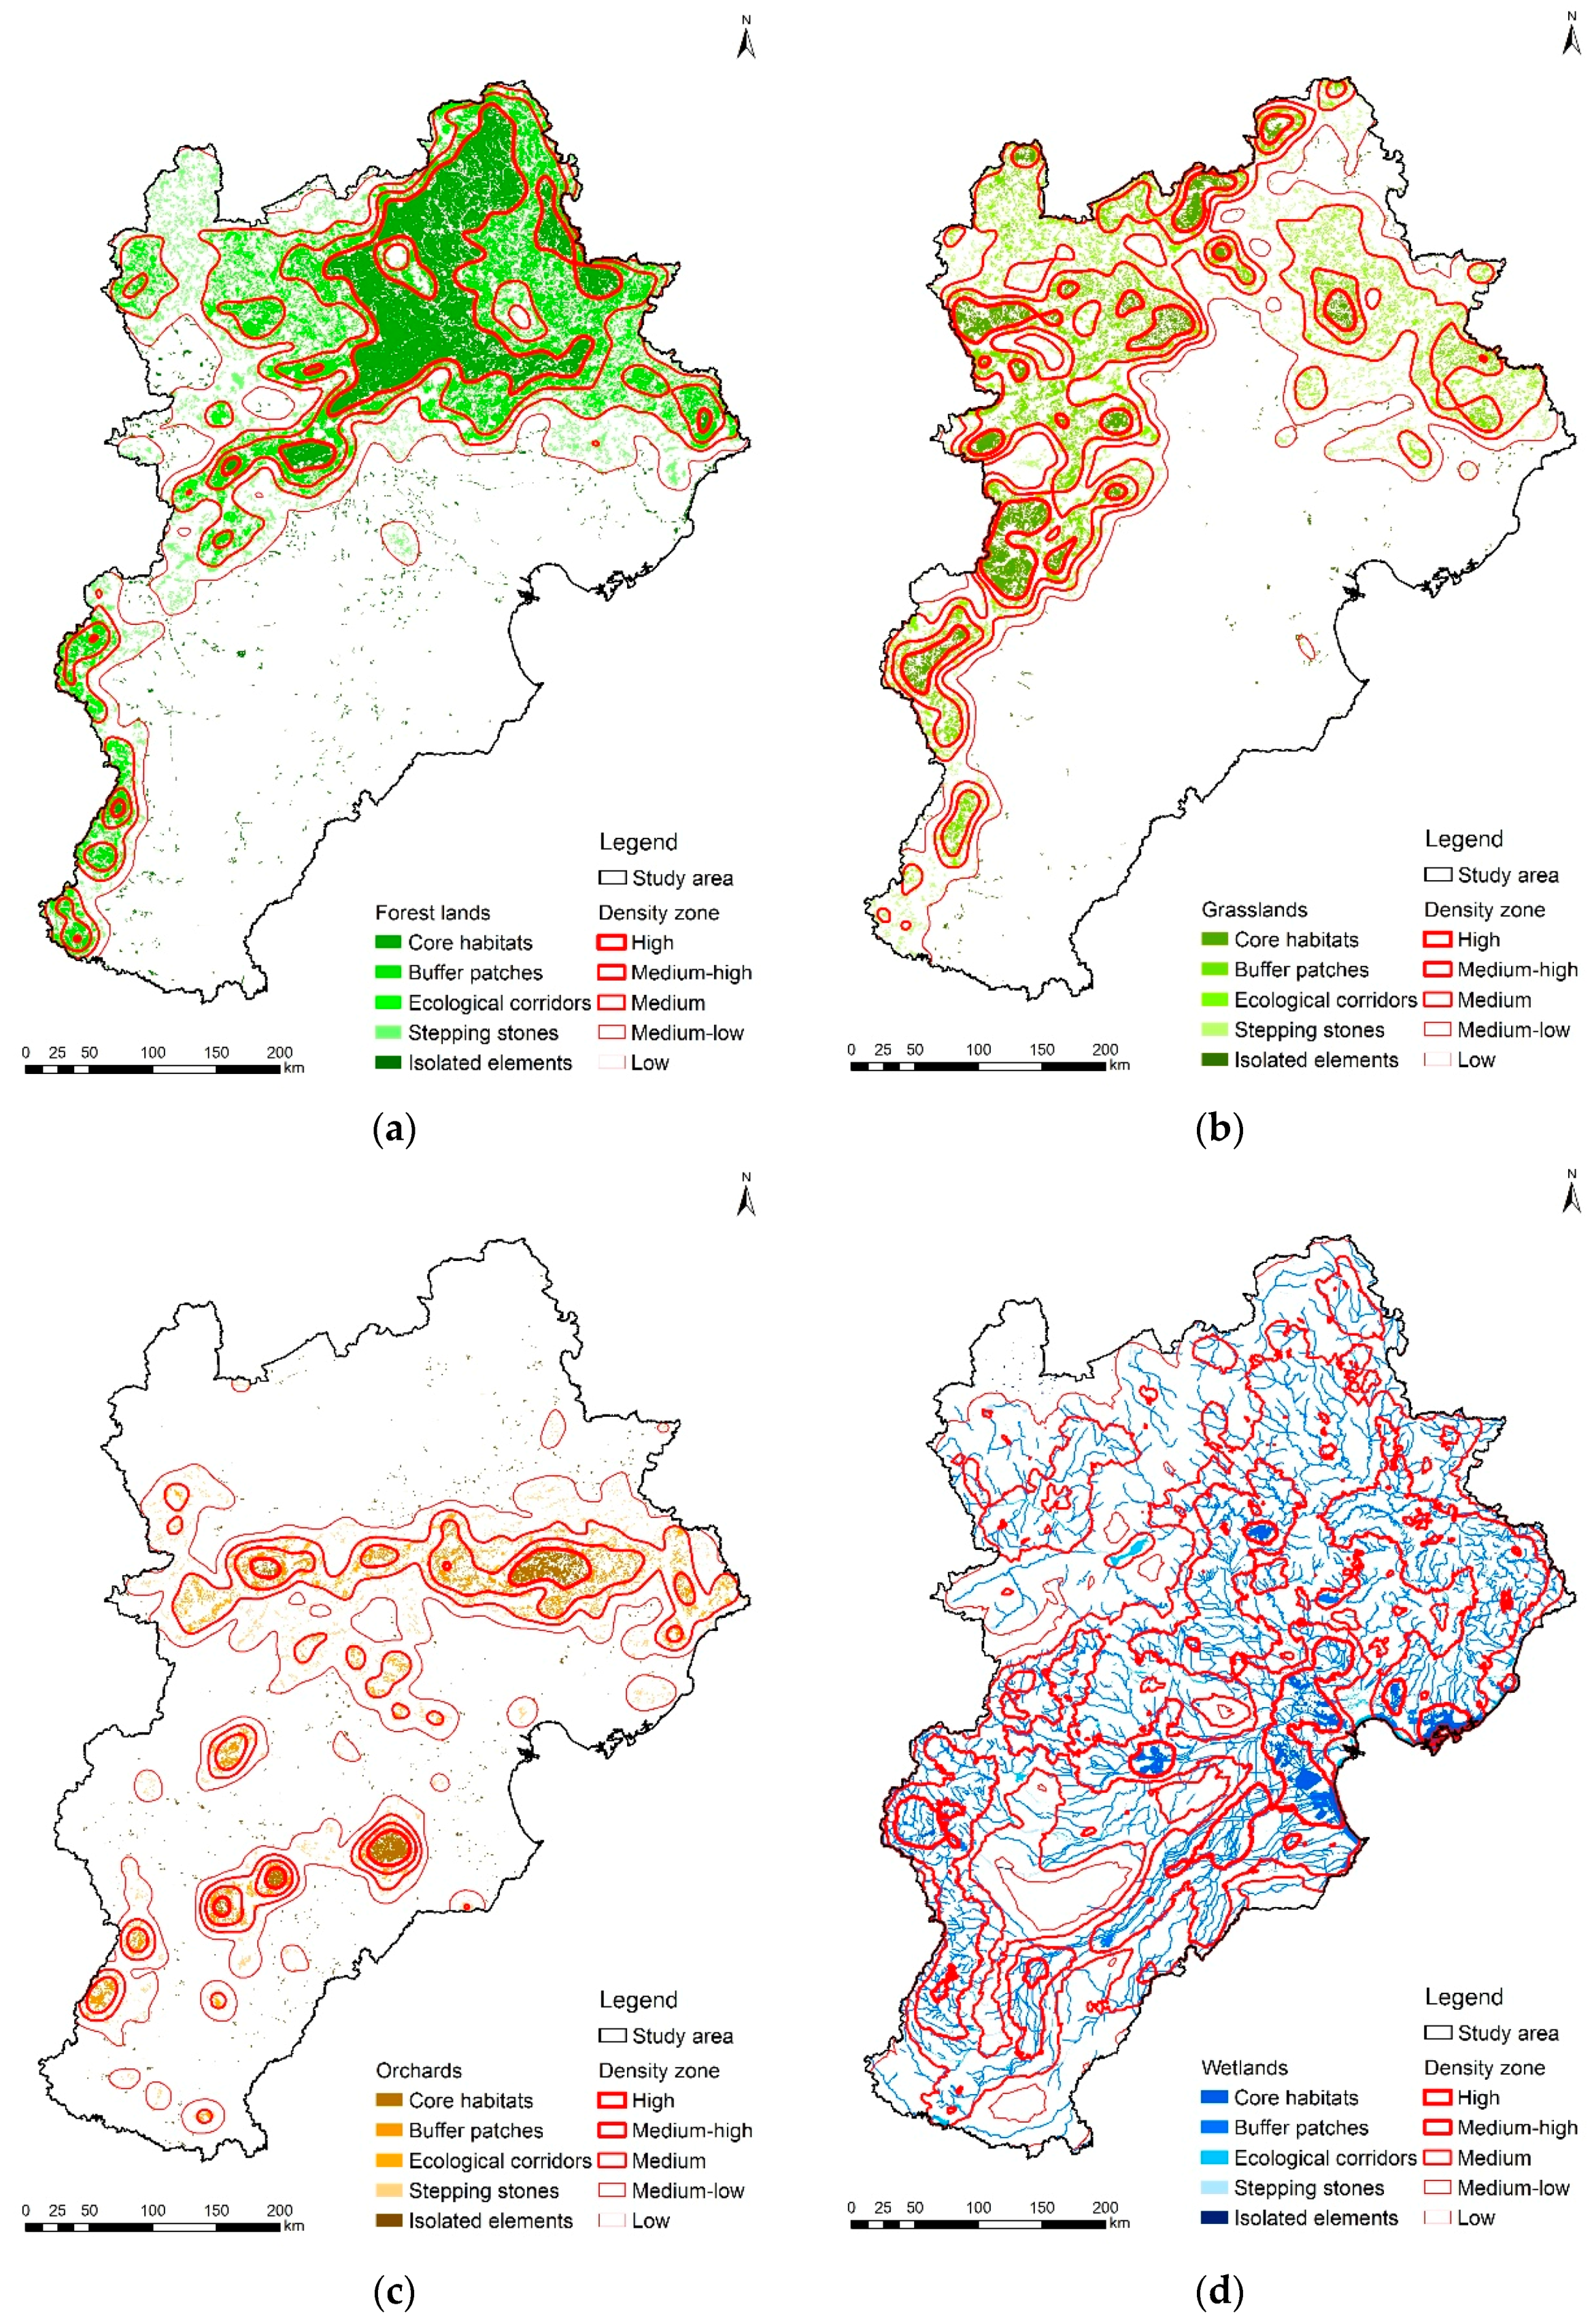
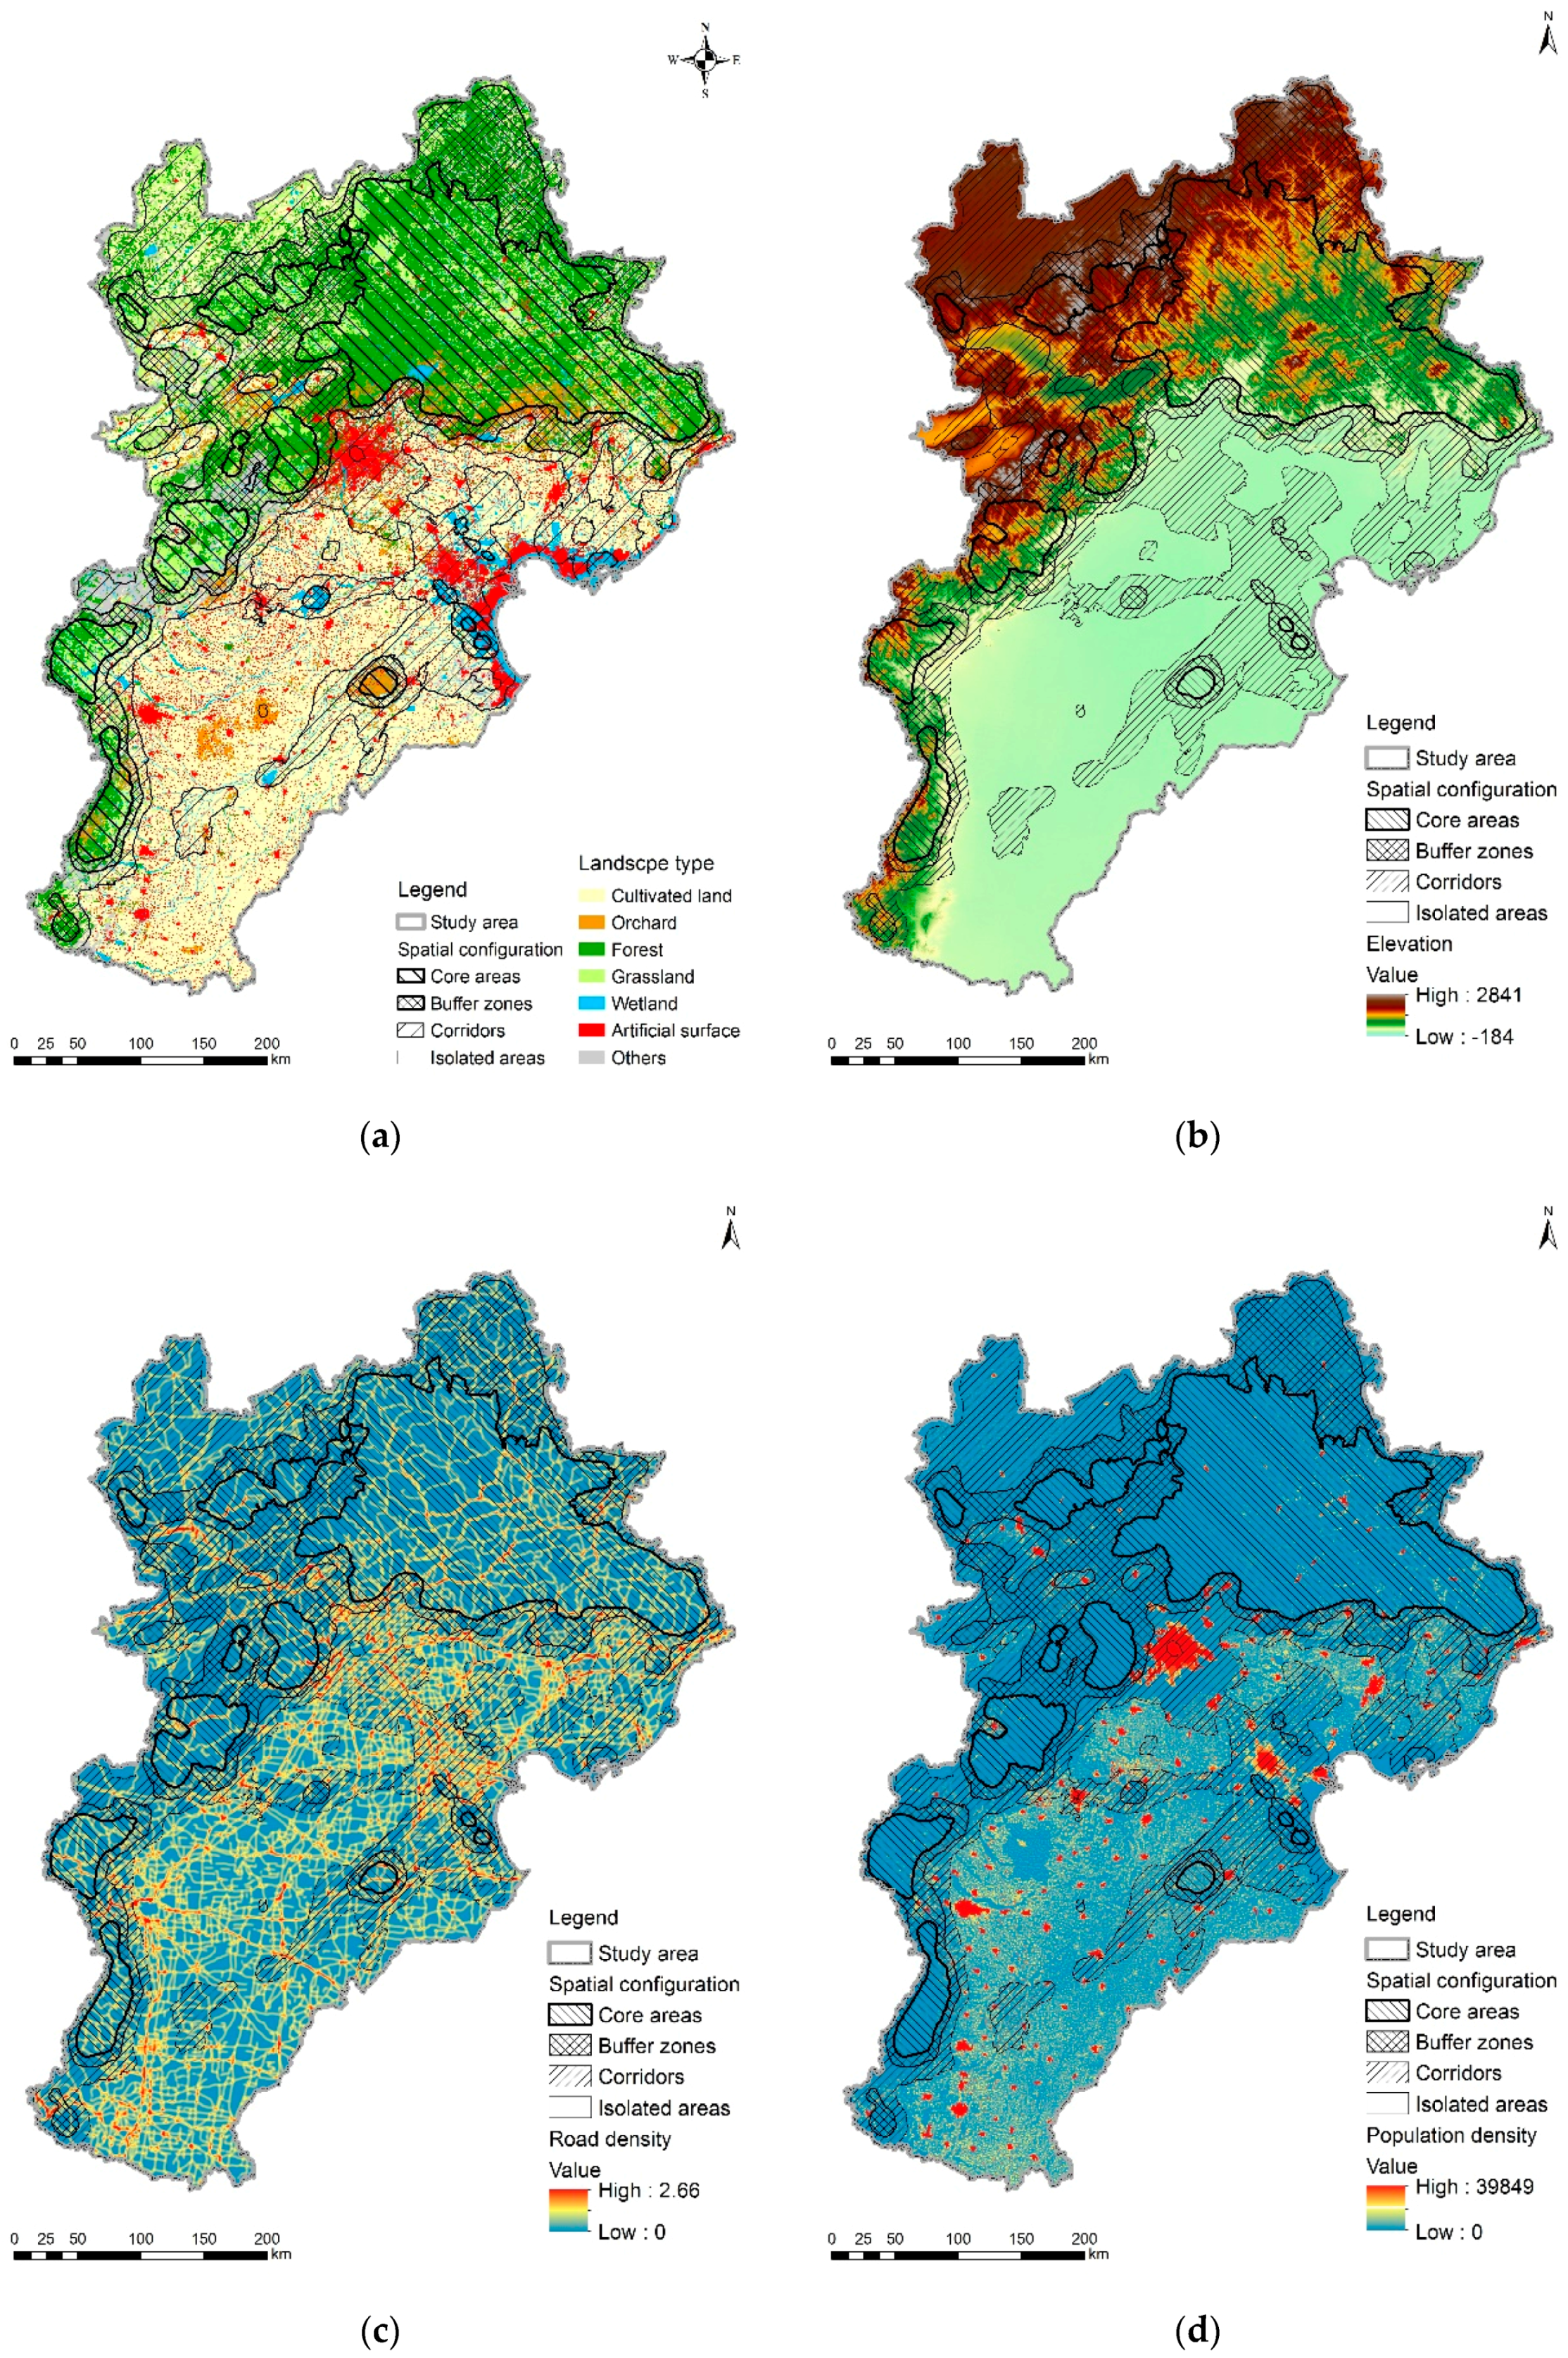
4.1. Identification of Ecological Network Elements in the BTH Region

The KDE results for forest, grassland, orchard, and wetland landscapes are presented in Table 1 and Figure 4.
As noted in Table 1 and Figure 4, the forest type supports the entire ecological network in the BTH region, especially in the core habitats and buffer patches, and provides connectivity among the ecological corridors. The KDE results for forest were 0–95.75 points/km2, which was divided into high-density (69.85–95.75 points/km2), medium high-density (49.95–69.84 points/km2), medium-density (29.30–49.94 points/km2), medium low-density (9.77–29.29 points/km2) and low-density (0–9.76 points/km2) values by the natural breaks classification. As shown in Figure 4a, higher forest kernel density values and better landscape spatial continuity can be found in the northern Yanshan Mountains. The ecological networks in the Taihang Mountains are not continuous. In the western and south-western areas, the small range of core habitats and buffer patches leads to an obvious break in ecological corridors. The smallest density values and isolated forest patches were scattered in the southern plain area.
Throughout the entire ecological network, grasslands act as a buffer zone to protect the ecological networks from potentially damaging external influences and thus can essentially be characterized as transitional areas. The grasslands are transition areas of core habitats of forests and grasslands. As ecological corridors, grasslands connect the different landscapes. The KDE values of grassland were 0–73.97 points/km2 and divided into high-density (42.65–73.97 points/km2), medium high-density (28.73–42.64 points/km2), medium-density (16.83–28.72 points/km2), medium-low density (5.81–16.82 points/km2) and low-density (0–5.80 points/km2) values. As shown in Figure 4b, the medium- to high-density areas are mostly distributed in the north-western plateau and mountain basin. The proportion of core habitats is relatively small and includes only 1/5 of the grassland landscape area. Obvious fragmentation occurred in the ecological corridors in the western mountains. In the northern mountains, the dispersed grassland functions are inlaid patches. Only 2.41% of the isolated grassland patches are scattered in the south-eastern area, which accounts for over half of the area.
Orchards provide buffer patches and stepping stones for the ecosystem and play an important role in the ecological networks in the BTH region. The KDE values of the orchard landscape were 0–77.72 points/km2 and were divided into high-density (39.94–77.72 points/km2), medium high-density (22.26–39.93 points/km2), medium-density (10.68–22.25 points/km2), medium low-density (3.06–10.67 points/km2) and low-density (0–3.05 points/km2) values. As shown in Figure 4c, lower concentrated continuity occurs from the medium- to high-density areas. A banded landscape forms from east to west in the southern edge of the northern foothills. Orchard landscapes are present as isolated islands in the southern area and are rarely connected to each other. Approximately 2/3 of the research area is a low-density zone with few orchard inlays.
Wetlands, including lakes, reservoirs, marshes and tidal flats, are important ecological resources for the BTH region, and rivers, canals and major drains are the most important ecological corridors. The wetland landscape connects the entire ecological network in the region. The KDE values of the wetland were 0–71.56 points/km2 and were divided into high-density (35.93–71.56 points/km2), medium high-density (24.42–35.92 points/km2), medium-density (15.16–24.41 points/km2), medium low-density (5.34–15.15 points/km2) and low-density (0–5.33 points/km2) values. As shown in Figure 4d, the medium- to high-density area is mainly distributed in the main stream, the main tributaries of the Haihe River, the Luanhe River Basin and the Taihang Mountains. The medium- to high-density areas of planar wetland landscapes are mainly distributed in the coastal beach area of Bohai Bay, Baiyangdian Lake, and Hengshui Lake and reservoirs such as Miyun, Guanting, Yuqiao, Nandagang, Erwangzhuang and Gangnan. The wetland density is lower in the central and southern plain area and north-western inflow area.

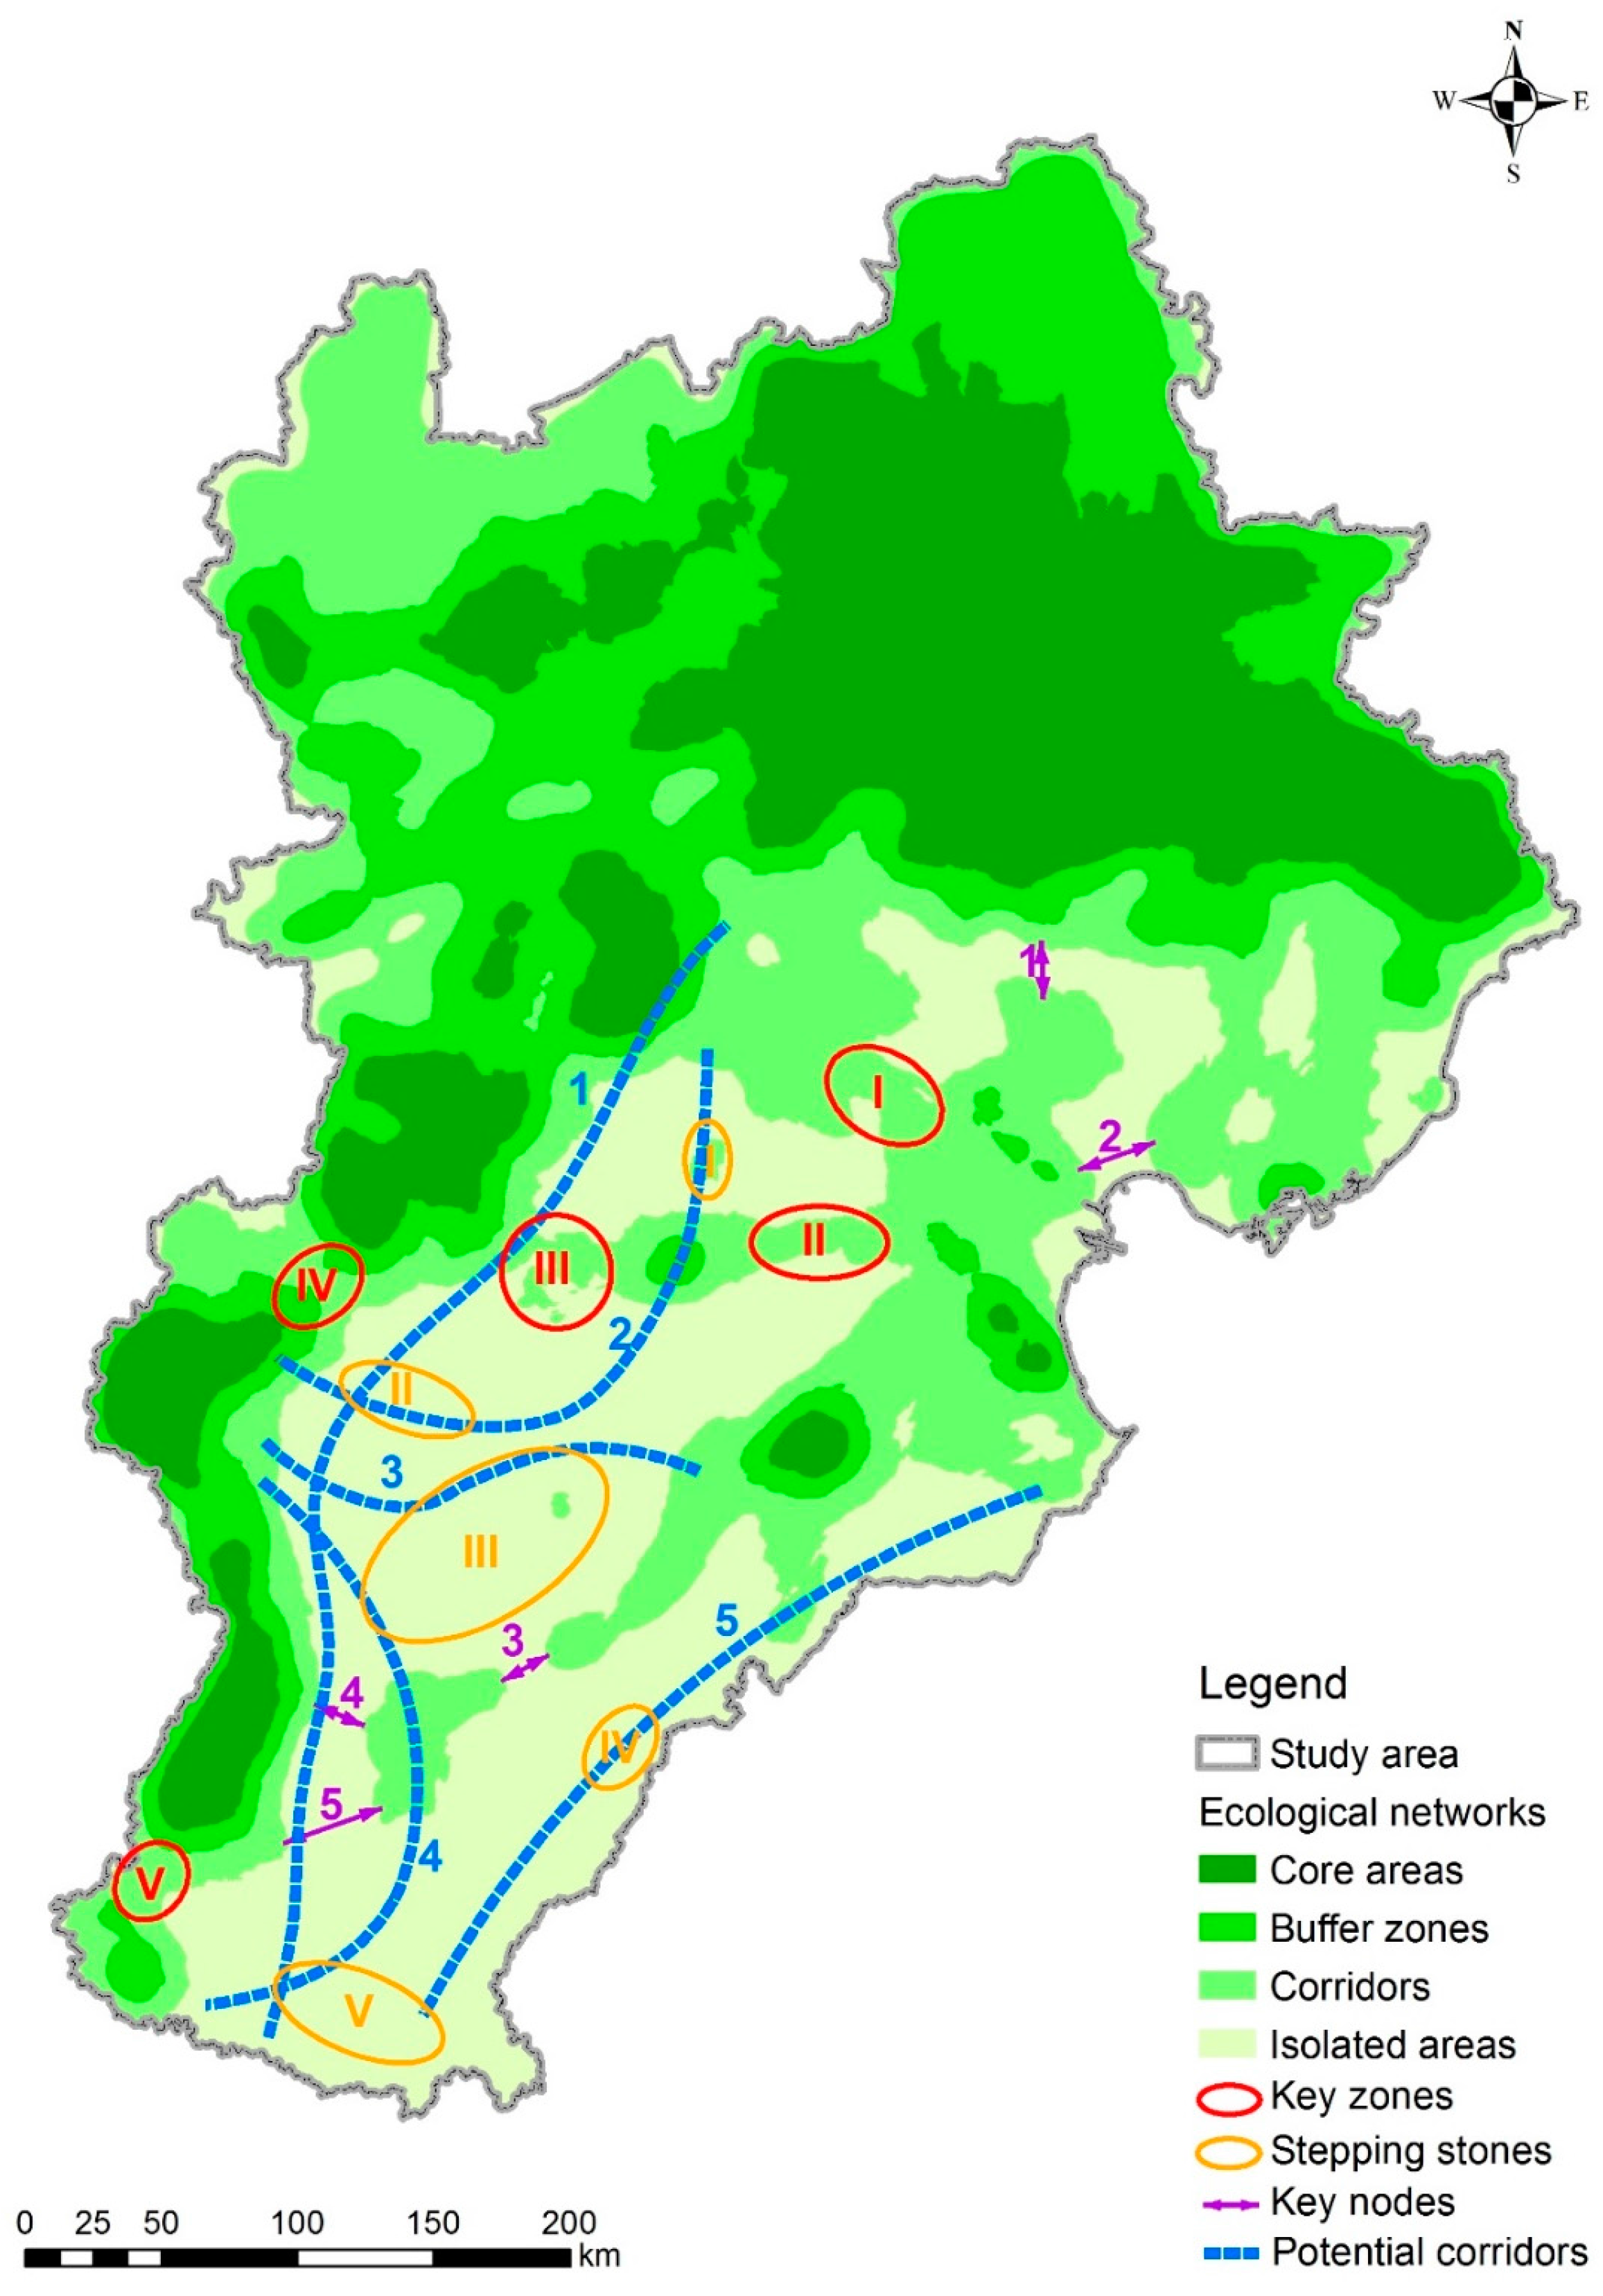
4.2. Spatial Configuration Analysis of the Ecological Networks in the BTH Region

The KDE results of the landscape elements were applied to perform the spatial overlay analysis and calculate the integrated density index (LDI). The LDI was applied to divide different landscape ecological networks using natural break classifications. The LDI values of the core areas, buffer zones, corridors, and isolated areas were 23.61–36.47, 16.89–23.60, 10.17–16.88, and 0–10.16, respectively. The spatial configurations of the landscape elements were compared with the current landscape type data (Figure 2) to obtain the final ecological networks (Figure 5). The spatial configurations of the ecological networks and the spatial distributions of the landscape types were combined to obtain the statistical data for the different landscapes (Table 2).
As shown in Figure 5a, the core area of ecological networks in the BTH region is 50,149.68 km2, and the area of buffer zones is 45,107.05 km2. The core areas and buffer zones mainly include forest and grassland and represent the most important ecological network nodes and ecological sources in this region. These areas also support the basic ecological functions of the ecological networks and should be the focus of protection schemes and ecological restoration. The continuous protection and restoration of core habitat patches is important for protecting the regional ecological environment and conserving biodiversity.
Ecological corridors provide the connections between different landscapes and represent the main banded landscape elements. Ecological corridors account for 59,566.07 km2 in the BTH region and connect isolated core habitat patches to function as passages between the landscape elements of the south-eastern, western and northern BTH regions, especially linear corridors (mainly rivers) and stepping stones patches (mainly orchards). However, more than half of the ecological corridors in this region are occupied by cultivated land and construction land, and human activities significantly interfere with these ecological elements.
Isolated elements are mostly distributed in the central and south-eastern plain areas and account for 62,149.71 km2. In addition, 75% of the isolated areas are cultivated land. Forest land and grassland are rare in the central and south-eastern plain areas and are isolated from each other, which produce serious island effects in the region. Rivers are the most important linear landscape element and orchards are the most important temporary habitat in this region. However, numerous canals have been built, and the groundwater has been mined in the south-eastern plain area because water resources are needed for major grain production activities. The rivers have been hardened because of human activities, which have weakened their ecological functions [54]. Artificial surfaces, such as roads, are constantly introduced into the ecosystem [55], which results in serious problems of ecological isolation and landscape fragmentation.
Data on road density, population density and topography were used to characterize the landscape elements of the region. Topography is an important factor for evaluating habitat quality on a regional scale. Terrain factors have a significant impact on the distribution of ecological value. As shown in Figure 5b, the spatial configuration of ecological networks presents obvious distribution characteristics according to the topography. The key topographical regions are distributed in the mountains and constitute the core habitats and buffer zones. Corridors connect not only broken mountain habitat but also landscape elements from the plateau and mountain to the plain area below 200 m.
Unfortunately, as one of fastest growing regions of China, the BTH region features a large number of corridors and landscape elements that have been greatly disturbed by human activities. As shown in the road density (Figure 5c) and population density (Figure 5d) maps, the ecological system is becoming more isolated. This isolation is attributed to road network dispersal, urban expansion and population growth, which have exacerbated habitat fragmentation and weakened the landscape connectivity. In particular, the urban infrastructure has expanded so rapidly that the ecological network has become more discontinuous. However, green space systems and linear infrastructure schemes that support ecological projects, such as roadside trees, farmland shelterbelts and canal protection zones, have been established in urban areas and represent important components of artificial ecological networks. Therefore, the protection of ecological networks is even more important in this region.

4.3. Suggestions for the Protection of Ecological Networks

Suggestions for the protection of core areas, buffer zones, ecological corridors and isolated elements are made according to the spatial characteristics of the landscapes by analysing the spatial configuration of the ecological networks in the BTH region. The specific suggestions are presented in Table 3.
Areas with weak connections are distinguished as key zones and fault areas as key nodes according to the spatial characteristics of the core areas, buffer zones and ecological corridors. Figure 2, Figure 4 and Figure 5 can be compared to identify temporary habitats (stepping stones) and potential corridors in the isolated areas. The key zones, stepping stones, key nodes and corridors were marked on the planning map. The spatial configurations of the ecological networks were overlaid on the landscape type data to confirm the actualities and existing infrastructure in these areas. The map was then modified based on the suggestions for ecological network planning and improved through field surveys (Figure 6).
As shown in Figure 6, a greenbelt between Beijing and Tianjin will be built by implementing the Key zone I plan, which will connect the urban green systems and provide a corridor between the Beijing Western Mountain ecosystem and Tianjin Binghai New District ecosystem. The Key zone II and Key zone III plans will enhance the urban green systems of Baoding City by constructing ecological farmland that will connect the northern Taihang Mountain ecosystem with the downstream ecosystem of Haihe River through the Baiyangdian Lake ecosystem. The ecosystem of the upper basin of the Dasha River and Qingzhang River will be restored by implementing the Key zone IV and Key zone V plans, which will guarantee the integrity and continuity of the Taihang Mountain ecosystem.
Implementing Key node 1 and Key node 2 will include the construction of green nodes between the northern mountains and the plain area and between the Tianjin Binhai New District ecosystem and Bohai Bay. A green node will be built between the Fuyang River and Hengshui Lake ecosystems by implementing Key node 3. Implementing Key node 4 and Key node 5 will provide for the construction of new green nodes between the southern Taihang Mountain and Fuyang River ecosystems.
A new green corridor consisting of the Baigou River and Dasha River will be constructed as part of Stepping stone I, Stepping stone II and Potential corridor 2. This corridor will connect the north-western mountains and central plain areas via the Baiyangdian Lake ecosystem. Implementing Stepping stone III and Potential corridor 3 will provide for the construction of ecological corridors along the Hutuo River and Ziya River, which will effectively connect the western Taihang Mountains with the eastern plain through the central plain. The Stepping stone III, Stepping stone V and Potential corridor 4 plans provide for the construction of green corridors along the Jiao River and Fuyang River and effectively connect the southern Taihang Mountains with the south-eastern plain. The Stepping stone IV, Stepping stone V and Potential corridor 5 plans will effectively connect the Qingliang River, Zhang River, Wei River and the South Canal south-eastern plain areas with the wetland ecosystem of the Tianjin Binhai New District. Furthermore, implementing the Potential corridor 1 plan will provide for the construction of the South-North Water Transfer Project, which will form a parallel ecological corridor with the Taihang Mountains and support local landscapes.

5. Discussion

KDE analyses of ecological networks reflect the degree of spatial aggregation of the ecosystem and can rapidly identify the main elements of the network on a regional scale. The advantages of applying this method include the effective and rapid identification of landscape elements and an intuitive visual representation of the spatial distribution of these elements. The KDE results provide a statistical representation of an ecosystem and summarize the basic conditions required to increase the feasibility and viability of ecological network protection programmes.
Before using KDE to identify landscape elements, the polygon vector feature should be converted to a point raster feature. Additional points will increase the accuracy of the results but reduce the computational efficiency, whereas reducing the points could result in a loss of information while improving the operational speed. Therefore, a balance is required between data accuracy and computational efficiency. In this paper, the method used to determine the granularity of the data involves a comparison of the area differences for different grid sizes using raster data. This method is simple and effective, although the number and spatial pattern of the types of landscape are not consistent. The method of determining the grid size should be further studied.
Bandwidth has a great influence on the estimation of f ^ ( x , y ) . If h is too small, then the probability density distribution will be limited to the observed data, which will result in a false peak in the estimated density function. If h is too large, then the density estimates will result in probability density contributions that are too far apart, and important characteristics of f ^ ( x , y ) will be smoothed. When using the kernel density to estimate an ecological network, the effect of bandwidth on the results is significant; thus, determining the optimal bandwidth was an important consideration in this paper. In the field of mathematics, the Mean Integrated Square Error (MISE) and the Integrated Error Square (ISE) are commonly used to measure deviations and determine optimal bandwidths [56,57]. The h value used in this paper is defined as the standard distance and the median distance. The results of the KDE were obtained by setting different bandwidths and then performing a comparison, and the results obtained from the improved search radius (Formula (2)) more clearly reflected the spatial characteristics of the landscape elements.
Setting correct threshold values has a significant impact on ecological network planning, and the KDE results and LDI classification of the forest, grassland, orchard and wetland areas were based on the natural breaks method. The results clearly showed the spatial characteristics of the different landscape elements, and the natural breaks method was superior to the LDI classification for the KDE of single landscape elements. As shown in Figure 4 and Figure 5, the spatial configuration of single elements was more clear and complete, and the landscape connectivity increased. A comprehensive ecological network was obtained after using the natural breaks method to divide the LDI in the plain area, where fragmentation is obvious. The differences in the spatial distribution and density of landscape elements are mainly responsible for the increased accuracy of the results. In the spatial overlay analysis, dominant landscapes were enhanced under the equally weighted LDI values. In the future, a method that adjusts the weights and includes expert advice and regional land use planning should be developed to optimize ecological networks.
The KDE results identified the landscape elements and spatial configurations of the ecological networks. The core area, buffer zone and ecological corridor were classified based on the density level. However, the habitat quality, patch size, corridor connectedness and landscape connectivity of the ecological networks were not analysed in depth. The road density and population density maps were used to characterize the spatial configurations of the ecological networks to facilitate the interpretation of the KDE results. Although the environmental gradients and pressures were obtained, the depth of the analyses was not sufficient. The strategies proposed in this paper are macro and strategic, whereas the planning of ecological networks is conceptual and prospective. Suggestions for the protection of ecological networks must be combined with local land use planning (county level) in future implementation. The results of the analyses demonstrated that cultivated land is the main landscape in the corridor and isolated areas. Although cultivated land was not an object of analysis in this paper, the construction of ecological networks in agricultural landscapes is particularly important.

6. Conclusions

Methods were proposed for analysing the spatial configurations of ecological networks at the regional level, which can be very effective for the protection and planning of ecological networks.
Based on the spatial distribution characteristics of the landscapes, the basic ecological habitats are formed by forest and grassland. Orchards have transition effects. Isolated orchard patches also function as stepping stones for biological networks. Wetland landscapes are the most important ecological corridors and nodes for this region because these areas provide connections between different landscapes.
Based on the identification of landscape elements, the spatial configurations of the ecological networks in the BTH region were also analysed. Forest and grassland account for the majority of core areas and buffer zones in the ecological network. Rivers, as linear patches, and orchards, as stepping stones, form the main body of the ecological corridors. Isolated elements are mainly scattered across plain areas. Biological isolation and landscape fragmentation are more serious because of artificial surfaces.
Based on the spatial configuration characteristics of the ecological network, landscape planning was proposed for the BTH region. Suggestions for the planning of ecological networks for this region were presented based on the regional landscape spatial distribution characteristics. Five key zones and five stepping stones were planned using the current forests or orchards as basic elements. Five key nodes and five potential corridors were planned using river ecosystems as the linear body. After the establishment of key zones, stepping stones, key nodes and corridors, connections between the northern mountains, western mountains and south-eastern plains were established. An entire ecological network was formed that includes core areas and buffer zones as the primary constituents of the eco-environment and greenbelts and stepping stones as the ecological corridor.

Acknowledgments

This research was supported by The Chinese Ministry of Land and Resources Public Welfare Industry Special Scientific Research (201511010-06). Thanks for research assistance for Hongshuo Wang, Ebeydulla Rahman, Huaizhi Tang and Lingling Sang. The insightful and constructive comments of the anonymous reviewers are appreciated.

Author Contributions

Pengshan Li designed the study and participated in all phases. Yahui Lv helped on GIS data analysis and preprocessing. Chao Zhang also wrote the paper with the contribution to the direction of the idea, and made detailed revisions. Wenju Yun, Jianyu Yang and Dehai Zhu provided guidance and improving suggestions. All authors gave their approval of the version submitted for publication.

Conflicts of Interest

The authors declare no conflict of interest.

References

  1. Bakker, M.M.; Opdam, P.F.M.; Jongman, R.H.G.; Brink, A.V.D. Model explorations of ecological network performance under conditions of global change. Landsc. Ecol. 2015, 30, 763–770. [Google Scholar] [CrossRef]
  2. Gaaff, A.; Reinhard, S. Incorporating the value of ecological networks into cost–benefit analysis to improve spatially explicit land-use planning. Ecol. Econ. 2012, 73, 66–74. [Google Scholar] [CrossRef]
  3. Jongman, R.H.G. Homogenisation and fragmentation of the European landscape: Ecological consequences and solutions. Landsc. Urban Plan. 2002, 58, 211–221. [Google Scholar] [CrossRef]
  4. Opdam, P.; Steingröver, E.; Rooij, S.V. Ecological networks: A spatial concept for multi-actor planning of sustainable landscapes. Landsc. Urban Plan. 2006, 75, 322–332. [Google Scholar] [CrossRef]
  5. Jongman, R.H.G.; Pungetti, G.P. Ecological Networks and Greenways: Concept, Design, Implementation; Cambridge University Press: Cambridge, UK, 2004. [Google Scholar]
  6. Mossman, H.L.; Panter, C.J.; Dolman, P.M. Modelling biodiversity distribution in agricultural landscapes to support ecological network planning. Landsc. Urban Plan. 2015, 141, 59–67. [Google Scholar] [CrossRef] [Green Version]
  7. De Montis, A.; Caschili, S.; Mulas, M.; Modica, G.; Ganciu, A.; Bardi, A.; Ledda, A.; Dessena, L.; Laudari, L.; Fichera, C.R. Urban–rural ecological networks for landscape planning. Land Use Policy 2016, 50, 312–327. [Google Scholar] [CrossRef]
  8. Damschen, E.I.; Haddad, N.M.; Orrock, J.L.; Tewksbury, J.J.; Levey, D.J. Corridors increase plant species richness at large scales. Science 2006, 313, 1284–1286. [Google Scholar] [CrossRef] [PubMed]
  9. Hagen, M.; Kissling, W.D.; Rasmussen, C.; de Aguiar, M.A.M.; Brown, L.E.; Carstensen, D.W.; Alves-Dos-Santos, I.; Dupont, Y.L.; Edwards, F.K.; Genini, J.; et al. Biodiversity, species interactions and ecological networks in a fragmented world. Adv. Ecol. Res. 2012, 46, 89–210. [Google Scholar]
  10. Gilbert-Norton, L.; Wilson, R.; Stevens, J.R.; Beard, K.H. A meta-analytic review of corridor effectiveness. Conserv. Biol. 2010, 24, 660–668. [Google Scholar] [CrossRef] [PubMed]
  11. Paetkau, D.; Waits, L.P.; Clarkson, P.L.; Craighead, L.; Vyse, E.; Ward, R.; Strobeck, C. Variation in genetic diversity across the range of North American brown bears. Conserv. Biol. 1998, 12, 418–429. [Google Scholar] [CrossRef]
  12. Steiner, F. Landscape ecological urbanism: Origins and trajectories. Landsc. Urban Plan. 2011, 100, 333–337. [Google Scholar] [CrossRef]
  13. Fichera, C.R.; Gianoglio, R.; Laudari, L.; Modica, G. Application, validation and comparison in different geographical contexts of an integrated model for the design of ecological networks. J. Agric. Eng. 2015, 46, 52–61. [Google Scholar] [CrossRef]
  14. Haas, J.; Ban, Y. Urban growth and environmental impacts in Jing-Jin-Ji, the Yangtze River Delta and the Pearl River Delta. Int. J. Appl. Earth Obs. Geoinf. 2014, 30, 42–55. [Google Scholar] [CrossRef]
  15. Li, Y.; Huang, S. Landscape ecological risk responses to land use change in the Luanhe River basin, China. Sustainability 2015, 7, 16631–16652. [Google Scholar] [CrossRef]
  16. Wang, S.J.; Ma, H.; Zhao, Y.B. Exploring the relationship between urbanization and the eco-environment—A case study of Beijing-Tianjin-Hebei region. Ecol. Indic. 2014, 45, 171–183. [Google Scholar] [CrossRef]
  17. Gao, J.; Wei, Y.; Chen, W.; Yenneti, K. Urban land expansion and structural change in the Yangtze River Delta, China. Sustainability 2015, 7, 10281–10307. [Google Scholar] [CrossRef]
  18. Gouldson. Europe’s environment: The dobris assessment. Eur. Environ. 1996, 6, 30. [Google Scholar]
  19. Vimal, R.; Mathevet, R.; Thompson, J.D. The changing landscape of ecological networks. J. Nat. Conserv. 2012, 20, 49–55. [Google Scholar] [CrossRef]
  20. Wen, K.; Zhu, E.J. Annual Report on Beijing-Tianjin-Hebei Metropolitan Region Development; Social Sciences Academic Press: Beijing, China, 2013. [Google Scholar]
  21. Yu, K.J.; Wang, S.S.; Li, D.H. Regional Ecological Security Patterns: The Beijing Case; China Building Industry Press: Beijing, China, 2012. [Google Scholar]
  22. Sun, W.B.; Peng, J. Study on measurement of eco-efficiency of Beijing-Tianjin-Hebei metropolitan region. In Proceedings of the 20th International Conference on Industrial Engineering and Engineering Management, Baotou, China, 17–18 August 2013; Qi, E., Shen, J., Dou, R., Eds.; Springer: Berlin/Heidelberg, Germany, 2013; pp. 159–166. [Google Scholar]
  23. Tang, B.; Hu, Y.; Li, H.; Yang, D.; Liu, J. Research on comprehensive carrying capacity of Beijing-Tianjin-Hebei region based on state-space method. Nat. Hazards 2016, 84, 1–16. [Google Scholar] [CrossRef]
  24. Miao, Y.; Liu, S.; Zheng, Y.; Wang, S.; Chen, B.; Zheng, H.; Zhao, J. Numerical study of the effects of local atmospheric circulations on a pollution event over Beijing-Tianjin-Hebei, China. J. Environ. Sci. 2015, 30, 9–20. [Google Scholar] [CrossRef] [PubMed]
  25. Zhang, L.; Chen, Y.; Men, M.; Hao, X. Assessing method for regional ecological connectivity and its application based on GIS. Trans. Chin. Soc. Agric. Eng. 2014, 30, 218–226. (In Chinese) [Google Scholar]
  26. Bennett, G.; Wit, P. The Development and Application of Ecological Networks. A Review of Proposals, Plans and Programmes; AIDEnvironment: Amsterdam, The Netherlands, 2001. [Google Scholar]
  27. Boitani, L.; Falcucci, A.; Maiorano, L.; Rondinini, C. Ecological networks as conceptual frameworks or operational tools in conservation. Conserv. Biol. 2007, 21, 1414–1422. [Google Scholar] [CrossRef] [PubMed]
  28. Ferretti, V.; Pomarico, S. Ecological land suitability analysis through spatial indicators: An application of the analytic network process technique and ordered weighted average approach. Ecol. Indic. 2013, 34, 507–519. [Google Scholar] [CrossRef]
  29. Jongman, R.H.G. Nature conservation planning in Europe: Developing ecological networks. Landsc. Urban Plan. 1995, 32, 169–183. [Google Scholar] [CrossRef]
  30. Jongman, R.H.G.; Külvik, M.; Kristiansen, I. European ecological networks and greenways. Landsc. Urban Plan. 2004, 68, 305–319. [Google Scholar] [CrossRef]
  31. Mchugh, N.; Thompson, S. A rapid ecological network assessment tool and its use in locating habitat extension areas in a changing landscape. J. Nat. Conserv. 2011, 19, 236–244. [Google Scholar] [CrossRef]
  32. Opdam, P.; Verboom, J.; Pouwels, R. Landscape cohesion: An index for the conservation potential of landscapes for biodiversity. Landsc. Ecol. 2003, 18, 113–126. [Google Scholar] [CrossRef]
  33. Verboom, J.; Pouwels, R. Ecological Functioning of Ecological Networks: A Species Perspective. Ecological Networks and Greenways; Concept, Design, Implementation; Cambridge University Press: Cambridge, UK, 2004. [Google Scholar]
  34. Verboom, J.; Foppen, R.; Chardon, P.; Opdam, P.; Luttikhuizen, P. Introducing the key patch approach for habitat networks with persistent populations: An example for marshland birds. Biol. Conserv. 2001, 100, 89–101. [Google Scholar] [CrossRef]
  35. Adriaensen, F.; Chardon, J.P.; Blust, G.D.; Swinnen, E.; Villalba, S.; Gulinck, H.; Matthysen, E. The application of ‘least-cost’ modelling as a functional landscape model. Landsc. Urban Plan. 2003, 64, 233–247. [Google Scholar] [CrossRef]
  36. Gurrutxaga, M.; Lozano, P.J.; del Barrio, G. GIS-based approach for incorporating the connectivity of ecological networks into regional planning. J. Nat. Conserv. 2010, 18, 318–326. [Google Scholar] [CrossRef]
  37. Ray, N.; Lehmann, A.; Joly, P. Modeling spatial distribution of amphibian populations: A GIS approach based on habitat matrix permeability. Biodivers. Conserv. 2002, 11, 2143–2165. [Google Scholar] [CrossRef]
  38. Szabó, S.; Novák, T.; Elek, Z. Distance models in ecological network management: A case study of patch connectivity in a grassland network. J. Nat. Conserv. 2012, 20, 293–300. [Google Scholar] [CrossRef]
  39. Kong, F.; Yin, H.; Nakagoshi, N.; Zong, Y. Urban green space network development for biodiversity conservation: Identification based on graph theory and gravity modeling. Landsc. Urban Plan. 2010, 95, 16–27. [Google Scholar] [CrossRef]
  40. Liu, G.; Yang, Z.; Chen, B.; Zhang, L.; Zhang, Y.; Su, M. An ecological network perspective in improving reserve design and connectivity: A case study of Wuyishan nature reserve in China. Ecol. Model. 2015, 306, 185–194. [Google Scholar] [CrossRef]
  41. Silverman, B.W. Density Estimation for Statistics and Data Analysis; Chapman and Hall: London, UK, 1986. [Google Scholar]
  42. Kuter, S.; Usul, N.; Kuter, N. Bandwidth determination for kernel density analysis of wildfire events at forest sub-district scale. Ecol. Model. 2011, 222, 3033–3040. [Google Scholar] [CrossRef]
  43. Zhang, X.; Huang, P.; Sun, L.; Wang, Z. Spatial evolution and locational determinants of high-tech industries in Beijing. Chin. Geogr. Sci. 2013, 23, 249–260. [Google Scholar] [CrossRef]
  44. Zhang, Z.M.; Wang, X.Y.; Zhang, Y.; Nan, Z.; Shen, B.G. The over polluted water quality assessment of Weihe River based on kernel density estimation. Procedia Environ. Sci. 2012, 13, 1271–1282. [Google Scholar] [CrossRef]
  45. Bryan, B.A.; King, D.; Ward, J.R. Modelling and mapping agricultural opportunity costs to guide landscape planning for natural resource management. Ecol. Indic. 2011, 11, 199–208. [Google Scholar] [CrossRef]
  46. Vizzari, M.; Sigura, M. Landscape sequences along the urban–rural–natural gradient: A novel geospatial approach for identification and analysis. Landsc. Urban Plan. 2015, 140, 42–55. [Google Scholar] [CrossRef]
  47. Biondi, E.; Casavecchia, S.; Pesaresi, S.; Zivkovic, L. Natura 2000 and the pan-European ecological network: A new methodology for data integration. Biodivers. Conserv. 2012, 21, 1741–1754. [Google Scholar] [CrossRef]
  48. Costanza, R.; d’Arge, R.; de Groot, R.; Farber, S.; Grasso, M.; Hannon, B.; Limburg, K.; Naeem, S.; O’Neill, R.V.; Paruelo, J.; et al. The value of the world’s ecosystem services and natural capital. Nature 1997, 387, 253–260. [Google Scholar] [CrossRef]
  49. Sun, X.; Zhou, H.; Xie, G. Ecological functions and their values in Chinese cropland ecosystem. China Popul. Resour. Environ. 2007, 17, 55–60. [Google Scholar]
  50. Chang, K.T. Introduction to Geographic Information Systems, 8th ed.; McGraw-Hill: New York, NY, USA, 2015. [Google Scholar]
  51. Cai, X.J.; Wu, Z.F.; Cheng, J. Analysis of road network pattern and landscape fragmentation based on kernel density estimation. Chin. J. Ecol. 2012, 31, 158–164. (In Chinese) [Google Scholar]
  52. Jenks, G.F. The data model concept in statistical mapping. In International Yearbook of Cartography; George Philip and Son: London, UK, 1967; Volume 7, pp. 186–190. [Google Scholar]
  53. Slocum, T.A.; McMaster, R.B.; Kessler, F.C.; Howard, H.H. Thematic Cartography and Geovisualization, 3rd ed.; Prentice Hall: Upper Saddle River, NJ, USA, 2009. [Google Scholar]
  54. Beagle, J.R.; Kondolf, G.M.; Adams, R.M.; Marcus, L. Anticipatory management for in stream habitat: Application to Carneros Creek, California. River Res. Appl. 2016, 32, 280–294. [Google Scholar] [CrossRef]
  55. Forman, R.T.T.; Alexander, L.E. Roads and their major ecological effects. Annu. Rev. Ecol. Syst. 1998, 29, 207–231. [Google Scholar] [CrossRef]
  56. Scott, D.W.; Terrell, G.R. Biased and unbiased cross-validation in density estimation. J. Am. Stat. Assoc. 1987, 82, 1131–1146. [Google Scholar] [CrossRef]
  57. Turlach, B.A. Bandwidth Selection in Kernel Density Estimation: A Review. Available online: http://citeseerx.ist.psu.edu/viewdoc/download?doi=10.1.1.44.6770&rep=rep1&type=pdf (accessed on 18 October 2016).
Figure 1. Geographical position of the Beijing-Tianjin-Hebei (BTH) region.
Sustainability 08 01094 g001
Figure 2. Spatial distribution of the main landscapes.
Sustainability 08 01094 g002
Figure 3. Framework of the ecological network analysis and planning for the BTH region.
Sustainability 08 01094 g003
Figure 4. Results of representative landscapes based on kernel density estimations: (a) forests; (b) grasslands; (c) orchards; and (d) wetlands.
Sustainability 08 01094 g004
Figure 5. Spatial configuration of landscape elements in the BTH region was overlaid on data. These data include: (a) landscape type; (b) topography; (c) road density; and (d) population density.
Sustainability 08 01094 g005
Figure 6. Ecological network planning for the BTH region.
Sustainability 08 01094 g006
Table 1. Ecological network elements of representative landscapes.
Landscape TypesCore Habitats (km2)Buffer Patches (km2)Ecological Corridors (km2)Stepping Stones (km2)Isolated Elements (km2)
Forest17,470.9617,891.6212,362.146398.391929.55
Grassland5799.7710,218.117786.993725.76681.30
Orchard1733.273136.862790.822053.36798.38
Wetland2677.231788.161424.82487.4395.67
Table 2. Landscape composition of ecological networks in the BTH region.
Landscape TypesCore Area (km2)Percent (%)Buffer Zone (km2)Percent (%)Corridor (km2)Percent (%)Isolated Area (km2)Percent (%)
Cultivated land3900.6488799.592030,659.655146,359.8375
Orchard3835.2383085.272047.8531544.422
Forest29,013.195818,130.43407365.21121543.832
Grassland11,817.69249843.19225469.1191081.952
Wetland631.4311511.5432758.8359022.6815
Artificial surface458.1111503.6438209.32141579.943
Other493.412233.4653056.151017.062
Summary50,149.6810045,107.0510059,566.0710062,149.71100
LDI23.61–36.4716.89–23.6010.17–16.880–10.16
Table 3. Suggestions for the protection of ecological networks in the BTH region.
Spatial ConfigurationCharacteristicsStrategies
Core areasMainly forest and grassland, rich biological diversity, most important ecological sources and core areasEnhance the restoration of core habitats of the Taihang Mountains, Yanshan Mountains and Bashan Plateau
Buffer zonesSurrounds core areas, important habitats, obvious habitat isolation, insufficient protection and restorationReturn farmland to forest and grazing land to grassland in the mountains and conserve and restore wetlands
CorridorsComplex and diverse landscapes, artificial surfaces, poor spatial continuity, large regional differencesRestrain urban expansion, improve ecological connectivity, plan Beijing-Tianjin green corridors and forest parks around the capital, plan ecological corridors in Haihe River Basin, construct ecological farmland in plain areas
Isolated elementsMainly cultivated land, rare natural habitats, serious fragmentation, wide distribution of river networks, high degree of human interferenceStrengthen land consolidation, use current orchards to form stable artificial stepping stones, construct ecological farmland in plain areas, develop ecological agriculture

