Automatic Type Recognition and Mapping of Global Tropical Cyclone Disaster Chains (TDC)
Abstract
:1. Introduction
2. Materials and Methods
2.1. Basic Ideas and Overall Design
- (1)
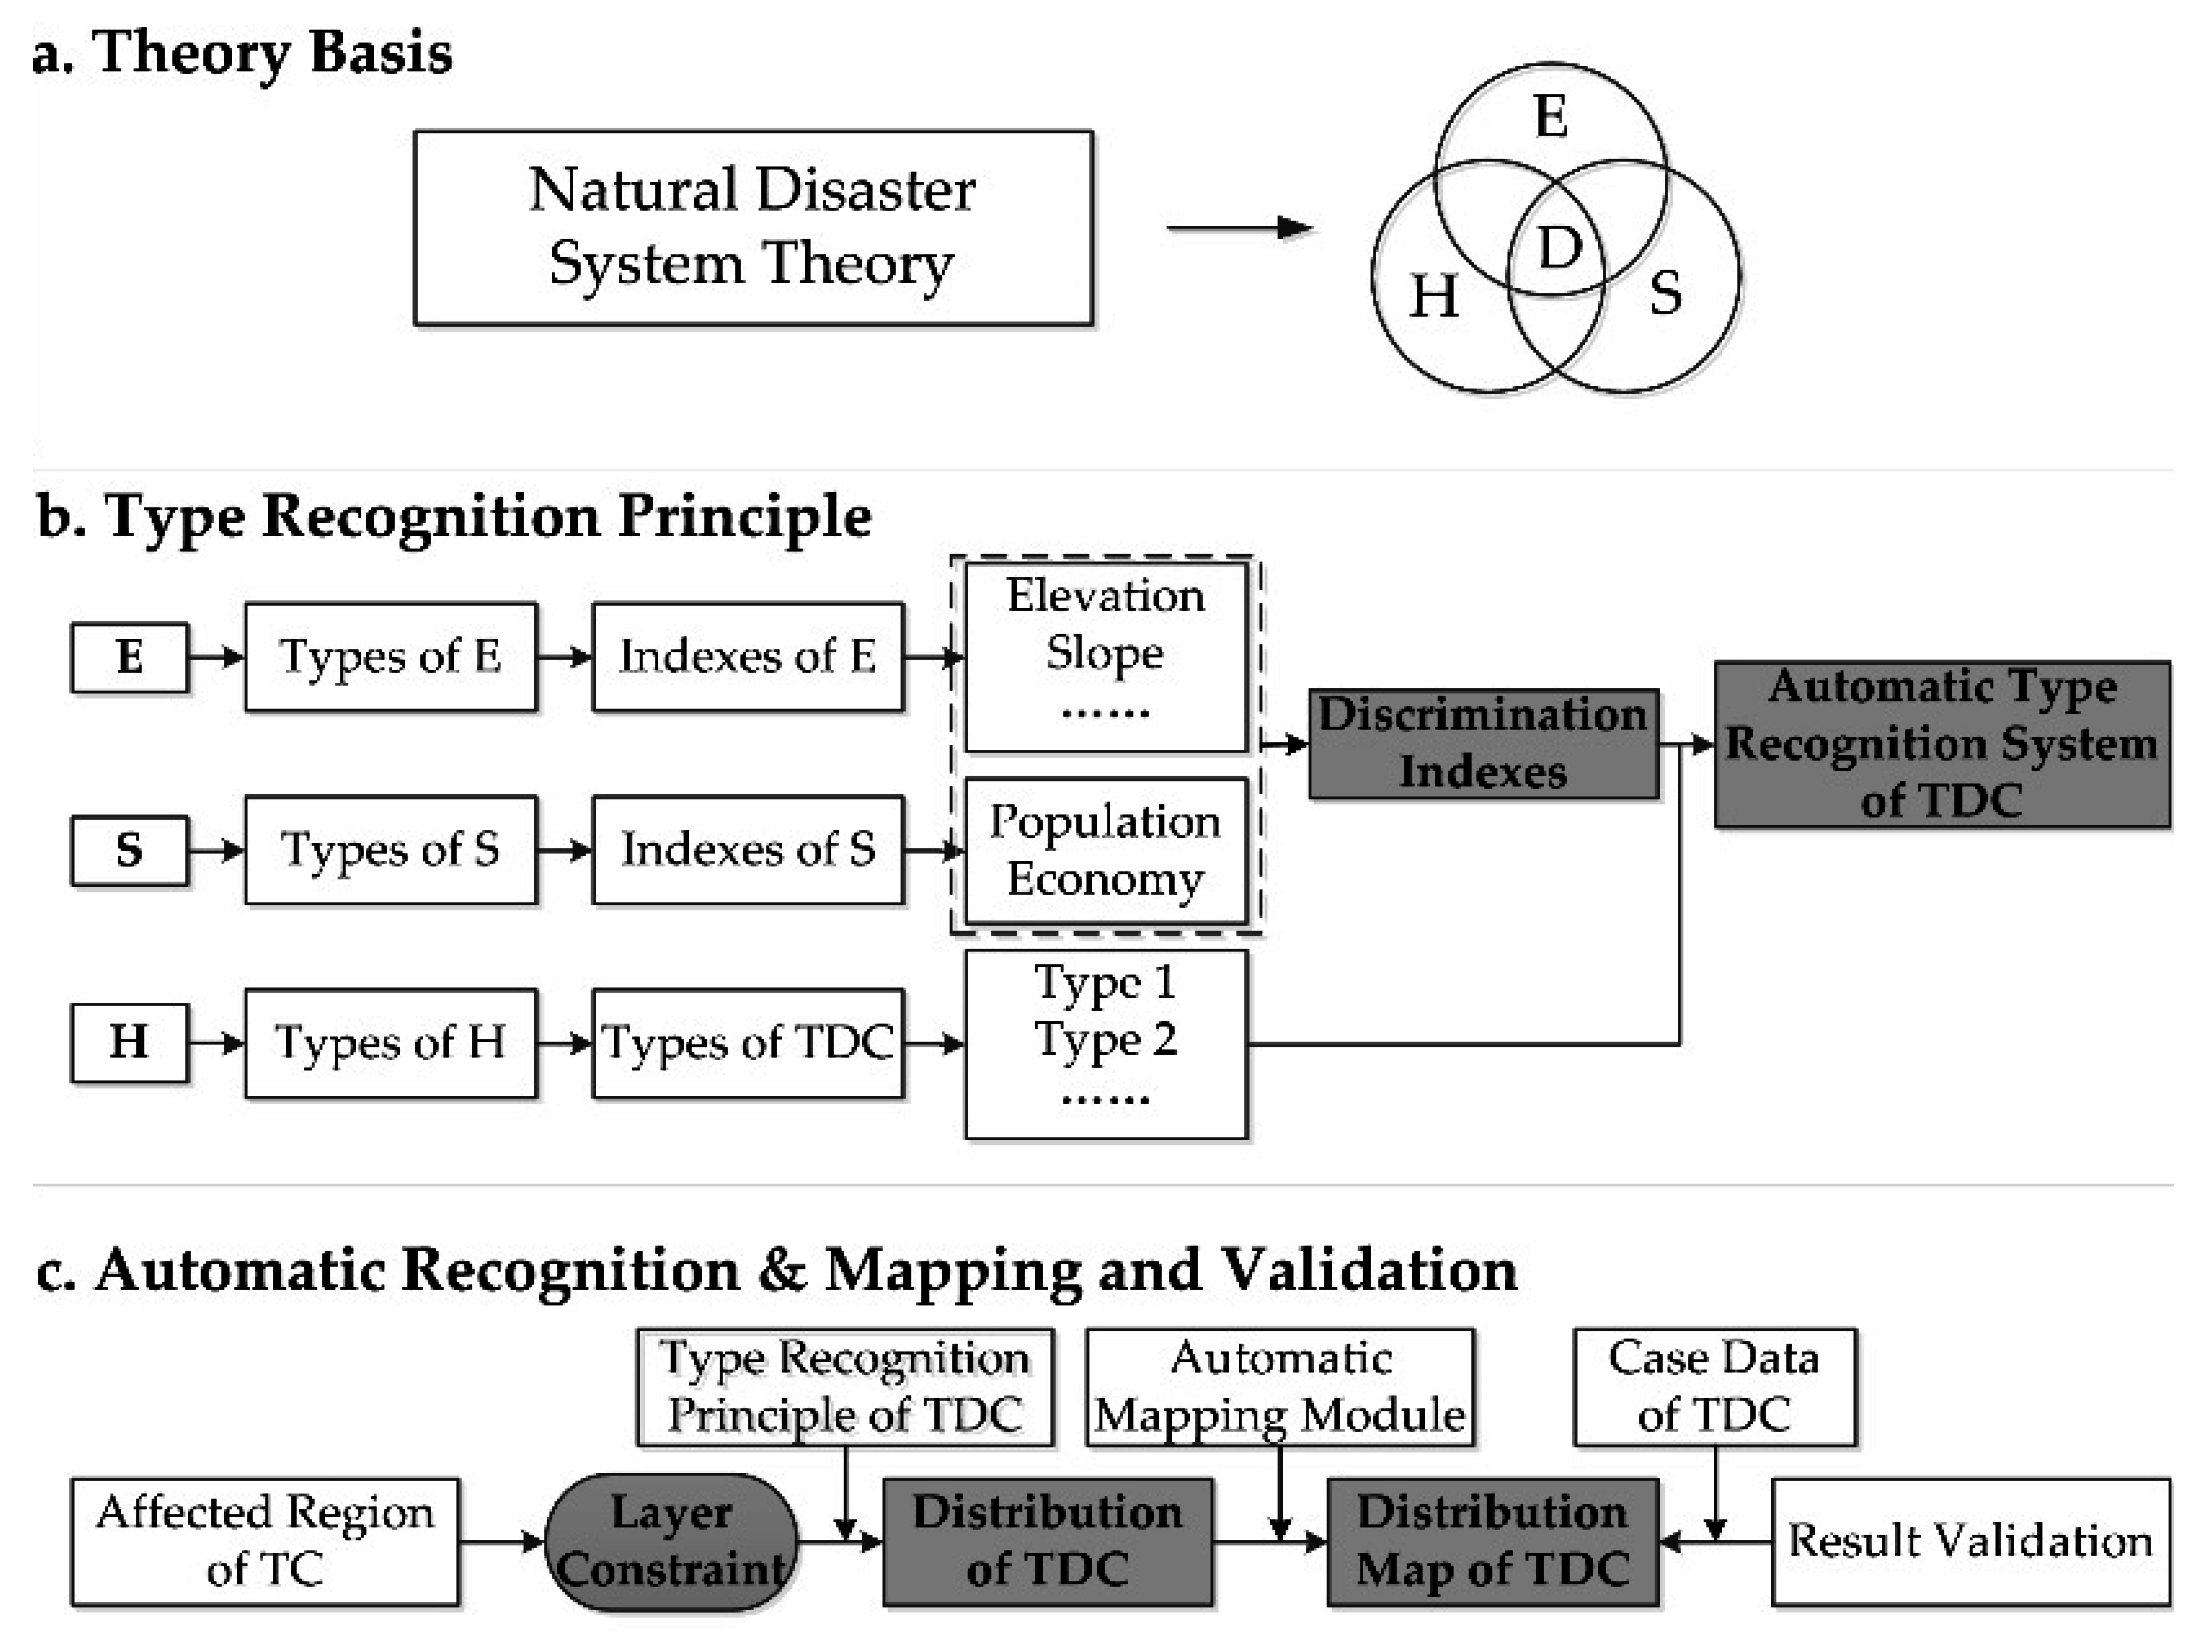
- Classify hazard-formative environments (E) and hazard-affected body (S) of Tropical Cyclones and extract the discrimination indexes of E and S, and then classify TDC types based on the trigger relationships between hazards related to Tropical Cyclones.
- (2)
- Construct recognition systems of TDC from the corresponding relationships between environment types, TDC types and discrimination indexes.
- (3)
- According to recognition principle of TDC, do the automatic recognition with the method of factor layer constraints and spatial overlay to obtain the type distribution. In particular, we need to eliminate the area unaffected by disaster, with the consideration of hazard-affected bodies.
- (4)
- Based on the recognition results, we do the automatic mapping with ArcGIS technology and validate the results with case data of TDCs.
2.2. Data
2.3. Classification and Type of Recognition Principle
2.3.1. Classification of TDC
2.3.2. Type Recognition Principle of TDCs
3. Results
3.1. Software System Design
3.1.1. Software Frame and Function
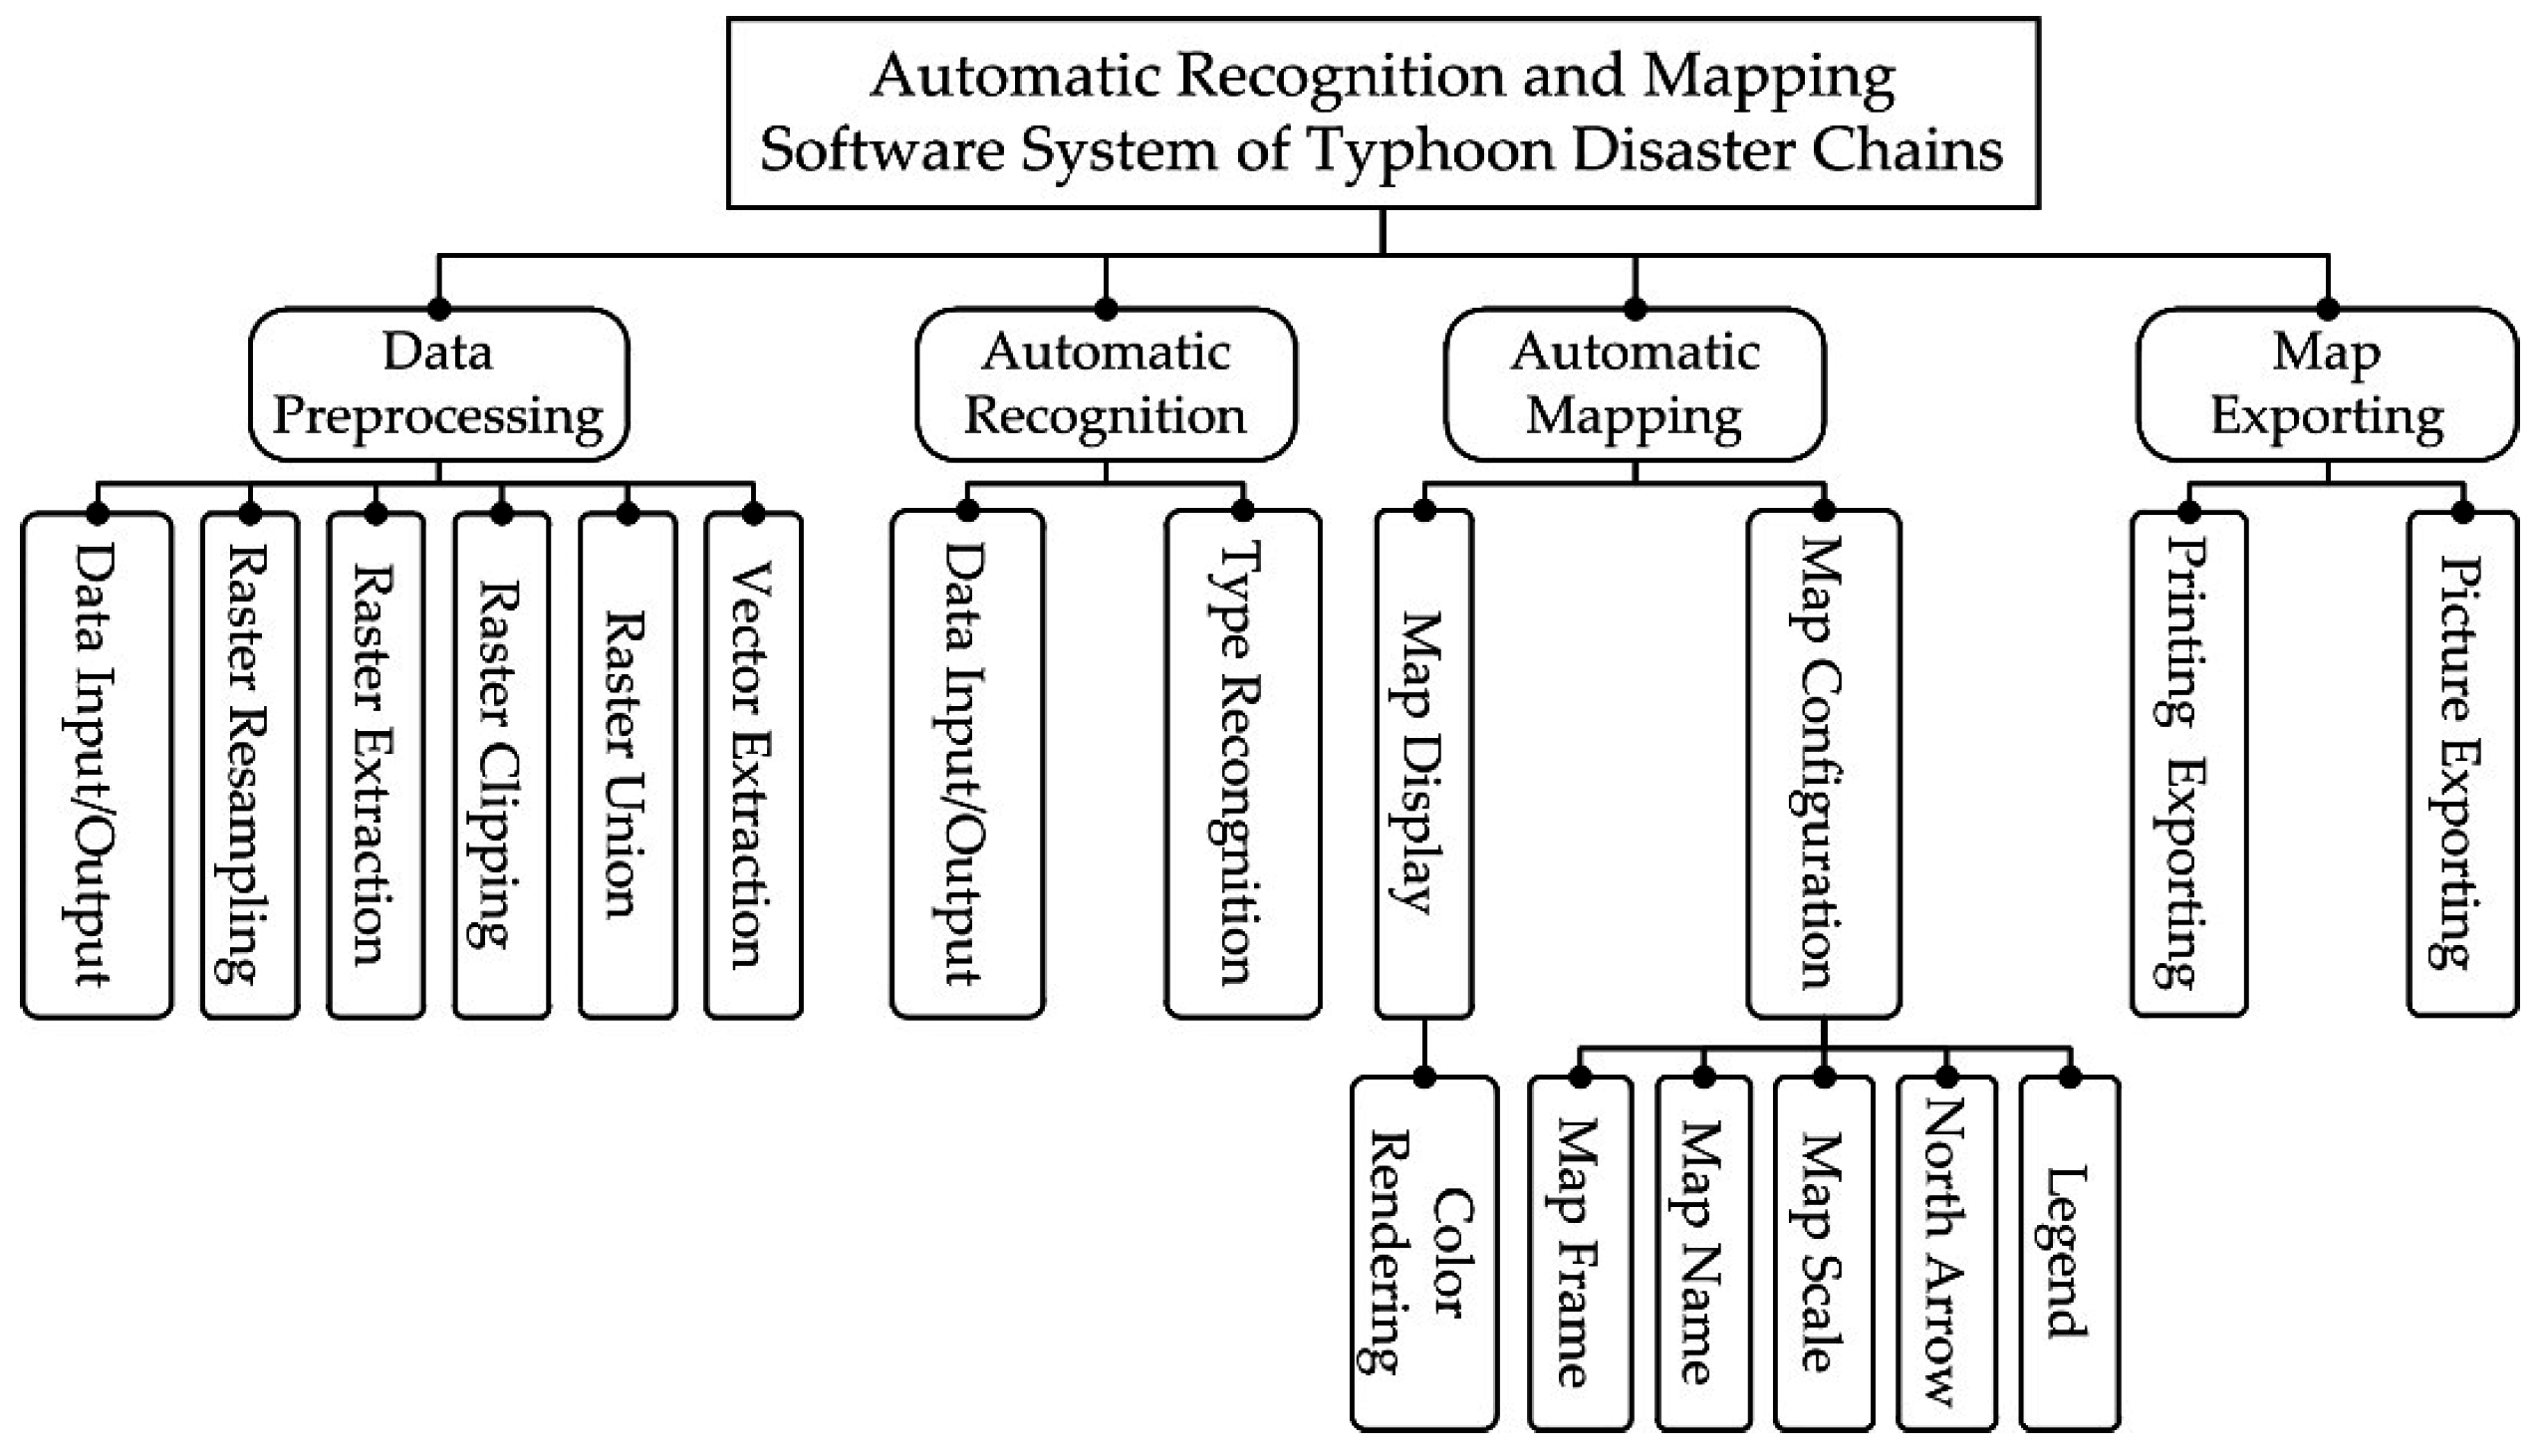
3.1.2. Data Preprocessing Module
- (1)
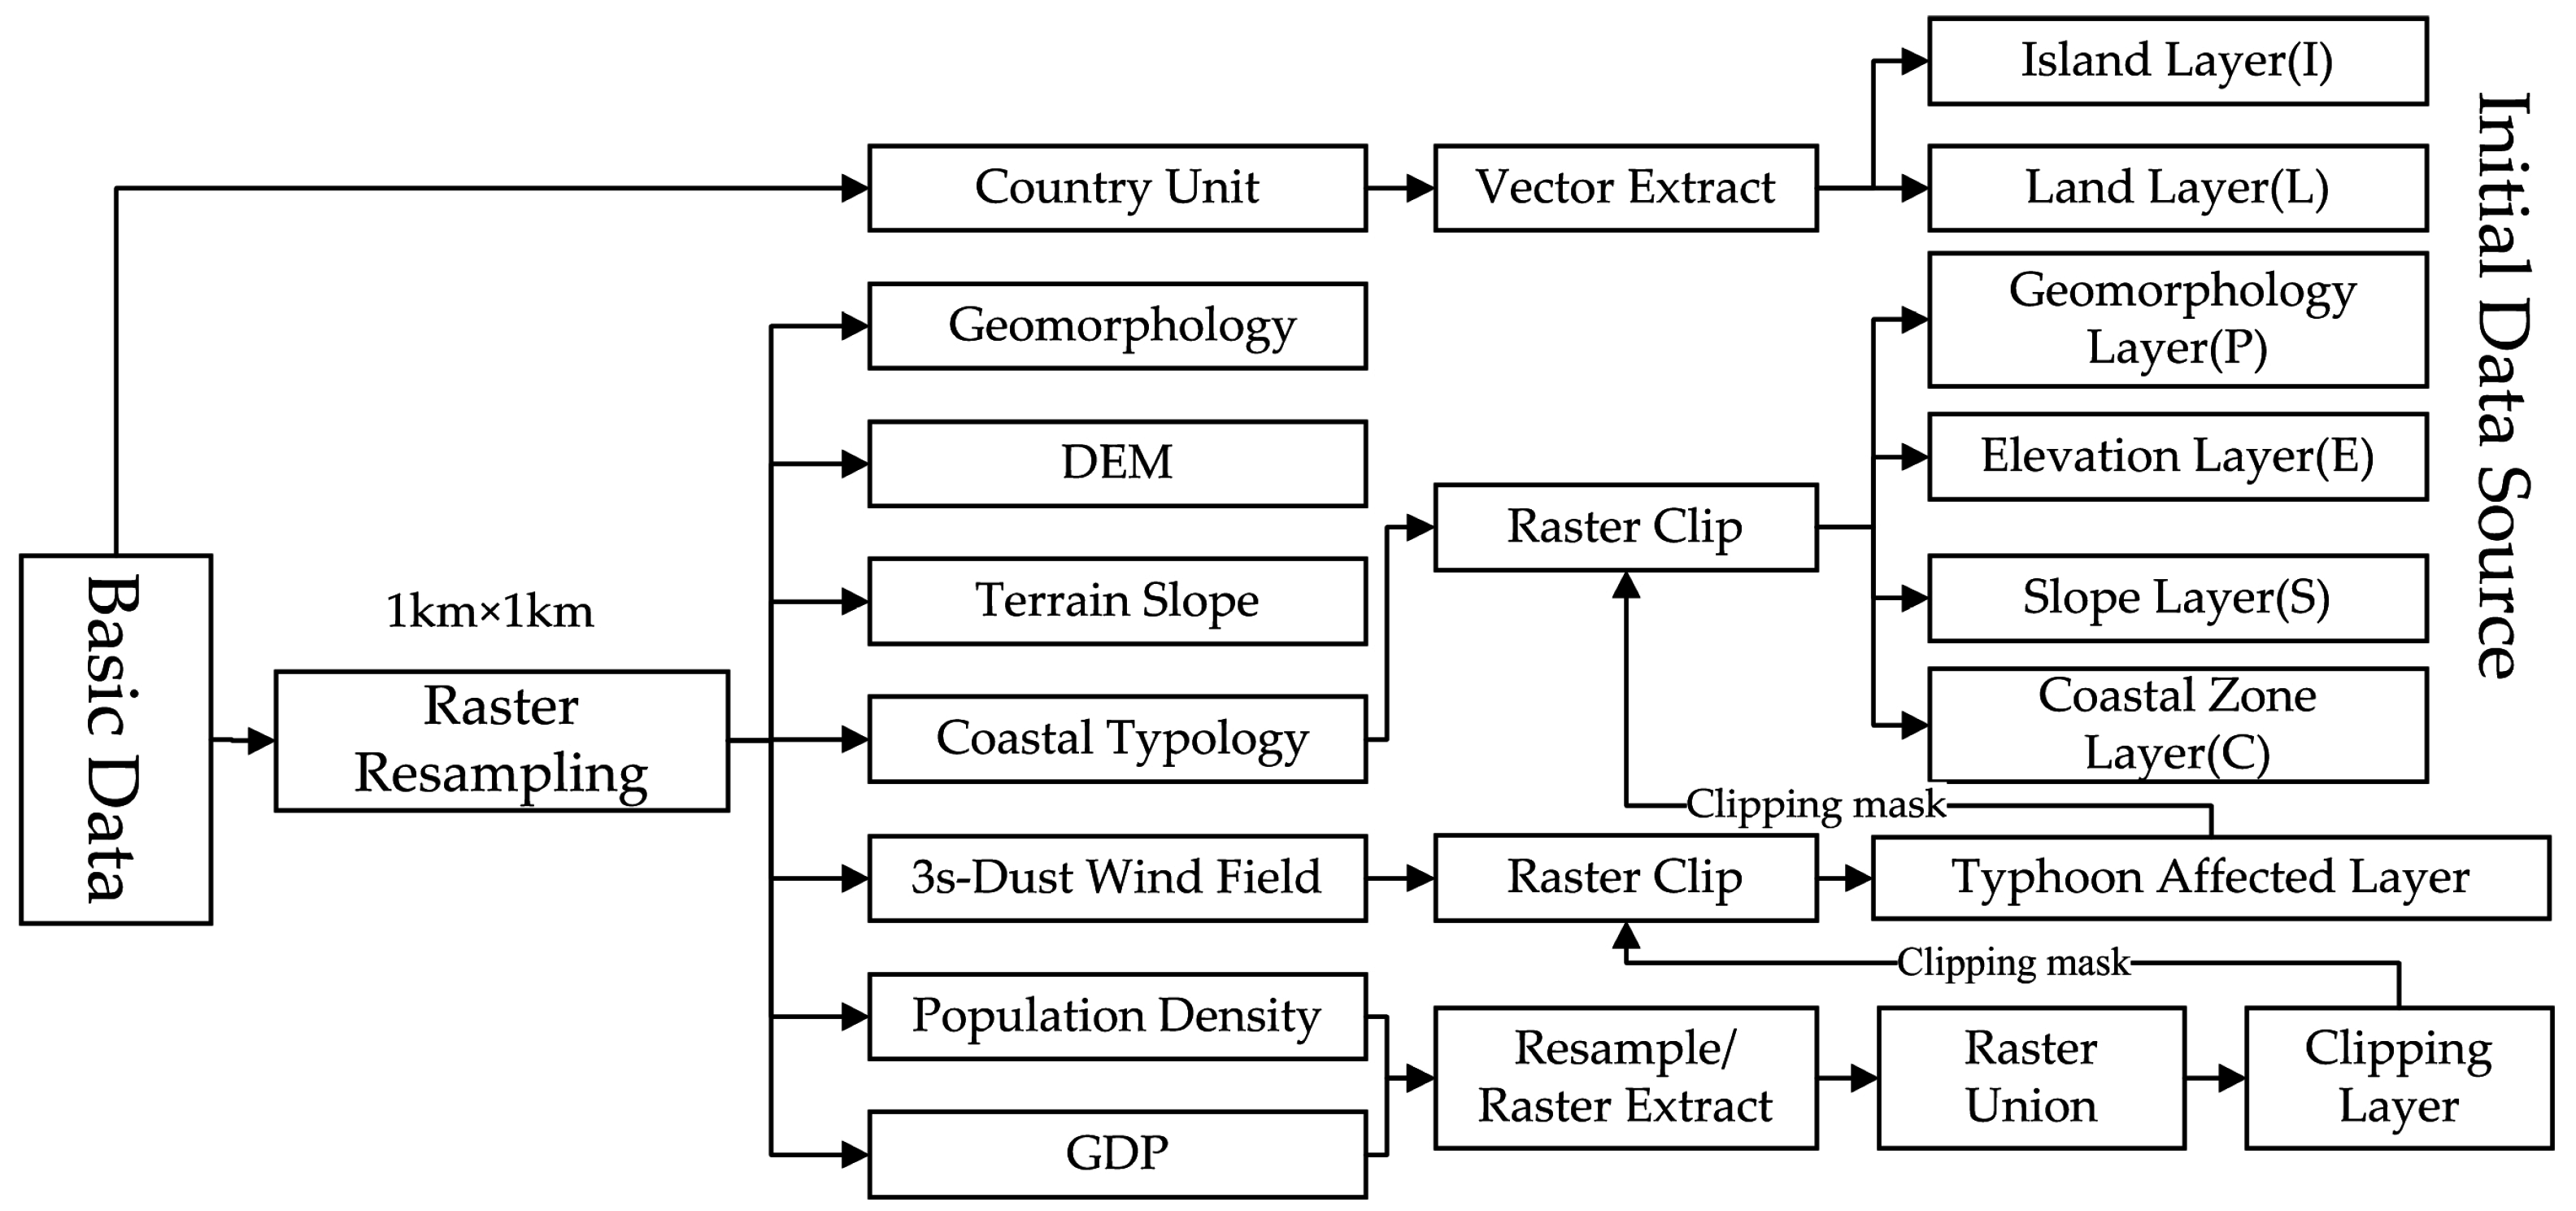
- Unify the format of raster data. We call the Resample class of the ESRI.ArcGIS.DataManagementTools library to unify the grid size of hazard-formative environment data, hazard data and hazard-affected body data to 1 km × 1 km by using the GIS resampling method of Bilinear.
- (2)
- Extract hazard-affected body layers. To extract two layers with population density of more than 1 person per km2 and GDP of more than $50,000 by using raster calculate interface (IMapAlgebraOp) and resample interface (IReclassOp).
- (3)
- Merge hazard-affected body layers (population and economy). We call the raster overlay interface (ILogicalOp) of ESRI.ArcGIS.SpatialAnalyst library and use the BooleanOr method to do this.
- (4)
- Clear hazard-affected body layers. Obtain the recognition region of TDC by clipping the three-second gust wind fields with the mask extraction class of ESRI.ArcGIS.SpatialAnalystTools library (ExtractByMask).
- (5)
- Extract hazard-formative environment layers. Extract elevation layer (E), slope layer (S), coastal zone layer (C) and geomorphology layer (P) using ExtractByMask class with the recognition regions obtained by the fourth step as masks.
- (6)
- Extract island layers. Extract island layer (I) and land layer (L) through properties sorting by the vector attributes interface (IQueryFilter).
3.1.3. Automatic Recognition Module
- Extract the corresponding raster layer according to the layer discrimination standard. Then, apply two interfaces called grid computing and classification (IMapAlgebraOp and IReclassOp) to extract the layers of slope < 8 degrees (S1), slope ≥ 8 degrees (S2), elevation < 200 m (E1), 200 m < elevation ≤ 500 m (E2) and elevation ≥ 200 m (E3). Taking the layer of elevation < 200 m as an example, we call IMapAlgebraOp interface to run the code (“con([raster] < 200, 1, 0”) to set the value of grids less than 200 as 1, otherwise 0. Then, we call the MapValueToNoData method of the IReclassOp interface to set the grid value of zero as null. In addition, coastal typology layer is divided into the plains coastal zone layer (C1), the mountainous coastal layer (C2), the estuarine coastal zone layer (C3), and the geomorphology layer is divided into the plateau layer (P1).
- Convert raster layer to vector layer. The hazard-formative environment layers (E1, E2, E3, S1, S2, C1, C2, C3, P1) are converted to the corresponding vector layers (Ev1, Ev2, Ev3, Sv1, Sv2, Cv1, Cv2, Cv3, Pv1) by calling the IConversionOp interface of ESRI.ArcGIS.GeoAnalyst with two methods (RasterDataToPolylineFeatureData and RasterDataToPolygonFeatureData).
- Overlay vector layers to obtain various types of disaster chains in island and inland. Then, this module calls the Intersect class in the class library (ESRI. ArcGIS.AnalysisTools). It will set input/output parameters of map layer intersection, do the map overlay by the Execute class method in Geoprocessor, set the type code field in the property table (code_area), and finally relate them to type codes of disaster chains.
- Analysis of buffer area for the vector layer to obtain various types of disaster chains in the coastal zone. Then, this module calls up the Buffer class in the ESRI.ArcGIS.AnalysisTools library. It sets input/output data, buffer distance and the type code field in the property table that are corresponding to type code of disaster chains.
- Merge all types of map layers of disaster chains. We merge map layers consecutively by calling the Union class in the ESRI. ArcGIS. AnalysisTools library. It generates map layers of regional distribution of TDC types globally and helps to diagnose disaster chains types in different regions.
3.1.4. Automatic Mapping Module
Map Display Sub-Module
Map Configuration Sub-Module
3.1.5. Map Exporting Sub-Module
3.2. Result Validation
4. Discussion
4.1. Further Applicaion of Layer Constraint Method
4.2. TDC Type Recognition Based on Hazard-Formative Environment and “Static to Dynamic Theory to Practice” Trend
4.3. Refinement Trend of TDC Type Recognition and Grade Risk Assessment of TDC
- (1)
- In future studies, we plan to analyze the sub-classes of TDC in more detail by describing multi-elements of hazard-formative environments. This will result in better diagnosing power and increases in the diversity of disaster chains in the software.
- (2)
- In addition, we may make assessments on the grade risk of different types of TDC, in terms of the relationships between the occurrence possibility of disasters and environment indexes by analyzing hazard-formative environment indexes and disaster situations of each disaster type. Some scholars have already described the occurrence conditions of the secondary hazard factors based on the characteristics of the primary hazard factors. For example, they calculated the relationships between intensity and duration of rainfall [53,54], which can possibly cause the landslide from the historical disaster information, and analyzed the earthquake magnitudes that may induce landslides [55]. Thus, we can add hazard factors indexes into the calculation of possibility of disaster chains. It can make the evaluation on the hazard grade of disaster chains from both sides of hazard-formative environments and hazards themselves. On the other hand, we can use the population density and economic data to describe the vulnerability and evaluate the intensity grade of possible disaster losses. Combining the two evaluation results above, we will be able to estimate the risk grade of different types of TDC if we synchronize results from the two aspects above. It will be very helpful for local governments or decision makers to make accurate predictions of disaster situations, and will facilitate targeted decision-making by policy makers on the prevention and mitigation of TDC risks to ensure regional sustainable development.
5. Conclusions
Acknowledgments
Author Contributions
Conflicts of Interest
References
- Shi, P.J. On the theory of disaster research and its practice. J. Nanjing Univ. 1991, 11, 37–42. [Google Scholar]
- IPCC (Intergovernmental Panel on Climate Change). Climate Change 2014: Synthesis Report; Cambridge University Press: New York, NY, USA, 2014; pp. 2–16. [Google Scholar]
- IPCC (Intergovernmental Panel on Climate Change). Climate Change 2012: A Special Report of Working Groups I and II of the Intergovernmental Panel on Climate Change (SREX); Cambridge University Press: New York, NY, USA, 2012; pp. 8–9. [Google Scholar]
- Webster, P.J.; Holland, G.J.; Curry, J.A.; Chang, H.-R. Changes in tropical cyclone number, duration, and intensity in a warming environment. Science 2005, 309, 1844–1846. [Google Scholar] [CrossRef] [PubMed]
- Emanuel, K.A. Increasing destructiveness of tropical cyclones over the past 30 years. Nature 2005, 436, 686–688. [Google Scholar] [CrossRef] [PubMed]
- IPCC (Intergovernmental Panel on Climate Change). Climate Change 2013: The Physical Science Basis; Cambridge University Press: New York, NY, USA, 2013; pp. 72–88. [Google Scholar]
- Lü, L.L.; Shi, P.J. The Comparison of Function Systems in Large-scale Disaster Response between China and USA-Cases of 2008 Southern China Freezing Rain and Snow Storm Disaster and 2005 Hurricane Katrina. J. Catastrophol. 2014, 29, 206–213. [Google Scholar]
- Travis, J. Hurricane Katrina-scientists’ fears come true as hurricane floods New Orleans. Science 2005, 309, 1656–1659. [Google Scholar] [CrossRef] [PubMed]
- Xue, J.J.; Li, J.Y.; Zhang, L.S.; Wang, X.R.; Xu, Y.L. Characteristics of typhoon disasters in China and risk prevention strategies. Meteorl. Disaster Reduct. Res. 2012, 35, 59–64. [Google Scholar]
- Shi, P.J.; Shuai, J.B.; Chen, W.F.; Lu, L.L. Study on large-scale disaster risk assessment and risk transfer models. Int. J. Disaster Risk Sci. 2010, 1, 1–8. [Google Scholar]
- Yu, H.; Wang, J.A.; Chai, M.; Shi, P.J. Review on research methods of disaster loss accumulation and amplification of disaster chains. Prog. Geogr. 2014, 33, 1498–1511. [Google Scholar]
- Shi, P.J.; Lü, L.L.; Wang, M.; Wang, J.A.; Chen, W.F. Disaster system: Disaster cluster, disaster chain and disaster compound. J. Nat. Disaster 2014, 23, 1–12. [Google Scholar]
- Carabine, E. Revitalizing Evidence-based Policy for the Sendai Framework for Disaster Risk Reduction 2015–2030: Lessons from Existing International Science Partnerships. PLoS Curr. Disasters 2015. [Google Scholar] [CrossRef] [PubMed]
- Xu, L.F.; Meng, X.W.; Xu, X.G. Natural hazard chain research in China: A review. Nat. Hazards 2014, 70, 1631–1659. [Google Scholar] [CrossRef]
- Shi, P.J. Theory on disaster science and disaster dynamics. J. Nat. Disasters 2002, 11, 1–9. [Google Scholar]
- Shuai, J.B.; Xu, W.; Shi, P.J. Characteristic analysis of typhoon disaster chains in the Yangtze River Delta region of China. J. Nat. Disasters 2012, 21, 36–42. [Google Scholar]
- Wang, J.A.; Lei, Y.D.; Zhou, H.J.; Yin, Y.Y.; Chang, S.; Li, Q.F. Regional features and adaptation countermeasures of typhoon disaster chains in southeast coastal region of China. J. Beijing Norm. Univ. 2012, 2, 130–138. [Google Scholar]
- Ye, J.Y.; Lin, G.F.; Zhang, M.F. Spatial characteristics of typhoon disaster chains in Fujian Province. J. Fujian Norm. Univ. Nat. Sci. Ed. 2014, 30, 99–106. [Google Scholar]
- Chen, X.; Chen, J.; Wang, J.A. Analysis of typhoon disaster chain in Fujian: A case study of typhoon Longwang in 2005. J. Beijing Norm. Univ. 2007, 43, 203–208. [Google Scholar]
- Gill, J.C.; Malamud, B.D. Reviewing and visualizing the interactions of natural hazards. Rev. Geophys. 2014, 52, 680–722. [Google Scholar] [CrossRef]
- Kappes, M.S. Multi- Hazard Risk Analyses: A Concept and Its Implementation. Ph.D. Thesis, University of Vienna, Vienna, Austria, 2011. [Google Scholar]
- Kappes, M.S.; Keiler, M.; von Elverfeldt, K.; Glade, T. Challenges of analyzing multi-hazard risk: A review. Nat. Hazards 2012, 64, 1925–1958. [Google Scholar] [CrossRef]
- Karnopp, D.; Rosenberg, R.; Perelson, A.S. System dynamics: A unified approach. IEEE Trans. Syst. Man Cybern. 1976. [Google Scholar] [CrossRef]
- Dong, L.L. Modeling Emergency Events Chain Based on Bayesian Networks. Ph.D. Thesis, Dalian University of Technology, Dalian, China, 2009. [Google Scholar]
- Wang, D. Network Model of Emergency Events Based on Correlation. Ph.D. Thesis, Dalian University of Technology, Dalian, China, 2010. [Google Scholar]
- Saban, L.I. Entrepreneurial Brokers in Disaster Response Network in Typhoon Haiyan in the Philippines. Public Manag. Rev. 2015, 17, 1496–1517. [Google Scholar] [CrossRef]
- Berz, G.; Kron, W.; Loster, T.; Schimetschek, J.; Schmieder, J.; Siebert, A.; Smolka, A.; Wirtz, A. World map of natural hazards—A global view of the distribution and intensity of significant exposures. Nat. Hazards 2001, 23, 443–465. [Google Scholar] [CrossRef]
- Dilley, M. Natural Disaster Hotspots: A Global Risk Analysis; World Bank Publications: Washington, DC, USA, 2005; pp. 35–118. [Google Scholar]
- United Nations Office for Disaster Risk Reduction. Global Assessment Report on Disaster Risk Reduction: Risk and Poverty in a Changing Climate; United Nations Publications: Geneva, Switzerland, 2009; pp. 158–196. [Google Scholar]
- Shi, P.J.; Kasperson, R. World Atlas of Natural Disaster Risk; Springer: Berlin, Germany, 2015; pp. 141–152. [Google Scholar]
- Shi, P.J. Theory and Practice on disaster system research in a fourth time. J. Nat. Disasters 2005, 14, 1–7. [Google Scholar]
- Meng, Y.; Matsui, M.; Hibi, K. A numerical study of the wind field in a typhoon boundary layer. J. Wind Eng. Ind. Aerodyn. 1997, 67–68, 437–448. [Google Scholar] [CrossRef]
- Harper, B.A.; Harby, T.A.; Mason, L.B.; Bode, L.; Young, L.; Nielsen, P. Queensland Climate Change and Community Vulnerability to Tropical Cyclones: Ocean Hazards Assessment—Stage 1 Report; Department of Natural Resources and Mine: Brisbane, Australia, 2001; pp. 41–58. [Google Scholar]
- Fang, W.H.; Shi, X.W. A review of stochastic modeling of tropical cyclone track and intensity for disaster risk assessment. Adv. Earth Sci. 2012, 27, 866–875. [Google Scholar]
- Fang, W.H.; Lin, W. A review on typhoon wind field modeling for disaster risk assessment. Progress Geogr. 2013, 32, 852–867. [Google Scholar]
- Chen, P.Y.; Yang, Y.H.; Lei, X.T.; Qian, Y.Z. Cause analysis and preliminary hazard estimate of typhoon disaster in China. J. Nat. Disasters 2009, 18, 64–73. [Google Scholar]
- Lin, N. Multi-Hazard Risk Analysis Related to Hurricanes. Ph.D. Thesis, Princeton University, Princeton, NJ, USA, 2010. [Google Scholar]
- Gorum, T.; Fan, X.M.; van Westen, C.J.; Huang, R.Q.; Xu, Q.; Tang, C.; Wang, G.H. Distribution pattern of earthquake-induced landslides triggered by the 12 May 2008 Wenchuan earthquake. Geomorphology 2011, 133, 152–167. [Google Scholar] [CrossRef]
- Zhang, B.J.; Ma, Y.L.; Li, Y. Standardization of natural disaster classification in China. J. Nat. Disasters 2013, 22, 8–12. [Google Scholar]
- Han, J.L.; Wu, S.R.; Wang, H.B. Preliminary study on geological hazard chains. Earth Sci. Front. 2007, 14, 11–23. [Google Scholar] [CrossRef]
- Xu, M.Z.; Wang, Z.Y.; Qi, L.J.; Liu, L.; Zhang, K. Disaster chains initiated by the Wenchuan earthquake. Environ. Earth Sci. 2012, 65, 975–985. [Google Scholar] [CrossRef]
- Sayre, R.; Dangermond, J.; Frye, C. A New Map of Global Ecological Land Units—An Ecophysiographic Stratification Approach; Association of American Geographers: Washington, DC, USA, 2014; pp. 7–44. [Google Scholar]
- Yang, G.S. The Coastal Environments Change and Regional Responses to It in China. Ph.D. Thesis, Nanjing Institute of Geography and Limnology, Chinese Academy of Sciences (CAS), Nanjing, China, 1997. [Google Scholar]
- USGS (U.S. Geological Survey). Geosciences and Environmental Change Science Center (GECSC) Outgoing Dataset. Available online: http://rmgsc.cr.usgs.gov/ outgoing /ecosystems/Global/ (accessed on 15 June 2010).
- Unisys Weather. Hurricane/Tropical Data. Available online: http://weather.unisys.com/hurricane/ (accessed on 15 July 2015).
- Yin, Y.Y.; Zhang, X.M.; Lin, D.G.; Yu, H.; Shi, P.J. GEPIC-VR model: A GIS-based tool for regional crop drought risk assessment. Agric. Water Manag. 2014, 144, 107–119. [Google Scholar] [CrossRef]
- Potopová, V.; Štěpánek, P.; Možný, M.; Türkott, L.; Soukup, J. Performance of the standardized precipitation evapotranspiration index at various lags for agricultural drought risk assessment in the Czech Republic. Agric. For Meteorol. 2015, 202, 26–38. [Google Scholar] [CrossRef]
- Roy, C.; Kovordányi, R. Tropical cyclone track forecasting techniques-A review. Atmos. Res. 2012, 104, 40–69. [Google Scholar] [CrossRef]
- Sun, Y.; Zhong, Z.; Dong, H.; Shi, J.; Hu, Y. Sensitivity of tropical cyclone track simulation over the western North Pacific to different heating/drying rates in the Betts–Miller–Janjić scheme. Mon. Weather Rev. 2015, 143, 3478–3494. [Google Scholar] [CrossRef]
- He, Y.C.; Chan, P.W.; Li, Q.S. Observations of vertical wind profiles of tropical cyclones at coastal areas. J. Wind Eng. Ind. Aerodyn. 2016, 152, 1–14. [Google Scholar] [CrossRef]
- Melton, G.; Gall, M.; Mitchell, J.T.; Cutter, S.L. Hurricane Katrina storm surge delineation: Implications for future storm surge forecasts and warnings. Nat. Hazards 2010, 54, 519–536. [Google Scholar] [CrossRef]
- Bindu, H.H.; Ratnam, M.V.; Yesubabu, V.; Rao, T.N.; Kesarkar, A.; Naidu, C.V. Characteristics of cyclone generated gravity waves observed using assimilated WRF model simulations over Bay of Bengal. Atmos. Res. 2016, 180, 178–188. [Google Scholar] [CrossRef]
- Gabet, E.J.; Burbank, D.W.; Putkonen, J.K.; Pratt-Sitaula, B.A.; Ojha, T. Rainfall thresholds for landsliding in the Himalayas of Nepal. Geomorphology 2004, 63, 131–143. [Google Scholar] [CrossRef]
- Dahal, R.K.; Hasegawa, S. Representative rainfall thresholds for landslides in the Nepal Himalaya. Geomorphology 2008, 100, 429–443. [Google Scholar] [CrossRef]
- Keefer, D.K. Investigating landslides caused by earthquakes-a historical review. Surv. Geophys. 2002, 23, 473–510. [Google Scholar] [CrossRef]


| Type | Name | Year | Format | Source |
|---|---|---|---|---|
| Base map Data | Global country unit map | 2014 | Vector, Scale: 1:200,000,000 | From World Atlas of Natural Disaster Risk |
| Hazard-formative environment Data | Global digital elevation | 1997 | Raster, Grid size: 1 km × 1 km | United States Geological Survey (USGS) ftp://edcftp.cr.usgs.gov |
| Global terrain slopes | 2002, 2006 | Raster, Grid size: 10 km × 10 km | International Institute for Applied Systems Analysis Global Agro-ecological Zones (GAEZ) http://www.gaez.iiasa.ac.at | |
| Global coastal typology | 2011 | Raster, Grid size: 0.5° × 0.5° | http://geotypes.net | |
| Global geomorphology | 2010 | Raster, Grid size: 1 km × 1 km | http://rmgsc.cr.usgs.gov/outgoing/ecos-ystems/Global/ | |
| Hazard Data | Global 3s-dust wind field | - | Raster, Grid size: 1 km × 1 km | By Planetary boundary layer model (PBL) [32,33,34,35] |
| Hazard-affected body Data | World population density data | 2010 | Raster, Grid size: 1 km × 1 km | Oak Ridge National Labora-tory (ORNL) http://web.ornl.gov/sci/landscan/ |
| GDP (at market exchange rate) | 2010 | Raster, Grid size: 0.5° × 0.5° | Greenhouse Gas Initiative (GGI) Program of the International Institute for Applied Systems Analysis (IIASA) http:// www. Iiasa.ac.at |
| Type | Subtype | Disaster Chain Type | Code | Constraint Layer | Code | Standard |
|---|---|---|---|---|---|---|
| Ocean | Island A | TC-WI-SS(SW) | AI | Island | I | Area < 5000 km2 |
| Coastal Zone | C | Distance from coastline 1 km | ||||
| TC-RS-FL | AII | Island | I | Area < 5000 km2 | ||
| Elevation | E | 1. Elevation < 200 m 2. 200 m ≤ Elevation < 500 m | ||||
| Slope | S | 1. None 2. Slope < 8° | ||||
| TC-RS-MT | AIII | Island | I | Area < 5000 km2 | ||
| Elevation | E | Elevation ≥ 200 m | ||||
| Slope | S | Slope ≥ 8° | ||||
| TC-RS-LA/RC | AIV | Island | I | Area < 5000 km2 | ||
| Elevation | E | Elevation ≥ 200 m | ||||
| Slope | S | Slope ≥ 8° | ||||
| Sea area B | TC-WI-SS(SW) | BI | - | - | - | |
| Coastal Zone | Plain coastal zone C | TC-WI-SS(SW) | CI | Coastal Zone | C | Distance from coastline 1 km |
| TC-RS-FL | CII | Coastal Zone | C | Distance from coastline 1–10 km | ||
| Mountainous coastal zone D | TC-WI-SS(SW) | DI | Coastal Zone | C | Distance from coastline 1 km | |
| TC-RS-FL | DIII | Coastal Zone | C | Distance from coastline 1–10 km | ||
| TC-RS-LA/RC/DF | DIV | Coastal Zone | C | Distance from coastline 1–10 km | ||
| Estuarine coastal zone E | TC-WI-SS(SW) | EI | Coastal Zone | C | Distance from coastline 1 km | |
| TC-RS-FL | EII | Coastal Zone | C | Distance from coastline 1–10 km | ||
| Land | Mountain (Hills) F | TC-RS-MT | FIII | Coastal Zone | E | Elevation ≥ 200 m |
| Coastal Zone | S | Slope ≥ 8° | ||||
| TC-RS-LA/RC/DF | FIV | Elevation | E | Elevation ≥ 200 m | ||
| Slope | S | Slope ≥ 8° | ||||
| Plain G | TC-RS-FL | GII | Elevation | E | 1. Elevation < 200 m 2. 200 m ≤ Elevation < 500 m | |
| Slope | S | 1. None; 2. Slope < 8° | ||||
| Plateau (Tableland) H | TC-RS-FL | HII | Topography | P | Plateau Area | |
| Slope | S | Slope < 8° | ||||
| TC-RS-MT | HIII | Topography | P | Plateau Area | ||
| Slope | S | Slope < 8° | ||||
| TC-RS-LA/RC/DF | HIV | Topography | P | Plateau Area | ||
| Slope | S | Slope < 8° |
| Name | Region | Source [45] |
|---|---|---|
| JWTC best track data | West Pacific | http://weather.unisys.com/hurricane/w_pacific/index.php |
| South Pacific | http://weather.unisys.com/hurricane/s_pacific/index.php | |
| South Indian | http://weather.unisys.com/hurricane/s_indian/index.php | |
| North Indian | http://weather.unisys.com/hurricane/n_indian/index.php | |
| TPC best track data | Atlantic | http://weather.unisys.com/hurricane/atlantic/index.php |
| East Pacific | http://weather.unisys.com/hurricane/e_pacific/index.php |
| Type | Code | Case Number | Type | Code | Case Number |
|---|---|---|---|---|---|
| TC-WI-SS(SW) | TS | 216 | TC-RS-MT | TG | 108 |
| TC-WI-SS(SW)-FL | TS | 125 | TC-RS-LA | TG | 131 |
| TC-WI-SS(SW)-SE | TS | 15 | TC-RS-RC | TG | 4 |
| TC-RS-FL | TR | 624 | TC-RS-DF | TG | 85 |
| Type | M | N | Q | Type | M | N | Q |
|---|---|---|---|---|---|---|---|
| AI | 90 | 90 | 100% | EI/EII | 229 | 235 | 97.4% |
| AII | 119 | 120 | 99.2% | FIII/FIV | 165 | 172 | 95.9% |
| AIII/AIV | 52 | 52 | 100% | GII | 259 | 272 | 95.2% |
| CI/CII | 299 | 314 | 95.2% | HII | 18 | 18 | 100% |
| DI/DIII/DIV | 5 | 5 | 100% | HIII/HIV | 32 | 32 | 100% |
© 2016 by the authors; licensee MDPI, Basel, Switzerland. This article is an open access article distributed under the terms and conditions of the Creative Commons Attribution (CC-BY) license (http://creativecommons.org/licenses/by/4.0/).
Share and Cite
Wang, R.; Zhu, L.; Yu, H.; Cui, S.; Wang, J. Automatic Type Recognition and Mapping of Global Tropical Cyclone Disaster Chains (TDC). Sustainability 2016, 8, 1066. https://doi.org/10.3390/su8101066
Wang R, Zhu L, Yu H, Cui S, Wang J. Automatic Type Recognition and Mapping of Global Tropical Cyclone Disaster Chains (TDC). Sustainability. 2016; 8(10):1066. https://doi.org/10.3390/su8101066
Chicago/Turabian StyleWang, Ran, Laiyin Zhu, Han Yu, Shujuan Cui, and Jing’ai Wang. 2016. "Automatic Type Recognition and Mapping of Global Tropical Cyclone Disaster Chains (TDC)" Sustainability 8, no. 10: 1066. https://doi.org/10.3390/su8101066
APA StyleWang, R., Zhu, L., Yu, H., Cui, S., & Wang, J. (2016). Automatic Type Recognition and Mapping of Global Tropical Cyclone Disaster Chains (TDC). Sustainability, 8(10), 1066. https://doi.org/10.3390/su8101066


