
A Modeling Approach for Farmland Protection Zoning Considering Spatial Heterogeneity: A Case Study of E-Zhou City, China

Abstract
:1. Introduction
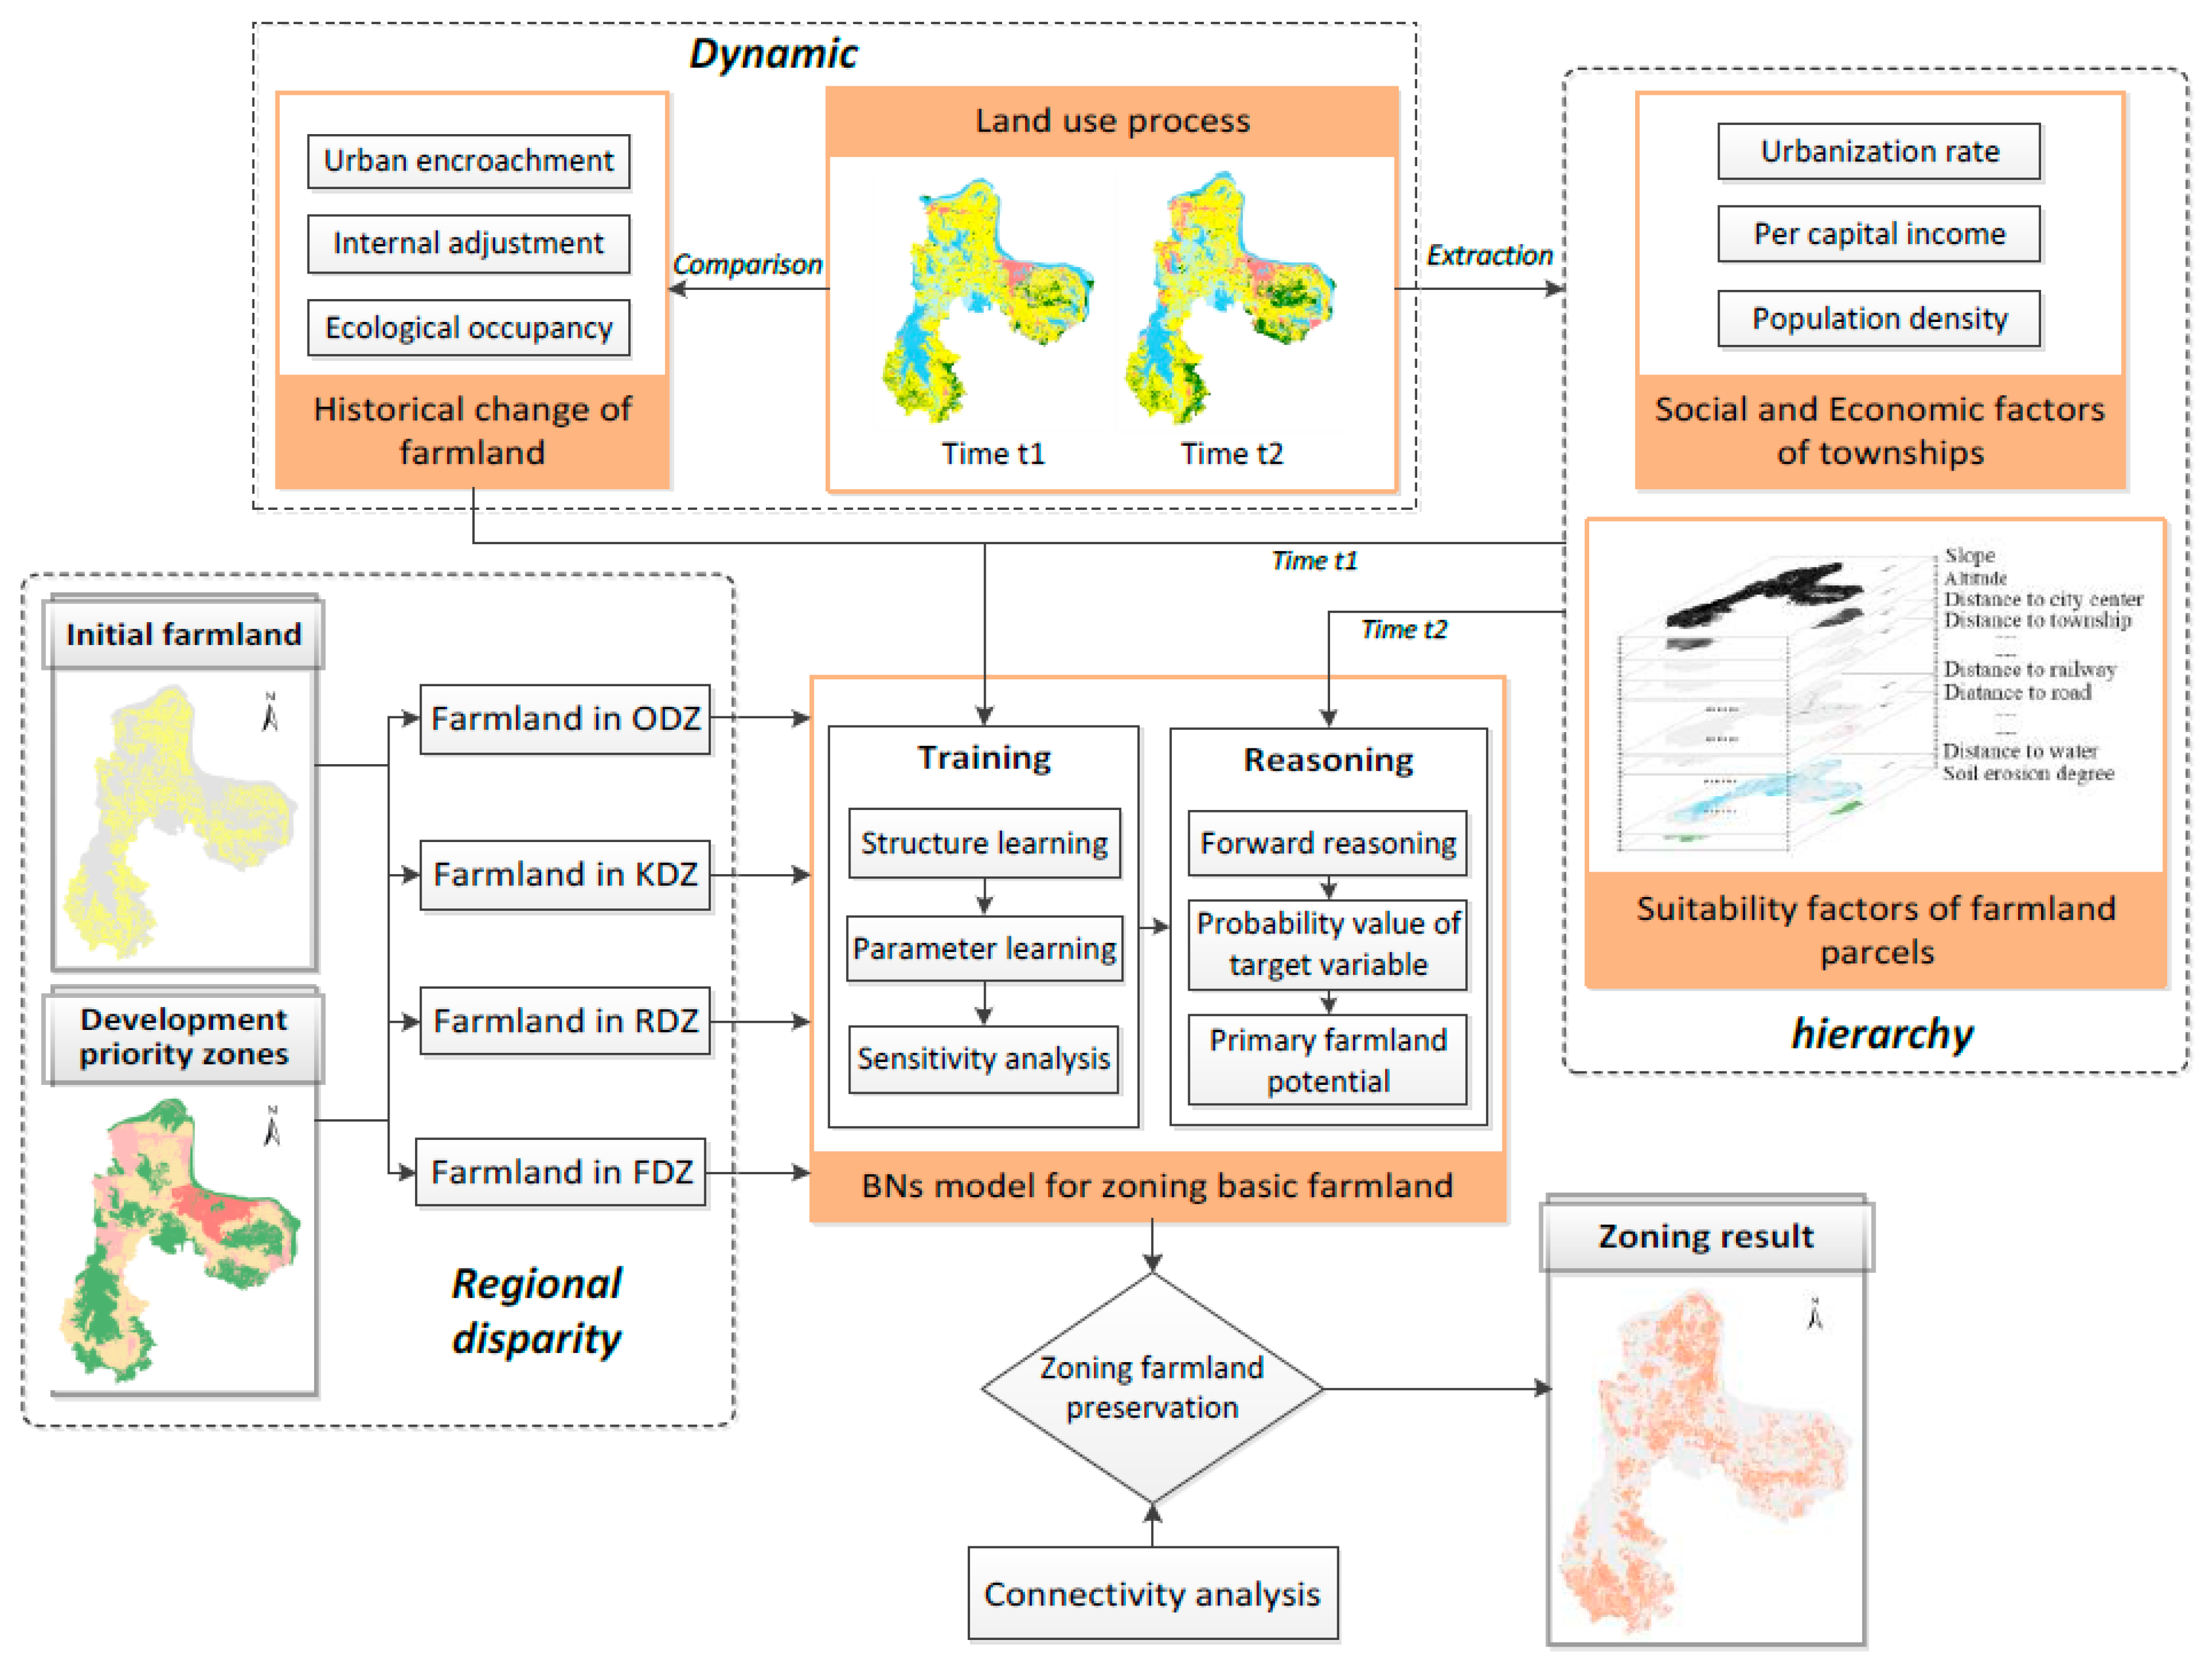
2. Methods
2.1. Variables’ Description
2.2. Model Learning and Reasoning
2.3. Spatial Allocation of Primary Farmland
3. Study Area and Data
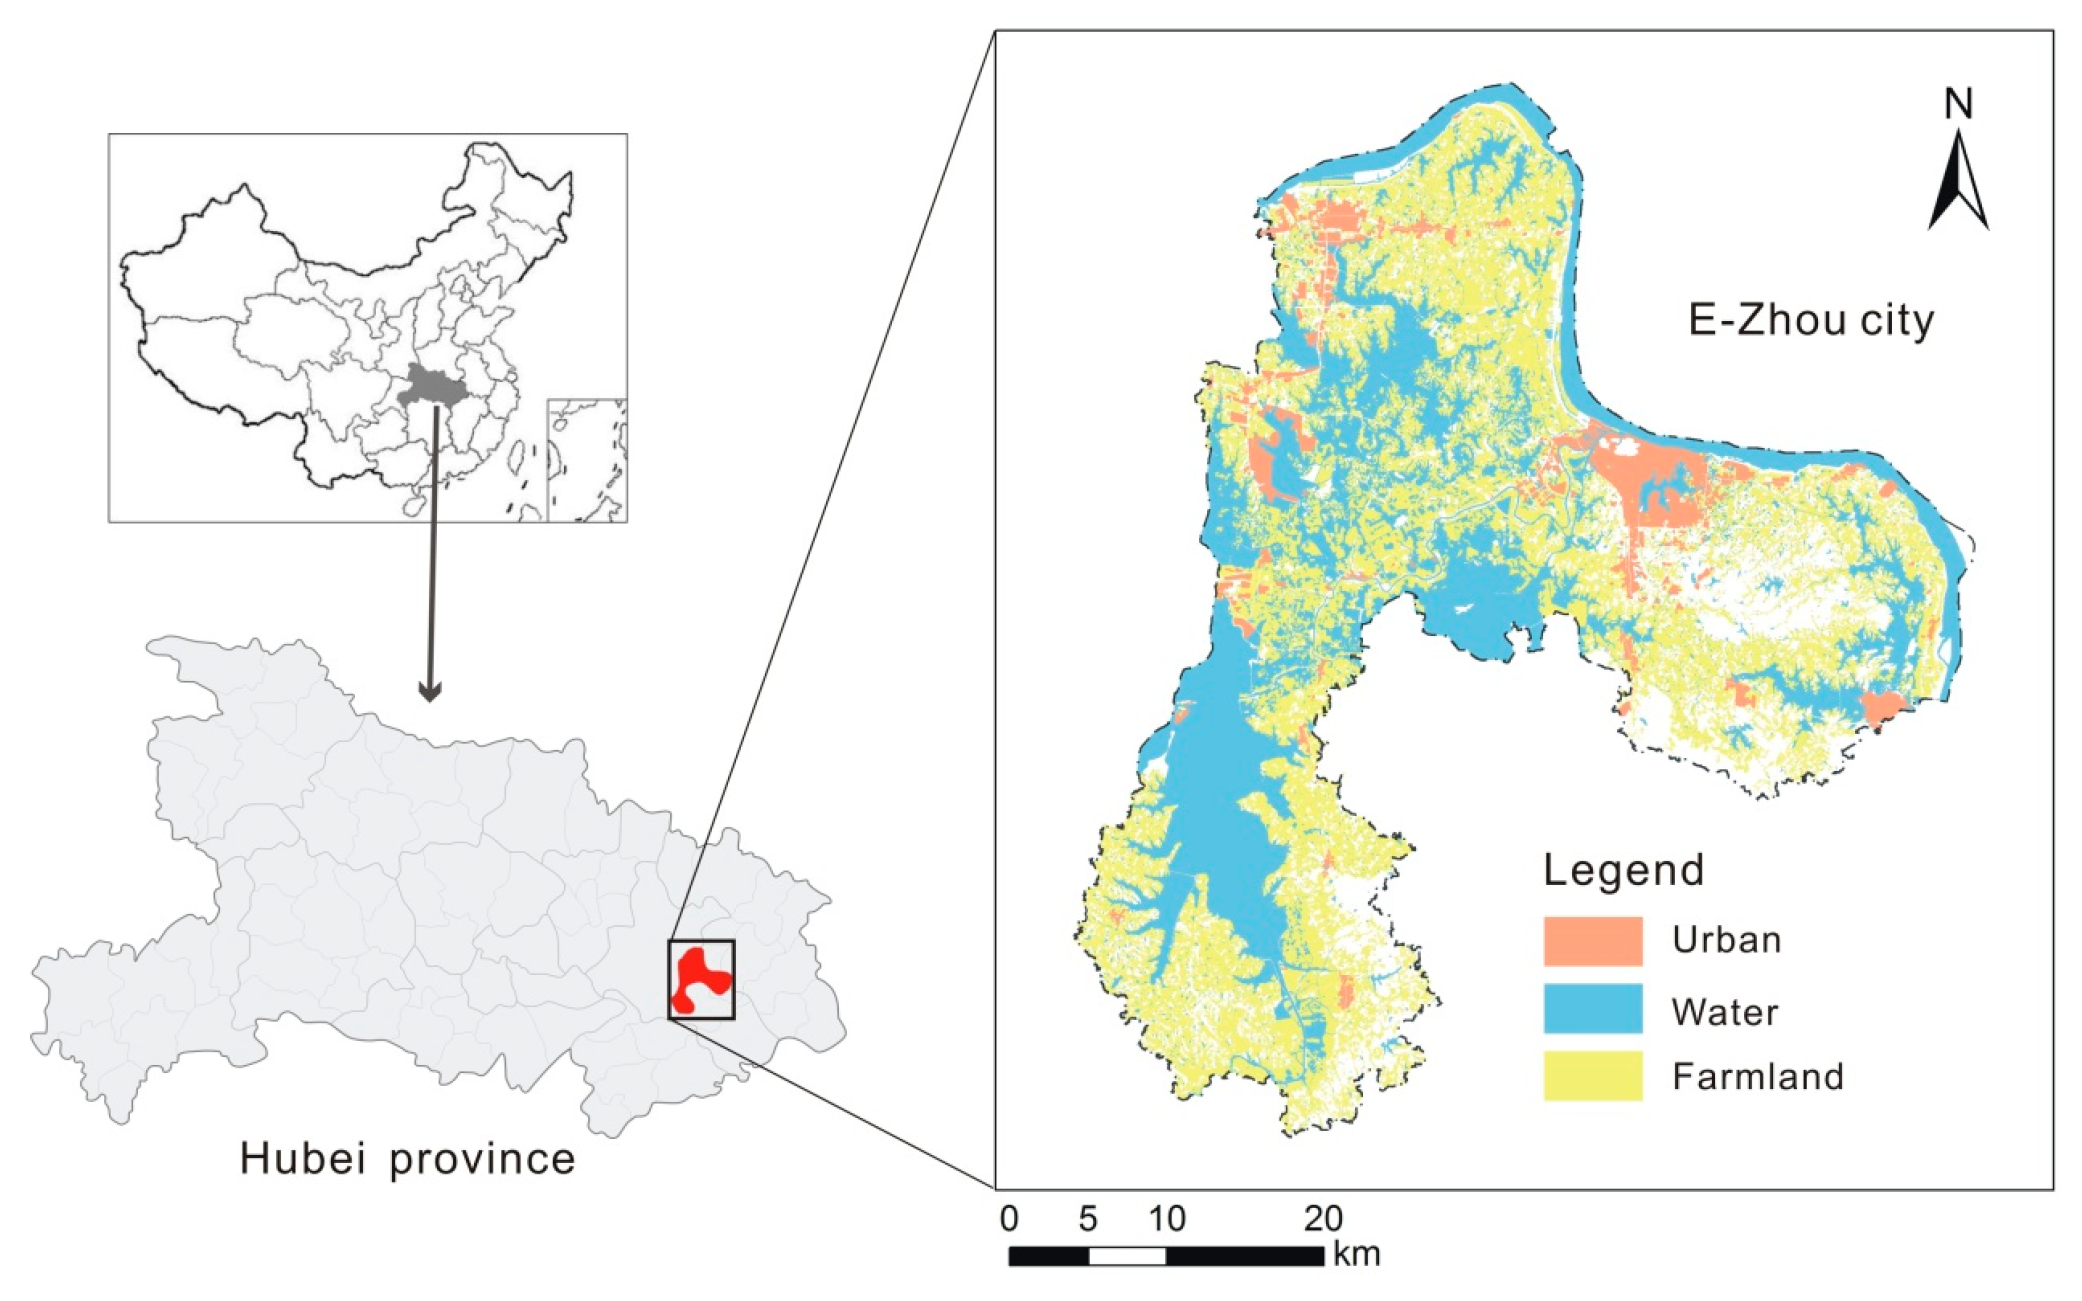
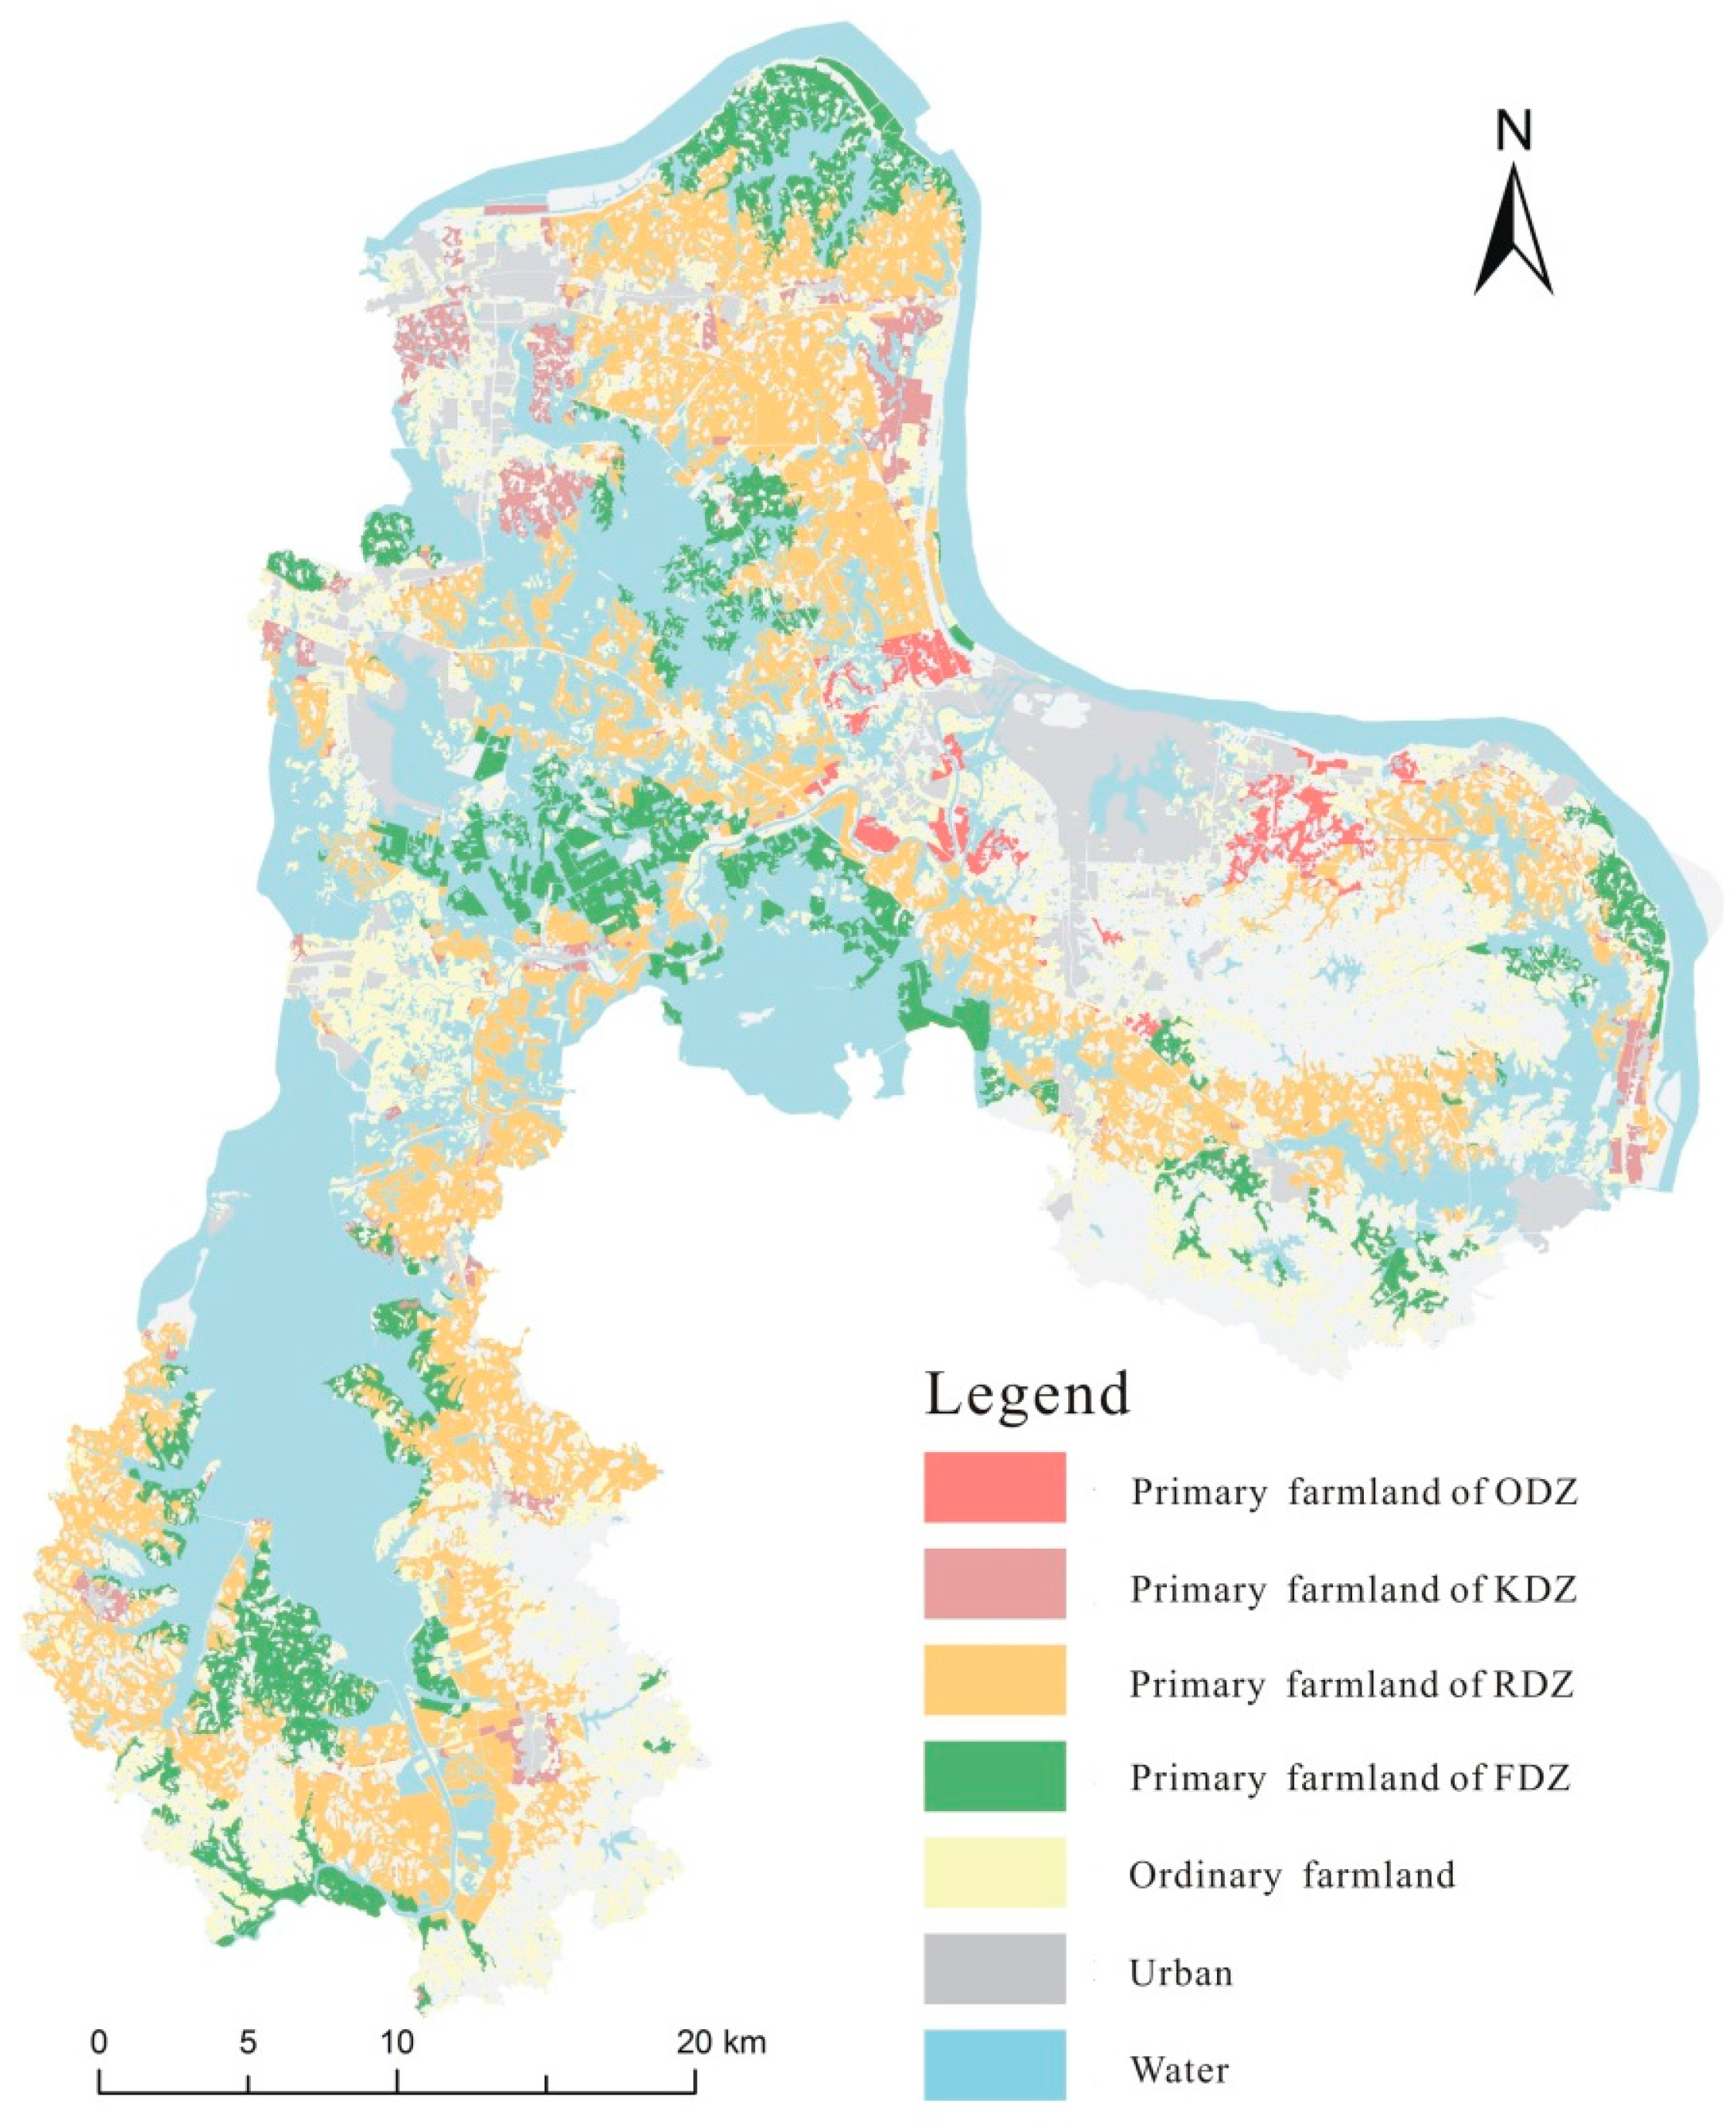
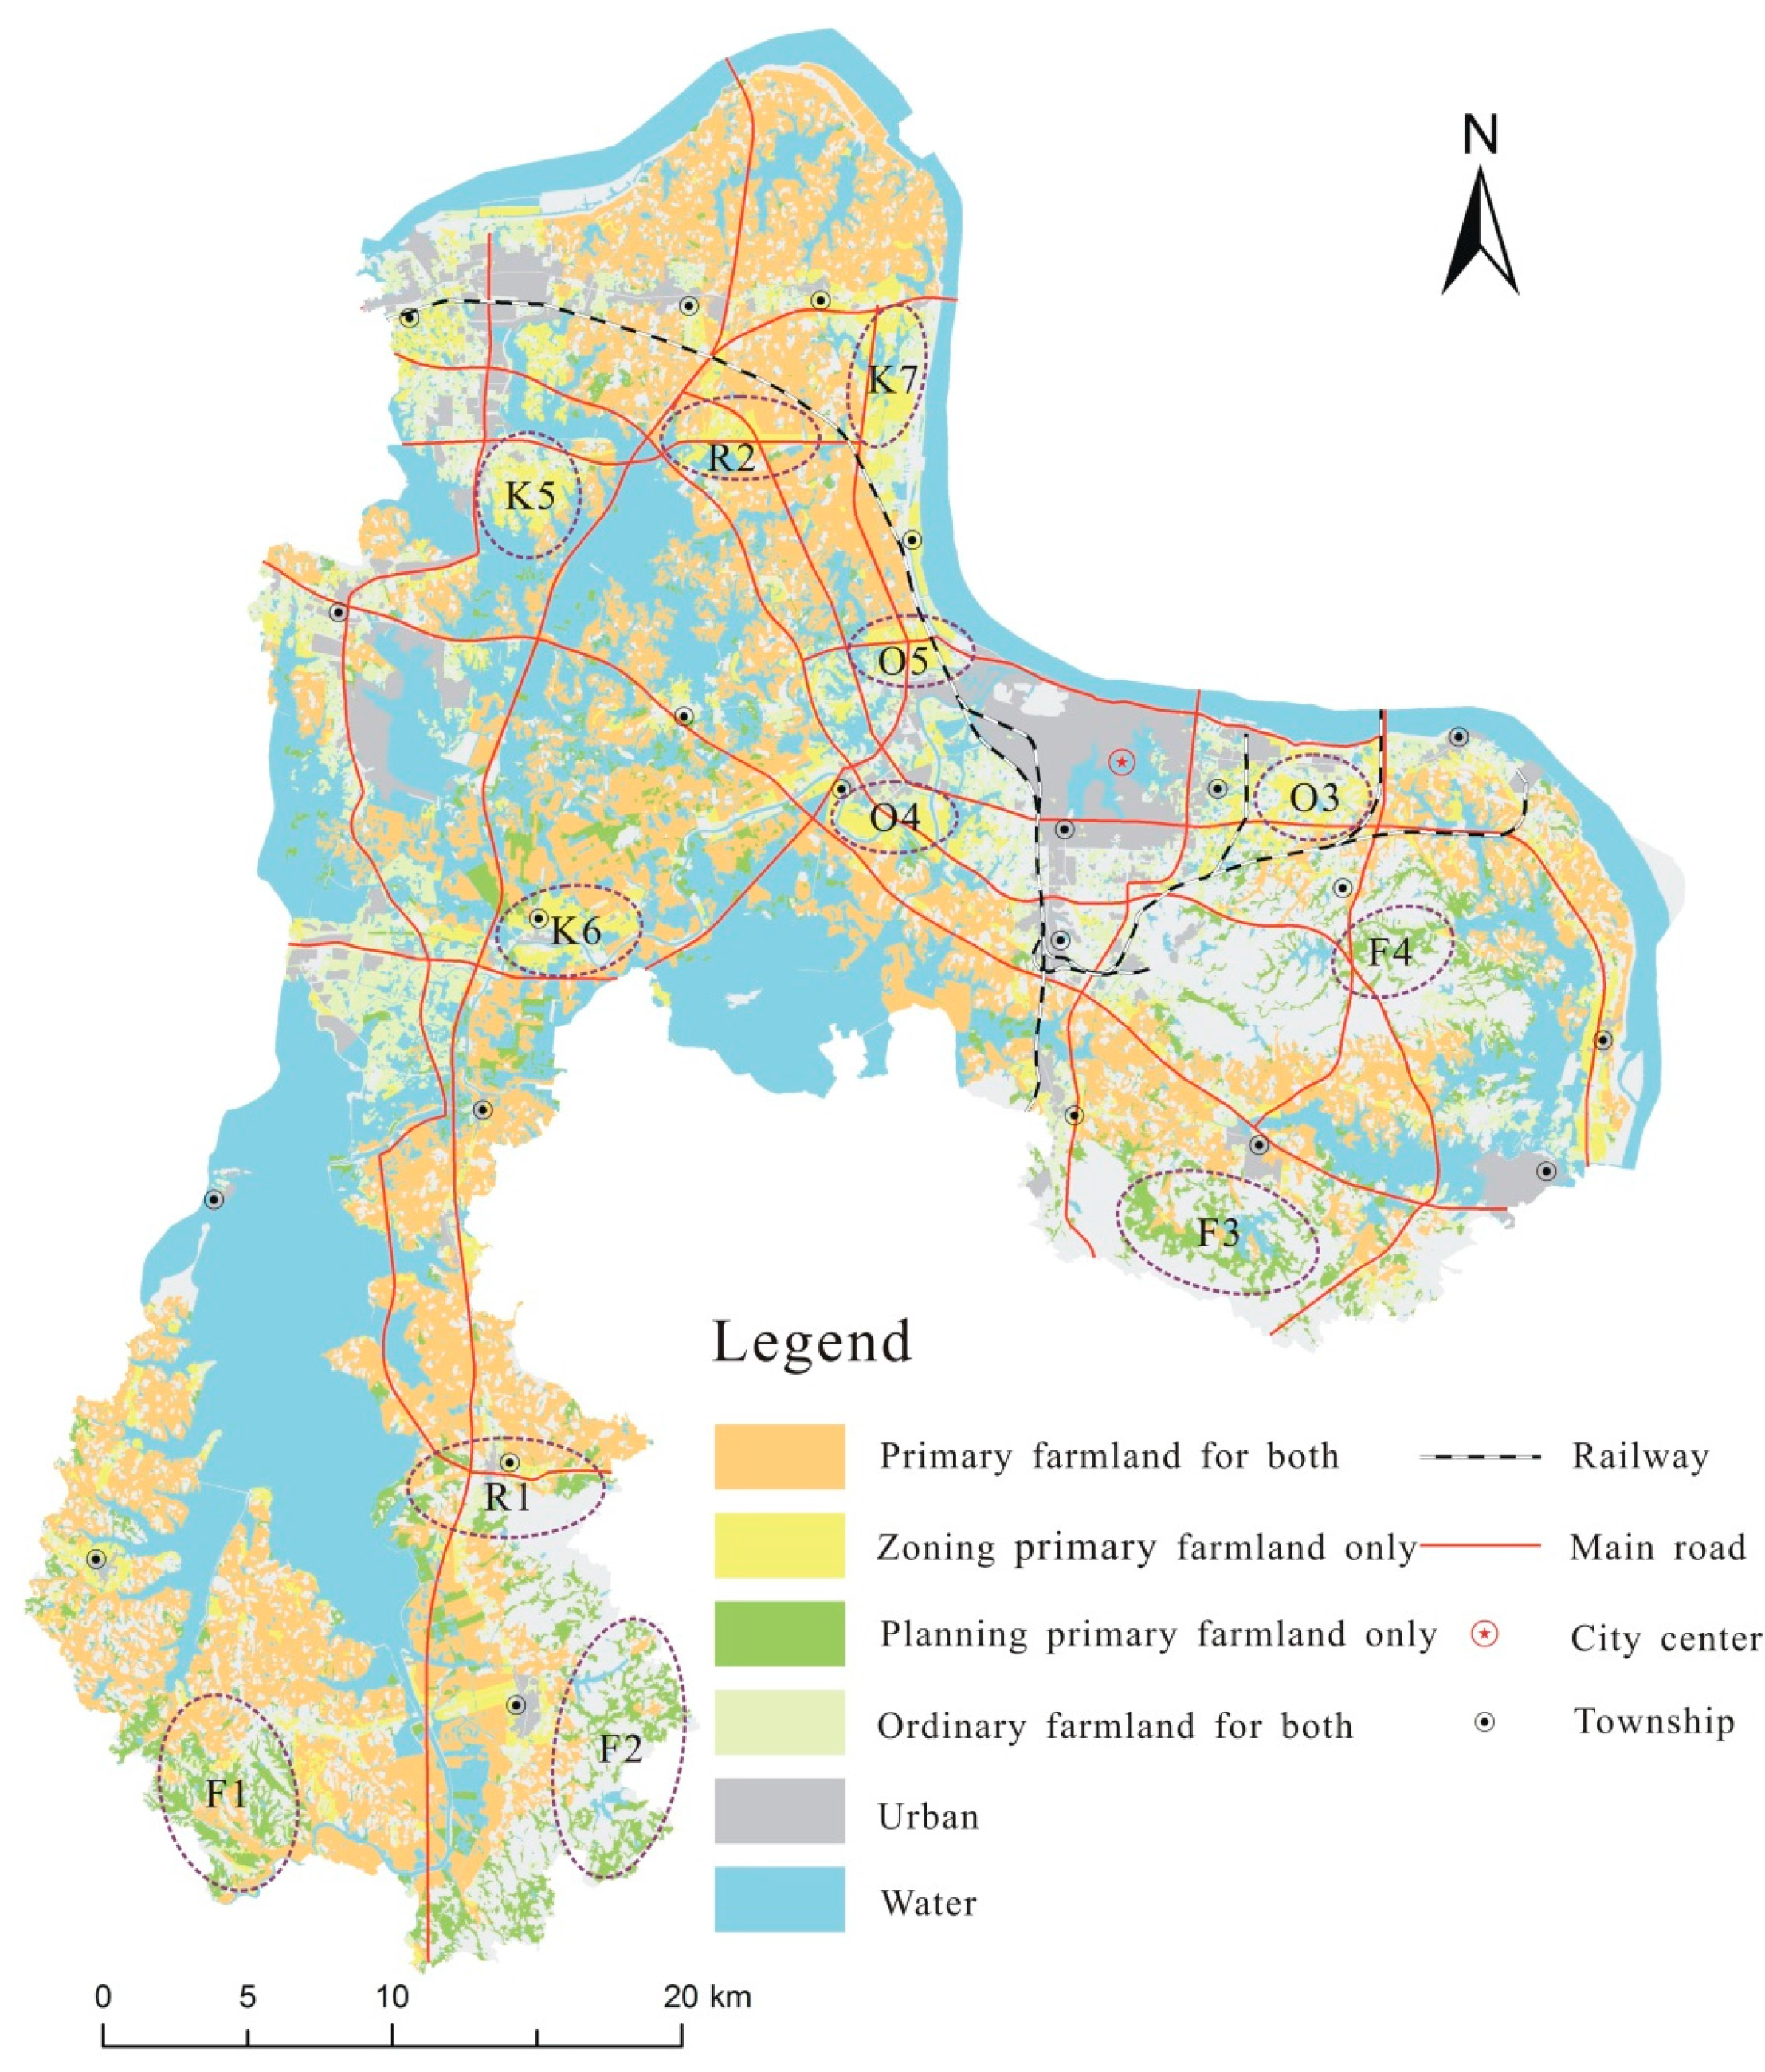
3.1. Study Area
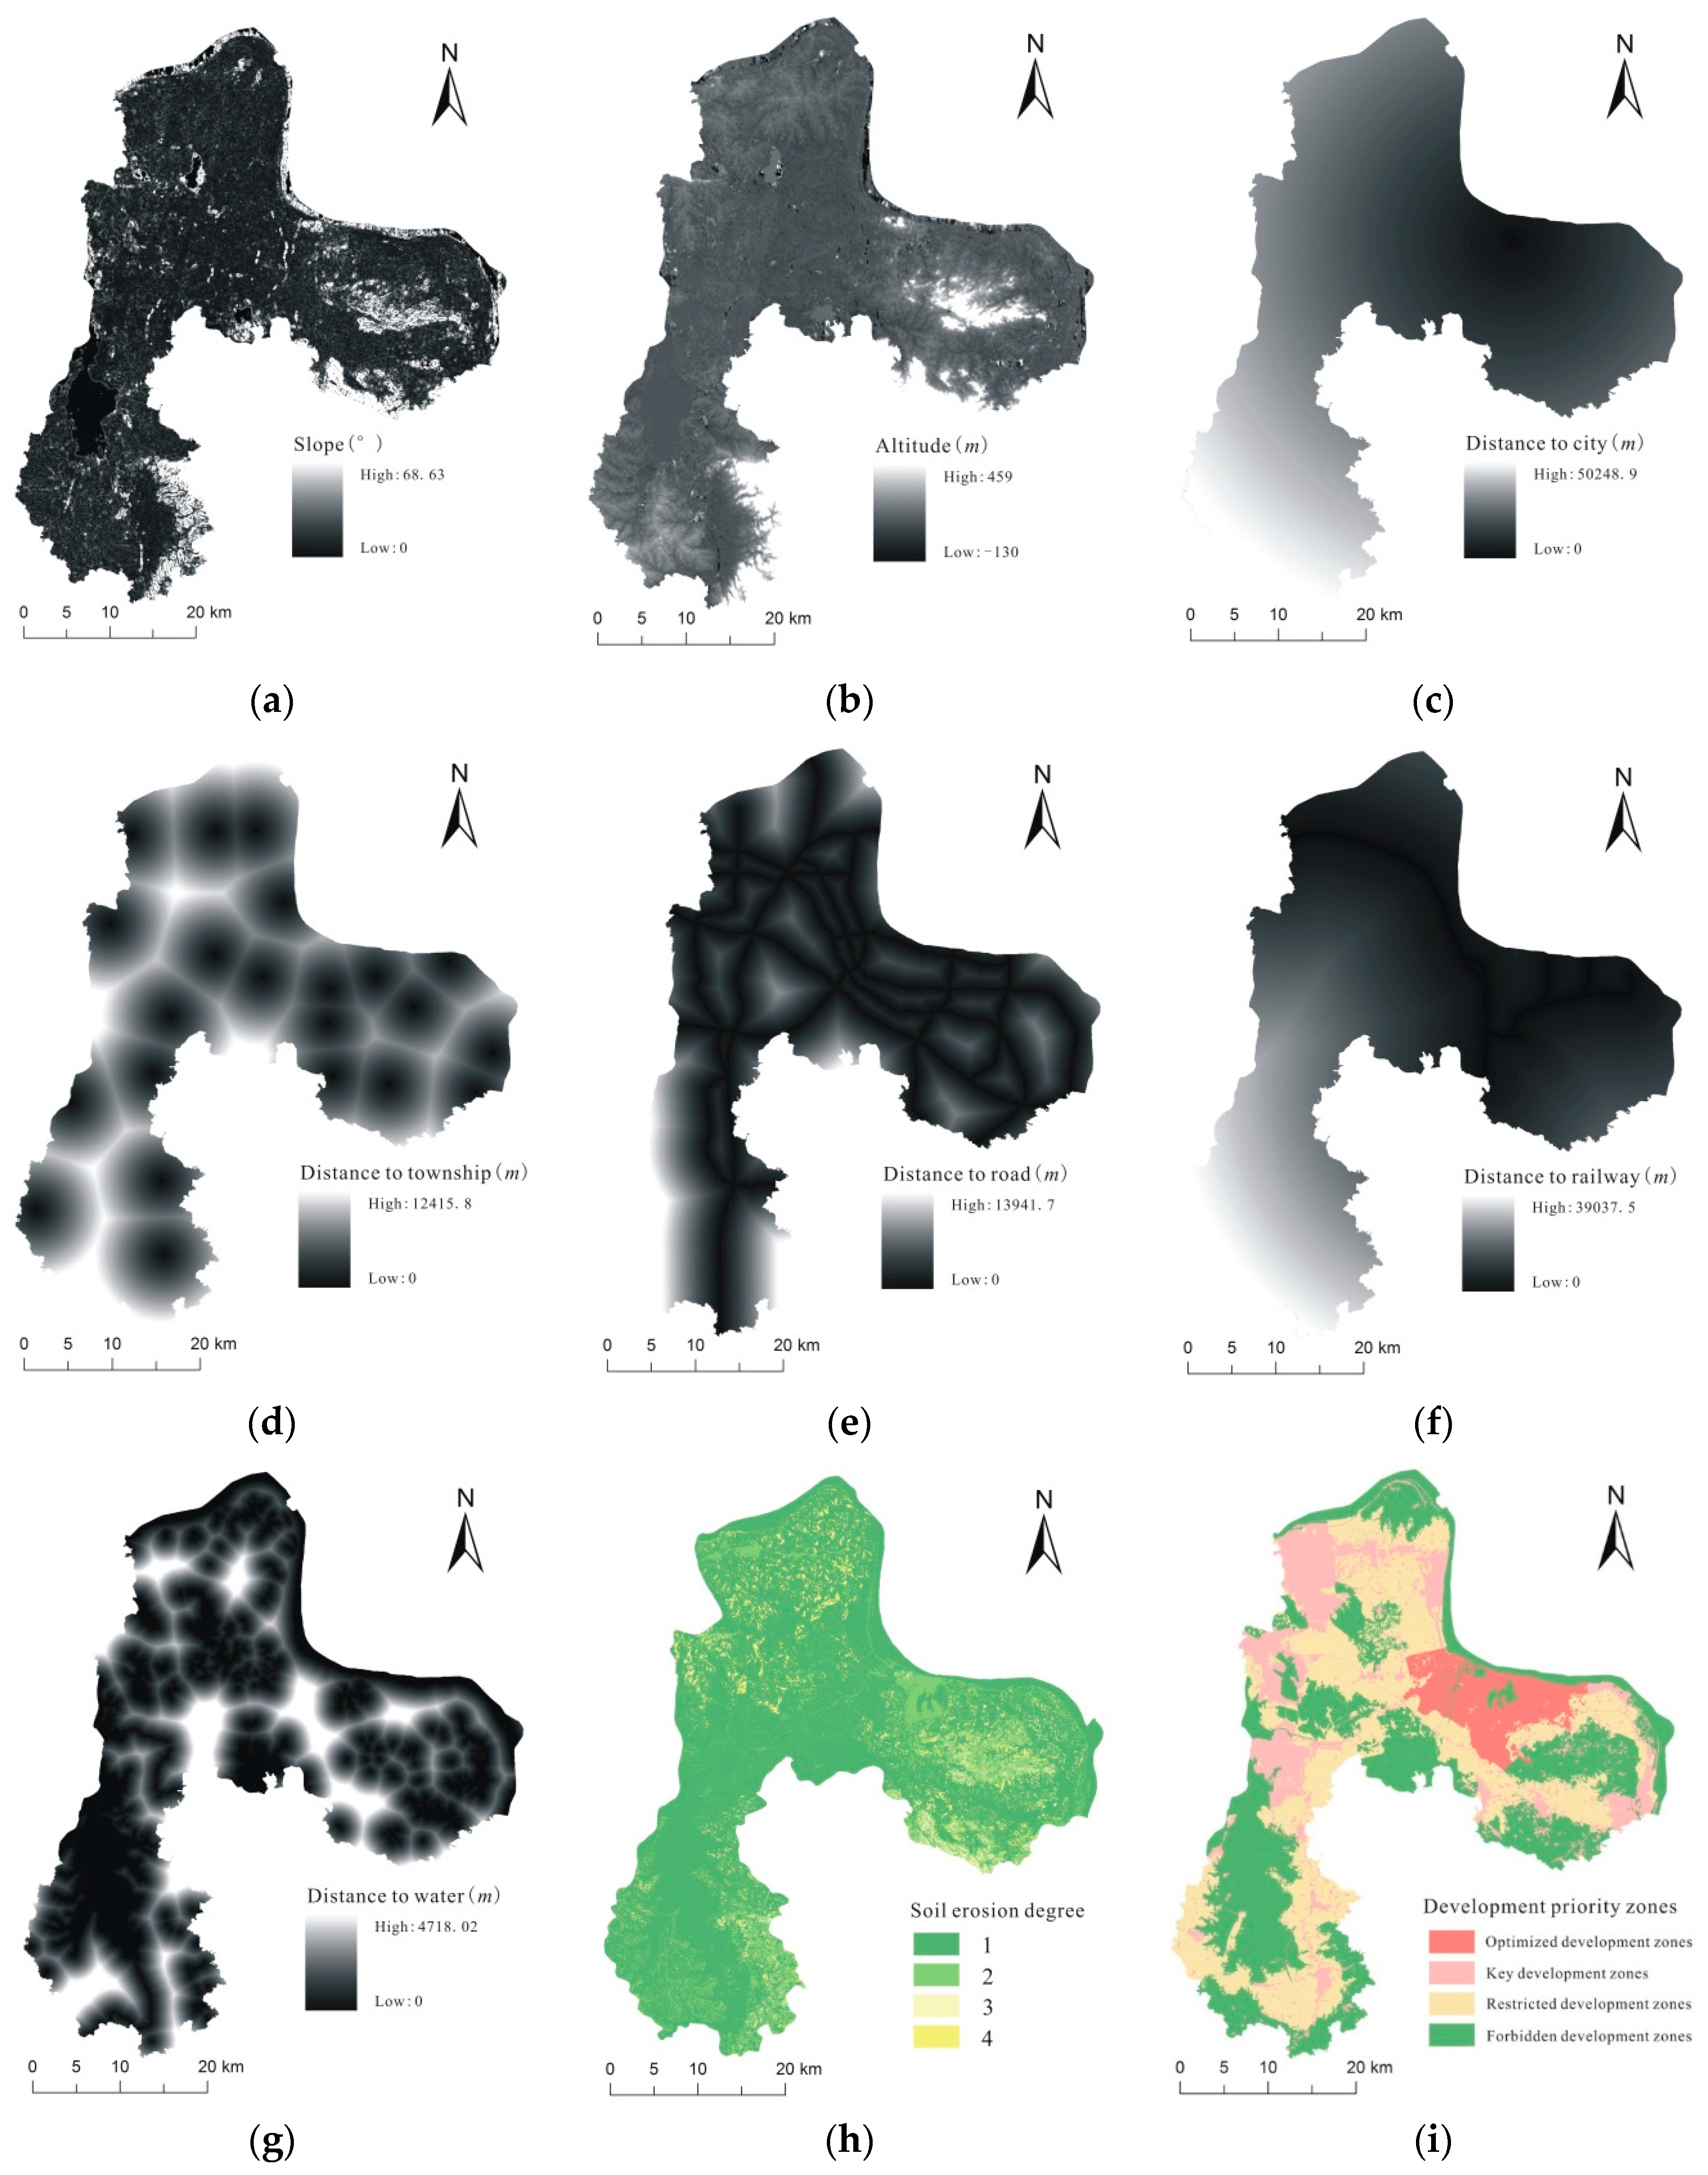
3.2. Data and Data Processing
3.2.1. Data
3.2.2. Variables’ Discretization
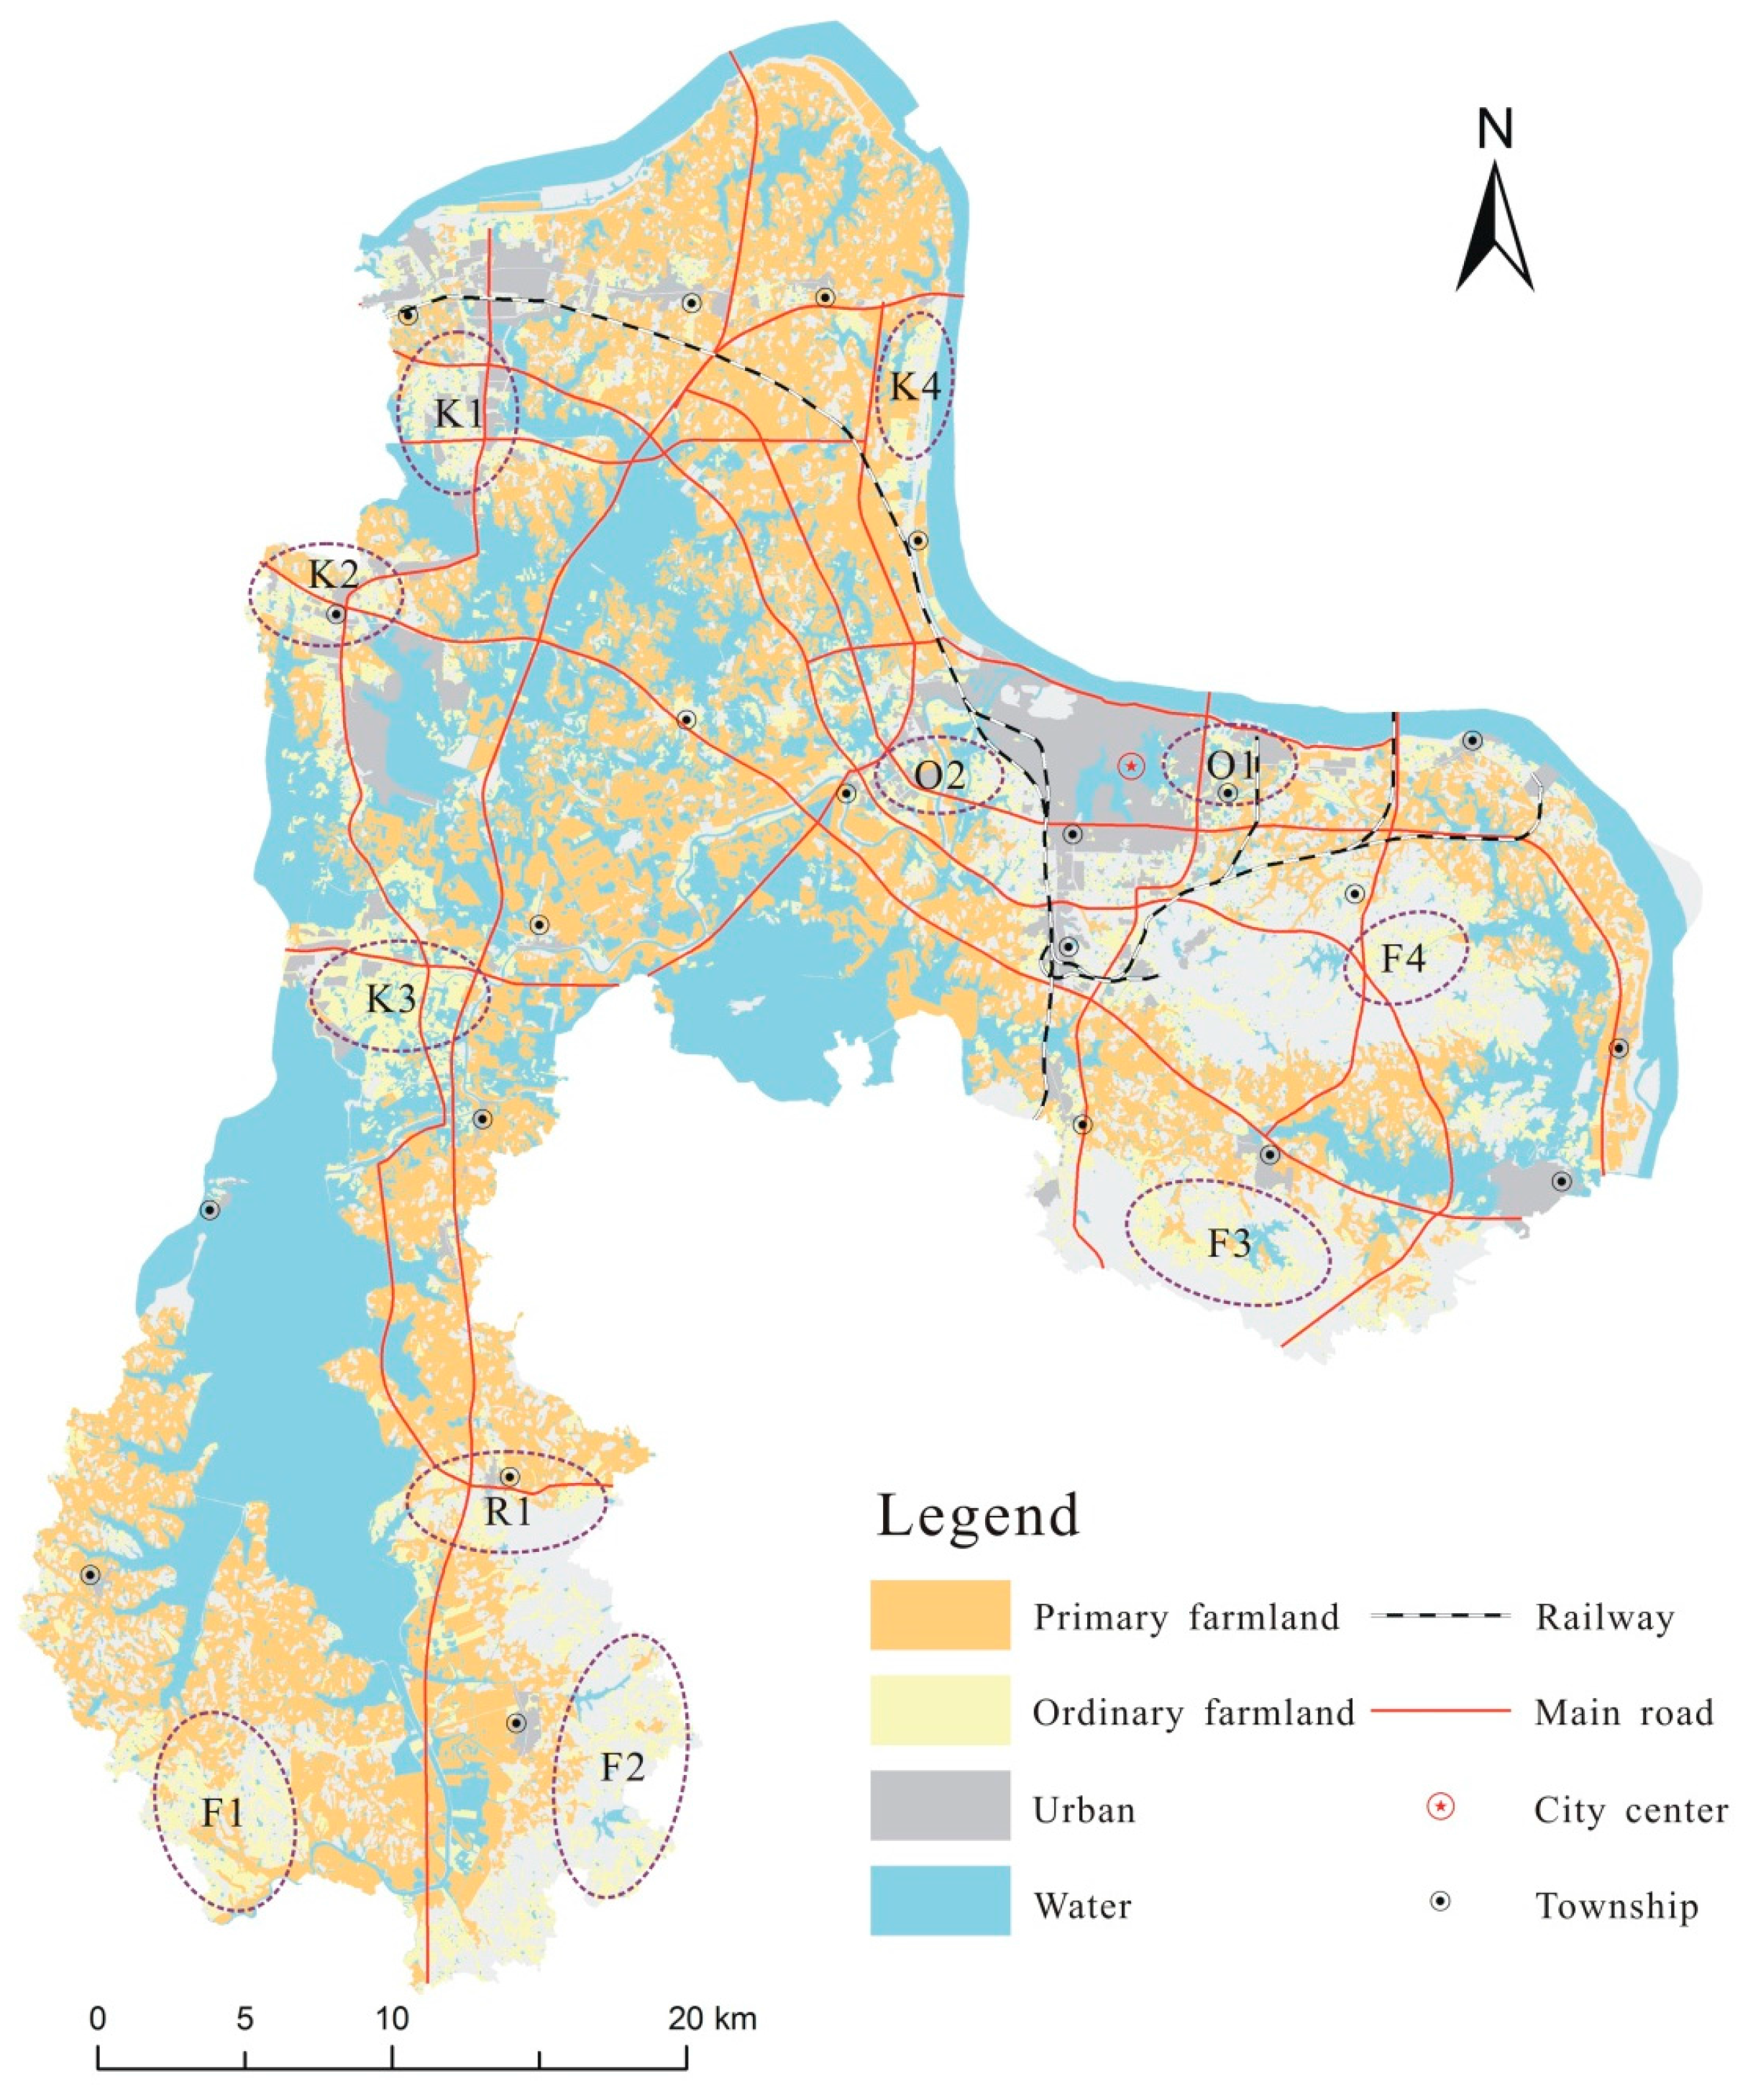
4. Results and Discussion
4.1. Results
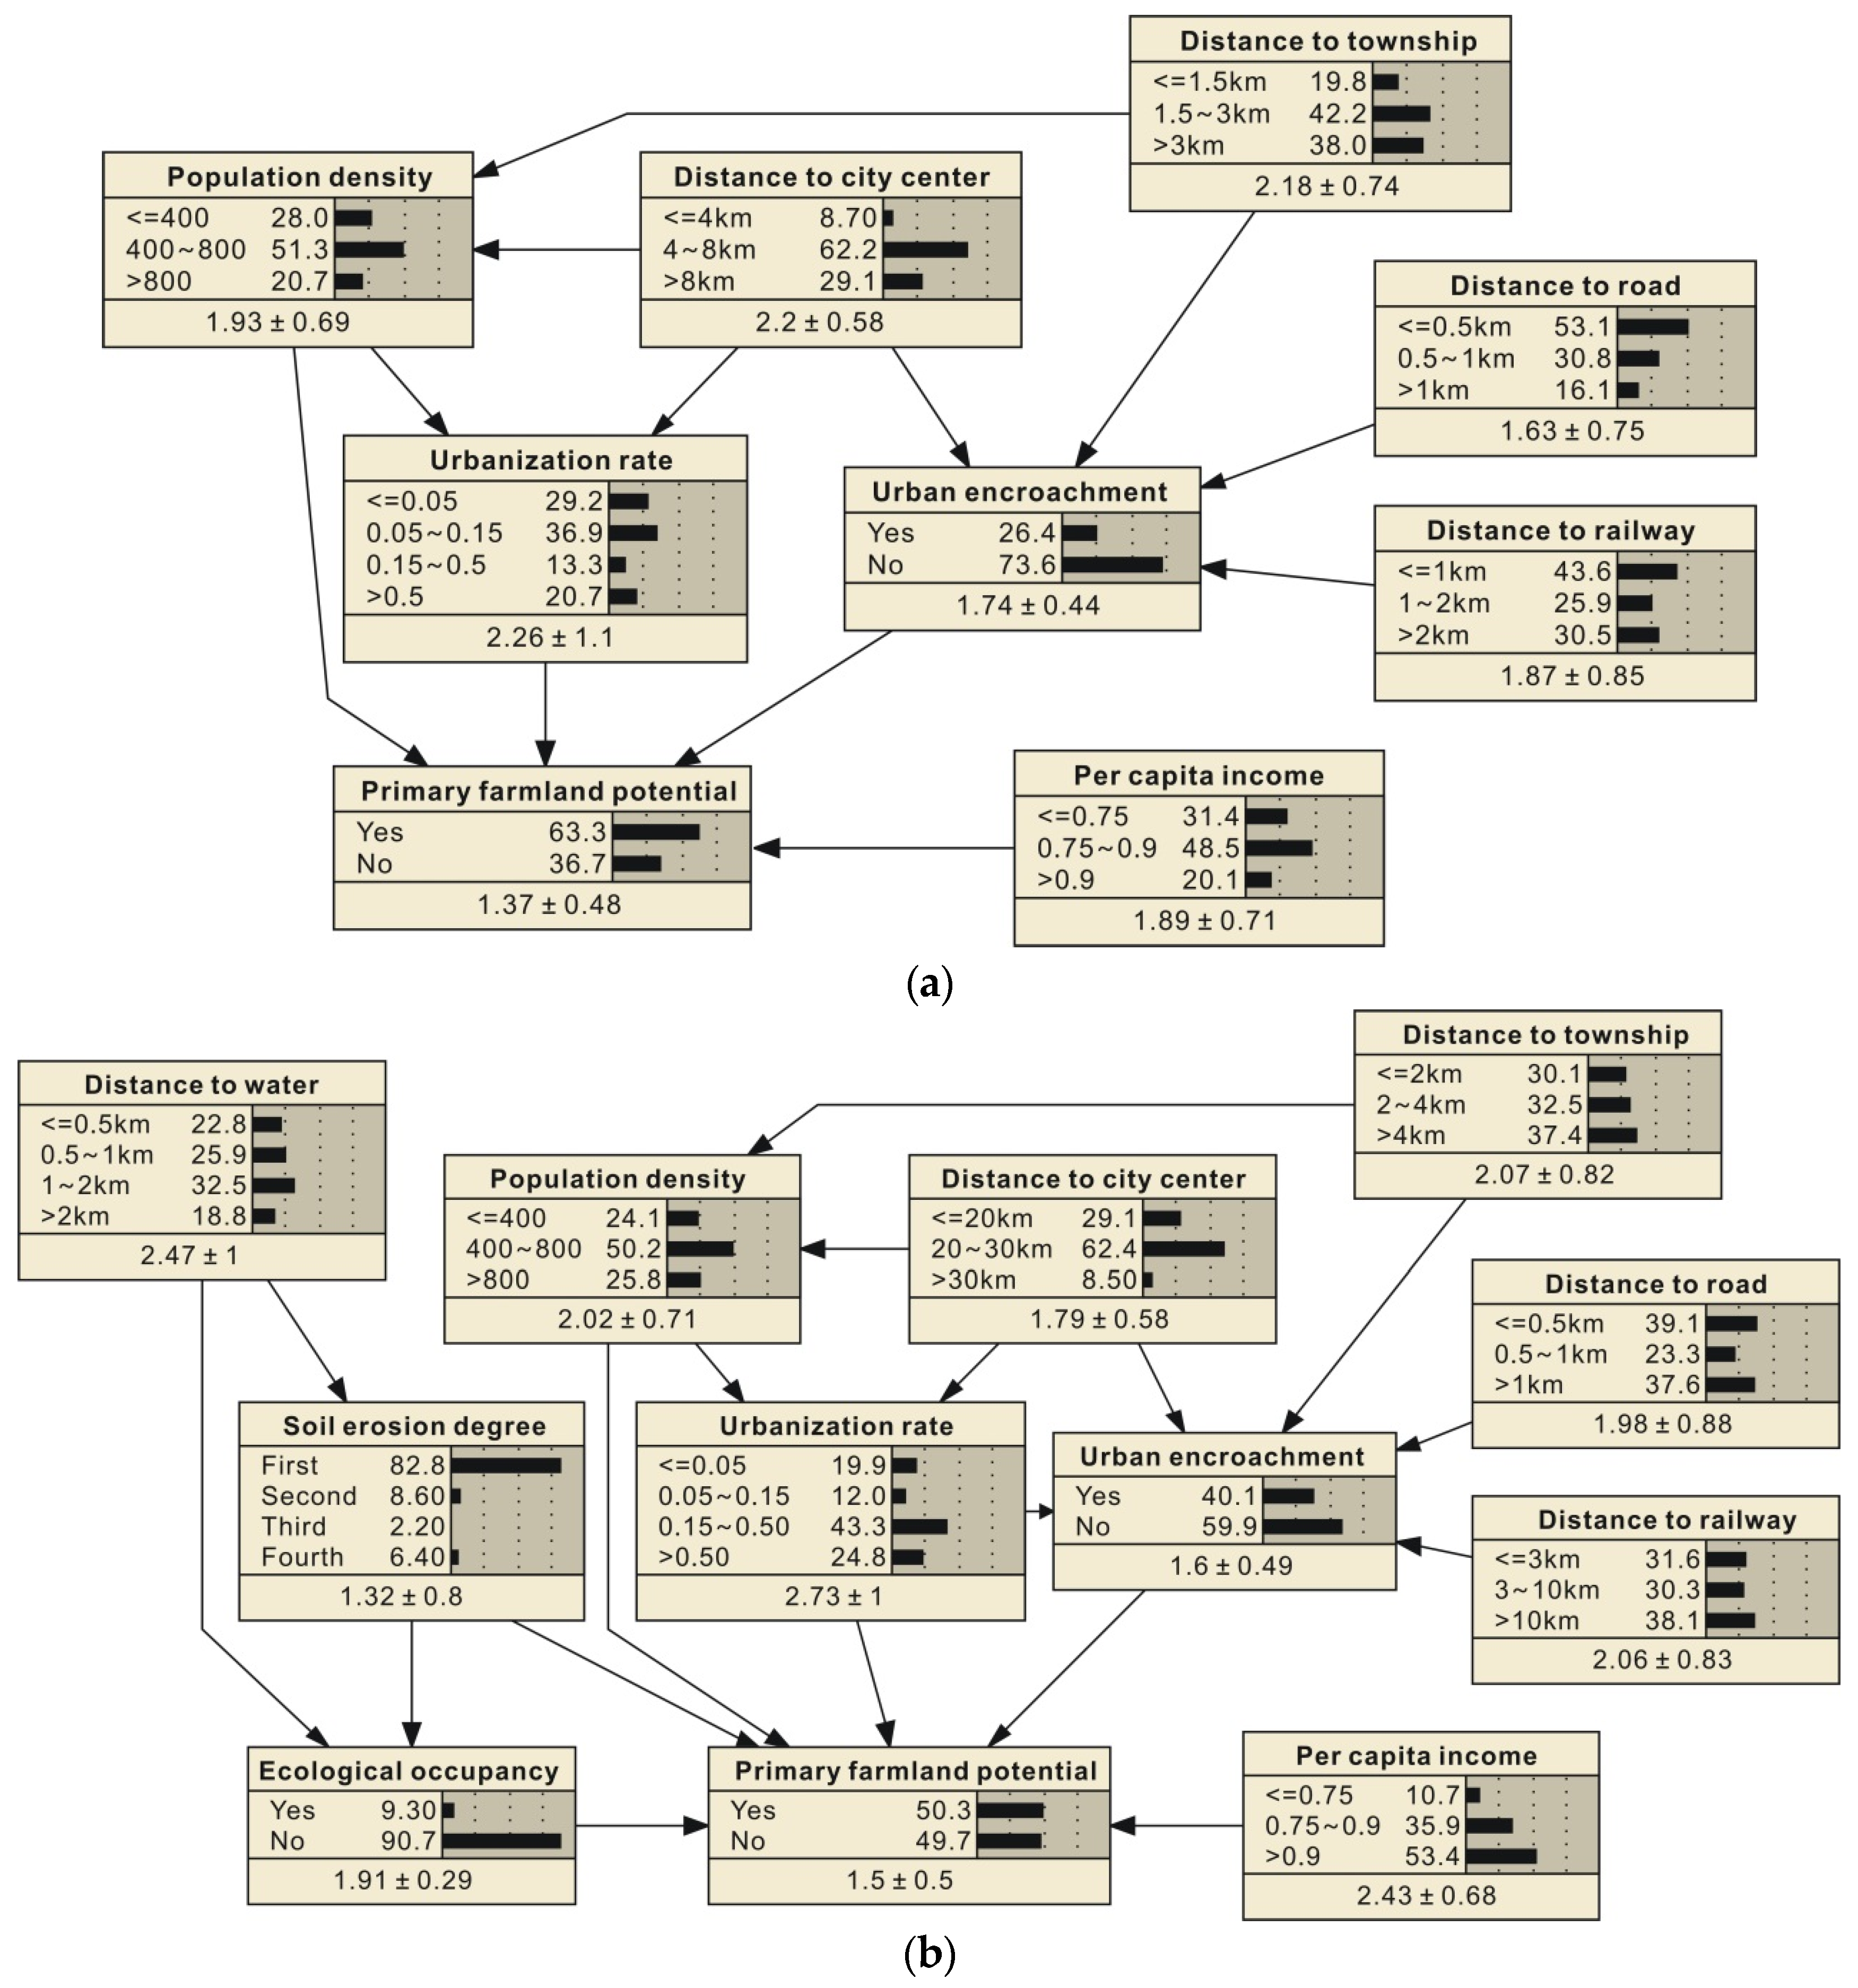
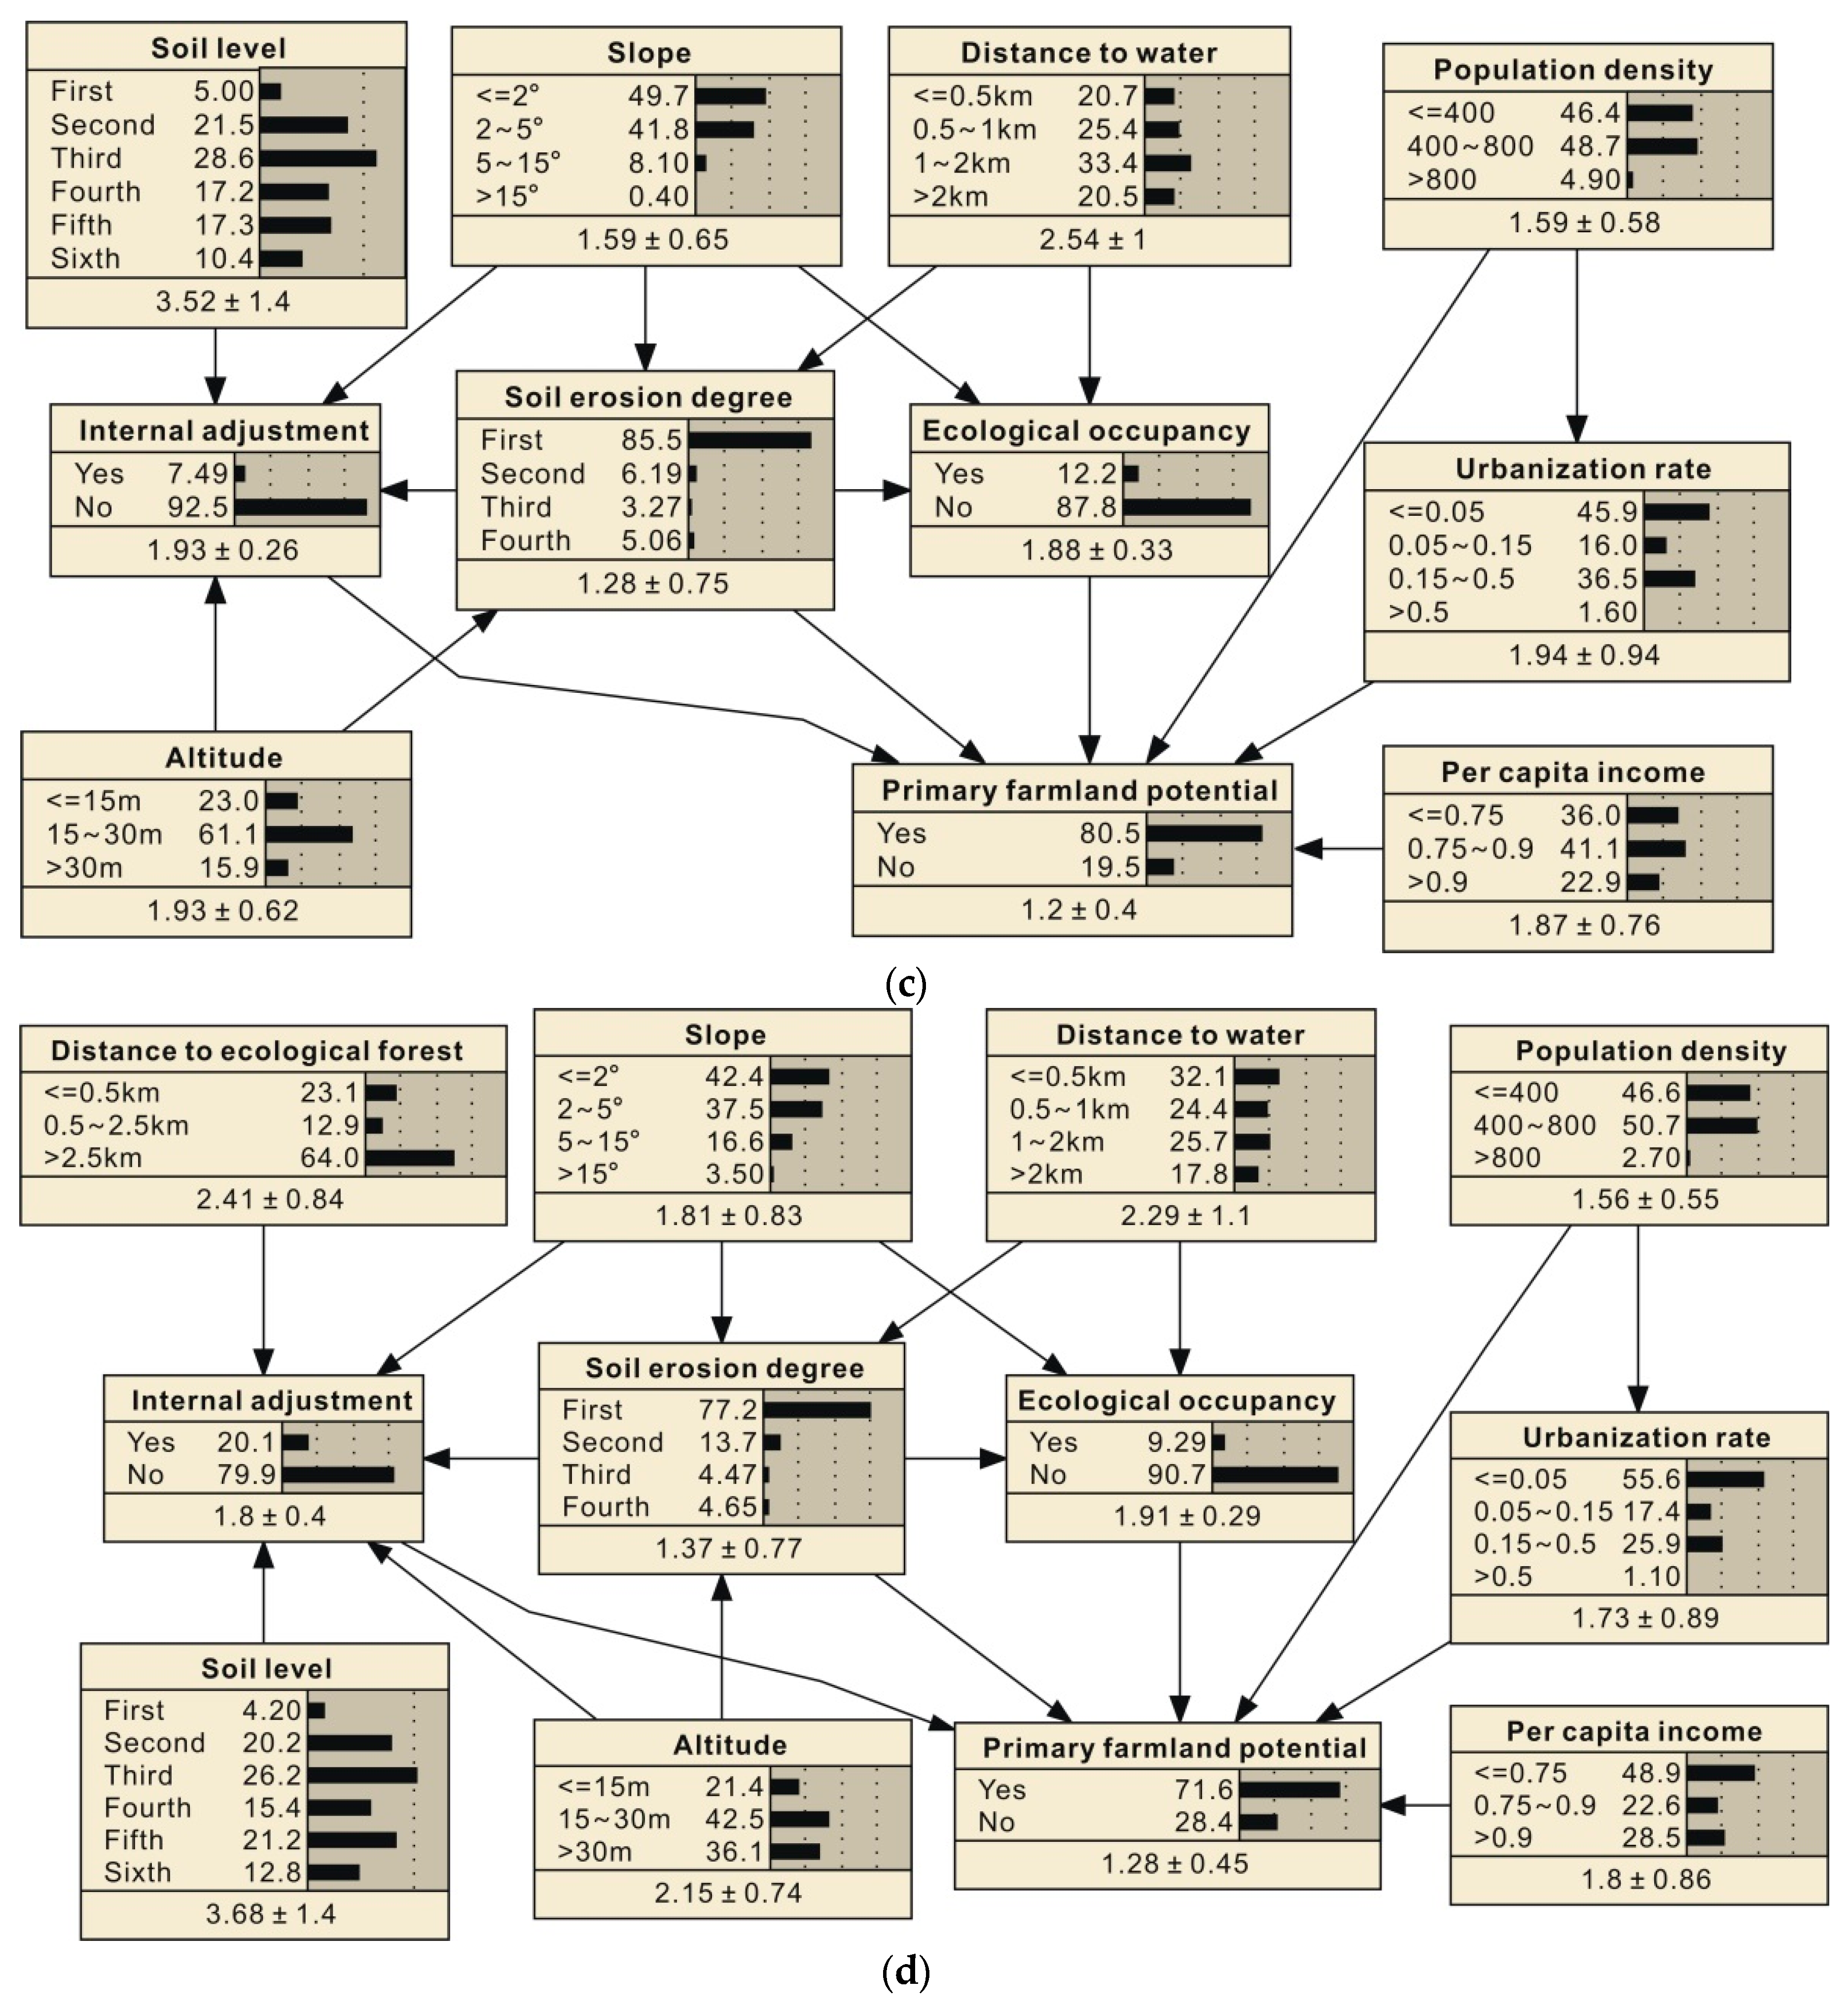
4.1.1. BN Model Training Results
4.1.2. Sensitivity Analysis Results
4.1.3. Scenario Simulation Results
4.1.4. Assessment Results
4.2. Discussion
5. Conclusions
Author Contributions
Conflicts of Interest
References
- Duke, J.M.; Lynch, L. Gauging support for innovative farmland preservation techniques. Policy Sci. 2007, 40, 123–155. [Google Scholar] [CrossRef]
- Liu, X.; Li, X.; Tan, Z.; Chen, Y. Zoning farmland protection under spatial constraints by integrating remote sensing, GIS and artificial immune systems. Int. J. Geogr. Inf. Sci. 2011, 25, 1829–1848. [Google Scholar] [CrossRef]
- Lichtenberg, E.; Ding, C. Local officials as land developers: Urban spatial expansion in China. J. Urban Econ. 2009, 66, 57–64. [Google Scholar] [CrossRef]
- He, J.; Liu, Y.; Yu, Y.; Tang, W.; Xiang, W.; Liu, D. A counterfactual scenario simulation approach for assessing the impact of farmland preservation policies on urban sprawl and food security in a major grain-producing area of China. Appl. Geogr. 2013, 37, 127–138. [Google Scholar] [CrossRef]
- Daniels, T.; Bowers, D. Holding Our Ground: Protecting America's Farms and Farmland; Island Press: Washington, DC, USA, 1997. [Google Scholar]
- Dorfman, J.H.; Barnett, B.J.; Bergstrom, J.C.; Lavigno, B. Searching for farmland preservation markets: Evidence from the Southeastern US. Land Use Policy 2009, 26, 121–129. [Google Scholar] [CrossRef]
- Lynch, L.; Gray, W.; Geoghegan, J. Are farmland preservation program easement restrictions capitalized into farmland prices? What can a propensity score matching analysis tell us? Appl. Econ. Perspect. Policy 2007, 29, 502–509. [Google Scholar] [CrossRef]
- Lichtenberg, E.; Ding, C. Assessing farmland protection policy in China. Land Use Policy 2008, 25, 59–68. [Google Scholar] [CrossRef]
- Huang, Q.; Lu, J.; Li, M.; Chen, Z.; Li, F. Developing planning measures to preserve farmland: A case study from China. Sustainability 2015, 7, 13011–13028. [Google Scholar] [CrossRef]
- Zhong, T.; Huang, X.; Zhang, X.; Scott, S.; Wang, K. The effects of basic arable land protection planning in Fuyang County, Zhejiang Province, China. Appl. Geogr. 2012, 35, 422–438. [Google Scholar] [CrossRef]
- Francis, C.A.; Hansen, T.E.; Fox, A.A.; Hesje, P.J.; Nelson, H.E.; Lawseth, A.E.; English, A. Farmland conversion to non-agricultural uses in the US and Canada: Current impacts and concerns for the future. Int. J. Agric. Sustain. 2012, 10, 8–24. [Google Scholar] [CrossRef]
- Zvomuya, F.; Janzen, H.H.; Larney, F.J.; Olson, B.M. A long-term field bioassay of soil quality indicators in a semiarid environment. Soil Sci. Soc. Am. J. 2008, 72, 683–692. [Google Scholar] [CrossRef]
- Song, W.; Pijanowski, B.C.; Tayyebi, A. Urban expansion and its consumption of high-quality farmland in Beijing, China. Ecol. Indic. 2015, 54, 60–70. [Google Scholar]
- King, R.N.; Lamb, J. Using land evaluation and site assessment (LESA) for farmland protection planning: A case study. J. Ext. 2001, 39, 4. [Google Scholar]
- Hoobler, B.M.; Vance, G.F.; Hamerlinck, J.D.; Munn, L.C.; Hayward, J.A. Applications of land evaluation and site assessment (LESA) and a geographic information system (GIS) in East Park County, Wyoming. J. Soil Water Conserv. 2003, 58, 105–112. [Google Scholar]
- Dung, E.J.; Sugumaran, R. Development of an agricultural land evaluation and site assessment (LESA) decision support tool using remote sensing and geographic information system. J. Soil Water Conserv. 2005, 60, 228–235. [Google Scholar]
- Tulloch, D.L.; Myers, J.R.; Hasse, J.E.; Parks, P.J.; Lathrop, R.G. Integrating GIS into farmland preservation policy and decision making. Landsc. Urban Plan. 2003, 63, 33–48. [Google Scholar] [CrossRef]
- Machado, E.A.; Stoms, D.M.; Davis, F.W.; Kreitler, J. Prioritizing farmland preservation cost-effectively for multiple objectives. J. Soil Water Conserv. 2006, 61, 250–258. [Google Scholar]
- Qian, F.K. Research of the basic farmland evaluation and protection. Adv. Mater. Res. 2014, 869, 88–90. [Google Scholar] [CrossRef]
- Daniels, T.L. Policies to preserve prime farmland in the USA: A comment. J. Rural Stud. 1990, 6, 331–336. [Google Scholar] [CrossRef]
- Mathews, L.G.; Rex, A. Incorporating scenic quality and cultural heritage into farmland valuation: Results from an Enhanced LESA Model. In Proceedings of the 2010 Annual Meeting, Denver, CO, USA, 25–27 July 2010.
- Li, X.; Yeh, A.G.O. Zoning land for agricultural protection by the integration of remote sensing, GIS, and cellular automata. Photogramm. Eng. Remote Sens. 2001, 67, 471–478. [Google Scholar]
- Zhang, R.; Li, J.; Du, Q.; Ren, F. Basic farmland zoning and protection under spatial constraints with a particle swarm optimisation multiobjective decision model: A case study of Yicheng, China. Environ. Plan. B Plan. Des. 2015, 42, 1098–1123. [Google Scholar] [CrossRef]
- Liu, T.; Liu, H.; Qi, Y. Construction land expansion and cultivated land protection in urbanizing China: Insights from national land surveys, 1996–2006. Habitat Int. 2015, 46, 13–22. [Google Scholar] [CrossRef]
- Wu, Y.; Peng, Y.; Zhang, X.; Skitmore, M.; Song, Y. Development priority zoning (DPZ)-led scenario simulation for regional land use change: The case of Suichang County, China. Habitat Int. 2012, 36, 268–277. [Google Scholar] [CrossRef]
- Liu, Y.; Yang, Z. New progress and its prospects of land resources sciences research in China. J. Nat. Resour. 2008, 23, 353–360. [Google Scholar]
- Su, S.; Jiang, Z.; Zhang, Q.; Zhang, Y. Transformation of agricultural landscapes under rapid urbanization: A threat to sustainability in Hang-Jia-Hu region, China. Appl. Geogr. 2011, 31, 439–449. [Google Scholar] [CrossRef]
- Xie, H.; Wang, P.; Yao, G. Exploring the dynamic mechanisms of farmland abandonment based on a spatially explicit economic model for environmental sustainability: A case study in Jiangxi Province, China. Sustainability 2014, 6, 1260–1282. [Google Scholar] [CrossRef]
- Pearl, J. Causality: Models, Reasoning, and Inference, 2nd ed.; Cambridge University Press: New York, NY, USA, 2009. [Google Scholar]
- Frayer, J.; Sun, Z.; Müller, D.; Munroe, D.K.; Xu, J. Analyzing the drivers of tree planting in Yunnan, China, with Bayesian networks. Land Use Policy 2014, 36, 248–258. [Google Scholar] [CrossRef]
- Newton, A.; Marshall, E.; Schreckenberg, K.; Golicher, D.; te Velde, D.W.; Edouard, F.; Arancibia, E. Use of a Bayesian belief network to predict the impacts of commercializing non-timber forest products on livelihoods. Ecol. Soc. 2007, 11, 24. [Google Scholar]
- Sun, Z.; Müller, D. A framework for modeling payments for ecosystem services with agent-based models, Bayesian belief networks and opinion dynamics models. Environ. Model. Softw. 2013, 45, 15–28. [Google Scholar] [CrossRef]
- Prato, T. Multiple attribute evaluation of landscape management. J. Environ. Manag. 2000, 60, 325–337. [Google Scholar] [CrossRef]
- Alix-Garcia, J.; Kuemmerle, T.; Radeloff, V.C. Prices, land tenure institutions, and geography: A matching analysis of farmland abandonment in post-socialist Eastern Europe. Land Econ. 2012, 88, 425–443. [Google Scholar] [CrossRef]
- Smith, C.S.; Howes, A.L.; Price, B.; McAlpine, C.A. Using a Bayesian belief network to predict suitable habitat of an endangered mammal—The Julia Creek dunnart (Sminthopsis douglasi). Biol. Conserv. 2007, 139, 333–347. [Google Scholar] [CrossRef]
- Ticehurst, J.L.; Curtis, A.; Merritt, W.S. Using Bayesian networks to complement conventional analyses to explore landholder management of native vegetation. Environ. Model. Softw. 2011, 26, 52–65. [Google Scholar] [CrossRef]
- Aalders, I. Modeling land-use decision behavior with Bayesian belief networks. Ecol. Soc. 2008, 13, 439–461. [Google Scholar]
- Lynch, A. Is it good to be green? Assessing the ecological results of county green infrastructure planning. J. Plan. Educ. Res. 2016, 36, 90–104. [Google Scholar] [CrossRef]
- Pollino, C.A.; Woodberry, O.; Nicholson, A.; Korb, K.; Hart, B.T. Parameterisation and evaluation of a Bayesian network for use in an ecological risk assessment. Environ. Model. Softw. 2007, 22, 1140–1152. [Google Scholar] [CrossRef]


| Scale | Variable Classification | Variable Name | ODZ | KDZ | RDZ | FDZ | Description |
|---|---|---|---|---|---|---|---|
| Township level | Socioeconomic variables | Urbanization rate | √ | √ | √ | √ | Proportion of non-agriculture population |
| Per capita income | √ | √ | √ | √ | Pure income per capita | ||
| Population density | √ | √ | √ | √ | Average population of per square kilometer | ||
| Parcel level | Suitability variables | Slope | √ | √ | Slope of farmland | ||
| Altitude | √ | √ | Altitude of farmland | ||||
| Soil level | √ | √ | Farmland productivity potential | ||||
| Soil erosion degree | √ | √ | √ | Soil erosion degree of farmland | |||
| Distance to water | √ | √ | √ | Distance to nearest river, lake or pool | |||
| Distance to road | √ | √ | Distance to nearest main road | ||||
| Distance to railway | √ | √ | Distance to nearest railway | ||||
| Distance to city center | √ | √ | Distance to city center | ||||
| Distance to township | √ | √ | Distance to town center | ||||
| Distance to ecological forest | √ | Distance to nearest ecological forest | |||||
| Historical change variables | Urban encroachment | √ | √ | Transfer from farmland to construction land | |||
| Internal adjustment | √ | √ | Transfer from farmland to other agriculture land | ||||
| Ecological occupancy | √ | √ | √ | Transfer from farmland to ecological land, including water and unused land | |||
| Target variable | Primary farmland potential | √ | √ | √ | √ | Potential of farmland as primary farmland preservation |
| Variable Names | Value Type | Classification Code | |||||
|---|---|---|---|---|---|---|---|
| 1 | 2 | 3 | 4 | 5 | 6 | ||
| Urbanization rate (%) | Continuous | ≤0.05 | 0.05–0.15 | 0.15–0.5 | >0.5 | ||
| Per capita income (%) | Continuous | ≤0.75 | 0.75–0.9 | >0.9 | |||
| Population density (per square kilometers) | Continuous | ≤500 | 500–1000 | >1000 | |||
| Slope (°) | Continuous | 0–2 | 2–5 | 5–15 | >15 | ||
| Altitude (m) | Continuous | ≤15 | 15–30 | >30 | |||
| Soil level | Discrete | 1 | 2 | 3 | 4 | 5 | 6 |
| Soil erosion degree | Discrete | 1 | 2 | 3 | 4 | ||
| Distance to water (km) | Continuous | ≤0.5 | 0.5–1 | 1–2 | >2 | ||
| Distance to road (km) | Continuous | ≤0.5 | 0.5–1 | >1 | |||
| Distance to ecological forest (km) | Continuous | ≤0.5 | 0.5–2.5 | >2.5 | |||
| Urban encroachment | Discrete | Yes | No | ||||
| Internal adjustment | Discrete | Yes | No | ||||
| Ecological occupancy | Discrete | Yes | No | ||||
| Primary farmland potential | Discrete | Yes | No | ||||
| ODZ | |||||||
| Distance to railway (km) | Continuous | ≤1 | 1–2 | >2 | |||
| Distance to city center (km) | Continuous | ≤4 | 4–8 | >8 | |||
| Distance to town center (km) | Continuous | ≤1.5 | 1.5–3 | >3 | |||
| KDZ | |||||||
| Distance to railway (km) | Continuous | ≤3 | 3–10 | >10 | |||
| Distance to city center (km) | Continuous | ≤20 | 20–30 | >30 | |||
| Distance to town center (km) | Continuous | ≤2 | 2–4 | >4 | |||
| Variable Classification | Variable Name | Variance Reduction (%) | |||
|---|---|---|---|---|---|
| OPZ | KPZ | RDZ | FDZ | ||
| Suitability variables | Slope | 0.34 | 0.84 | ||
| Altitude | 0.40 | 1.68 | |||
| Soil level | 0.07 | 0.23 | |||
| Soil erosion degree | 0.10 | 0.15 | 2.13 | ||
| Distance to water | 0.01 | 0.50 | 0.19 | ||
| Distance to road | 0.05 | 0.14 | |||
| Distance to railway | 0.04 | 0.13 | |||
| Distance to city center | 0.34 | 0.34 | |||
| Distance to township | 0.06 | 0.01 | |||
| Distance to ecological forest | 0.64 | ||||
| Socioeconomic variables | Urbanization rate | 0.21 | 0.13 | 0.46 | 0.18 |
| Per capita income | 0.16 | 0.17 | 1.56 | 0.70 | |
| Population density | 0.26 | 0.05 | 1.06 | 0.40 | |
| Historical change variables | Urban encroachment | 10.1 | 26.8 | ||
| Internal adjustment | 9.3 | 24.5 | |||
| Ecological occupancy | 1.6 | 29.7 | 13.0 | ||
| Zones | Farmland Loss Ratio | Main Driver | Primary Farmland Ratio | Average Area of Primary Farmland Parcels (km2) |
|---|---|---|---|---|
| ODZ | 36.7% | Urban encroachment | 44.70% | 0.46 |
| KDZ | 49.7% | Urban encroachment | 38.86% | 0.23 |
| RDZ | 19.5% | Ecological occupancy | 88.21% | 1.25 |
| FDZ | 28.4% | Internal adjustment | 68.74% | 0.91 |
© 2016 by the authors; licensee MDPI, Basel, Switzerland. This article is an open access article distributed under the terms and conditions of the Creative Commons Attribution (CC-BY) license (http://creativecommons.org/licenses/by/4.0/).
Share and Cite
He, J.; Guan, X.; Yu, Y. A Modeling Approach for Farmland Protection Zoning Considering Spatial Heterogeneity: A Case Study of E-Zhou City, China. Sustainability 2016, 8, 1052. https://doi.org/10.3390/su8101052
He J, Guan X, Yu Y. A Modeling Approach for Farmland Protection Zoning Considering Spatial Heterogeneity: A Case Study of E-Zhou City, China. Sustainability. 2016; 8(10):1052. https://doi.org/10.3390/su8101052
Chicago/Turabian StyleHe, Jianhua, Xiaodong Guan, and Yan Yu. 2016. "A Modeling Approach for Farmland Protection Zoning Considering Spatial Heterogeneity: A Case Study of E-Zhou City, China" Sustainability 8, no. 10: 1052. https://doi.org/10.3390/su8101052
APA StyleHe, J., Guan, X., & Yu, Y. (2016). A Modeling Approach for Farmland Protection Zoning Considering Spatial Heterogeneity: A Case Study of E-Zhou City, China. Sustainability, 8(10), 1052. https://doi.org/10.3390/su8101052