
Research on Steady States of Fuzzy Cognitive Map and its Application in Three-Rivers Ecosystem

Abstract
:1. Introduction
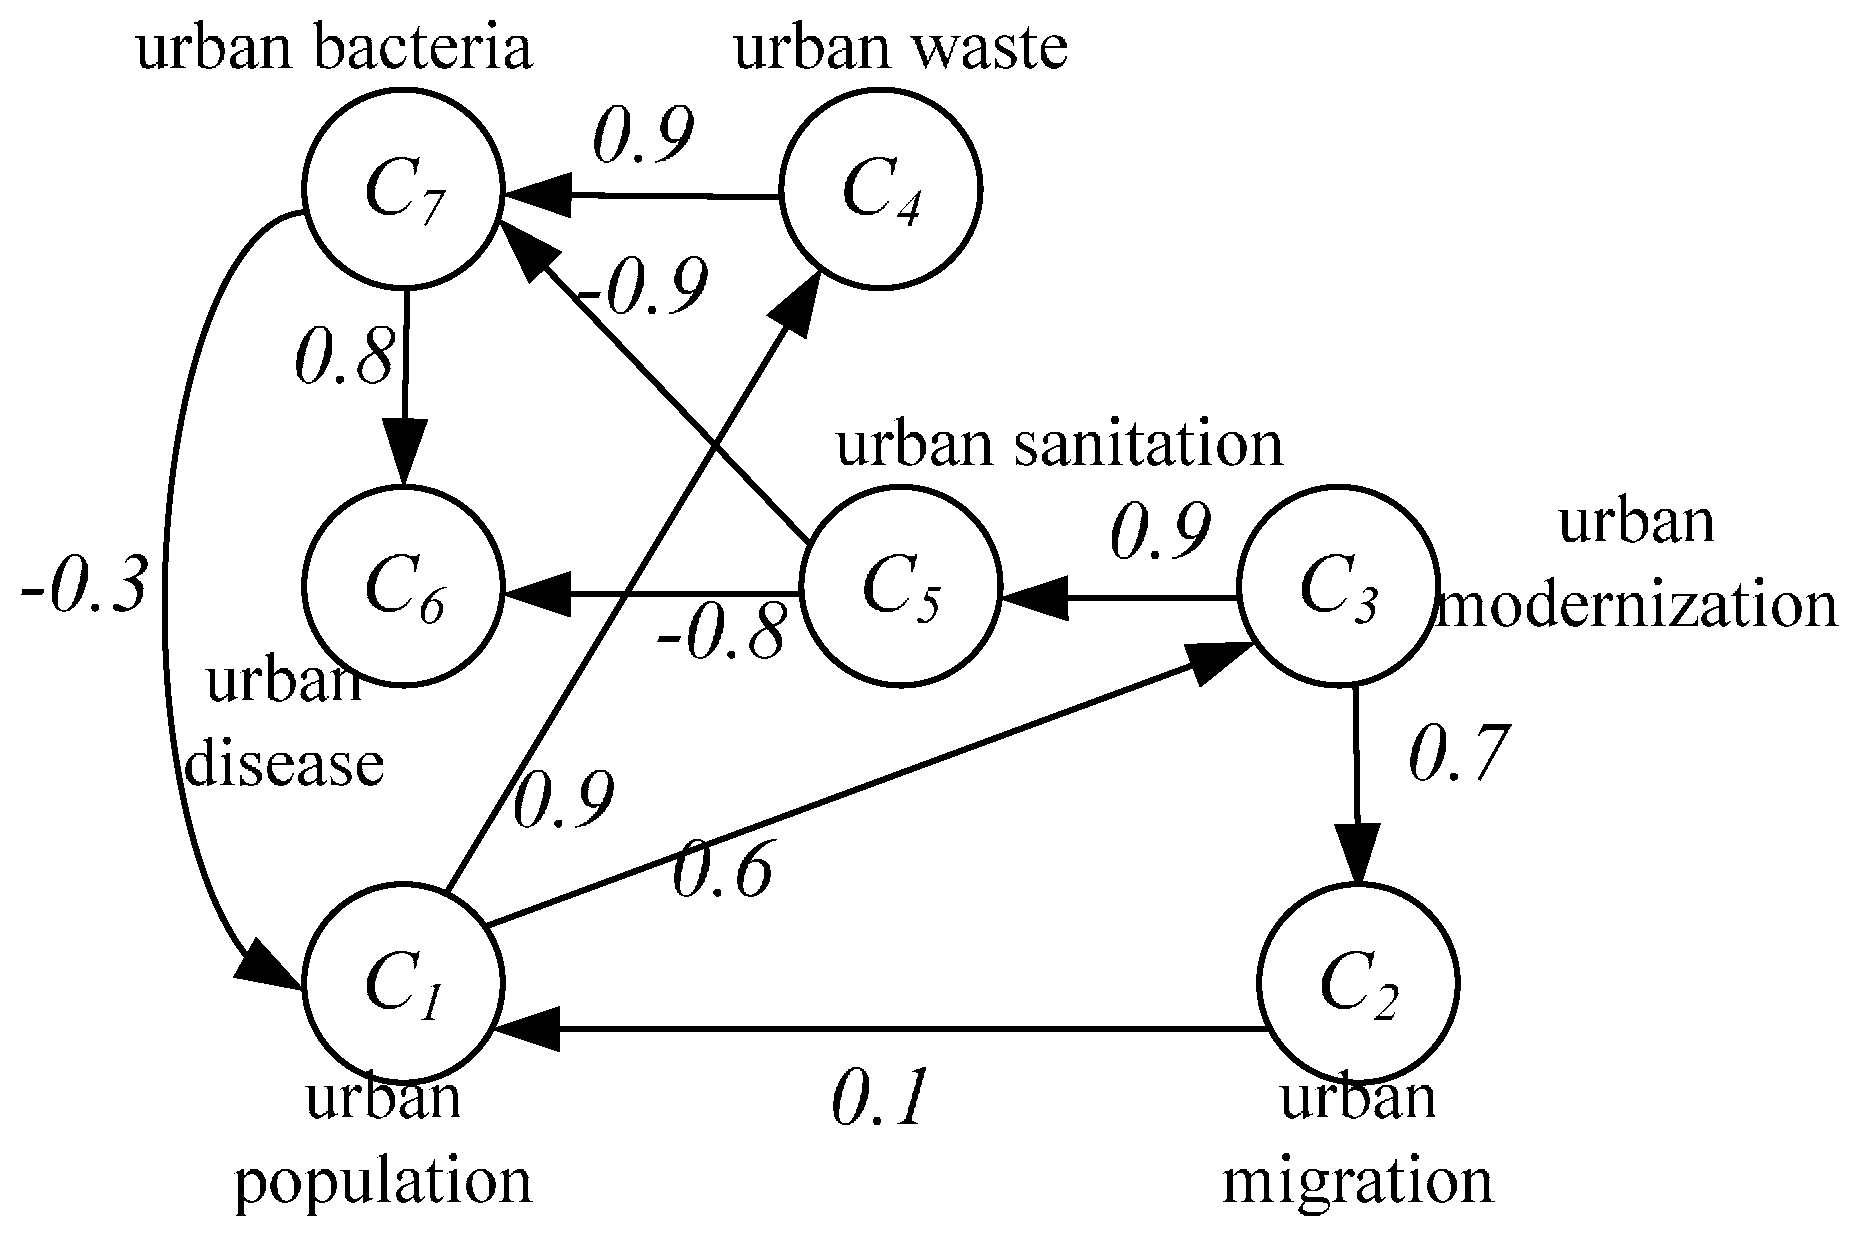
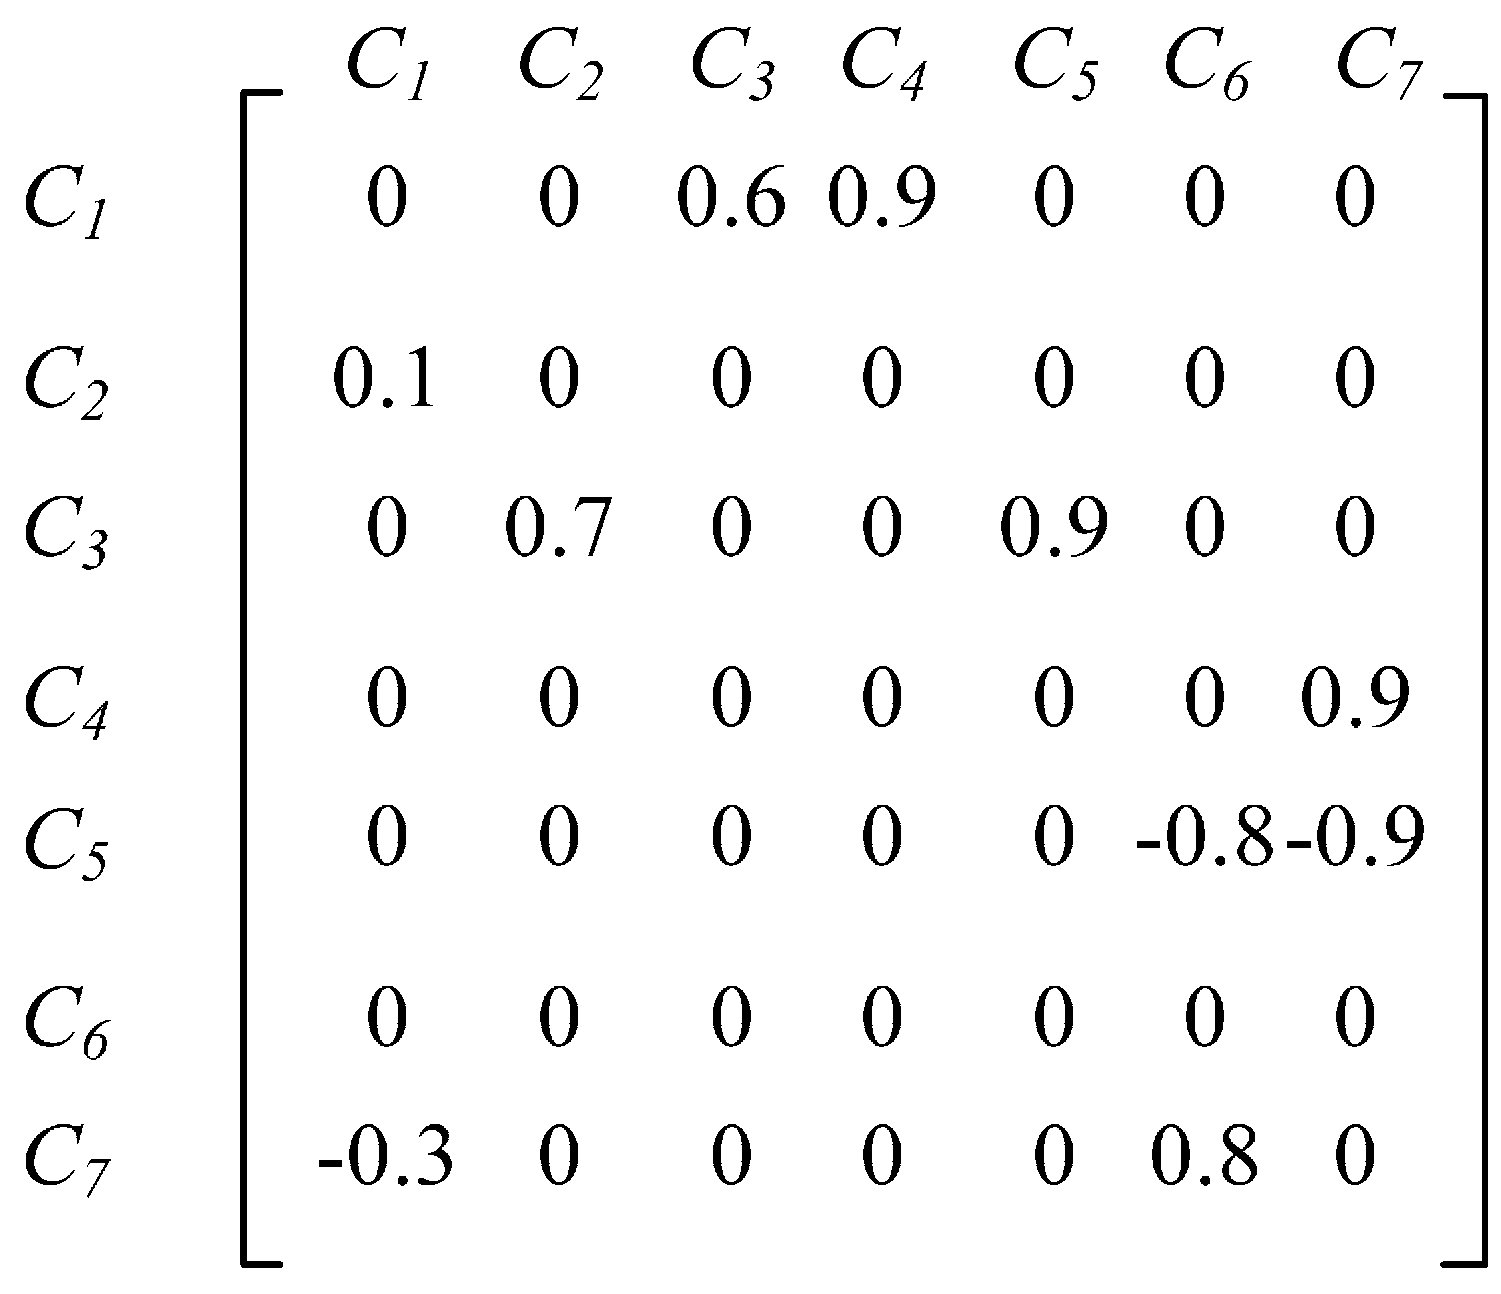
2. FCM
- If there is positive causality between concepts Ci and Cj, wij > 0. An increase of the value of concept Ci will cause an increase of the value of concept Cj. A decrease of the value of Ci will lead to a decrease of the value of Cj.
- If there is inverse causality between the two concepts, wij < 0. An increase of the value of concept Ci will cause a decrease of the value of the second concept. A decrease of the value of concept Ci will cause an increase of the value of the concept Cj.
- If there is no relationship between the two concepts, wij = 0.
3. Steady States of the Fuzzy Cognitive Map
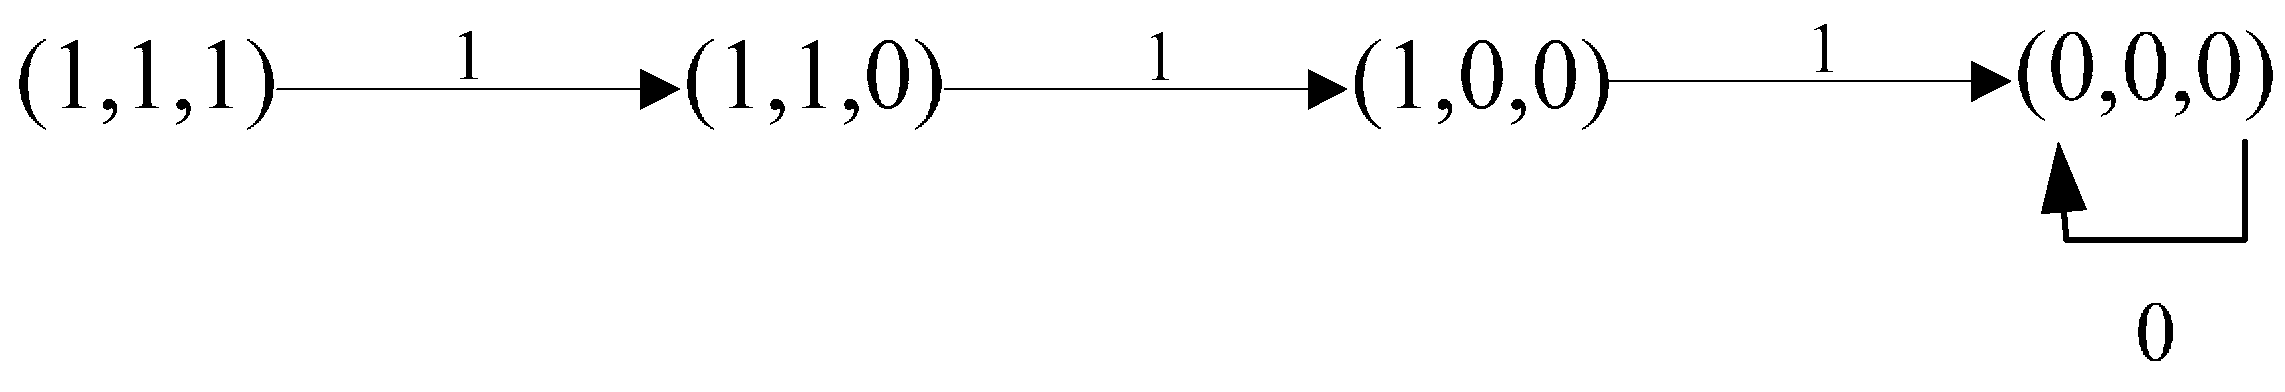
3.1. Fixed Point of the FCM
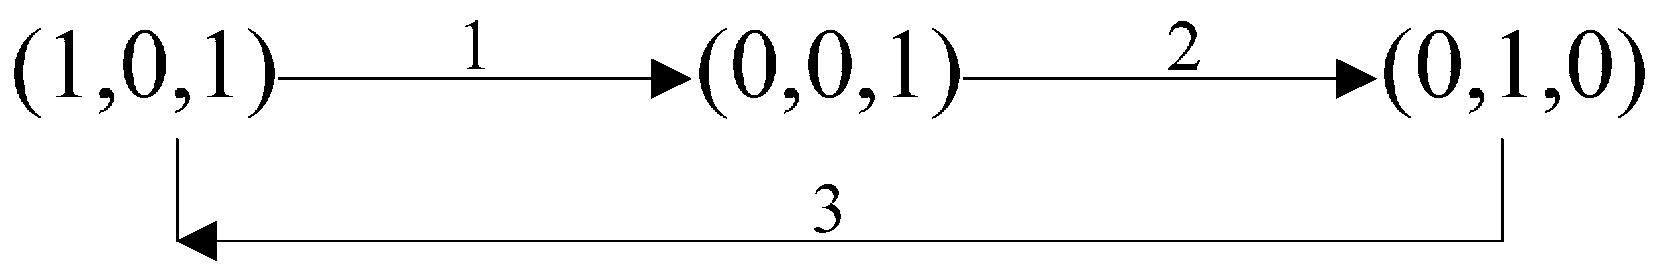
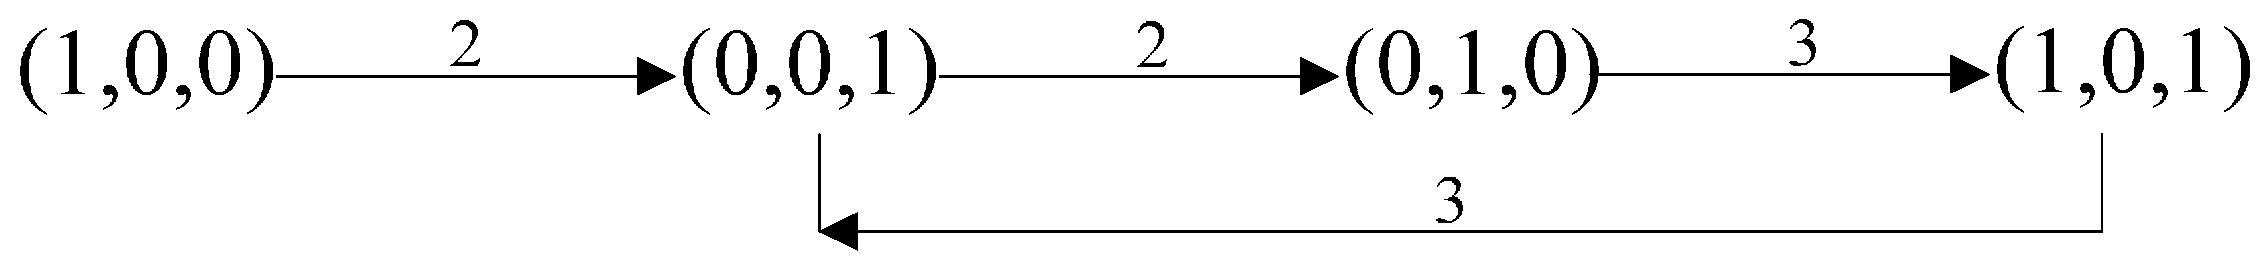
3.2. Limited Cycle of the FCM
4. The Application in Three-Rivers Ecosystem
4.1. FCM Modeling Three-Rivers EcosystemBased on NHL
4.2. Sustainability Analysis of theThree-Rivers Ecosystem Based on the FCM
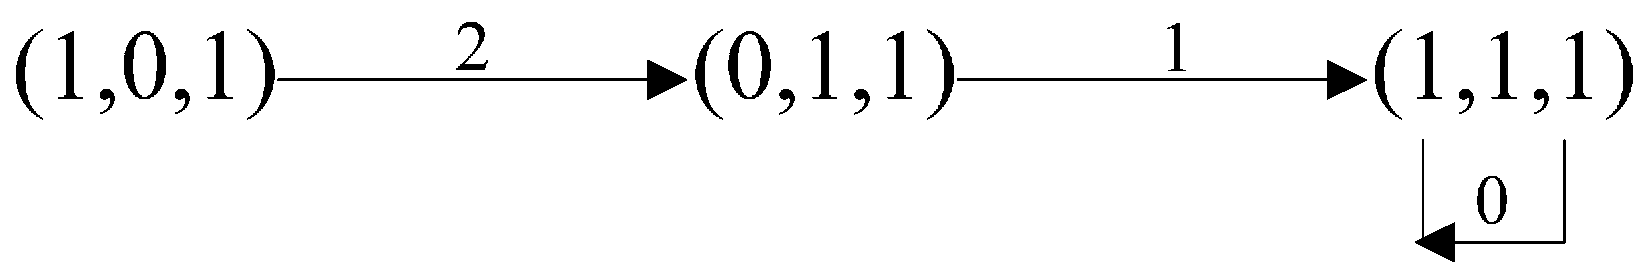
4.2.1. Situation 1: If The Initial State is (1, 0, 1) and The Threshold Value T = 0, What May Happen in The System?
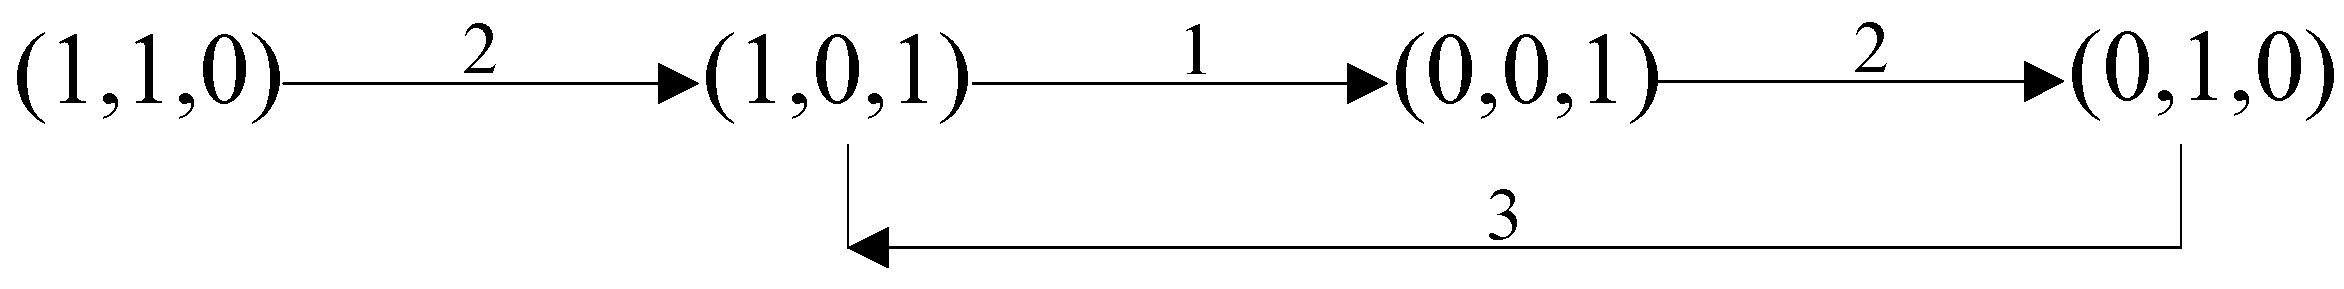
4.2.2. Situation2: What Will Happen with Other Initial States?

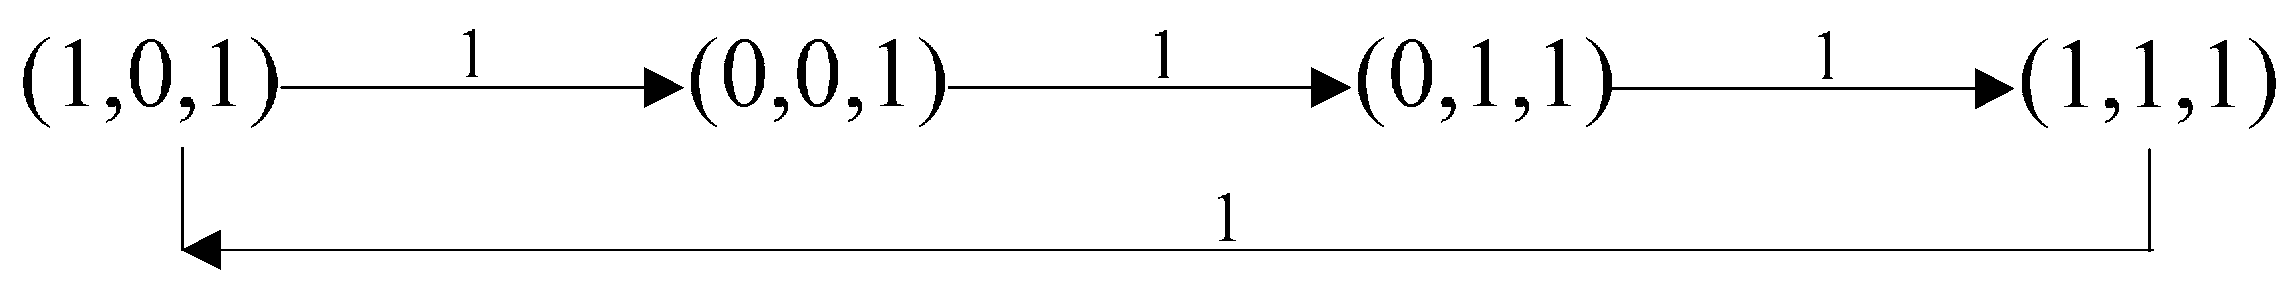
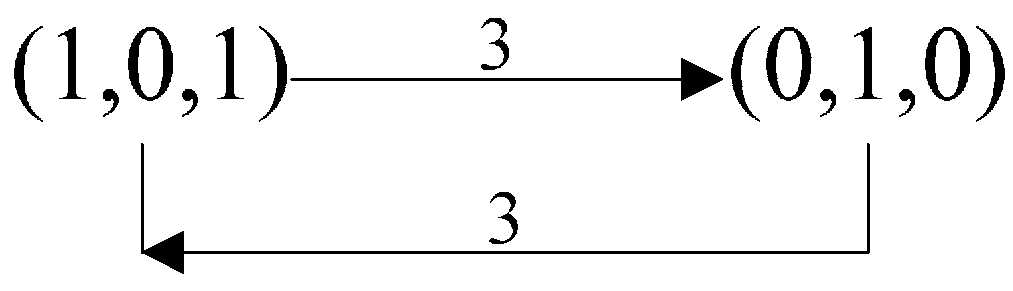
4.2.3. Situation3: If the Datum Line T of Evaluation Increases or Decreases, What Will Happen?
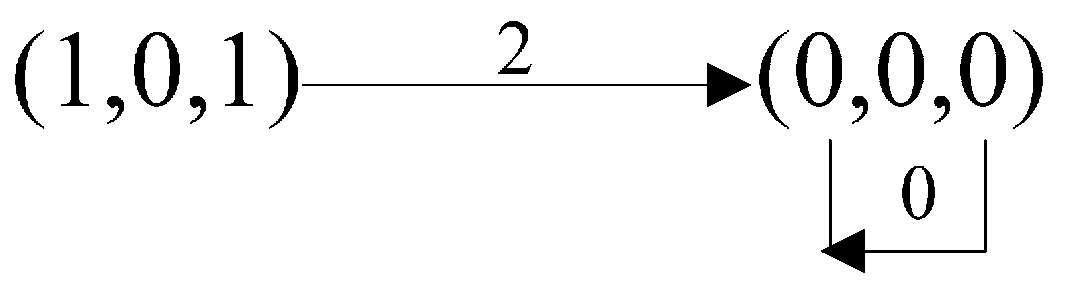
4.2.4. Situation4: In the System, What Must Not Happen?
5. Conclusions
Acknowledgments
Author Contributions
Conflicts of Interest
Appendix
References
- Kosko, B. Fuzzy cognitive maps. Int. J. Man–Mach. Stud. 1986, 24, 65–75. [Google Scholar] [CrossRef]
- Stylios, C.D.; Gmumpca, P.P. Fuzzy cognitive maps: A soft computing technique for intelligent contro1. In Proceedings of the IEEE International Symposium on Intelligent Control, Rio Patras, Greece, 17–19 July 2000; pp. 97–102.
- Pelaez, C.E.; Bowles, J.B. Using fuzzy cognitive maps as a system model for failure modes and effects analysis. Inf. Sci. 1996, 88, 177–199. [Google Scholar]
- Liu, Z.Q. Fuzzy cognitive maps in GIS data analysis. Soft Comput. 2003, 7, 394–401. [Google Scholar] [CrossRef]
- Mago, V.K.; Bakker, L.; Papageorgiou, E.I.; Alimadad, A.; Borwein, P.; Dabbaghian, V. Fuzzy cognitive maps and cellular automata: An evolutionary approach for social systems modeling. Appl. Soft Comput. 2012, 12, 3771–3784. [Google Scholar] [CrossRef]
- Froelich, W.; Papageorgiou, E.I.; Samarinas, M.; Skriapas, K. Application of evolutionary fuzzy cognitive maps to the long-term prediction of prostate cancer. Appl. Soft Comput. 2012, 12, 3810–3817. [Google Scholar] [CrossRef]
- Buche, C.; Chevaillier, P.; Nedelec, A.; Parenthoen, M.; Tisseau, J. Fuzzy cognitive maps for the simulation of individual adaptive behaviors. Comput. Anim. Virtual Worlds 2010, 21, 573–587. [Google Scholar] [CrossRef]
- Gray, S.A.; Gray, S.; Cox, L.J.; Henly-Shepard, S. Mental modeler: A fuzzy-logic cognitive mapping modeling tool for adaptive environmental management. In Proceedings of the 46th Hawaii International Conference on System Sciences, Wailea, HI, USA, 7–10 January 2013; pp. 965–973.
- Papakostas, G.A.; Koulouriotis, D.E.; Polydoros, A.S.; Tourassis, V.D. Towards Hebbian learning of fuzzy cognitive maps in pattern classification problems. Expert Syst. Appl. 2012, 39, 10620–10629. [Google Scholar] [CrossRef]
- Stach, W.; Kurgan, L.; Pedrycz, W. A divide and conquer method for learning large fuzzy cognitive maps. Fuzzy Sets Syst. 2010, 161, 2515–2532. [Google Scholar] [CrossRef]
- Ahmadi, S.; Forouzideh, N.; Alizadeh, S.; Papageorgiou, E.I. Learning Fuzzy Cognitive Maps using Imperialist Competitive Algorithm. Neural Comput. Appl. 2015, 26, 1333–1354. [Google Scholar] [CrossRef]
- Luo, X.; Yao, E. The reasoning mechanism of fuzzy cognitive maps. In Proceedings of the First International Conference on Semantics, Knowledge and Grid (SKG’05), Beijing, China, 27–29 November 2005; pp. 27–29.
- Djam, X.Y.; Mishra, A.K. Fuzzy cognitive map based approach for teachers’ performance evaluation. Pac. J. Sci. Technol. 2013, 14, 176–181. [Google Scholar]
- Salmeron, J.L. Fuzzy cognitive maps for artificial emotions forecasting. Appl. Soft Comput. 2012, 12, 3704–3710. [Google Scholar] [CrossRef]
- Lee, S.; Yang, J.; Han, J. Development of a decision making system for selection of dental implant abutments based on the fuzzy cognitive map. Expert Syst. Appl. 2012, 39, 11564–11575. [Google Scholar] [CrossRef]
- Kandasamy, W.B.V.; Smarandache, F. Fuzzy Cognitive Maps and Neutrosophic Cognitive Maps; Xiquan Pub.: Phoenix, AZ, USA, 2003. [Google Scholar]
- Bevilacqua, M.; Ciarapica, F.E.; Mazzuto, G. Analysis of injury events with fuzzy cognitive maps. J. Loss Prev. Process Ind. 2012, 25, 677–685. [Google Scholar] [CrossRef]
- Knighta, C.J.K.; Lloydb, D.J.B.; Penna, A.S. Linear and sigmoidal fuzzy cognitive maps: An analysis of fixed points. Appl. Soft Comput. 2014, 15, 193–202. [Google Scholar] [CrossRef]
© 2016 by the authors; licensee MDPI, Basel, Switzerland. This article is an open access article distributed under the terms and conditions of the Creative Commons by Attribution (CC-BY) license (http://creativecommons.org/licenses/by/4.0/).
Share and Cite
Peng, Z.; Wu, L.; Chen, Z. Research on Steady States of Fuzzy Cognitive Map and its Application in Three-Rivers Ecosystem. Sustainability 2016, 8, 40. https://doi.org/10.3390/su8010040
Peng Z, Wu L, Chen Z. Research on Steady States of Fuzzy Cognitive Map and its Application in Three-Rivers Ecosystem. Sustainability. 2016; 8(1):40. https://doi.org/10.3390/su8010040
Chicago/Turabian StylePeng, Zhen, Lifeng Wu, and Zhenguo Chen. 2016. "Research on Steady States of Fuzzy Cognitive Map and its Application in Three-Rivers Ecosystem" Sustainability 8, no. 1: 40. https://doi.org/10.3390/su8010040
APA StylePeng, Z., Wu, L., & Chen, Z. (2016). Research on Steady States of Fuzzy Cognitive Map and its Application in Three-Rivers Ecosystem. Sustainability, 8(1), 40. https://doi.org/10.3390/su8010040