Abstract
Understanding the process of settlement expansion and the spatiotemporal variation of driving forces is the foundation of rational and specific planning for sustainable development. However, little attention has been paid to the spatiotemporal differences of driving forces among different counties, especially when they are representatives of different development types. This study used Guanyun, Kunshan and Changshu as case studies, and binary logistic regression was employed. The results showed that the expansion rates of Kunshan and Changshu were 5.55 and 3.93 times higher than that of Guanyun. The combinations and relative importance of drivers varied with counties and periods. The change in the number of driving forces can be divided into three stages: increasing stage, decreasing stage, and stable stage. In the relatively developed counties, Kunshan and Changshu, the importance of population is decreased, while it remain an important factor in the less developed county, Guanyun. In addition, the effect of GDP stays the same in Kunshan while it becomes the most important factor in Changshu. The distance to the main road and the distance to town are increasingly important in Kunshan and Guanyun, and distance to town has been the only common factor in the last period, indicating the discrepancy is increased. The relative importance of distance to a lake in Kunshan and Changshu increased, reflecting the role of increasing tourism in accelerating settlement expansion.
1. Introduction
Construction land (i.e., land developed for human settlements, industry and transport construction) expansion is common in the process of urbanization around the world [1]. Although urbanization brings many conveniences, the enormous problems resulting from construction land expansion are not negligible, e.g., fragmentation [2], the loss of farmland [3], local and regional climate change [4], and the decrease of native biodiversity [5]. As the largest developing country, China is also undergoing a similar process with the expansion of built-up areas [6]. What is worse, the expansion is not restricted to urban areas anymore and also occurs in the rural areas [7]. This has had many consequences, one of the most remarkable of which is its consumption of high quality farmland [8,9]; this has intensified the contradiction between the limited land and enormous population in China, and is a threat to food security and sustainable development [10].
Considerable efforts have been undertaken to understand the process of construction land expansion [11,12,13] and its drivers [14,15,16,17,18]. These studies have been helpful in planning the effective use of land and sustainable development, and they provide valuable insights that improve our understanding. However, the major focus is on urban research [1,11,19,20] or, occasionally, on rural settlements [21,22,23]. Research from an integrated perspective on urban and rural settlements together is more scarce [24]. Furthermore, construction land expansion is a spatiotemporal dynamic process, during which both the spatial expansion and the drivers change with time and space. However, most research focuses mainly on the drivers of urban spatial expansion [12], and the temporal changes in the driving factors of urban expansion [14]. Few studies have focused on the spatiotemporal dynamics of drivers during urban or rural settlement expansion. The research of Shu et al. [25] explored the spatiotemporal differences in driving forces of urban land spatial expansion of three towns in Taicang city. These towns are linked together in space, and therefore their spatial heterogeneity is not obvious and they can be considered as a whole to some extent. To sum up, the spatiotemporal dynamics of driving factors are far from being thoroughly understood, especially those of settlements.
In the past, China was a large agriculturally-based country. There were no significant differences in the scale and expansion speed of settlements, especially in rural settlements, although these could be considered the ultimate form of settlement in the agricultural economy before 1980 [26]. Since the implementation of reform and a more open policy, significant changes have taken place in the social economy of China; land use types and spatial patterns have changed dramatically [27], and some new development types in rural settlement are emerging [28,29]. It has been verified that both the agriculture-dominated rural settlements and tourist rural settlements have experienced settlement expansion [29,30]. However, the scale of expansion, speed, period, and the driving forces of different development types for rural settlements are not the same. For example, rural tourist settlements have experienced an expansion in both the horizontal and vertical dimensions, with increasing land intensity [29,31], while dispersion is the main characteristic of agriculture-dominated rural settlements [23]. Furthermore, in “hollowed villages”, a special type of agriculture-dominated rural settlement, there is abandonment of a significant number of old settlements and the construction of new houses [27]. However, a synthetically contrastive analysis on differences in spatial patterns, expansion rates and, especially, the spatiotemporal variation of driving forces on settlement expansion in different counties’ development types is still lacking. This study will provide a more comprehensive understanding of the settlements expansion process according to different development types realized by differentiated management.
The objective of this research is to compare the spatiotemporal variation of the effects of driving forces on different types of counties from 1990 to 2010. Specifically, we attempted to address three questions: (1) what the differences are in settlement expansion in different types of counties; (2) what the dominant drivers in different types of counties are during each period; and (3) how the combination of drivers and their relative importance change in different periods. This may provide new insights for guiding the sustainable development of similar areas.
2. Study Area and Data Sources
2.1. Study Area
The study area is located on the east coast of China, and includes Guanyun, Kunshan, and Changshu, with areas of 1859.23 km2, 953.11 km2, and 1221.01km2, respectively. Guanyun belongs to Lianyungang city in the northeast of Jiangsu province, while Kunshan and Changshu are under the jurisdiction of Suzhou in the south of the province, which is a part of Yangtze River Delta (Figure 1). They are selected as the representatives of the farming-industry-dominated development type, the industry dominated development type, and the development type focusing on business, tourism, and providing services, respectively, because their scores were the highest in each group according to the classification method of Long et al. [28]. Owing to the differences in natural conditions, stage of development, and policy decisions, there are many differences among them. The total population of Changshu is largest among the three counties during the study period. The growth rate of GDP of Kunshan is highest, followed by that of Changshu, while Guanyun is the lowest. Moreover, along with this rapid socioeconomic development, the per capita housing area of rural residents in Guanyun, Kunshan, and Changshu has expanded from 19.46 m2, 66.3 m2, and 61.18 m2 in 1990 to 40.9 m2, 75.5 m2, and 71.21 m2 in 2010, respectively.
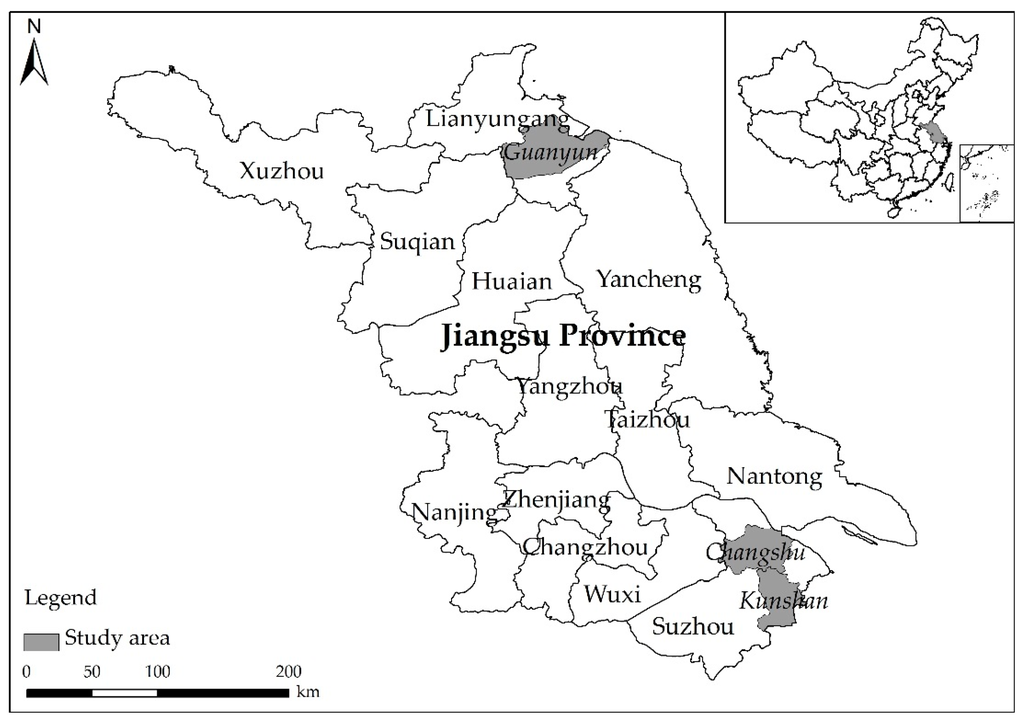
Figure 1.
Location of the study area.
Figure 1.
Location of the study area.

2.2. Data Sources
The data used in this study include DEM data set, slope image, soil type map, spatial and statistical data of socioeconomic, and remote sensing image data. The DEM data set with a resolution of 30m is collected from the International Scientific & Technical Data Mirror Site, Computer Network Information Center, Chinese Academy of Sciences. The slope image is generated from the DEM data set. The soil type map of vector format is derived from the 1:1,000,000 soil database of China and converted to raster format. The spatial data of socioeconomic data (population and GDP) in raster format with a resolution of 1 km is provided by the Resources and Environment Science Data Center, Chinese Academy of Sciences, and resampled to a 30 m resolution. Statistical socioeconomic data are collected from the China Statistical Yearbook for Regional Economy. The image data with 30 m resolution for 1990, 2000 and 2010 covering the study area were acquired from the United States Geological Survey (USGS).
3. Methods
3.1. The Interpretation of Settlements
Settlements in this study include urban settlements and rural settlements. Multi-temporal satellite images covering the three counties were collected from USGS to detect settlement expansion from 1990 to 2010. The cloudage, vegetation phenology and date should be considered when selecting the images [32]. Before interpretation, geometric and atmospheric corrections were applied and the Root Mean Squared Error (RMS error) of geometric rectification was less than 0.5 pixels [32,33]. The images were false-color, composed with five, four, and three bands using the RGB method. To reduce the workload and improve work efficiency and accuracy, we clipped the images according to the range of the three counties. The objected-based classification method was employed to interpret settlements based on ENVI5.1. It mainly included two steps, segmentation and merge, during which the segmentation and merge coefficients were very critical, as they influence the accuracy of the result. They were set to 30 and 60. Based on the object characteristics each county, we built corresponding classes, such as urban land, rural settlements, land for mining and industry, vegetation, paddy field, and water. Finally, settlement layers were extracted by attribute selection from interpretation results. However, there are many settlements in the study area, and their spectral information is not a unique value, but a range. Furthermore, within the settlements there is usually some green land—for example, the trees alongside the road. Therefore, there may be an intersection of spectral information between settlement and green land, which would inevitably generate some misclassifications in the results, such as the green land out of the settlement may be misclassified into settlement. Hence, the original image and high-resolution images from Google Earth, acquired in 2000 and 2010, were used as reference data and artificially interactive interpretation was implemented to revise the results; for example, we deleted the misclassified green land from the settlement. Finally, through the method of random sampling, 200 random points were acquired to verify the accuracy of interpretation. The high-resolution images from Google Earth acquired in 2010 were used as reference data. The result showed that the Kappa coefficient is greater than 0.95.
3.2. Generating Land Use Maps
Based on the interpretation results of settlements, we obtained the spatial distribution of settlements in 1990, 2000, and 2010 independently. By overlaying the settlement layers of different years, we obtained the settlement expansion layers during each period. As a result, we produced settlement expansion maps for each county. Combined with the scope of administrative division, we got land use maps with binary classes (i.e., settlement and non-settlement). Further, they were converted to raster files with a resolution of 30 m. It should be mentioned that the 1990 and 2000 land use maps in the raster format were used when calculating the neighborhood factors, while the 2000 and 2010 land use maps in a vector format are used in random sampling.
3.3. Potential Driving Forces
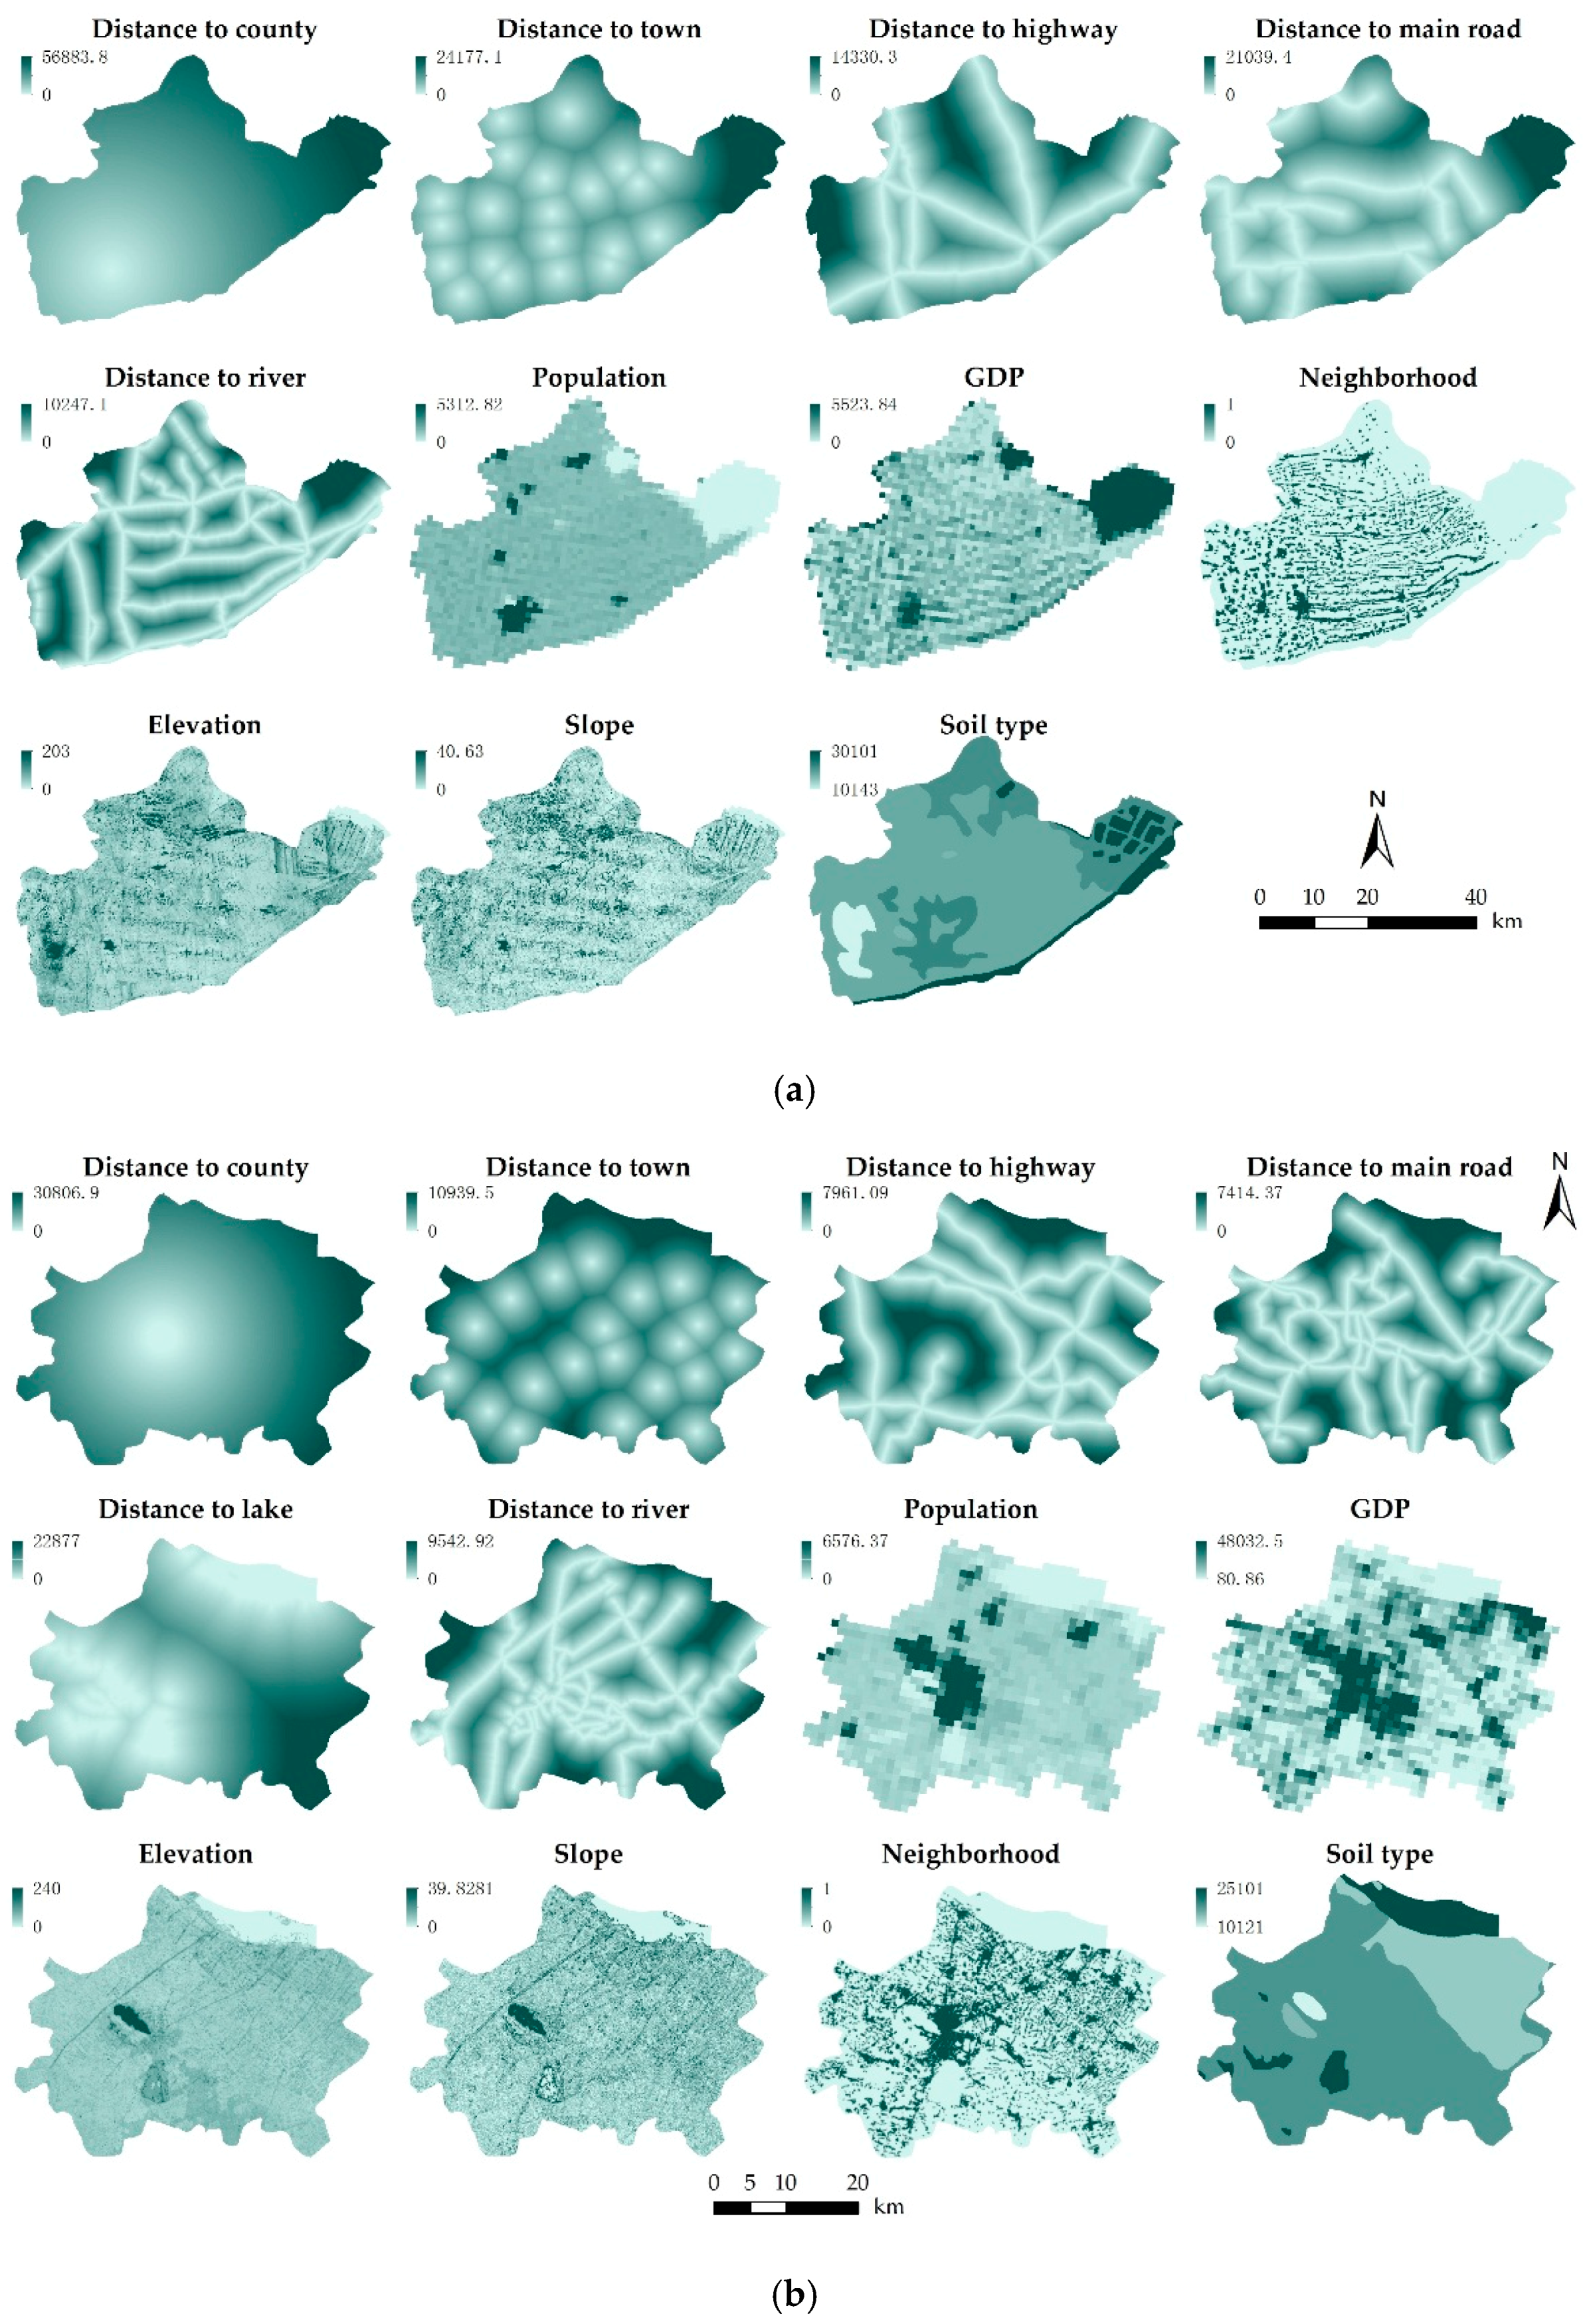
Driving forces are always classified into physical factors, socioeconomic factors, accessibility factors, neighborhood factors, land use policy and urban planning [12,14,25,34,35]. Similar to previous studies [36,37], land use policy and urban planning are not accessible. Besides, socioeconomic factors are also limited to population and GDP. Therefore, twelve factors from physical factors, socioeconomic factors, accessibility factors, neighborhood factors were selected in this study (Table 1, Figure 2). Related research has demonstrated that these drivers are sufficient [14,25,35,37]. Distance-based factors are based on the Euclidean minimum distance to selected features, and neighborhood variables were modeled by means of focal GIS computations [37].

Table 1.
The selected factors of settlement expansion.
| Category | Variables | Description |
|---|---|---|
| Physical factors | Elevation | |
| Slope | ||
| Soil type | ||
| Socioeconomic factors | Population | The amount of population per cell |
| GDP | GDP within per cell | |
| Accessibility factors | D_river | Distance to river |
| D_lake | Distance to lake | |
| D_county | Distance to county center | |
| D_town | Distance to town center | |
| D_hway | Distance to highway | |
| D_mroad | Distance to main road | |
| Neighborhood factors | P_settlement | Proportion of settlements area within a 210 m window |

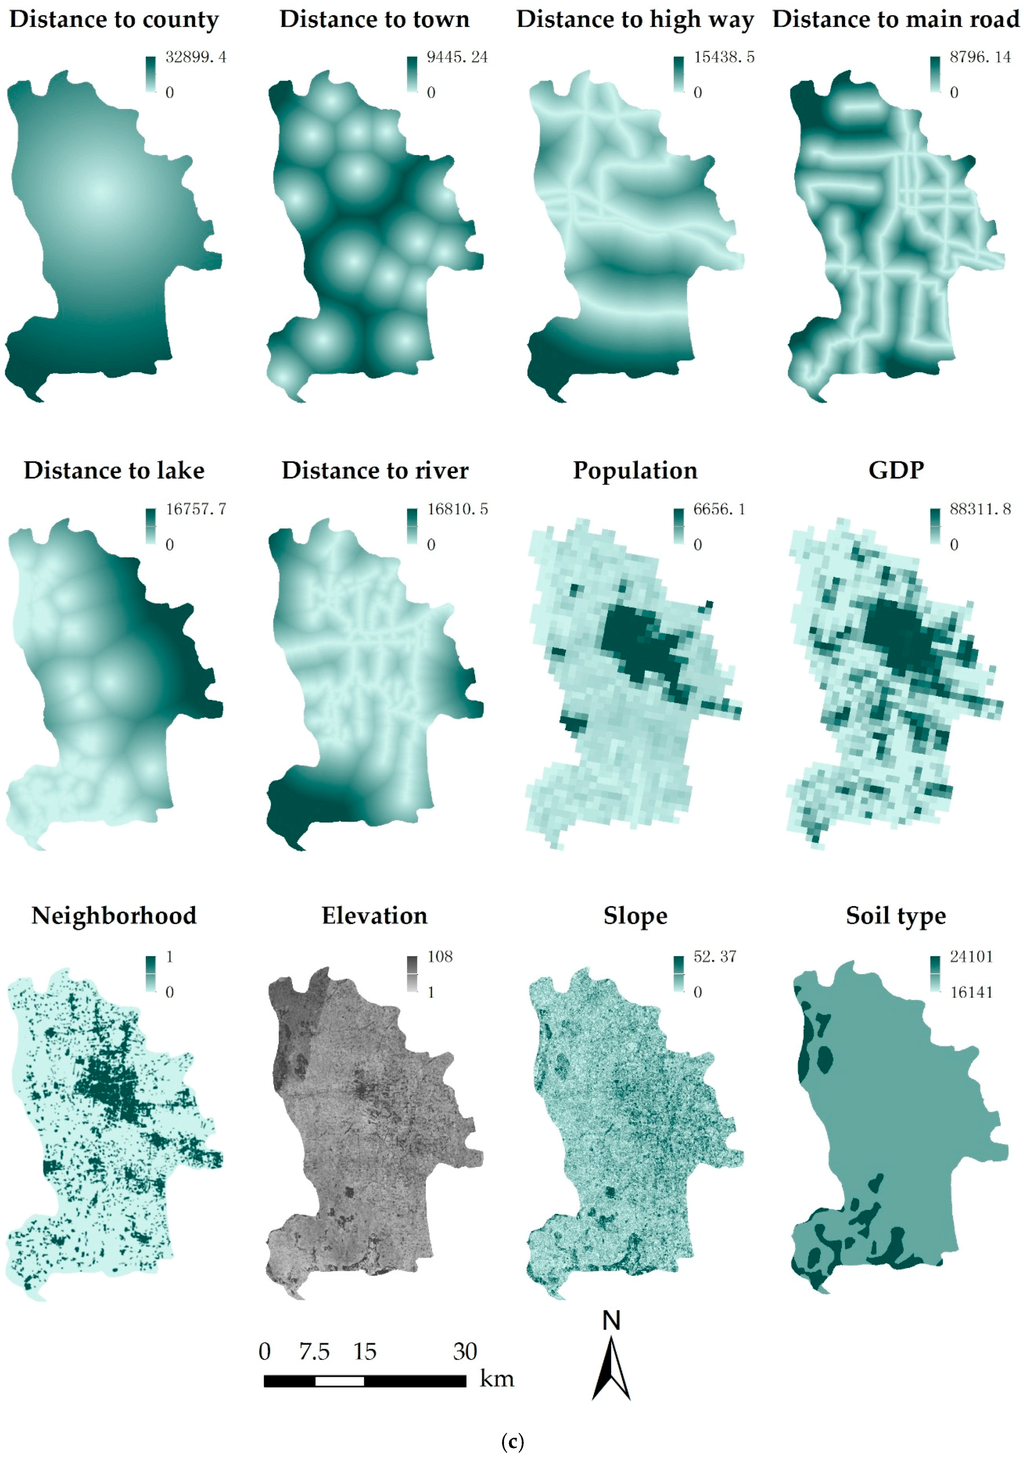
Figure 2.
Selected factors of settlement expansion for 2010. (a) Guanyun; (b) Chagnshu; (c) Kunshan.
Figure 2.
Selected factors of settlement expansion for 2010. (a) Guanyun; (b) Chagnshu; (c) Kunshan.

3.3.1. Physical Factors
Physical factors (e.g., elevation, slope and soil type) have great impact on the size, spatial distribution, and spatial expansion of settlements [32]. The increase of elevation and slope usually means more difficulty and higher costs in constructing houses. Furthermore, settlement development generally prefers flat areas [14,32]. In addition, soil nutrients and organic matter content is varied in different soil types. The location of the kind of soil most suitable to grow crops may be the first choice to live for residents, especially in an agricultural country like China. Accordingly, elevation, slope and soil type were selected as the physical factors.
3.3.2. Socioeconomic Factors
Population and GDP are the main socioeconomic factors impacting settlement development in China [1,38]. The increase of population, directly enhancing the demand to build new houses which would further intensify settlement expansion. The huge population has created great pressure for settlement expansion. GDP also significantly influences urban expansion patterns and rates [38]. In turn, the development of settlement can drive the growth of GDP which is embraced by local government.
3.3.3. Accessibility Factors
Accessibility factors selected in this study include distance to river, lake, county center, town center, high way and main road. Rivers and lakes play an important role in the distribution of settlements, particularly in southern China [19,36]. First of all, they not only supply water but can also provide food, such as fish. Secondly, just as in the proverb “Boats of the south and horses of the north,” the water system is well developed in the south of China, and the boats were the main transportation in ancient times. Last but not least, life habits determine the importance of water in the south where rice is the stable food. The closer the water, the better the rice grows. Bearing this in mind, the distances to river and lake were selected.
The location of the city or town usually means better living environments, more convenient transportation, a higher quality of education and medical resources, and more employment opportunities [14] and these are very attractive features. When there is not enough space, settlements will inevitably expand and the land closest to them will be the first to be occupied [25].
Roads are also an important factor affecting the spatial distribution of settlements [19,39,40]. They shorten travel times and strengthen the contact among regions, which promotes the development of the entire society, including the settlements. It should be mentioned that roads at different levels were designed for special purposes. Furthermore, their effects on settlement expansion are not the same [14,39]. We considered highways and main roads in our study. The former refer to roads crossing the county or connecting the county with another, while the latter refers to county-level roads connecting towns within the county. Given that so many new roads have been built during 1990–2010, the dataset of distance to roads in 2000 and 2010 were used for the separate analysis of driving forces during 1990–2000 and 2000–2010.
3.3.4. Neighborhood Factors
There are three categorizations of urban growth, i.e., infill, edge expansion, and outlying growth [17]. They may have occurred at different development stages and are representative of coalescence or diffusion [17,19]. In the process of coalescence, urban expansion is mainly through infill or edge expansion, while outlying growth is the dominant mode of urban expansion. Accordingly, through examining whether the place surrounded by settlements is more likely to be occupied, we can identify the mode to which the urban expansion belongs. To achieve this, we calculated the percentage of settlements within a 7 × 7 pixel window as the neighborhood factors of 1990 and 2000. The 7 × 7 window was used because it has been demonstrated to be appropriate and valid [14,41].
3.4. Spatial Sampling
Dependent variables may have been spatially autocorrelated, which violates the independence assumption of logistic regression and may result in biased results [14,35,37]. In addition, massive amounts of data (the population is 2774 × 2247, 1661 × 2013 and 2074 × 1804 for each layer and 12 layers in total for Guanyun, Kunshan and Changshu respectively, which is computationally intensive) still present a challenge in spatial statistical analysis, which is also encountered in correlational research [14,36,37,42,43]. These two issues can be addressed through a combined approach of systematic and random sampling [14,36,42]. Following this method, we implemented the spatial sampling.
Systematic sampling was done on the land use map at the end of the period, which only included the settlements expansion during the period (coded as 1) and the other land (coded as 0). Note that the settlements in the base year were removed from the above land use map to ensure the model’s accuracy [25]. However, the points coded as 1 are many fewer than those coded as 0. To gain unbiased parameter estimation, we ran random sampling procedure on the other land. Consequently, an equal quantity of points coded as 0 and 1 were obtained. During 1990–2000, the number of sampling points of Guanyun, Kunshan, and Changshu were 234, 716, and 690, respectively. Moreover, they are 430, 2070, and 1416 in 2000–2010, respectively. Afterwards, we extracted the corresponding values from all the driving factors layers to the points.
3.5. Binary Logistic Regression
Binary logistic regression is a non-linear statistical method of regression analysis for binary dependent variables [44]. The logistic regression model is shown below:
where p is the probability of land urbanization (Y). When non-settlements convert to settlements, the value of Y is coded as 1, and if they remain as non-settlements it is coded as 0. represents the m driving forces described in Section 3.3. is a constant, and (i = 1, 2, …,m) is the partial regression coefficient. After variable standardization, the obtained may reflect the relative influence of each independent variable on the dependent variables [45]. In addition, standardization can eliminate the impact of multicollinearity among the variables. Therefore, the Z-Score standardization method was used to process the variables before logistic regression for this two main reasons and six logistic regression models were eventually built. Three indicators, including Nagelkerke’s R2, the percent correct predictions (PCP), and the area under the receiver operating characteristic curve (AUC) were selected to evaluate the performance of the logistic regression models. The value of AUC is between 0.5 and 1.0, and a value above 0.9 indicates the diagnostic value is high; the value is medium when between 0.7 and 0.9. Otherwise, it is relatively low.
4. Results
4.1. Spatiotemporal Settlements Expansion
All three counties experienced settlement expansion at various speeds over the past twenty years (Figure 3 and Table 2). The settlement areas of Guanyun, Kunshan, and Changshu were 252.66 km2, 110.52 km2, and 205.41 km2 in 1990, respectively. Although the settlement areas of Guanyun were the largest in 1990, there was no significant variation among the proportions of settlement areas in each county, which ranged between 11.60% and 16.96%. This may be because the settlements in China were mainly used to live in and there was no sizable difference among them before 1980 [26]; although the process of settlement expansion accelerated, it was not fast enough to make a huge difference in the first ten years. However, in 2010 the percentage of settlement areas in Kunshan and Changshu increased to 29.40% and 27.51%, respectively. They were much larger than that of Guanyun, which was still below 15%. Kunshan had the highest expansion rates with an annual growth rate of 4.13 km2/a and 12.84 km2/a during the period 1990–2000 and 2000–2010, respectively, while that of Guanyun was the lowest with annual growth rates of 0.88 km2/a and 1.71 km2/a.
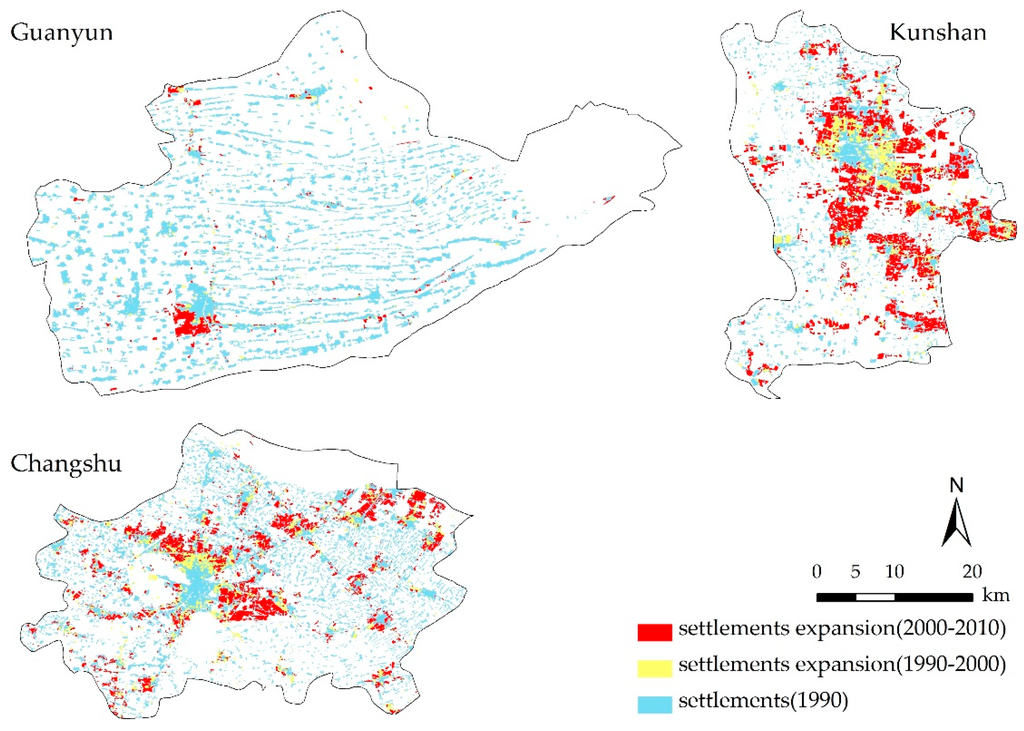
Figure 3.
Settlement expansion of study areas from 1990 to 2010.
Figure 3.
Settlement expansion of study areas from 1990 to 2010.

Table 2.
The percentage of settlements in each county and annual expansion rates from 1990 to 2010.
| Year | Percent | Time Period | Annual Expansion (km/a) | ||||
|---|---|---|---|---|---|---|---|
| Guanyun | Kunshan | Changshu | Guanyun | Kunshan | Changshu | ||
| 1990 | 13.59% | 11.60% | 16.96% | - | - | - | - |
| 2000 | 14.06% | 15.93% | 20.25% | 1990–2000 | 0.88 | 4.13 | 3.98 |
| 2010 | 14.98% | 29.40% | 27.51% | 2000–2010 | 1.71 | 12.84 | 8.79 |
4.2. Spatiotemporal Features of Driving Forces
The main outputs of the six logistic models are summarized in Table 4. Most of the PCPs were greater than 75, except for the value of Kunshan in the period 2000–2010, which was close to 75 at 73.9. The AUC ranged between 0.77 and 0.88. The values of R2 surpassed 0.35. All the indicators showed that established logistic models could reflect the process of settlement expansion well.
Physical factors, socioeconomic factors, accessibility factors and neighborhood factors affected the settlement expansion simultaneously. However, the combination of driving forces varied with counties and periods. The quantity of significant drivers in Guanyun, Kunshan, and Changshu are three, seven, and nine during the period of 1990–2000. That of Guanyun has grown to five in 2000–2010, while that of Kunshan remain stable and that of Changshu decreased to five (Table 3). Further, the number and combination of physical factors, socioeconomic factors, accessibility factors and neighborhood factors differ with periods and counties. From both the perspective of number and importance of factors, the role of socioeconomic factors in Kunshan and Changshu decreased in the study period while that of Guanyun stayed the same (Table 4). The role of accessibility factors enhanced in Guanyun and Kunshan, while that in Changshu is somewhat complex. Both the number and importance of accessibility factors increased in Guanyun and Kunshan. However, while the number of accessibility factors in Changshu decreased, the importance of the unbated accessibility factors increased. The role of physical factors in Kunshan and Changshu declined, while that for Guanyun increased. Neighborhood factors had a weaker effect on settlement expansion in Guanyun and Kunshan during the study period, while a stronger effect was seen in Changshu.
Table 3.
Summary of the logistic regression models.
| Town | Guanyun | Kunshan | Changshu | |||
|---|---|---|---|---|---|---|
| Period | 1990–2000 | 2000–2010 | 1990–2000 | 2000–2010 | 1990–2000 | 2000–2010 |
| Constant | 0.392 ** | 0.14 ** | 0.244 ** | −0.031 ** | 0.169 ** | −0.066 ** |
| Elevation | - | - | 0.351 ** | −0.186 ** | - | - |
| Slope | - | - | - | - | −0.284 ** | - |
| Soil type | - | 0.356 ** | −0.25 ** | - | - | - |
| Pop | 1.453 ** | 1.127 ** | 1.085 ** | 0.24 ** | 0.911 ** | - |
| GDP | - | - | 0.907 ** | 0.572 ** | 0.695 ** | 0.886 ** |
| D_river | - | 0.34** | - | - | 0.256 ** | - |
| D_lake | - | - | - | 0.2 ** | −0.32 ** | −0.192 ** |
| D_county | - | - | - | −0.404 ** | −0.374 ** | - |
| D_town | −0.552 ** | −1.125 ** | - | −0.379 ** | - | −0.484 ** |
| D_hway | - | −0.679 ** | −0.337 ** | - | −0.427 ** | - |
| D_mroad | - | - | −0.677 ** | −0.586 ** | −0.506 ** | −0.81 ** |
| Neighborhood | 1.326 ** | 0.937 ** | 0.551 ** | - | 0.244 ** | 0.453 ** |
| N | 234 | 430 | 716 | 2070 | 690 | 1416 |
| PCP | 82.1 | 79.8 | 80.6 | 73.9 | 77.5 | 76.8 |
| AUC | 0.873 | 0.881 | 0.874 | 0.774 | 0.85 | 0.839 |
| R2 | 0.501 | 0.546 | 0.526 | 0.351 | 0.452 | 0.434 |
Notes: **: the partial regression coefficient is significant at the 1% level. A minus sign (–) indicates that a driving force did not enter the logistic regression model.
Table 4.
The rank order of the factors’ relative influences in different logistic models.
| Town | Guanyun | Kunshan | Changshu | |||
|---|---|---|---|---|---|---|
| Period | 1990–2000 | 2000–2010 | 1990–2000 | 2000–2010 | 1990–2000 | 2000–2010 |
| Elevation | 5 | 7 | ||||
| Slope | 7 | |||||
| Soil type | 5 | 7 | ||||
| Pop | 1 | 1 | 1 | 5 | 1 | |
| GDP | 2 | 2 | 2 | 1 | ||
| D_river | 6 | 8 | ||||
| D_lake | 6 | 6 | 5 | |||
| D_county | 3 | 5 | ||||
| D_town | 3 | 2 | 4 | 3 | ||
| D_hway | 4 | 6 | 4 | |||
| D_mroad | 3 | 1 | 3 | 2 | ||
| Neighborhood | 2 | 3 | 4 | 9 | 4 | |
Notes: The bold numbers indicate that the drivers are long-term factors in the same town.
4.2.1. Temporal Differences
The driving forces could be divided into long-term and short-term factors from the perspective of temporal differences (Table 4). The former would work in all periods, and the latter would take effect only in one period.
The combination of long-term factors varies with counties, while that of short-term factors varies with periods and counties. In Guanyun, population, distance to town and neighborhood are the long-term factors. There are no short-term factors during 1990–2000 while soil type, distance to river and distance to highway are short-term factors during 2000–2010. In Kunshan, long-term factors include elevation, population, GDP, and distance to main road. Soil type, distance to highway and neighborhood compose short-term factors in 1990–2000, while the short-term factors during 2000–2010 comprise distance to lake, distance to county and distance to town. In Changshu, the long-term factors include GDP, distance to main road, distance to lake and neighborhood. Distance to town is the only short-term factor during 2000–2010, while short-term factors in 1990–2000 incorporate slope, population, distance to river, distance to county and distance to highway.
The relative importance of long-term factors also varies with periods. Although population remains the most important factor in Guanyun during the study period, the relative influence of the distance to town and neighborhood was reversed. In Kunshan, the relative importance of long-term factors is consistent other than in the case of the distance to main road and population. The importance of the distance to main road became more important than population during 2000–2010. In Changshu, similar to Kunshan, only the rank order between distance to lake and neighborhood was reversed, and the importance of distance to the lake became weaker during 2000–2010. Obviously, the relative importance of short-term factors also changes with time. For example, slope only takes effect during 1990–2000 in Changshu. Similar results were also found in Guanyun and Kunshan.
4.2.2. Spatial Differences
We classified the drivers into common factors and special factors from the perspective of spatial differences (Table 5). The common factors referred to those with effects in all counties during the same period, while special factors only influenced one or two counties. This shows that the combinations and relative importance of common factors varies with periods, while that of special factors varies with periods and counties.
Table 5.
The rank order of the factors’ relative influences in different logistic models.
| Town | 1990–2000 | 2000–2010 | ||||
|---|---|---|---|---|---|---|
| Period | Guanyun | Kunshan | Changshu | Guanyun | Kunshan | Changshu |
| Elevation | 5 | 7 | ||||
| Slope | 7 | |||||
| Soil type | 7 | 5 | ||||
| Pop | 1 | 1 | 1 | 1 | 5 | |
| GDP | 2 | 2 | 2 | 1 | ||
| D_river | 8 | 6 | ||||
| D_lake | 6 | 6 | 5 | |||
| D_county | 5 | 3 | ||||
| D_town | 3 | 2 | 4 | 3 | ||
| D_hway | 6 | 4 | 4 | |||
| D_mroad | 3 | 3 | 1 | 2 | ||
| Neighborhood | 2 | 4 | 9 | 3 | 4 | |
Notes: The bold numbers indicate that the drivers are common factors in the same period.
During 1990–2000, population and neighborhood were common factors; other factors were classified as special factors. The relative importance of common and special factors varies with counties. For example, neighborhood was the second important factor in Guanyun, while it only had a medium effect in Kunshan and was the least important factor in Changshu. Distance to town was the only special factor in Guanyun, but had no effect in Kunshan and Changshu.
During 2000–2010, the number of common factors decreased to one, distance to town is the only common factor. Other factors were considered special factors. Further, the relative importance of special factors also differed in counties, e.g., population was the most important of the special factors in Guanyun, while it was the medium in Kunshan, and had no effect in Changshu.
5. Discussion
5.1. The Discrepancy of Settlement Expansion among Different Types of Counties
Though these three counties belong to different types, all of them experienced settlement expansion, which is consistent with previous studies [29,30,46]. However, there are great differences in expansion areas, speed, and drivers among them, which are seldom reported. The settlement expansion area in Kunshan and Changshu is 5.55 and 3.93 times higher, respectively, than that in Guanyun during the past twenty years. This is the outcome of the combined action of many factors. First of all, compared with agriculture, the development of secondary and tertiary industry is more likely to lead to settlement expansion. Moreover, Kunshan and Changshu are in the rapid development stage of urbanization [47], while Guanyun is in the early stage of urbanization. Rapid urbanization has inevitably resulted in settlement expansion. Finally, living standards also play an important role. New settlements will be built to improve living conditions when residents have enough money [48]. The per capita net annual income of Guanyun was 8929 yuan in 2010, which is much lower than that of Kunshan (14,824 yuan) and Changshu (14,664 yuan). Accordingly, the possibility of settlement expansion in Kunshan and Changshu is greater.
5.2. The Discrepancy of Drivers among Different Types of Counties
5.2.1. Changes in the Number of Drivers
The combination of drivers not only varied with time and space, which is consistent with previous studies [25,37], but also varied with various kinds of counties. Indeed, Guanyun, Changshu, and Kunshan also represent three development stages: less developed, medium developed and developed. Thus, from the change of the number of drivers in the three counties during the studies period, we may come to a conclusion which will need further verification in the future: the change of the number of drivers could be divided into three stages including increasing stage, decreasing stage, and stable stage, corresponding to the three development stages (Figure 4). In the increasing stage, urbanization has just started, there is enough space and resources, and there is no great difference in space for settlement expansion. Therefore, the restriction of settlement expansion is limited, and the quantity of driving forces is low. However, with the development of urbanization the space is reduced and the spatial difference is increased. For example, new building roads and infrastructure will make it more convenient compared to the places without them. Hence, the roads and infrastructure may be the new factors influencing settlement expansion. Therefore, during the process of urbanization the number of driving forces continues increasing. During the decreasing stage, urbanization has reached a certain level, and the number of influence factors is decreasing for some reason. For example, when there are enough settlements for residents and the speed of settlement expansion is greater than that of population growth, population may have no effect on settlement expansion. The settlement expansion will be influenced by a stable number of drivers in the stable stage. It should be noted that though the number remain stable, the influence factors may change. For example, there are three factors influencing settlement expansion including population, GDP, and distance to county. With the development of urbanization, the number of driving factors may be still three, but they are GDP, distance to county, and distance to road instead.
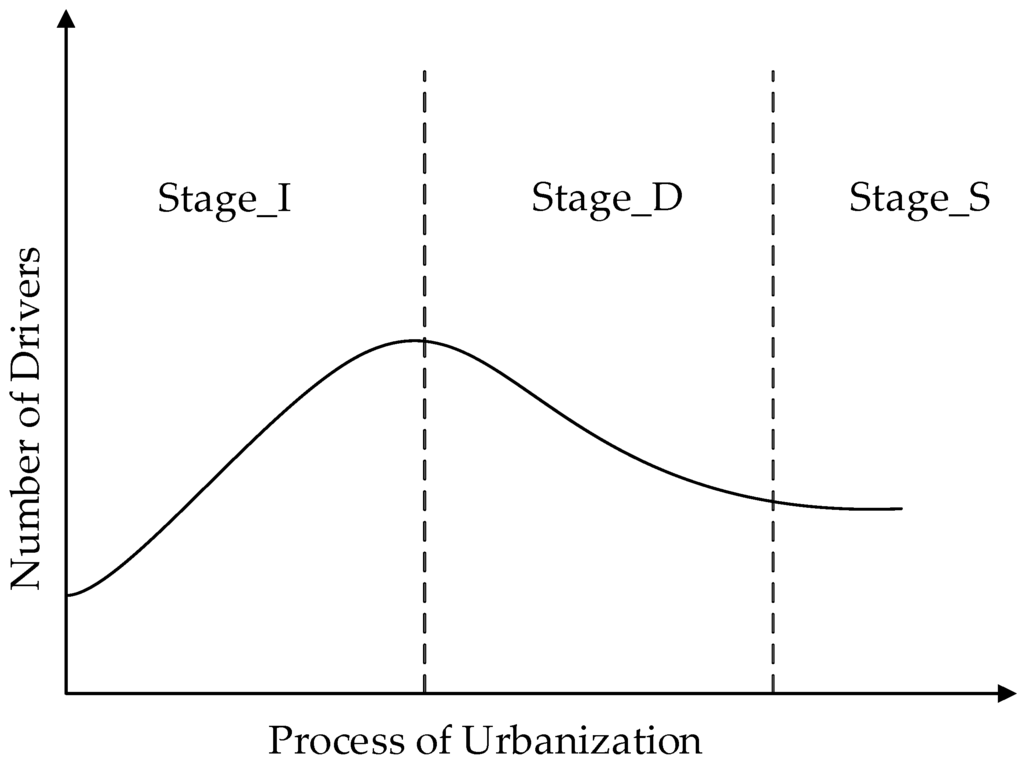
Figure 4.
The three stages of change in the number of drivers( Stage_I: increasing stage; Stage_D: decreasing stage; Stage_S: stable stage).
Figure 4.
The three stages of change in the number of drivers( Stage_I: increasing stage; Stage_D: decreasing stage; Stage_S: stable stage).

The number of common drivers decreased to one, changing from population and neighborhood to distance to town. This indicates that the discrepancy of settlement expansion among different types of counties became more pronounced, and the role of distance to town was becoming more important. This may be because the three counties are different types of counties in different development stages and have specific development paths, similar to the differences between developing countries and developed countries [19,38]. There are do exist some discrepancies in the process of urbanization of the three counties during 1990–2000, but they are all in the initial stage and all influenced by population and neighborhood. With the development of society, the discrepancy is increasing. Population is no longer the most important factor in Kunshan, and is no longer even a significant factor in Changshu.
5.2.2. The Change in the Relative Importance of Drivers
The effects of the physical factors, especially elevation and slope, decreased except that in Guanyun, which is consistent with previous studies [14]. Though the importance of soil type in Guanyun increased during 2000–2010, it only has a weak effect. This finding may be because during that period settlement expansion in Guanyun was mainly occupied the moisture soil and paddy soil.
The relative importance of socioeconomic factors was a little complex. The importance of population in the relatively developed counties, Kunshan and Changshu, decreased during the study period, while that of the less developed county, Guanyun, remained stable. In addition, the effect of GDP stayed the same in Kunshan while it became the most important factor in Changshu. Furthermore, population and GDP were the most important factors in both Kunshan and Changshu during the first period, and changed to GDP and distance to main road during the last period. Similar results has been seen in previous studies. Shu et al. also found main roads became increasingly important [25]. Kuang et al. reported that population and economic conditions are not important forces driving settlement expansion in developed stage [38]. Seto et al. concluded that urban expansion is driven more by population in less development countries, such as India. However, in high income countries, urban expansion is increasingly related to GDP growth [1]. The development of industrialization and its regional variations may be a further explanation for the effect of population decreasing [49].
Although the accessibility factors show different effects in the three counties during 1990–2010, there are some interesting results to note. Though distance to lake has a weak effect in Kunshan and Changshu, it has increased, indicating that the likelihood of settlement expansion of the area close to lake increased, which was seldom reported before. This result may have been due to the environment around the lakes usually being very beautiful, particularly in a developed area, and some lakes have even been developed into famous scenic spots, as in the case of Yangcheng lake in Kunshan, Kuncheng lake and Shang lake in Changshu. Furthermore, with the development of society and improvement of living standards, travel and leisure are more and more popular. These areas have been ideal destinations. Increasing tourism inevitably accelerates settlement expansion [29]. Results also showed that the influence of towns in three counties was becoming much stronger. This suggests that settlements expansion is more likely to occur around the town than before. This finding is different from previous studies [25]. It may be because to decrease the income gap between urban and rural area, the central government has implemented“neo-urbanization” policies, which encourage farmers to migrate into the cities and townships [21]. In addition, compared to city and county, the cost of living in town is lower, and they can enjoy more resources and welfare than in a rural area.
Results also showed that the relative importance of neighborhood decreased both in Guanyun and Kunshan over the twenty years studied, while in Changshu it increased. This finding is different from those in previous studies [14,25,50,51]. This may be because the development type of the study area was not taken into consideration in previous studies. It also revealed that Guanyun and Kunshan are experiencing diffused expansion in which the pattern of outlying expansion is the main mode of settlement expansion, while Changshu is at the development stage of coalescence expansion in which the pattern of infill/edge growth is dominant.
5.3. Management and Policy Implications
In this study, we found that distance to town became the only common factor influencing the three counties and its relative importance continues to increase, suggesting the possibility of settlement expansion around the town center has improved. The role of the town in the process of urbanization and industrialization is becoming more and more significant [46]. The amount and spatial distribution of the town greatly influences the rationality of the spatial layout of settlements. Furthermore, the town plays an important role in strengthening the connection between urban and rural areas, and decreasing the gap in development between urban and rural places. Therefore, the role of the town should be emphasized in urban–rural development plans and the system of city–town–rural settlements should be optimized to realize urban–rural coordination development [23]. Further, from the perspective of limiting the overexpansion of central urban areas, the development of towns should also be encouraged and a well-organized rural–town–county system should be built. A similar policy has been recommended in the mega-city, Beijing, to develop decentralized city groups and satellite cities [9].
The combination and relative importance of drivers varies with counties and periods: there exist short-term factors, long-term and common factors, and special factors, which should be taken into account when making relevant policy. Both the decrease of common factors and the discrepancy of the most important factors indicate that different types of counties are growing in different ways. Therefore, differentiated policies and regulations targeted at different types of counties and periods should be formulated and executed strictly. For example, controlling the growth of population is the most effective way to limit the irrational settlement expansion in Guanyun, while the primary task in Kunshan is to build a scientific and rational traffic system, and methods related to GDP should be considered first in Changshu at present.
In addition, the development of tourism has accelerated the settlement expansion, which should be given suitable attention.
6. Conclusions
This study examined the spatiotemporal variation of settlement expansion and its different types of driving forces in counties by using binary logistic regression. A great discrepancy in settlement expansion rates among different types of counties was observed, with settlement expansion rates in Kunshan having the highest annual growth rates of 4.13 km2/a and 12.84 km2/a during the period 1990–2000 and 2000–2010 respectively, followed by Changshu, and then Guanyun, which had the lowest.
The results also showed that the combination and relative importance of drivers varied with counties and periods. From the perspective of quantity, the change of the number of driving forces can be divided into three stages: increasing stage, decreasing stage, and stable stage corresponding to less developed, medium developed, and developed stage of urbanization. In addition, the number of common drivers decreased to one, changing from population and neighborhood to distance to town. This indicates that the discrepancy of settlement expansion among different types of counties is becoming more pronounced, and the role of distance to town is becoming more important.
From the perspective of importance, physical factors, especially elevation and slope, became less important. The relative importance of socioeconomic factors was a little complex. The importance of population in Kunshan and Changshu decreased during the study period, while that of Guanyun remained stable. In addition, the effect of GDP stayed the same in Kunshan while it became the most important factor in Changshu. Furthermore, population and GDP were the most important factors in both Kunshan and Changshu during the first period, while they changed to GDP and distance to main road during the last period. Though the accessibility factors show different effects in the three counties during 1990–2010, it should be noted the relative importance of distance to lake in Kunshan and Changshu all increased, which reflects the role of increasing tourism in accelerating settlement expansion. The relative importance of the neighborhood became weaker in Guanyun and Kunshan, while in Changshu it became stronger. This indicates that these counties are experiencing diffused expansion and scattered expansion, respectively.
In addition, based on the findings, we suggest that differentiated policies and regulations targeted at different types of counties and periods should be formulated and be executed strictly.
However, this analysis also has some limitations. The classification of the stage of drivers is only based on the three counties, and the critical point between each stage is not quantified, which needs further study in the future.
Acknowledgments
This work was supported by the major consulting project of the Chinese academy of engineering (201405ZD001).
Author Contributions
Guanglong Dong and Hongqi Zhang had the original idea for the study. Guanglong Dong was responsible for data collecting, data analysis and writing of the manuscript. Hongqi Zhang and Erqi Xu reviewed the manuscript. Many thanks go to the anonymous reviewers for their comments on the manuscript.
Conflicts of Interest
The authors declare no conflict of interest.
References
- Seto, K.C.; Fragkias, M.; Güneralp, B.; Reilly, M.K. A meta-analysis of global urban land expansion. PLoS ONE 2011, 6, 1–9. [Google Scholar] [CrossRef] [PubMed]
- Wei, Y.; Zhang, Z. Assessing the fragmentation of construction land in urban areas: An index method and case study in Shunde, China. Land Use Pol. 2012, 29, 417–428. [Google Scholar] [CrossRef]
- Liu, L.; Xu, X.; Chen, X. Assessing the impact of urban expansion on potential crop yield in China during 1990–2010. Food Secur. 2015, 7, 33–43. [Google Scholar] [CrossRef]
- Rosenfeld, D. Suppression of rain and snow by urban and industrial air pollution. Science 2000, 287, 1793–1796. [Google Scholar] [CrossRef] [PubMed]
- Hansen, A.J.; Knight, R.L.; Marzluff, J.M.; Powell, S.; Brown, K.; Gude, P.H.; Jones, K. Effects of exurban development on biodiversity: Patterns, mechanisms, and research needs. Ecol. Appl. 2005, 15, 1893–1905. [Google Scholar] [CrossRef]
- Kuang, W.; Liu, J.; Zhang, Z.; Lu, D.; Xiang, B. Spatiotemporal dynamics of impervious surface areas across China during the early 21st century. Chin. Sci. Bull. 2013, 58, 1691–1701. [Google Scholar] [CrossRef]
- Su, S.; Zhang, Q.; Zhang, Z.; Zhi, J.; Wu, J. Rural settlement expansion and paddy soil loss across an ex-urbanizing watershed in eastern coastal China during market transition. Reg. Environ. Chang. 2011, 11, 651–662. [Google Scholar] [CrossRef]
- Lin, G.C.; Ho, S.P. China‘s land resources and land-use change: Insights from the 1996 land survey. Land Use Pol. 2003, 20, 87–107. [Google Scholar] [CrossRef]
- Song, W.; Pijanowski, B.C.; Tayyebi, A. Urban expansion and its consumption of high-quality farmland in Beijing, China. Ecol. Indic. 2015, 54, 60–70. [Google Scholar] [CrossRef]
- Xie, H.; Zou, J.; Jiang, H.; Zhang, N.; Choi, Y. Spatiotemporal pattern and driving forces of arable land-use intensity in China: Toward sustainable land management using emergy analysis. Sustainability 2014, 6, 3504–3520. [Google Scholar] [CrossRef]
- Seto, K.C.; Fragkias, M. Quantifying spatiotemporal patterns of urban land-use change in four cities of China with time series landscape metrics. Landsc. Ecol. 2005, 20, 871–888. [Google Scholar] [CrossRef]
- Tan, R.; Liu, Y.; Liu, Y.; He, Q.; Ming, L.; Tang, S. Urban growth and its determinants across the Wuhan urban agglomeration, central China. Habitat Int. 2014, 44, 268–281. [Google Scholar] [CrossRef]
- Tan, M.; Li, X.; Xie, H.; Lu, C. Urban land expansion and arable land loss in China—A case study of Beijing–Tianjin–Hebei region. Land Use Pol. 2005, 22, 187–196. [Google Scholar] [CrossRef]
- Li, X.; Zhou, W.; Ouyang, Z. Forty years of urban expansion in Beijing: What is the relative importance of physical, socioeconomic, and neighborhood factors? Appl. Geogr. 2013, 38, 1–10. [Google Scholar] [CrossRef]
- Du, X.; Jin, X.; Yang, X.; Yang, X.; Zhou, Y. Spatial pattern of land use change and its driving force in Jiangsu province. Int. J. Environ. Res. Public Health 2014, 11, 3215–3232. [Google Scholar] [CrossRef] [PubMed]
- Chen, M.; Ye, C. Differences in Pattern and Driving Forces between Urban and Rural Settlements in the Coastal Region of Ningbo, China. Sustainability 2014, 6, 1848–1867. [Google Scholar] [CrossRef]
- Chen, J.; Chang, K.; Karacsonyi, D.; Zhang, X. Comparing urban land expansion and its driving factors in Shenzhen and Dongguan, China. Habitat Int. 2014, 43, 61–71. [Google Scholar] [CrossRef]
- Tian, L.; Chen, J.; Yu, S.X. Coupled dynamics of urban landscape pattern and socioeconomic drivers in Shenzhen, China. Landsc. Ecol. 2014, 29, 715–727. [Google Scholar] [CrossRef]
- Tian, G.; Wu, J. Comparing urbanization patterns in Guangzhou of China and Phoenix of the USA: The influences of roads and rivers. Ecol. Indic. 2015, 52, 23–30. [Google Scholar] [CrossRef]
- Yu, X.; Zhang, A.; Hou, X.; Li, M.; Xia, Y. Multi-temporal remote sensing of land cover change and urban sprawl in the coastal city of Yantai, China. Int. J. Digit. Earth 2013, 6 (Suppl. 2), 137–154. [Google Scholar] [CrossRef]
- Tian, G.; Qiao, Z.; Gao, X. Rural settlement land dynamic modes and policy implications in Beijing metropolitan region, China. Habitat Int. 2014, 44, 237–246. [Google Scholar] [CrossRef]
- Yang, R.; Liu, Y.; Long, H.; Qiao, L. Spatio-temporal characteristics of rural settlements and land use in the Bohai Rim of China. J. Geogr. Sci. 2015, 25, 559–572. [Google Scholar] [CrossRef]
- Liu, Y.; Luo, T.; Liu, Z.; Kong, X.; Li, J.; Tan, R. A comparative analysis of urban and rural construction land use change and driving forces: Implications for urban–rural coordination development in Wuhan, Central China. Habitat Int. 2015, 47, 113–125. [Google Scholar] [CrossRef]
- Xu, Y.; Pu, L.; Zhang, L. Spatial pattern and the process of settlement expansion in Jiangsu Province from 1980 to 2010, Eastern China. Sustainability 2014, 6, 8180–8194. [Google Scholar] [CrossRef]
- Shu, B.; Zhang, H.; Li, Y.; Qu, Y.; Chen, L. Spatiotemporal variation analysis of driving forces of urban land spatial expansion using logistic regression: A case study of port towns in Taicang City, China. Habitat Int. 2014, 43, 181–190. [Google Scholar] [CrossRef]
- Zhu, F.; Zhang, F.; Li, C.; Zhu, T. Functional transition of the rural settlement: Analysis of land-use differentiation in a transect of Beijing, China. Habitat Int. 2014, 41, 262–271. [Google Scholar] [CrossRef]
- Long, H.; Li, Y.; Liu, Y.; Woods, M.; Zou, J. Accelerated restructuring in rural China fueled by ‘increasing vs. decreasing balance’land-use policy for dealing with hollowed villages. Land Use Pol. 2012, 29, 11–22. [Google Scholar] [CrossRef]
- Long, H.; Zou, J.; Liu, Y. Differentiation of rural development driven by industrialization and urbanization in eastern coastal China. Habitat Int. 2009, 33, 454–462. [Google Scholar] [CrossRef]
- Xi, J.; Zhao, M.; Ge, Q.; Kong, Q. Changes in land use of a village driven by over 25 years of tourism: The case of Gougezhuang village, China. Land Use Pol. 2014, 40, 119–130. [Google Scholar] [CrossRef]
- Liu, Y.; Yang, R.; Long, H.; Gao, J.; Wang, J. Implications of land-use change in rural China: A case study of Yucheng, Shandong province. Land Use Pol. 2014, 40, 111–118. [Google Scholar] [CrossRef]
- Xi, J.; Wang, X.; Kong, Q.; Zhang, N. Spatial morphology evolution of rural settlements induced by tourism. J. Geogr. Sci. 2015, 25, 497–511. [Google Scholar] [CrossRef]
- Tian, G.; Qiao, Z.; Zhang, Y. The investigation of relationship between rural settlement density, size, spatial distribution and its geophysical parameters of China using Landsat TM images. Ecol. Model. 2012, 231, 25–36. [Google Scholar] [CrossRef]
- Xu, E.; Zhang, H. Characterization and interaction of driving factors in karst rocky desertification: A case study from Changshun, China. Solid Earth Discuss. 2014, 6, 2939–2969. [Google Scholar] [CrossRef]
- Zhang, Z.; Su, S.; Xiao, R.; Jiang, D.; Wu, J. Identifying determinants of urban growth from a multi-scale perspective: A case study of the urban agglomeration around Hangzhou Bay, China. Appl. Geogr. 2013, 45, 193–202. [Google Scholar] [CrossRef]
- Xiao, R.; Su, S.; Mai, G.; Zhang, Z.; Yang, C. Quantifying determinants of cash crop expansion and their relative effects using logistic regression modeling and variance partitioning. Int. J. Appl. Earth Obs. 2015, 34, 258–263. [Google Scholar] [CrossRef]
- Luo, J.; Wei, Y.D. Modeling spatial variations of urban growth patterns in Chinese cities: the case of Nanjing. Landsc. Urban Plan. 2009, 91, 51–64. [Google Scholar] [CrossRef]
- Shafizadeh-Moghadam, H.; Helbich, M. Spatiotemporal variability of urban growth factors: A global and local perspective on the megacity of Mumbai. Int. J. Appl. Earth Obs. 2015, 35, 187–198. [Google Scholar] [CrossRef]
- Kuang, W.; Chi, W.; Lu, D.; Dou, Y. A comparative analysis of megacity expansions in China and the US: Patterns, rates and driving forces. Landsc. Urban Plan. 2014, 132, 121–135. [Google Scholar] [CrossRef]
- Su, S.; Xiao, R.; Li, D. Impacts of transportation routes on landscape diversity: A comparison of different route types and their combined effects. Environ. Manag. 2014, 53, 636–647. [Google Scholar] [CrossRef] [PubMed]
- Müller, K.; Steinmeier, C.; Küchler, M. Urban growth along motorways in Switzerland. Landsc. Urban Plan. 2010, 98, 3–12. [Google Scholar] [CrossRef]
- Liu, H.; Zhou, Q. Developing urban growth predictions from spatial indicators based on multi-temporal images. Comput. Environ. Urban Syst. 2005, 29, 580–594. [Google Scholar] [CrossRef]
- Cheng, J.; Masser, I. Urban growth pattern modeling: A case study of Wuhan city, PR China. Landsc. Urban Plan. 2003, 62, 199–217. [Google Scholar] [CrossRef]
- Hu, Z.; Lo, C. Modeling urban growth in Atlanta using logistic regression. Comput. Environ. Urban Syst. 2007, 31, 667–688. [Google Scholar] [CrossRef]
- Menard, S. Applied Logistic Regression Analysis; Sage: Thousand Oaks, CA, USA, 2002; Volume 106. [Google Scholar]
- Menard, S. Six approaches to calculating standardized logistic regression coefficients. Am. Stat. 2012, 58, 218–223. [Google Scholar] [CrossRef]
- Tan, M.; Li, X. The changing settlements in rural areas under urban pressure in China: Patterns, driving forces and policy implications. Landsc. Urban Plan. 2013, 120, 170–177. [Google Scholar] [CrossRef]
- Long, H.; Liu, Y.; Wu, X.; Dong, G. Spatio-temporal dynamic patterns of farmland and rural settlements in Su–Xi–Chang region: Implications for building a new countryside in coastal China. Land Use Pol. 2009, 26, 322–333. [Google Scholar] [CrossRef]
- Deng, X.; Huang, J.; Rozelle, S.; Uchida, E. Growth, population and industrialization, and urban land expansion of China. J. Urban Econ. 2008, 63, 96–115. [Google Scholar] [CrossRef]
- Kuang, W.; Liu, J.; Dong, J.; Chi, W.; Zhang, C. The rapid and massive urban and industrial land expansions in China between 1990 and 2010: A CLUD-based analysis of their trajectories, patterns, and drivers. Landsc. Urban Plan. 2016, 145, 21–33. [Google Scholar] [CrossRef]
- Huang, B.; Zhang, L.; Wu, B. Spatiotemporal analysis of rural–urban land conversion. Int. J. Geogr. Inform. Sci. 2009, 23, 379–398. [Google Scholar] [CrossRef]
- Braimoh, A.K.; Onishi, T. Spatial determinants of urban land use change in Lagos, Nigeria. Land Use Pol. 2007, 24, 502–515. [Google Scholar] [CrossRef]
© 2015 by the authors; licensee MDPI, Basel, Switzerland. This article is an open access article distributed under the terms and conditions of the Creative Commons by Attribution (CC-BY) license (http://creativecommons.org/licenses/by/4.0/).