
Small Wind Technology Diffusion in Suburban Areas of Sicily


Abstract
:1. Introduction
2. Italian Regulatory Framework
3. Small Wind Turbines Available on the Market

| Power Classes | Wind Turbine Model | Producers |
|---|---|---|
| Class 0.5–1.8 kW | Soma 1000—1 kW (HAWT) | Sunrise Solar |
| Windspire 1.2 G—1.2 kW (VAWT) | Mariah Power | |
| Class 2–3.5 kW | Inclin 3000—3 kW (HAWT) | J. Bornay |
| Windfox—3 kW (HAWT) | Italkero s.r.l | |
| WindRotor WRE.030—3 kW (VAWT) | Ropatek | |
| Cleanfield—3.5 kW (VAWT) | Cleanfield Energy | |
| Class 5–6 kW | EasyWind 6 AC—6 kW (HAWT) | Conergy |
| Maxy Vertical Wre 0.62—6 kW (VAWT) | Ropatec | |
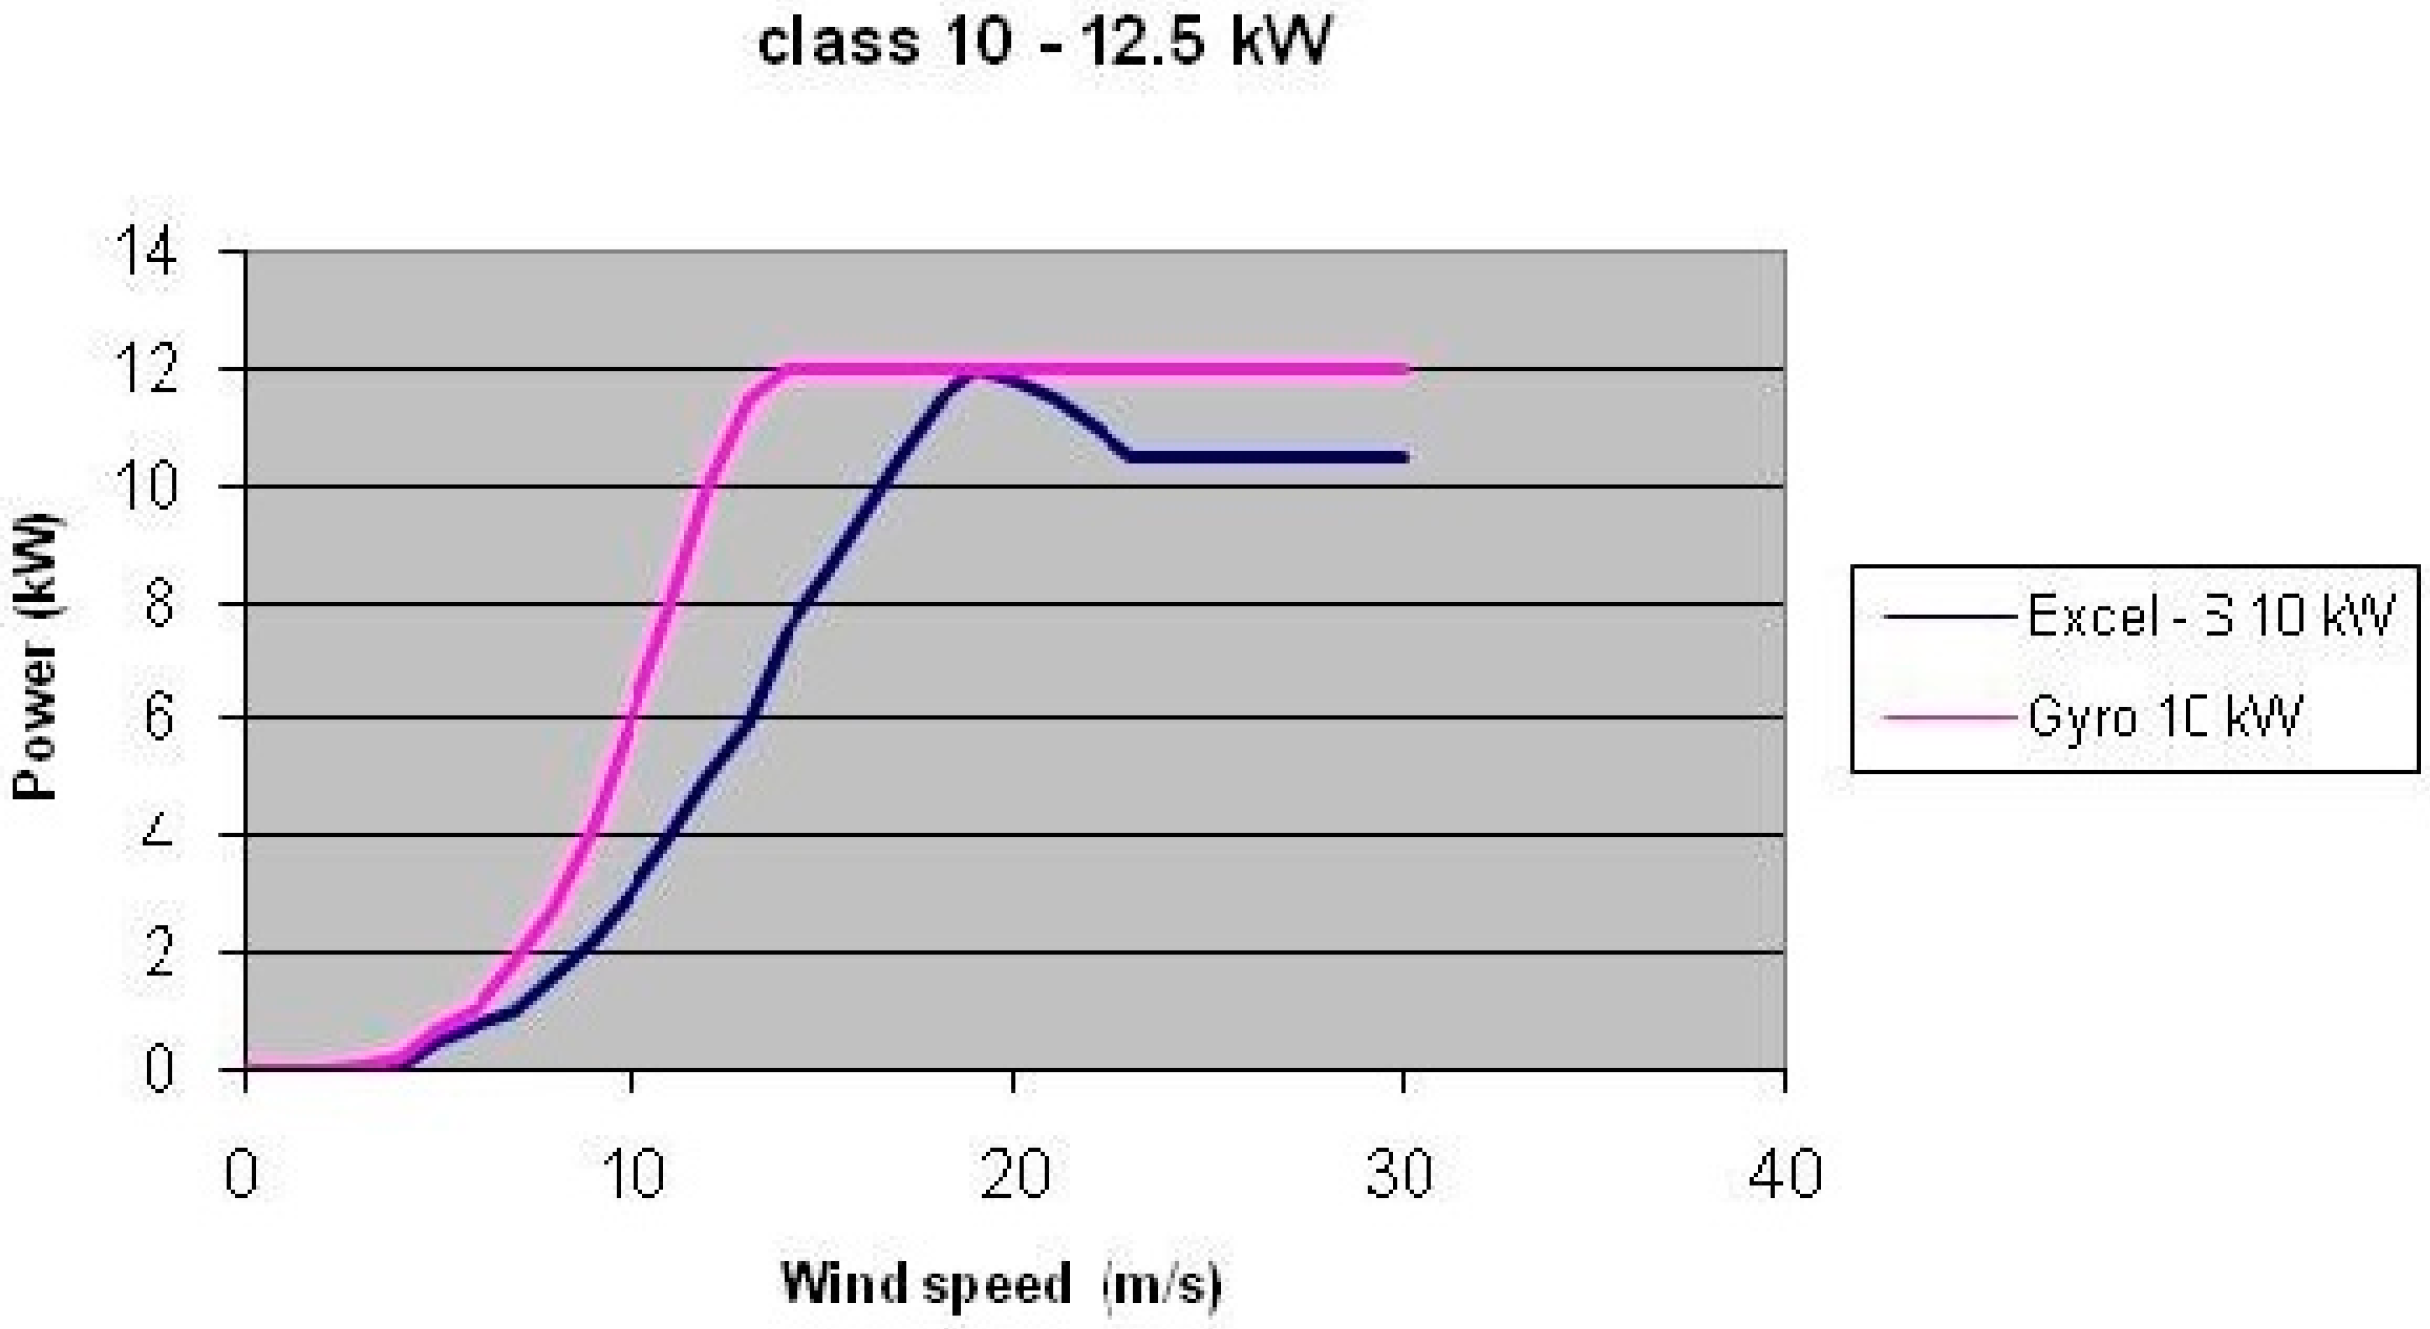
| Class 10–12.5 kW | BWC Excel-S—10 kW (HAWT) | Bergey Windpower |
| Windpower Gyro—10 kW (VAWT) | Four Seasons Windpower | |
| Class 15–17.5 kW | WT 15000—15 kW (HAWT) | Proven Energy Ltd |
| Baywinds 24–15—15 kW (HAWT) | Baywinds | |
| Class 20–25 kW | FL—20 kW (HAWT) | Flexyenergy |
| Big Star Vertical—20 kW (VAWT) | Ropatek |
| Wind Turbine | Technical Data | |
|---|---|---|
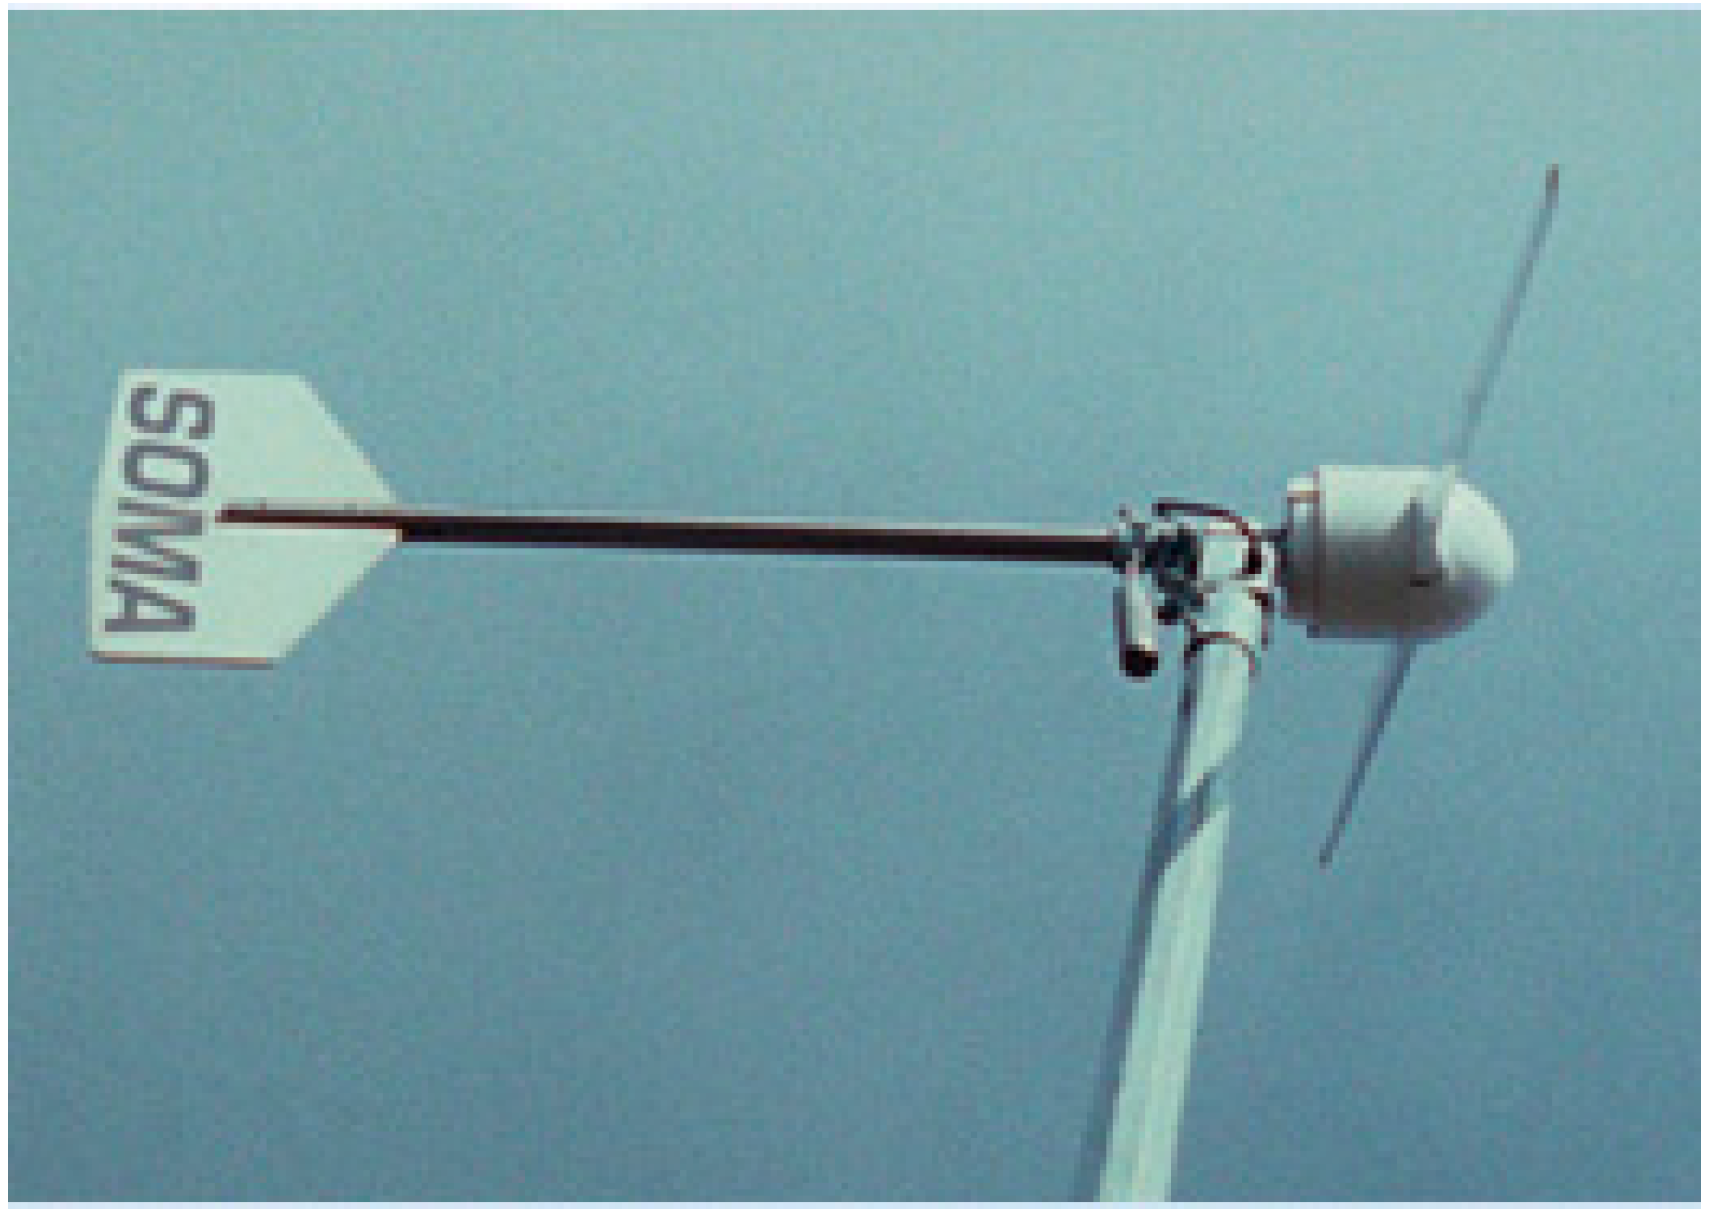
| Soma 1000—1 kW (HAWT) | Nominal Power | 1 Kw |
| Numbers. Blades and material, | 2, fiberglass | |
| Rotor diameter | 2.7 m | |
| Cut-in wind speed | 3.5 m/s | |
| Cut-off wind speed | 50 m/s | |
| Rated wind speed | 10 m/s | |
| Security wind speed | 50 m/s | |
| Weight nacelle | 50 Kg | |
| Weight tower | 45 Kg | |
| Price per kW | 1.980 €/kW | |
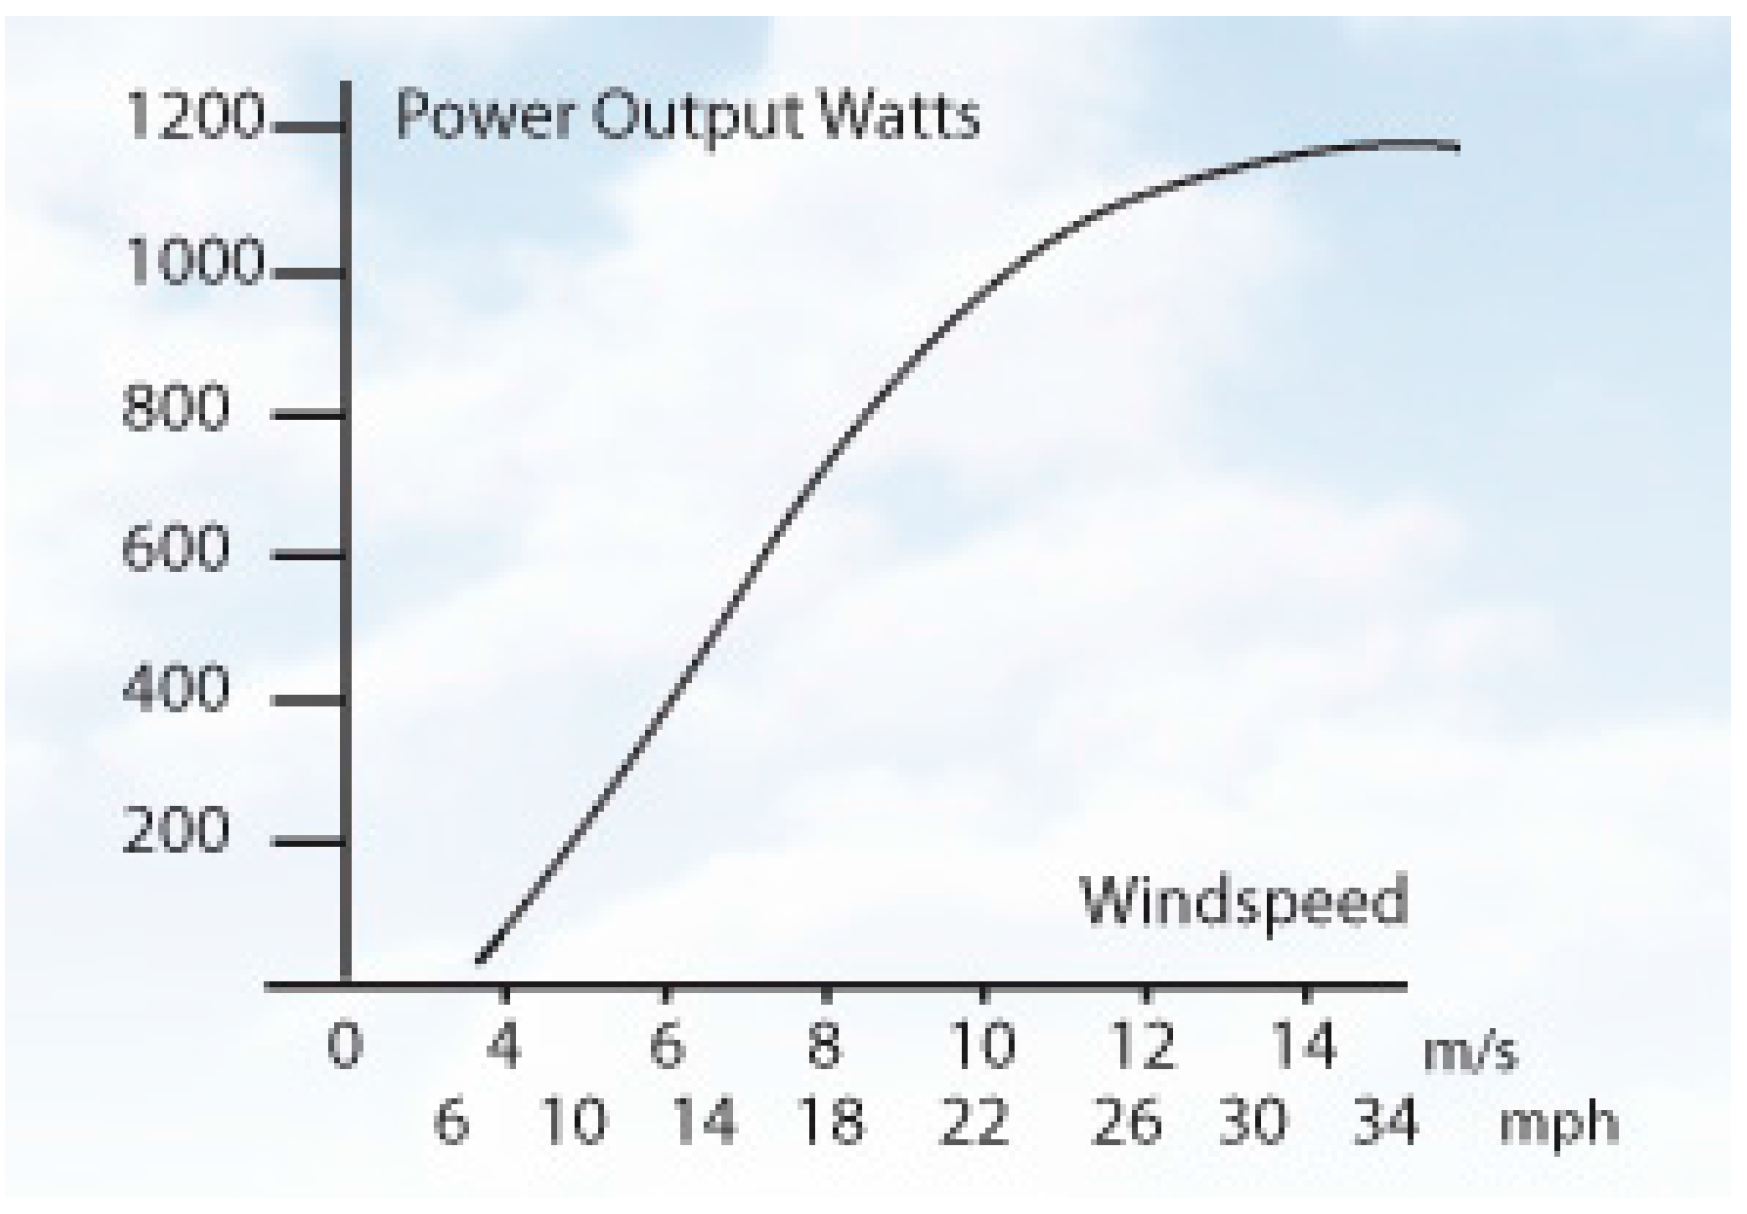
4. Techno—Economic Analysis
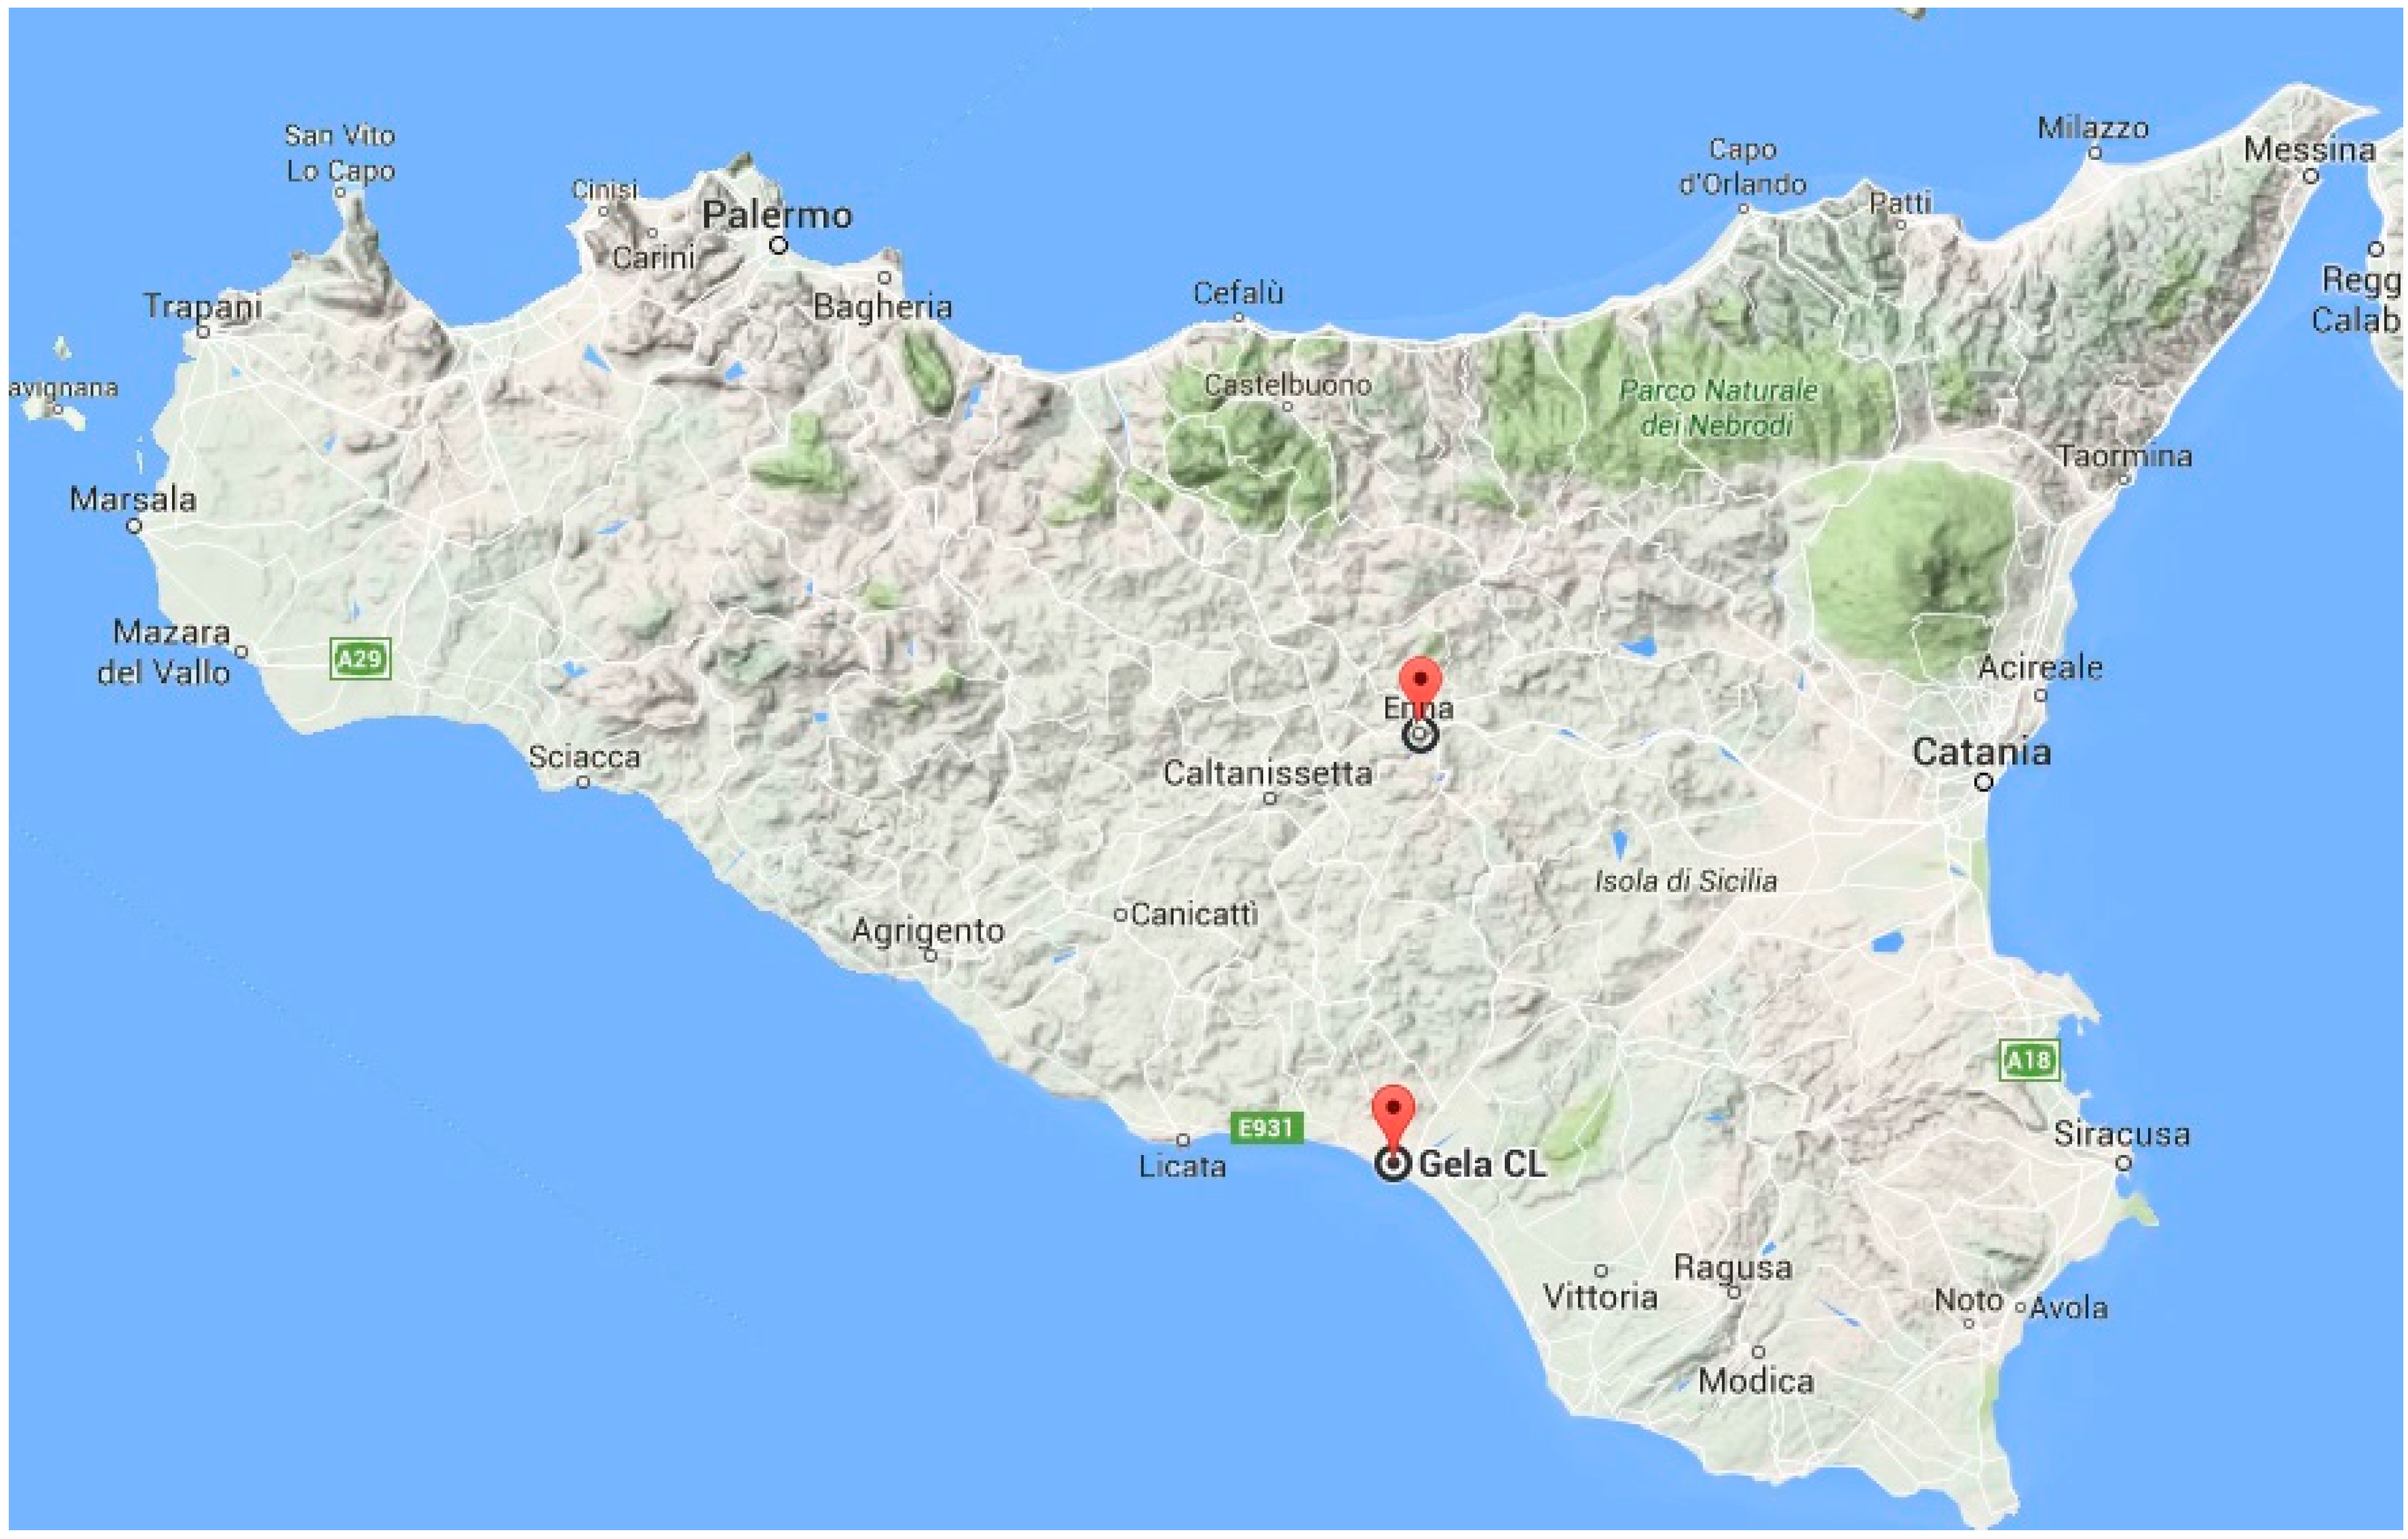
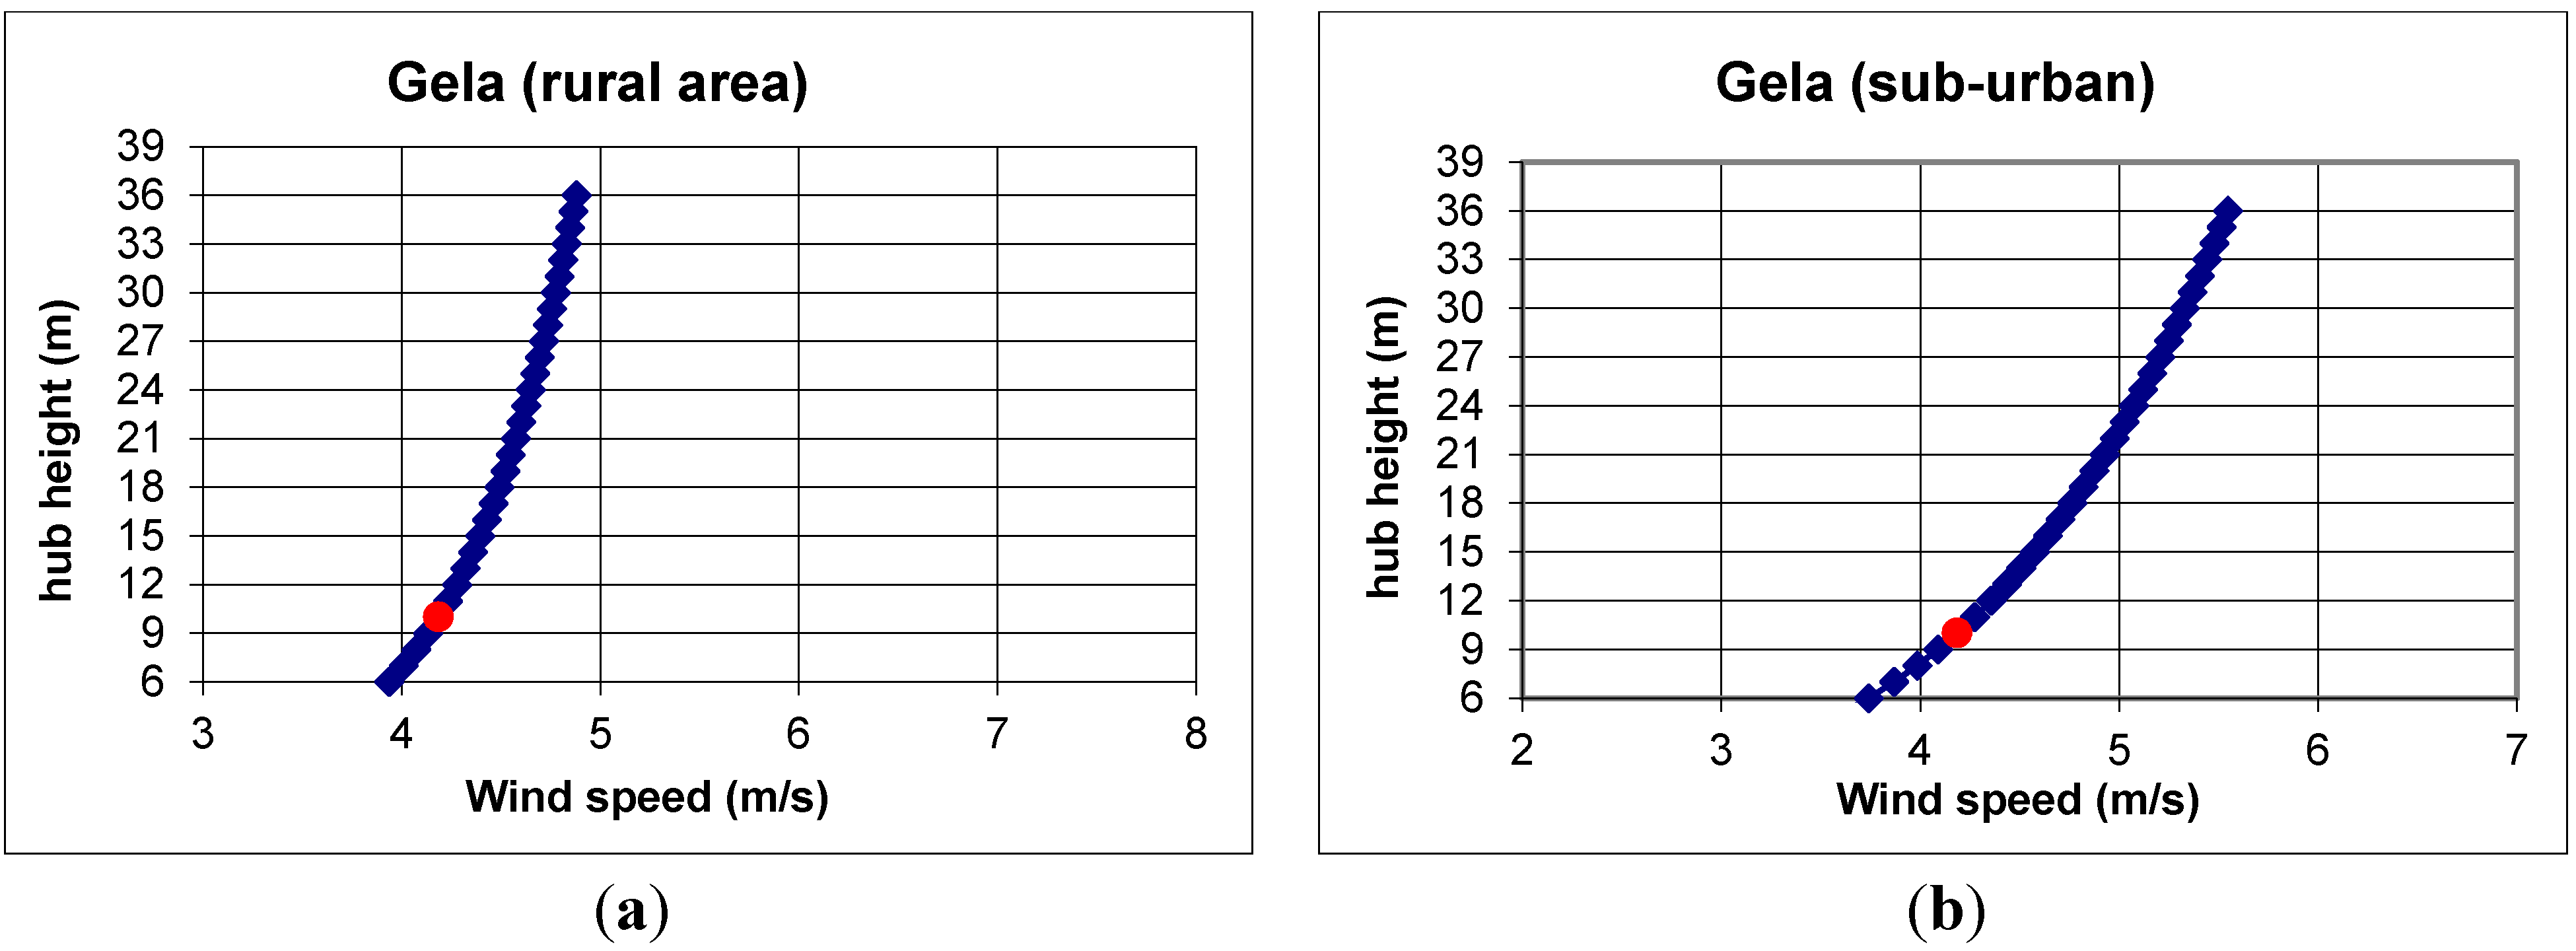
4.1. Siting
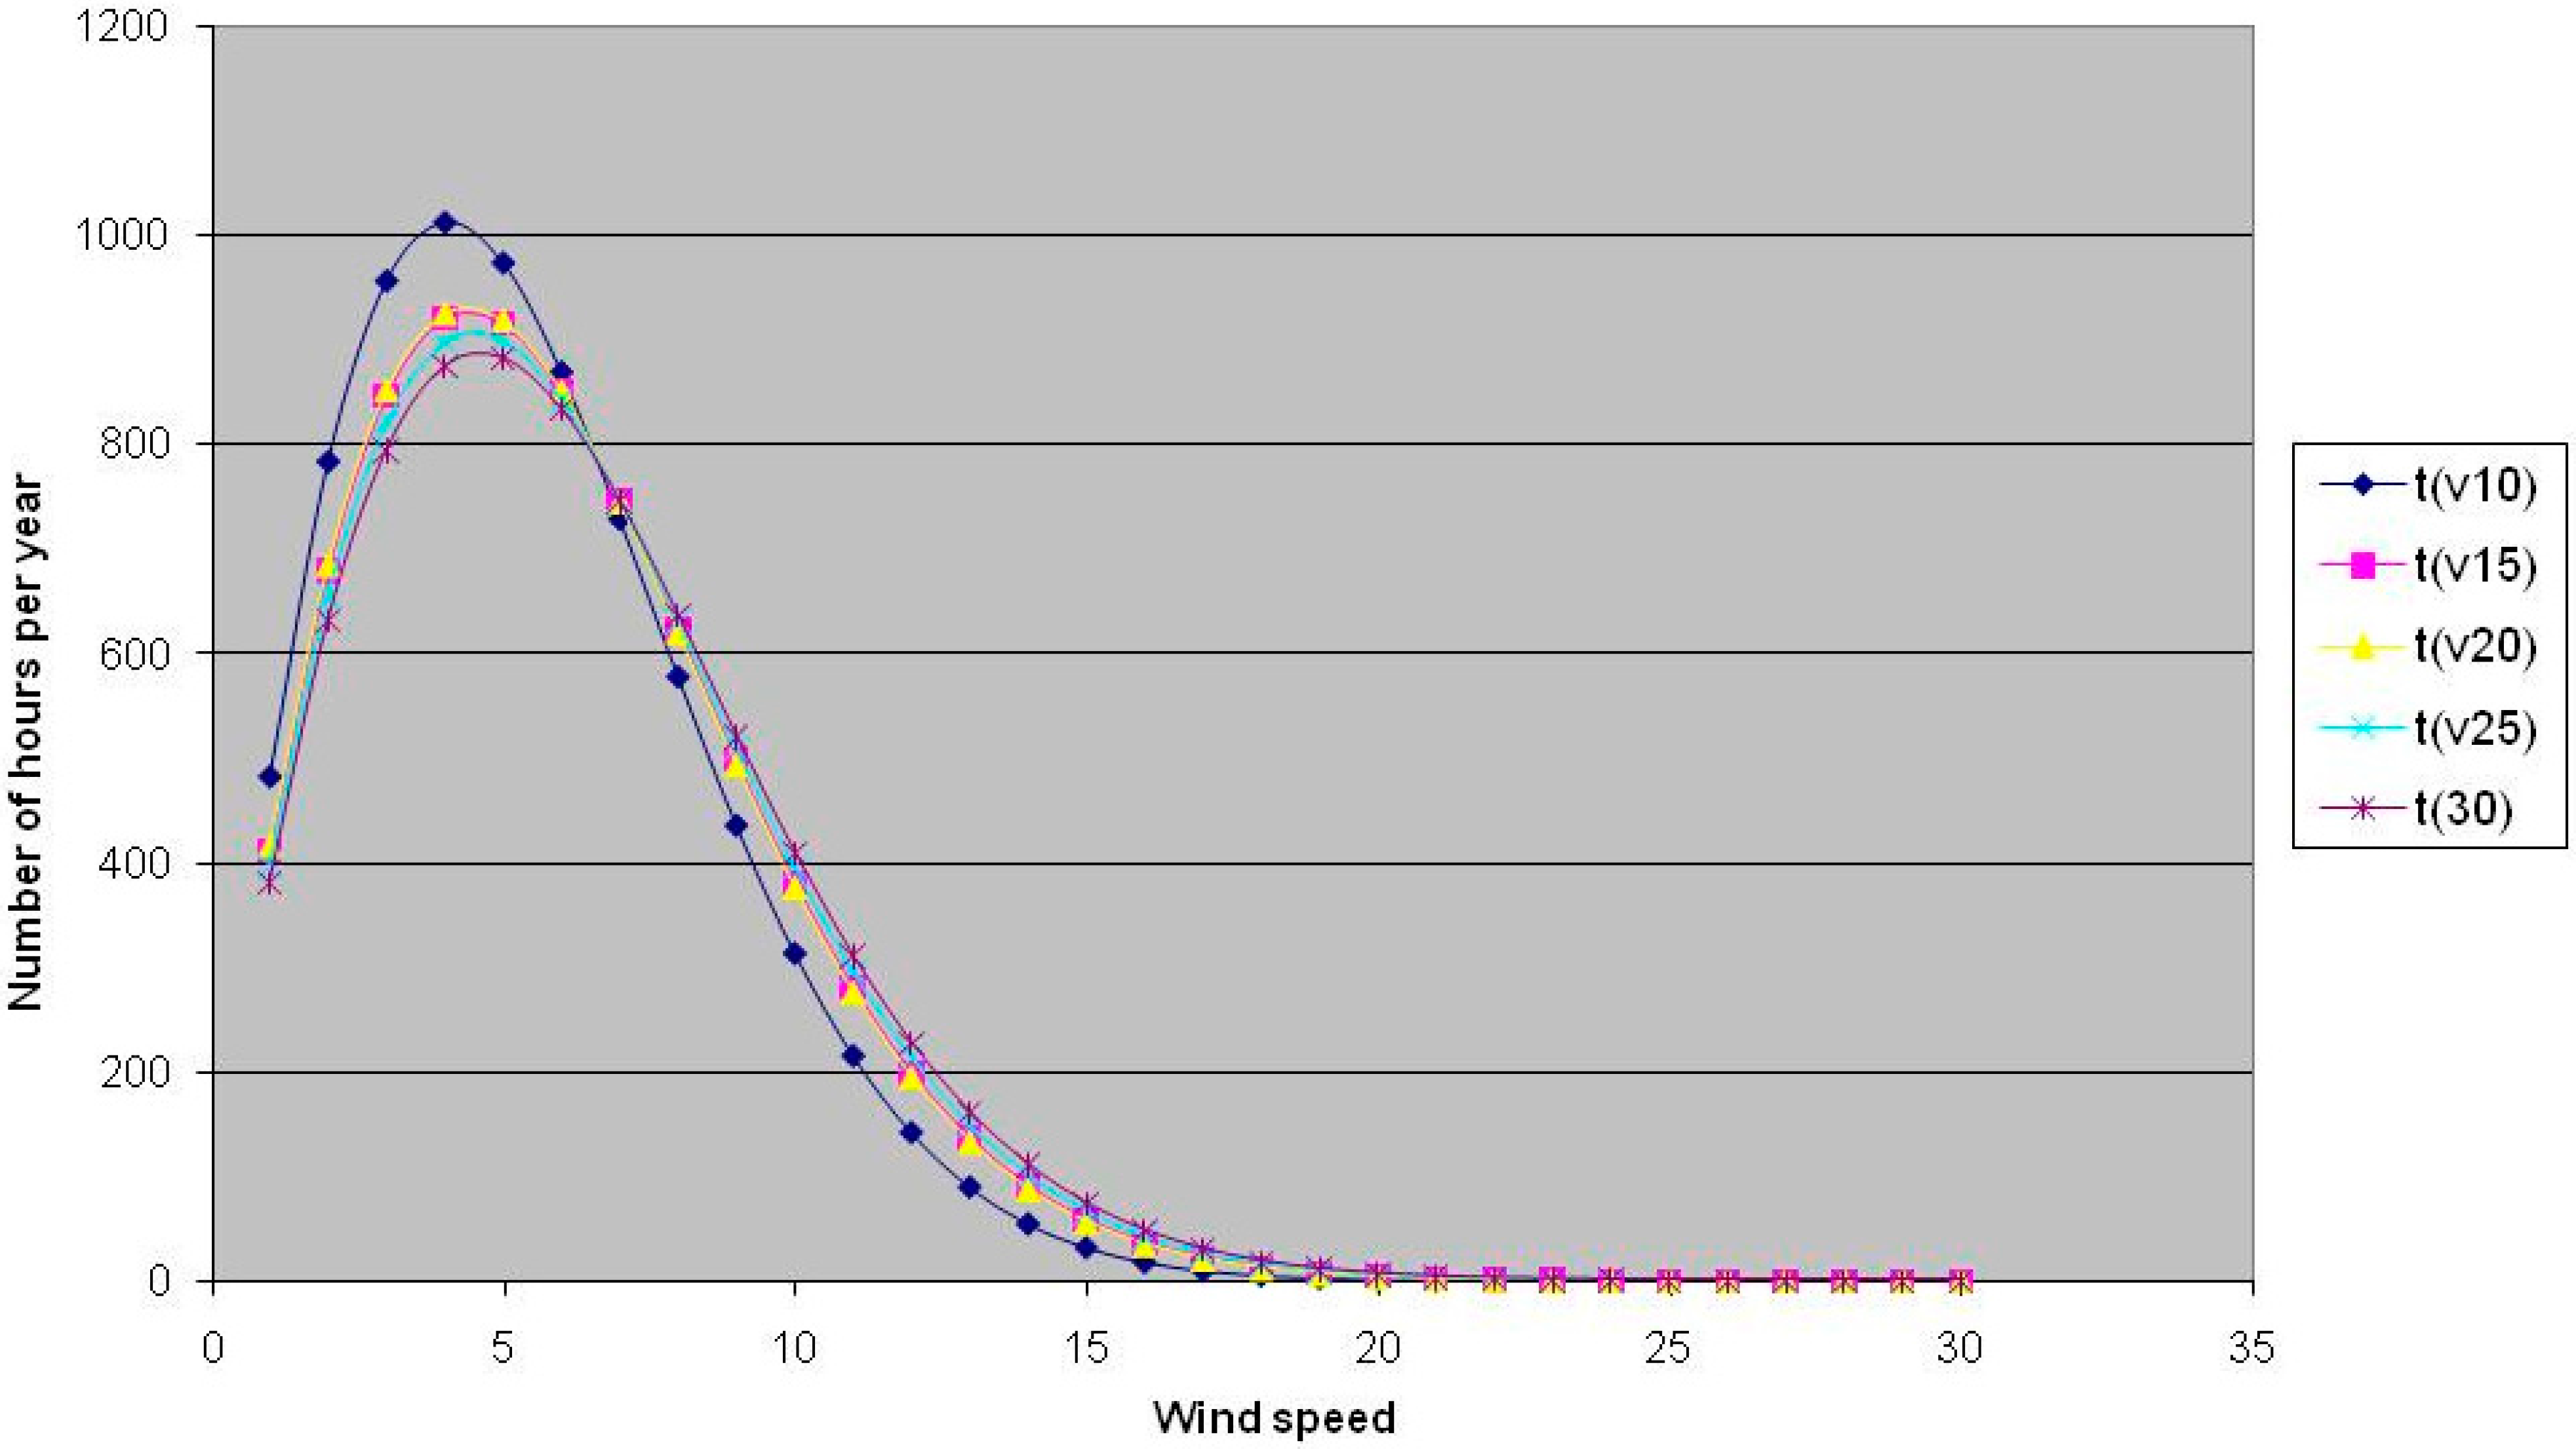
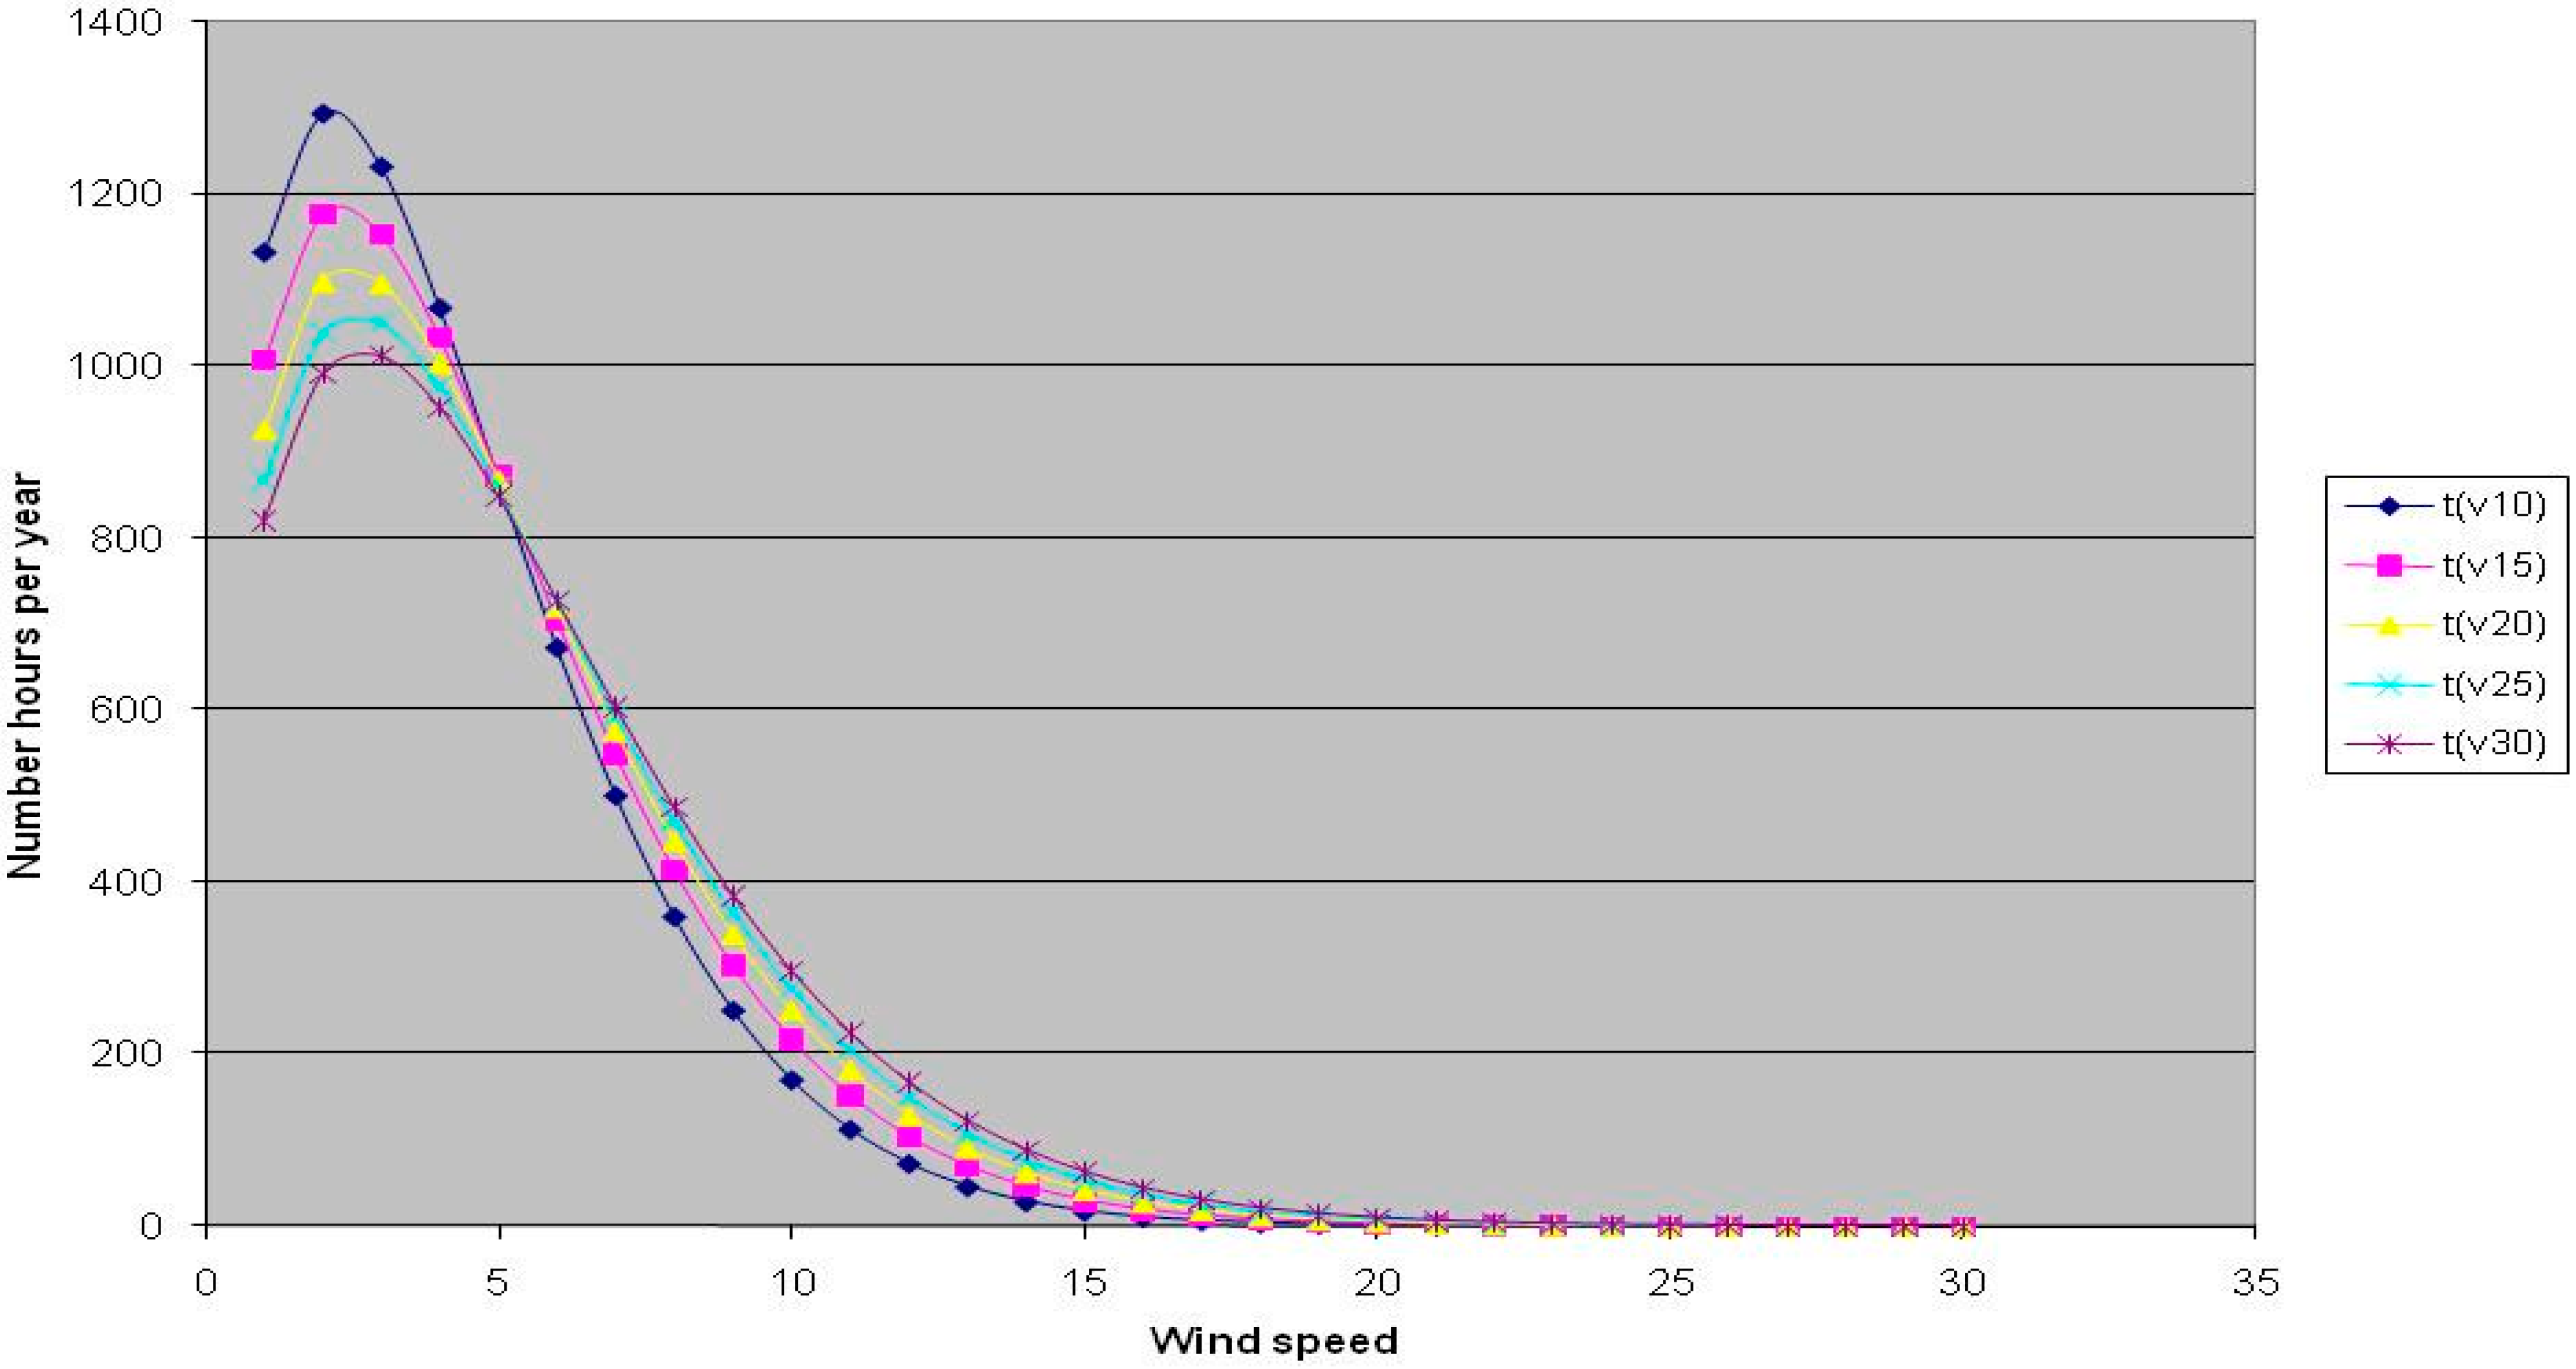
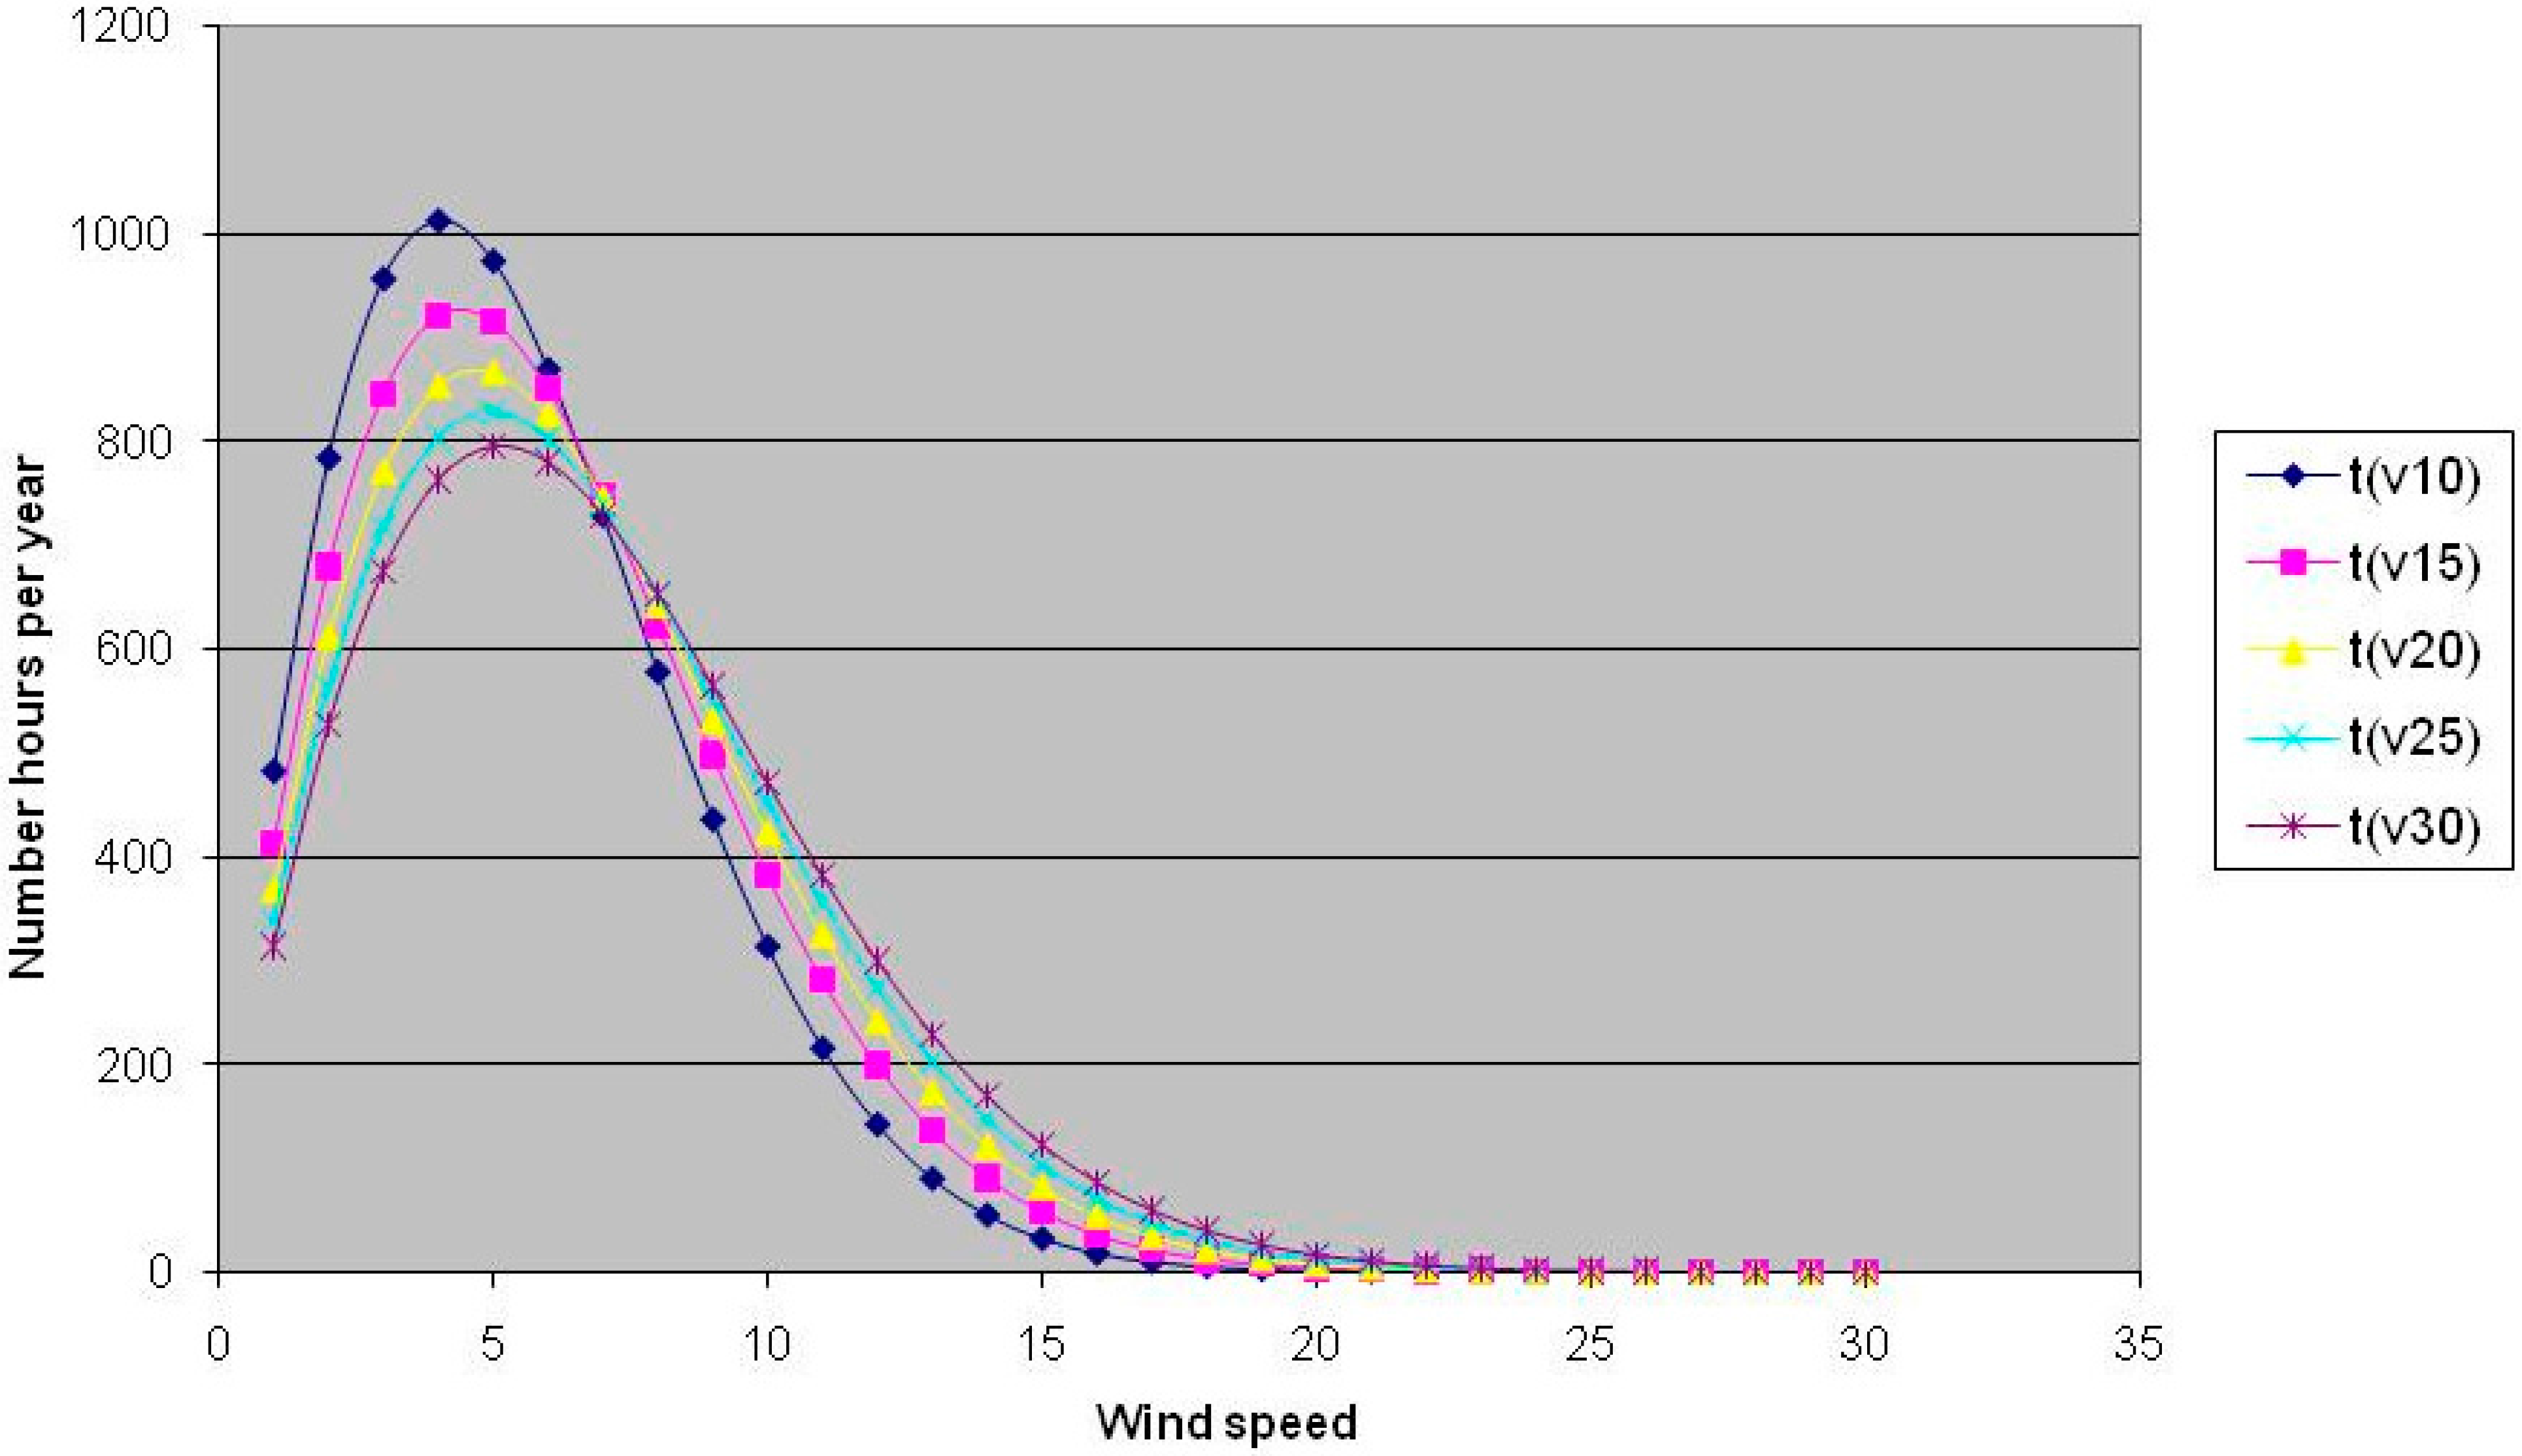
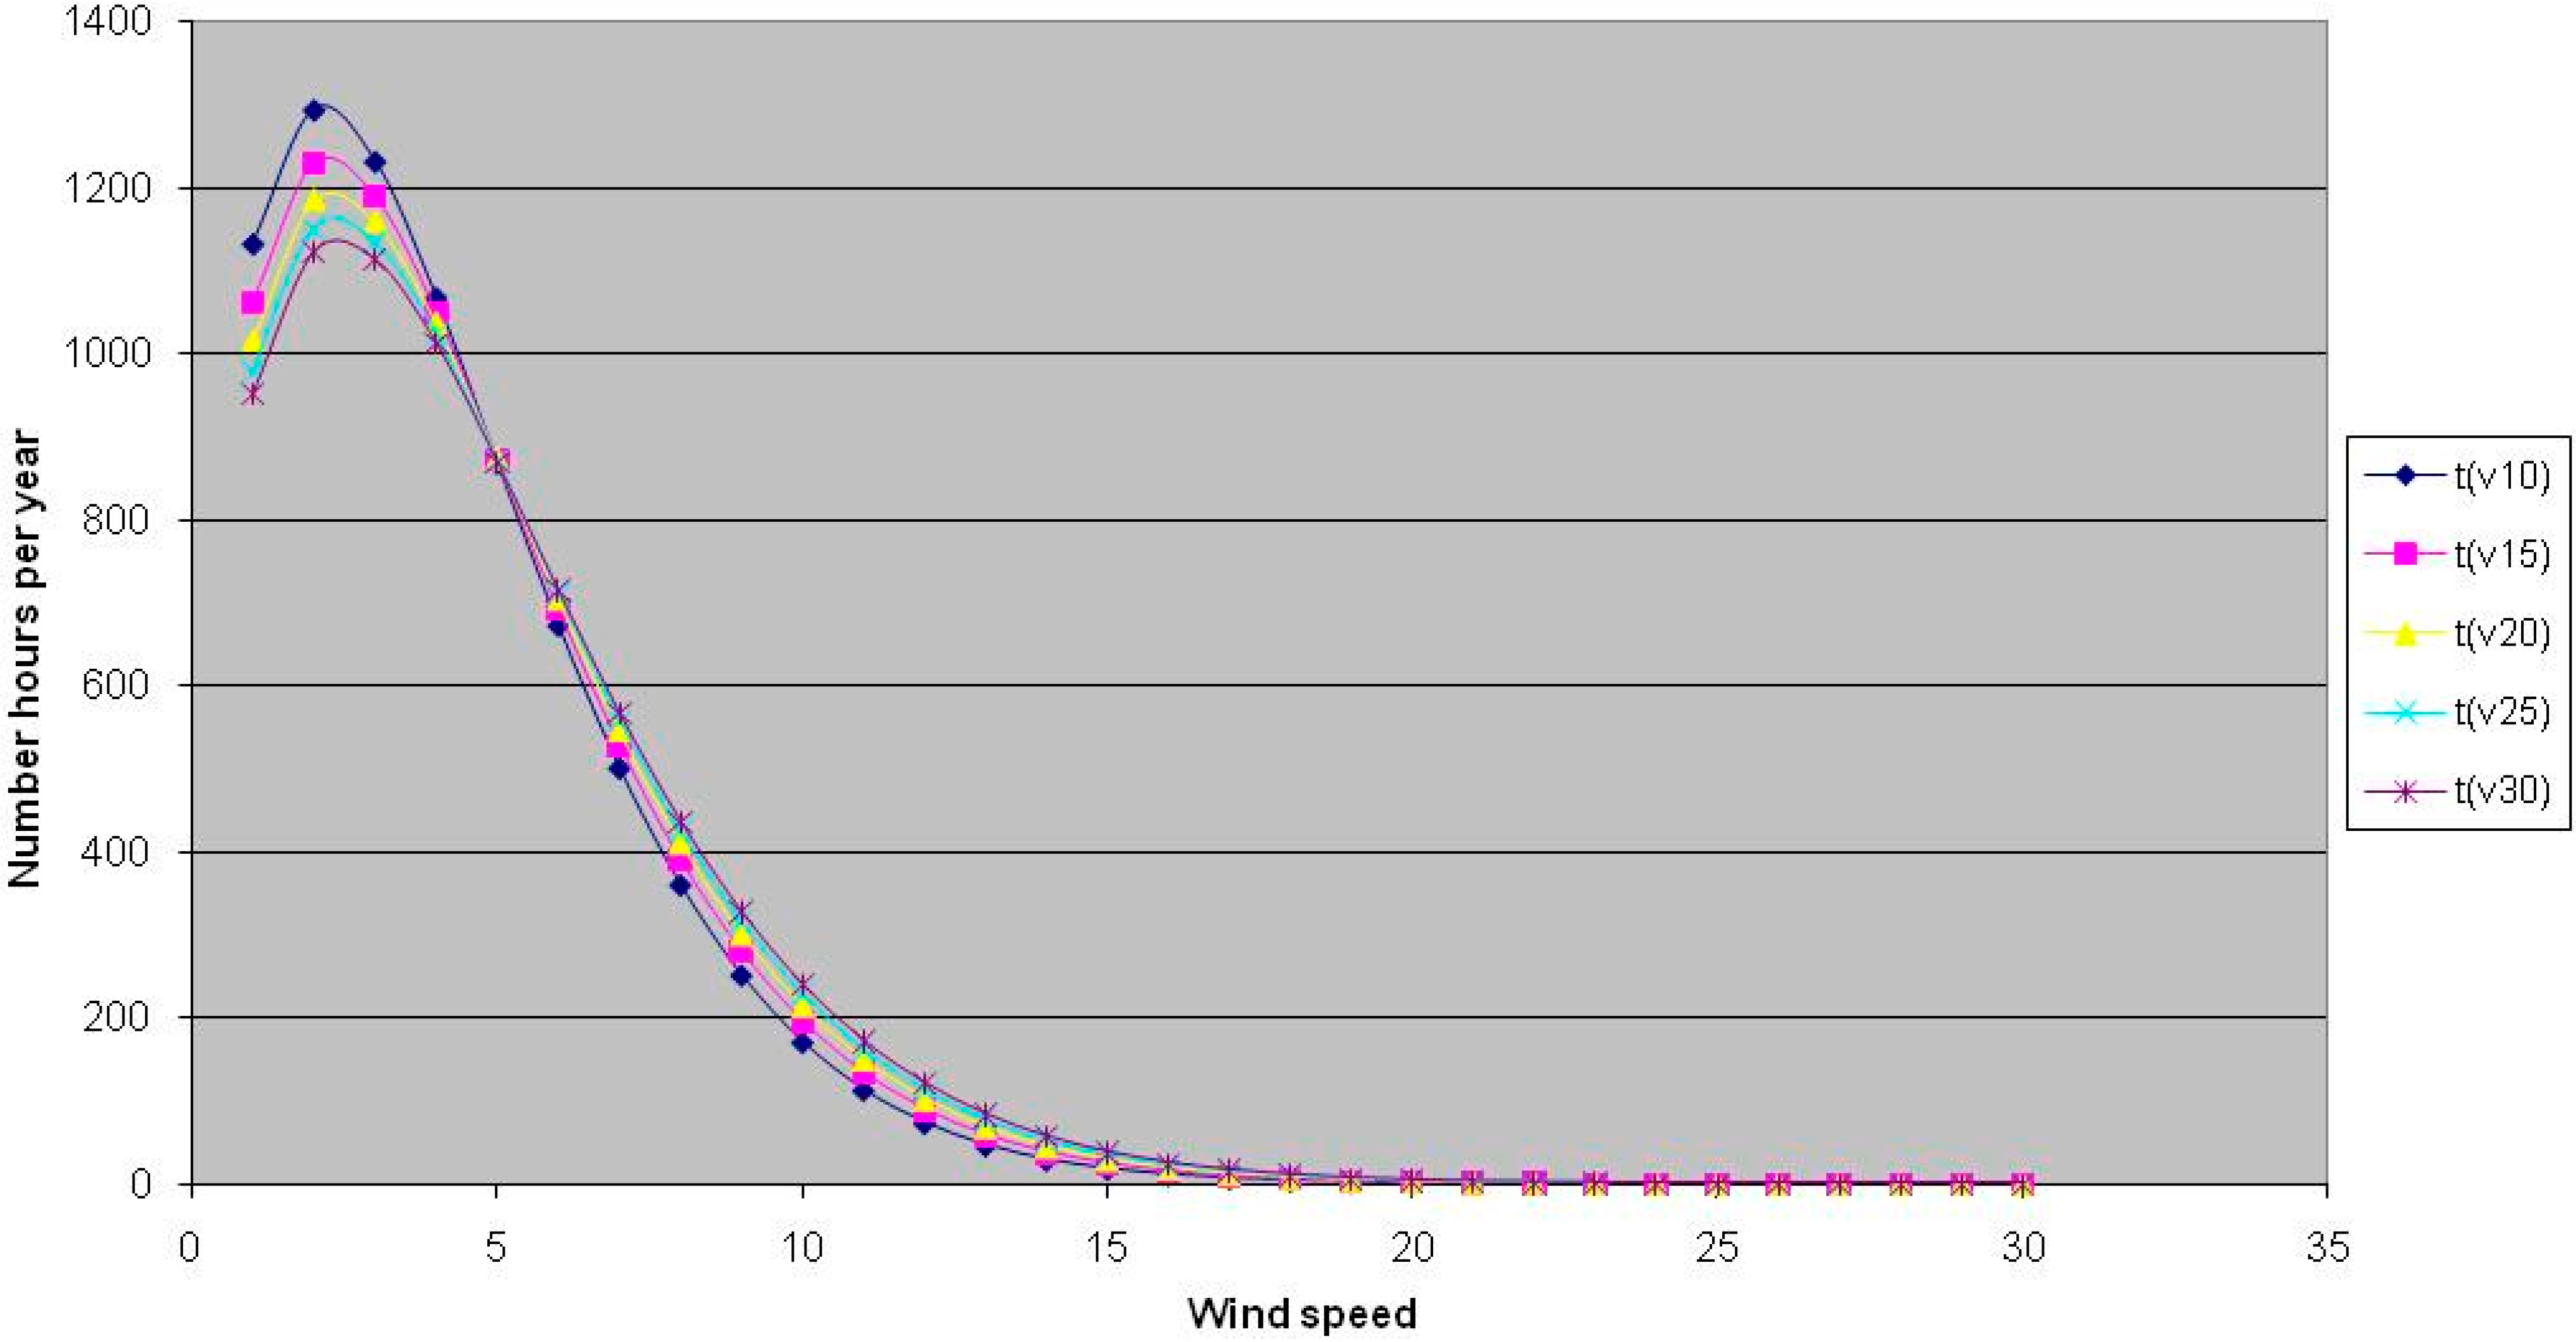
4.2. Energy Analysis
| Stations | c (m/s) | k | s % |
|---|---|---|---|
| Enna | 6.23 | 1.83 | 11.39 |
| Gela | 4.65 | 1.46 | 7.22 |


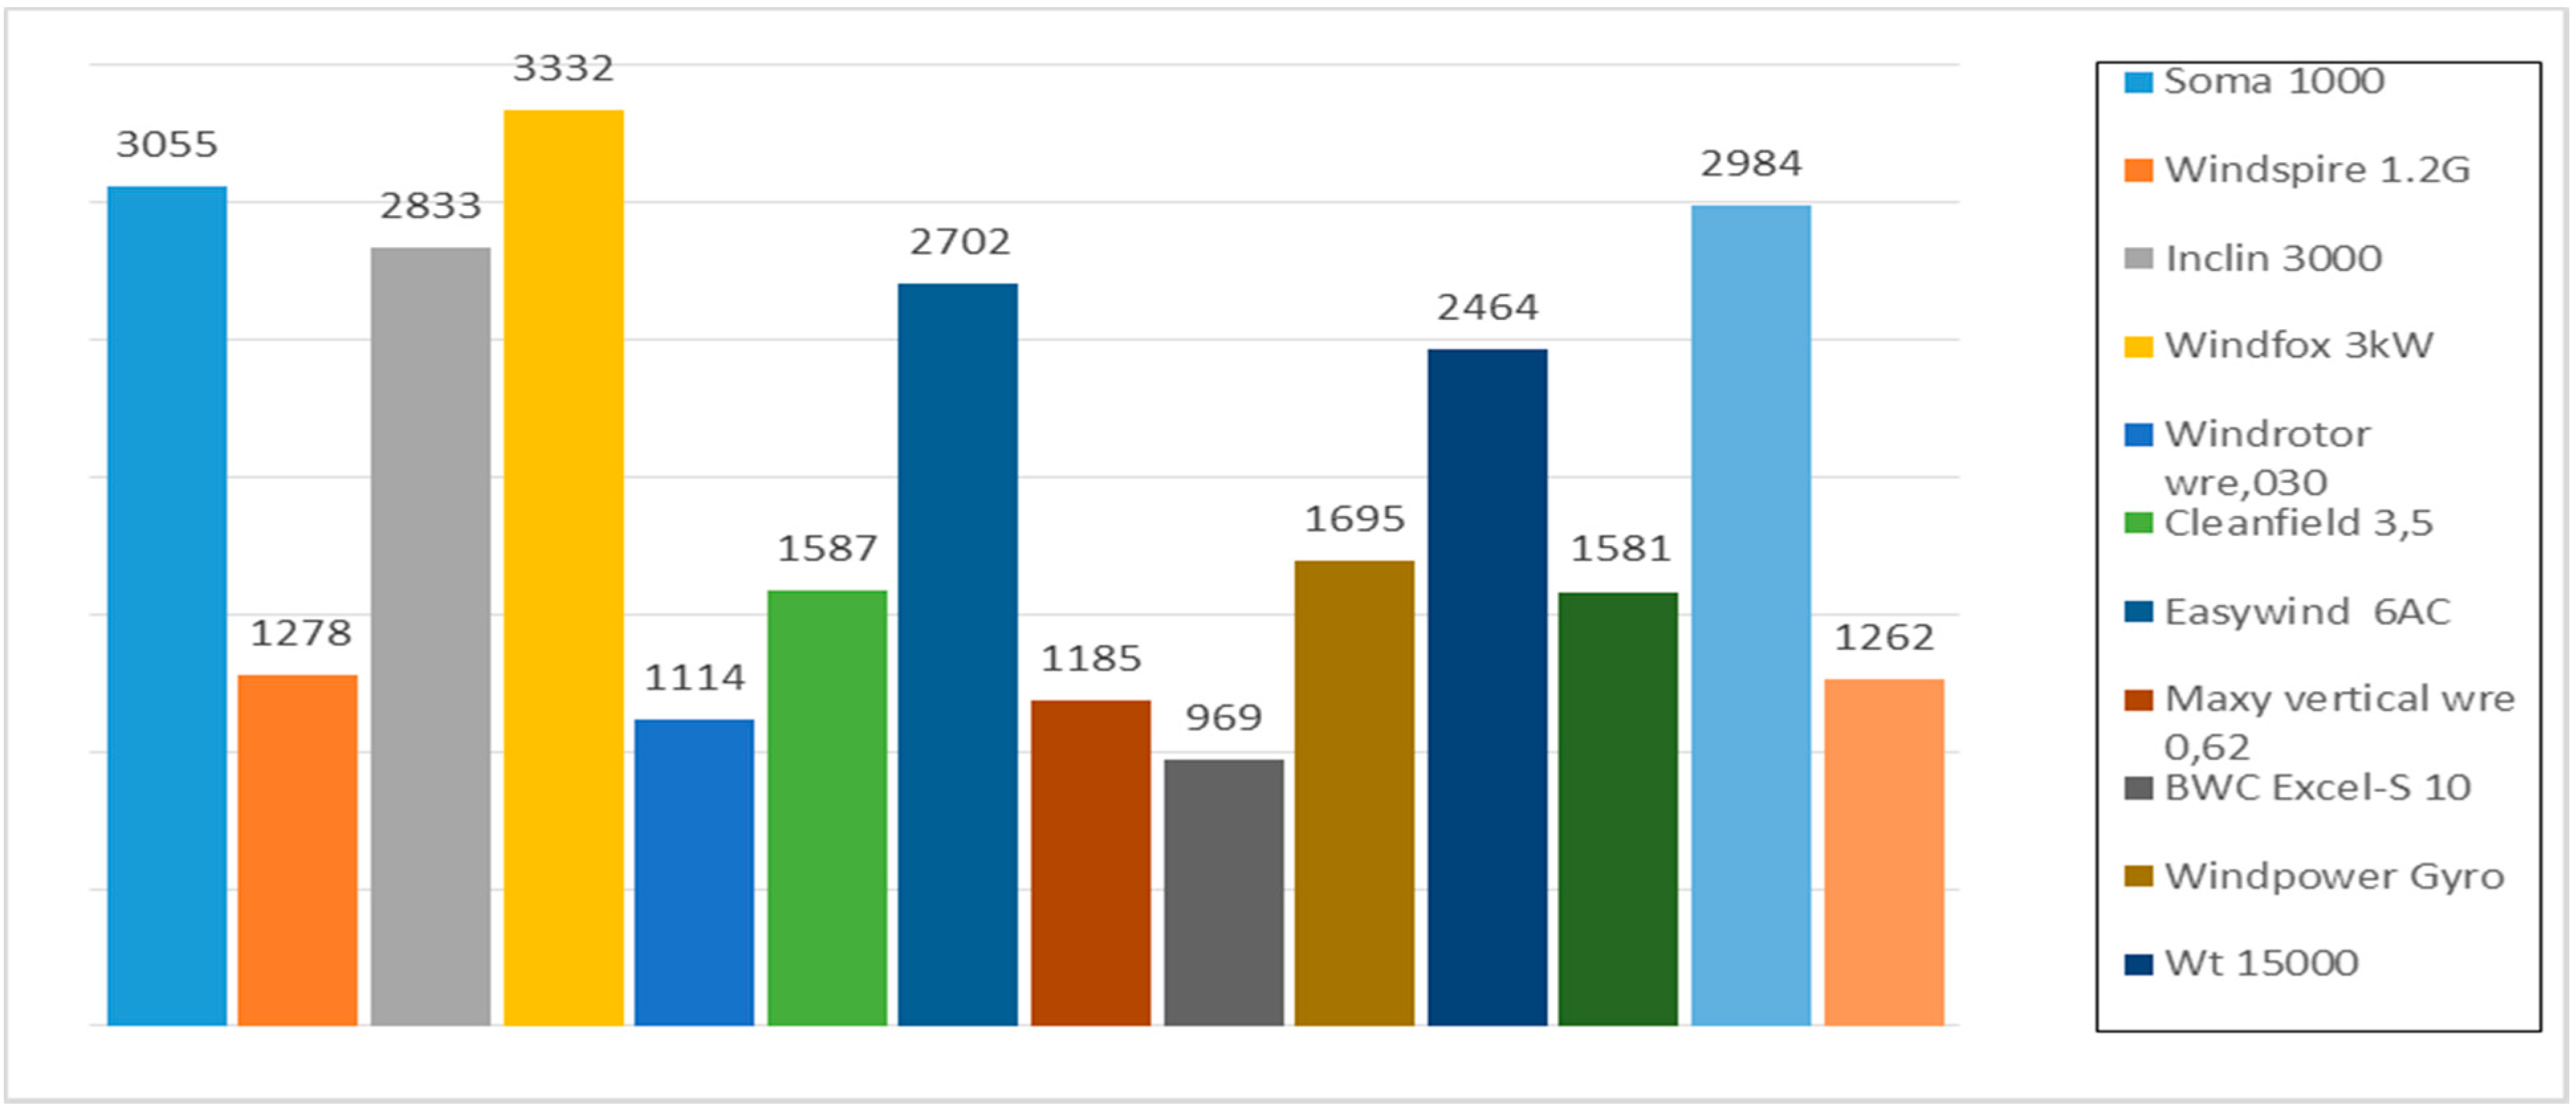
| Enna Sub-Urban Area | Enna Rural Area | |||||||
|---|---|---|---|---|---|---|---|---|
| Class 0.5–1.8 kW | height (m) | height (m) | ||||||
| Turbine | 10 | 15 | 20 | 25 | 10 | 15 | 20 | 25 |
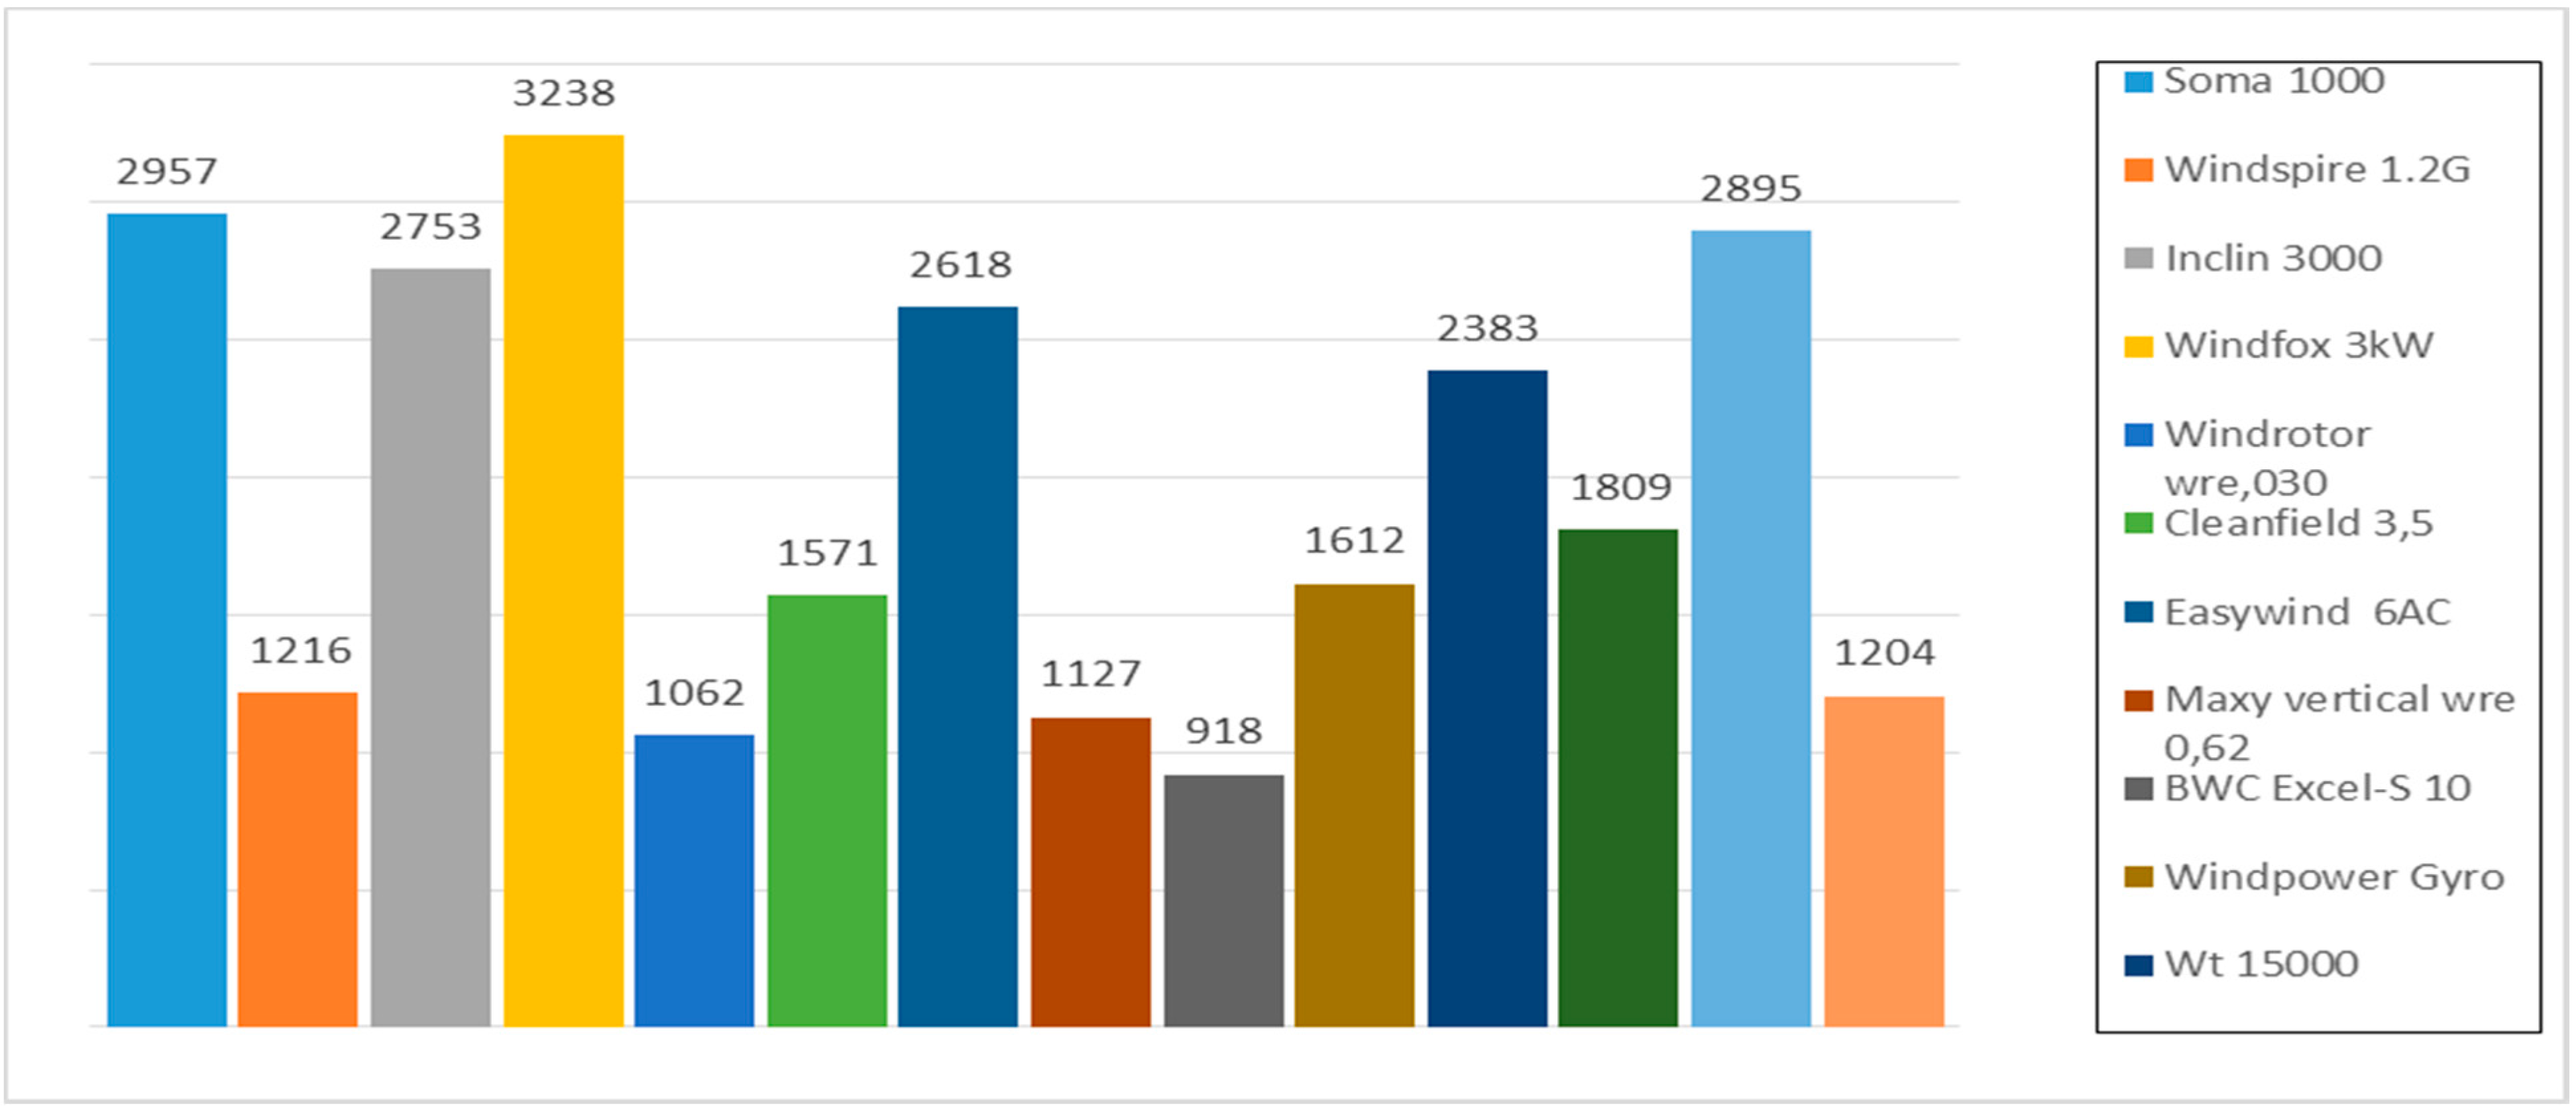
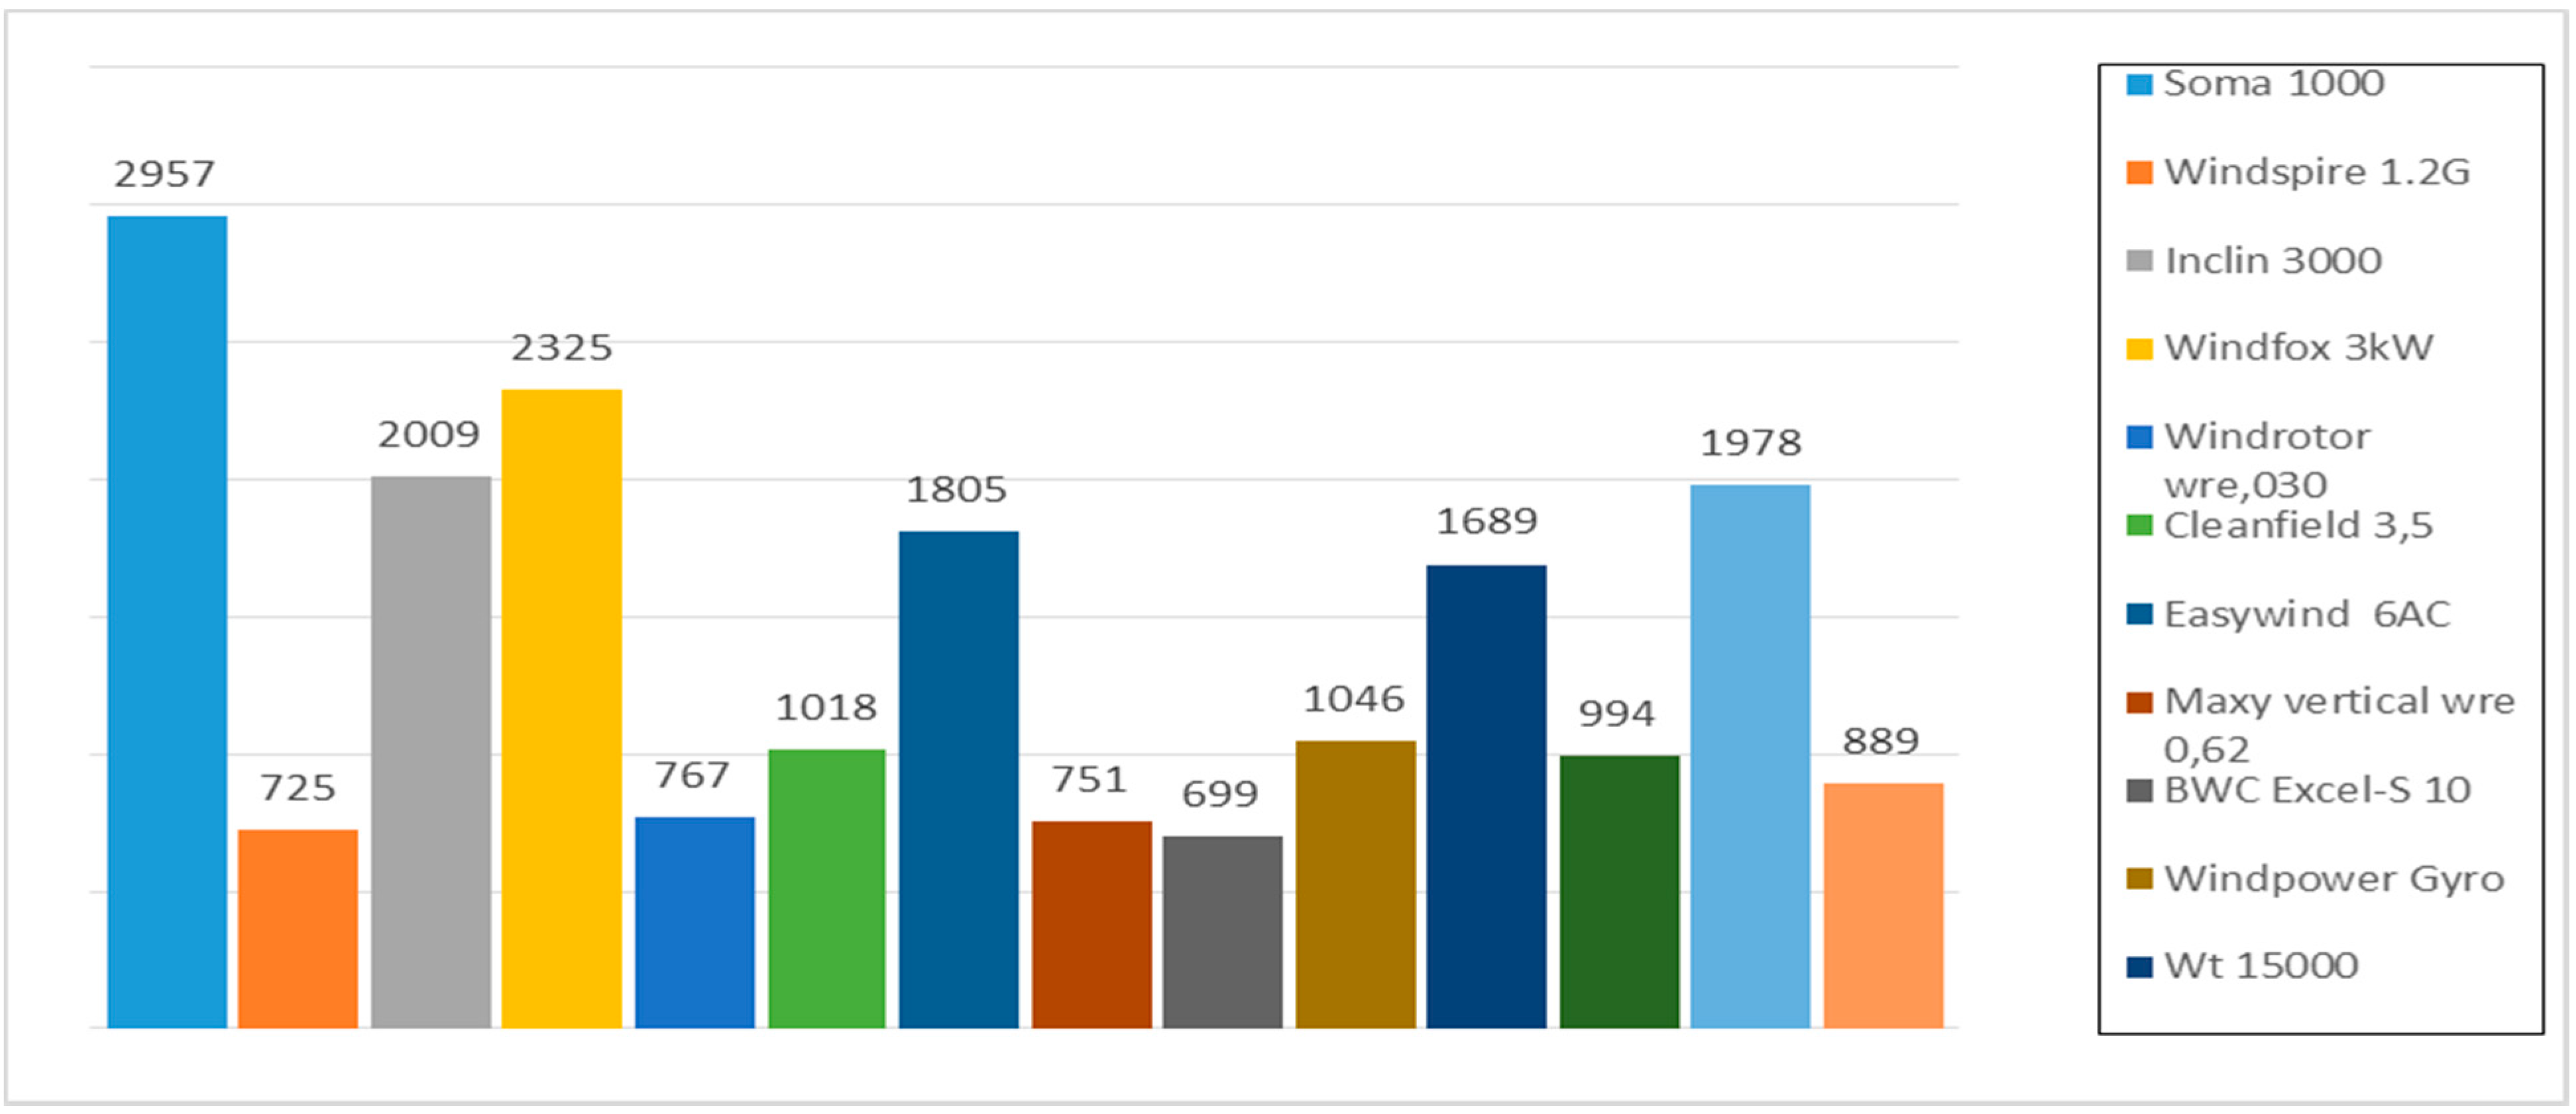
| Soma 1000—1 kW (HAWT) | 2550 | 2957 | 3256 | 3490 | 2550 | 2770 | 2929 | 3055 |
| Windspire 1.2 G—1.2 kW (VAWT) | 1159 | 1459 | 1693 | 1884 | 1159 | 1318 | 1438 | 1534 |
| Class 2–3.5 kW | height (m) | height (m) | ||||||
| Turbine | 10 | 15 | 20 | 25 | 10 | 15 | 20 | 25 |
| Inclin 3000—3 kW (HAWT) | 7259 | 8260 | 8999 | 9584 | 7259 | 7798 | 8191 | 8500 |
| Windfox—3 kW (HAWT) | 8540 | 9715 | 10577 | 11259 | 8540 | 9174 | 9634 | 9995 |
| WindRotor WRE.030—3 kW (VAWT) | 2569 | 3186 | 3683 | 4101 | 2569 | 2893 | 3141 | 3343 |
| Cleanfield—3.5 kW (VAWT) | 4327 | 5309 | 6080 | 6716 | 4327 | 4846 | 5238 | 5555 |
| Class 5–6 kW | height (m) | height (m) | ||||||
| Turbine | 10 | 15 | 20 | 25 | 10 | 15 | 20 | 25 |
| EasyWind 6 AC—6 kW (HAWT) | 13572 | 15708 | 17247 | 18443 | 13572 | 14730 | 15562 | 16212 |
| Maxy Vertical Wre 0.62—6 kW (VAWT) | 5406 | 6760 | 7861 | 8792 | 5406 | 6115 | 6661 | 7108 |
| Class 10–12.5 kW | height (m) | height (m) | ||||||
| Turbine | 15 | 20 | 25 | 30 | 15 | 20 | 25 | 30 |
| BWC Excel-S—10 kW (HAWT) | 9179 | 10807 | 12212 | 13453 | 8243 | 9035 | 9690 | 10253 |
| Windpower Gyro—10 kW (VAWT) | 16123 | 18719 | 20868 | 22702 | 14575 | 15888 | 16951 | 17849 |
| Class 15–17.5 kW | height (m) | height (m) | ||||||
| Turbine | 15 | 20 | 25 | 30 | 15 | 20 | 25 | 30 |
| WT 15000—15 kW (HAWT) | 35745 | 39490 | 42418 | 44805 | 33387 | 35392 | 36966 | 38262 |
| Baywinds 24–15—15 kW (HAWT) | 22633 | 26003 | 28773 | 31121 | 20607 | 22325 | 23711 | 24877 |
| Class 20–25 kW | height (m) | height (m) | ||||||
| Turbine | 15 | 20 | 25 | 30 | 15 | 20 | 25 | 30 |
| FL—20 kW (HAWT) | 57902 | 63288 | 67381 | 70647 | 54416 | 57385 | 59679 | 61541 |
| Big Star Vertical—20 kW (VAWT) | 24074 | 27756 | 30870 | 33571 | 21920 | 23744 | 25239 | 26512 |
| Gela Sub-Urban Area | Gela Rural Area | |||||||
|---|---|---|---|---|---|---|---|---|
| Class 0.5–1.8 kW | height (m) | height (m) | ||||||
| Turbine | 10 | 15 | 20 | 25 | 10 | 15 | 20 | 25 |
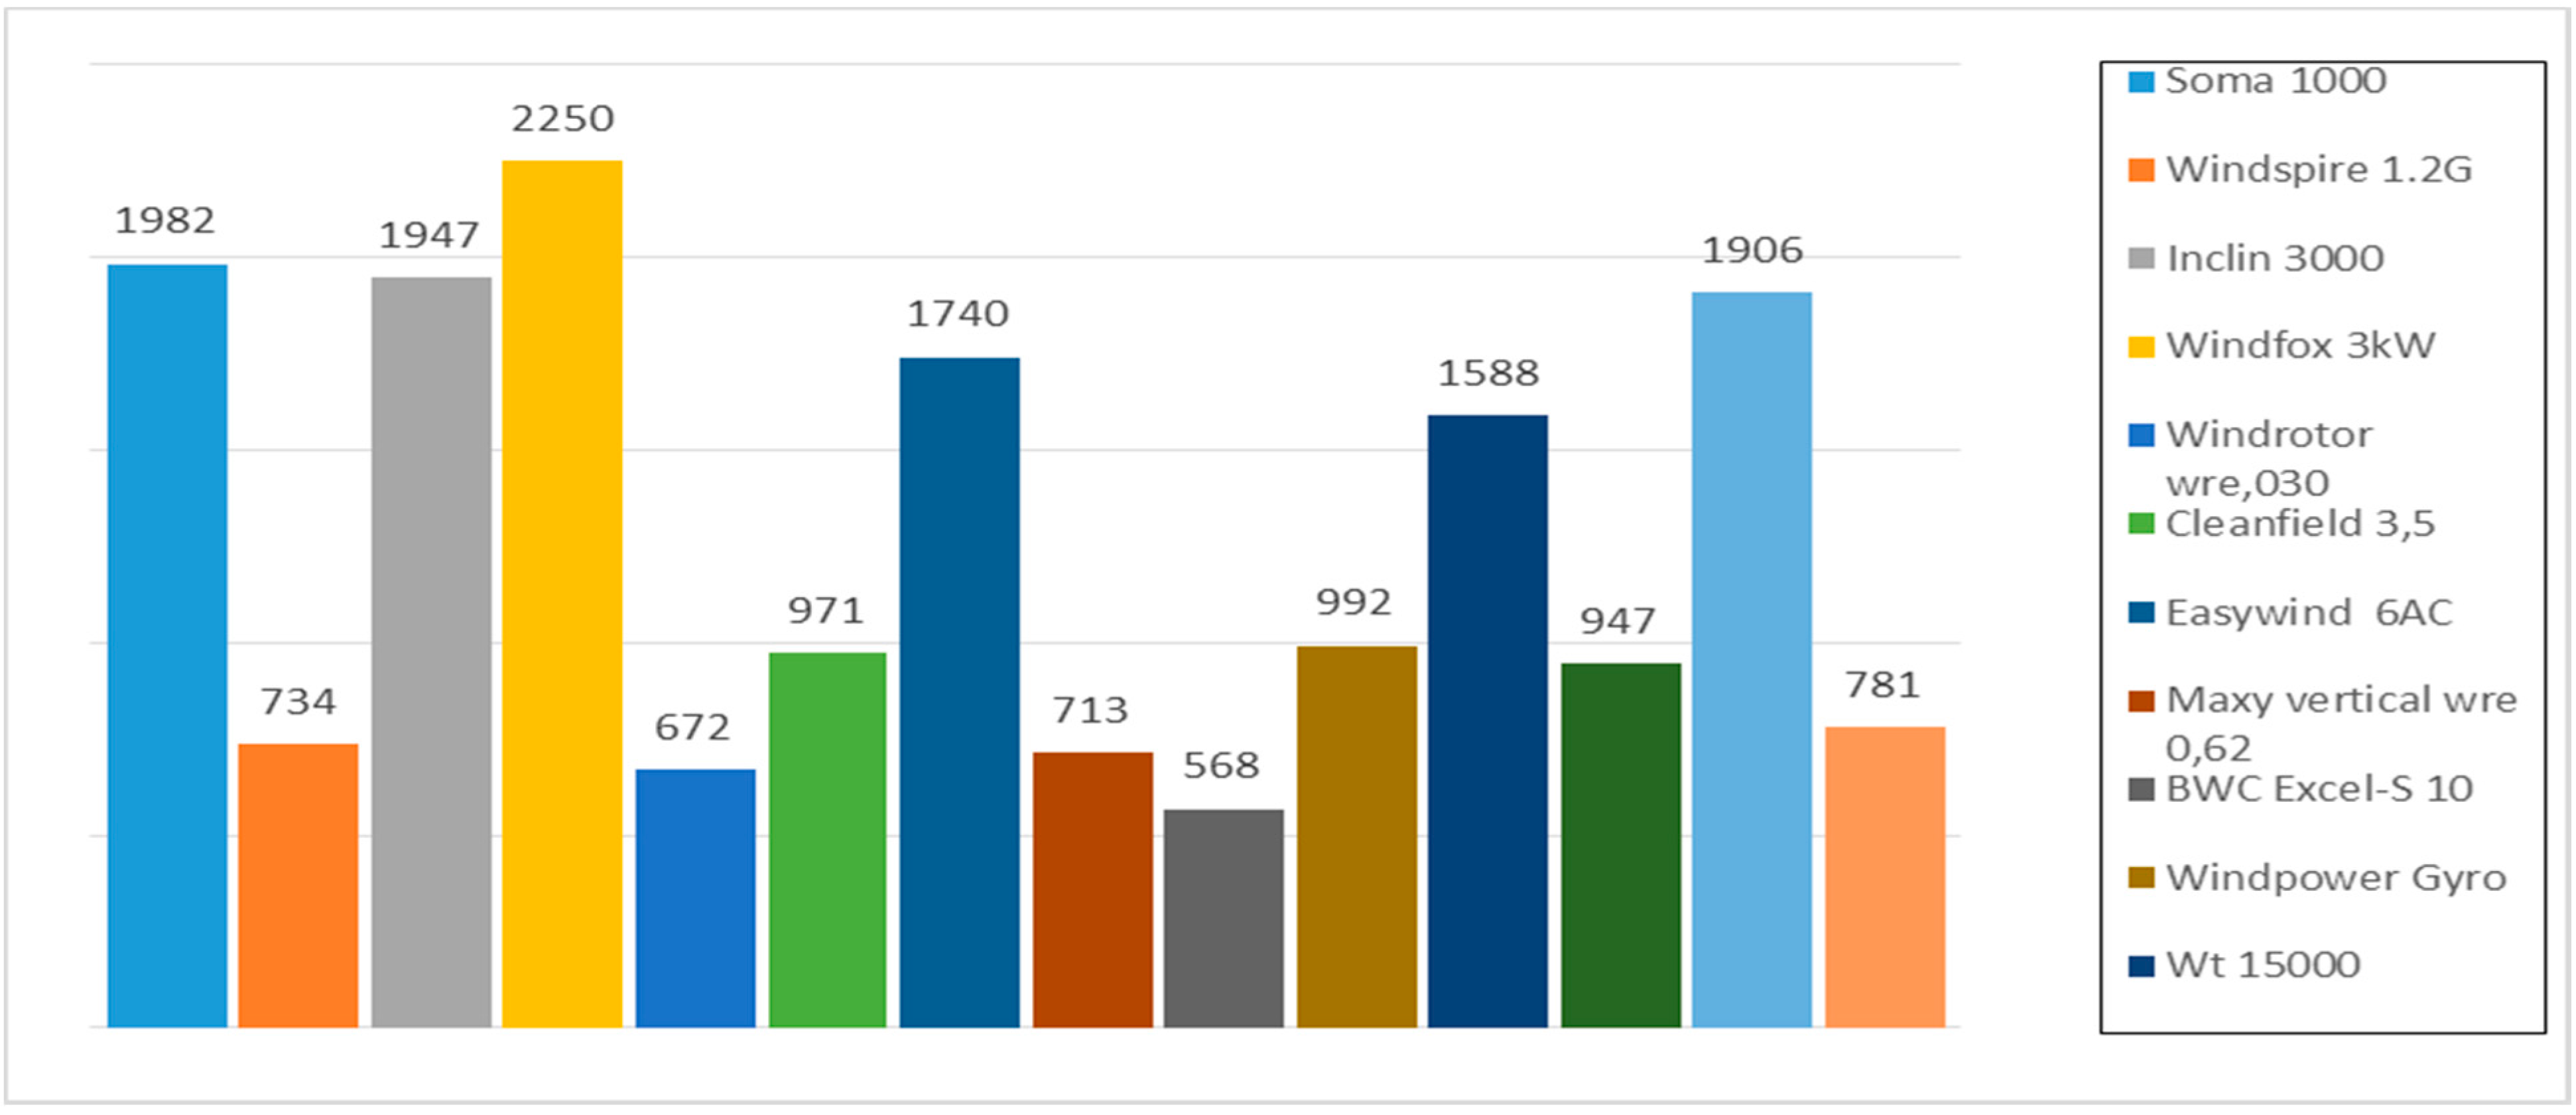
| Soma 1000—1 kW (HAWT) | 1678 | 1982 | 2213 | 2399 | 1678 | 1841 | 1961 | 2057 |
| Windspire 1.2 G—1.2 kW (VAWT) | 689 | 881 | 1037 | 1167 | 689 | 790 | 867 | 931 |
| Class 2–3.5 kW | height (m) | height (m) | ||||||
| Turbine | 10 | 15 | 20 | 25 | 10 | 15 | 20 | 25 |
| Inclin 3000—3 kW (HAWT) | 5079 | 5841 | 6419 | 6886 | 5079 | 5486 | 5787 | 6027 |
| Windfox—3 kW (HAWT) | 5830 | 6751 | 7444 | 8002 | 5830 | 6324 | 6687 | 6975 |
| WindRotor WRE.030—3 kW (VAWT) | 1617 | 2017 | 2344 | 2623 | 1617 | 1827 | 1988 | 2120 |
| Cleanfield—3.5 kW (VAWT) | 2759 | 3400 | 3916 | 4351 | 2759 | 3096 | 3353 | 3563 |
| Class 5–6 kW | height (m) | height (m) | ||||||
| Turbine | 10 | 15 | 20 | 25 | 10 | 15 | 20 | 25 |
| EasyWind 6 AC—6 kW (HAWT) | 8815 | 10438 | 11657 | 12634 | 8815 | 9685 | 10324 | 10832 |
| Maxy Vertical Wre 0.62—6 kW (VAWT) | 3420 | 4281 | 4991 | 5601 | 3420 | 3870 | 4218 | 4504 |
| Class 10–12.5 kW | height (m) | height (m) | ||||||
| Turbine | 15 | 20 | 25 | 30 | 15 | 20 | 25 | 30 |
| BWC Excel-S—10 kW (HAWT) | 5675 | 6716 | 7622 | 8428 | 5080 | 5583 | 6001 | 8428 |
| Windpower Gyro—10 kW (VAWT) | 9917 | 11622 | 13067 | 14324 | 8920 | 9765 | 10457 | 14324 |
| Class 15–17.5 kW | height (m) | height (m) | ||||||
| Turbine | 15 | 20 | 25 | 30 | 15 | 20 | 25 | 30 |
| WT 15000—15 kW (HAWT) | 23819 | 26657 | 28950 | 30872 | 22082 | 23557 | 24734 | 30872 |
| Baywinds 24–15—15 kW (HAWT) | 14199 | 16460 | 18362 | 20008 | 12866 | 13995 | 14916 | 20008 |
| Class 20–25 kW | height (m) | height (m) | ||||||
| Turbine | 15 | 20 | 25 | 30 | 15 | 20 | 25 | 30 |
| FL—20 kW (HAWT) | 38120 | 42542 | 46042 | 48932 | 35361 | 37706 | 39556 | 48932 |
| Big Star Vertical—20 kW (VAWT) | 15615 | 18020 | 20081 | 21891 | 14219 | 15400 | 16373 | 21891 |


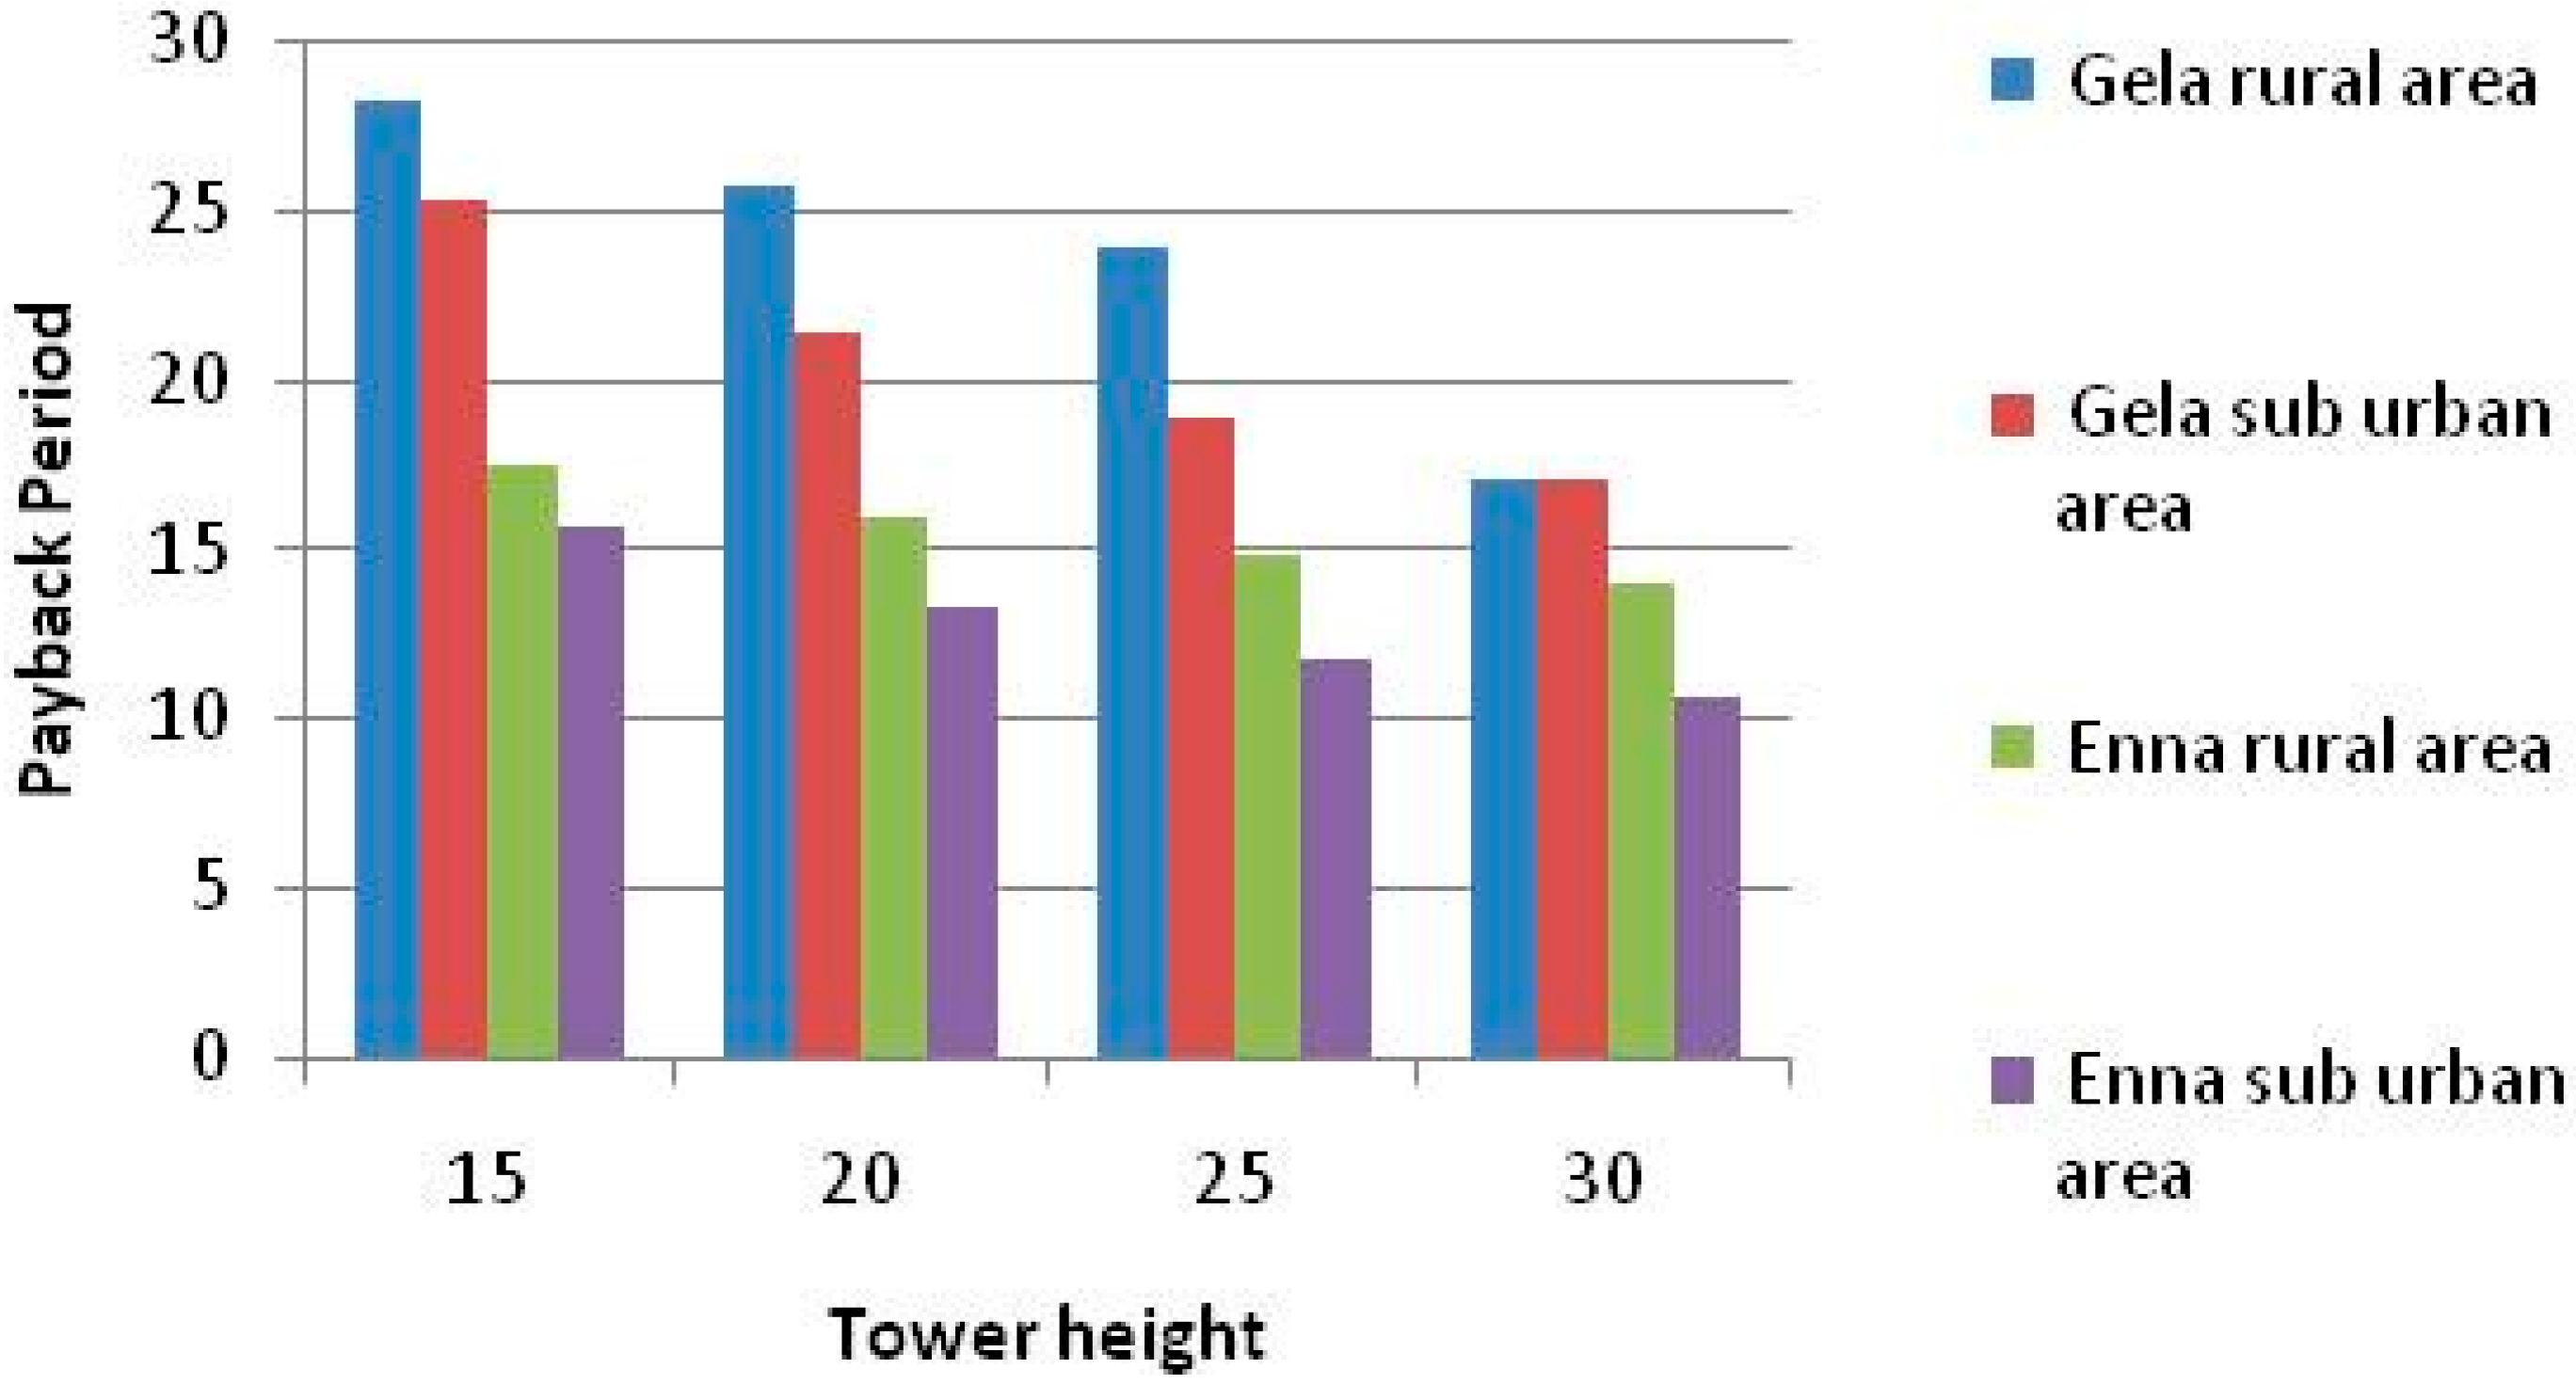
4.3. Economic Analysis
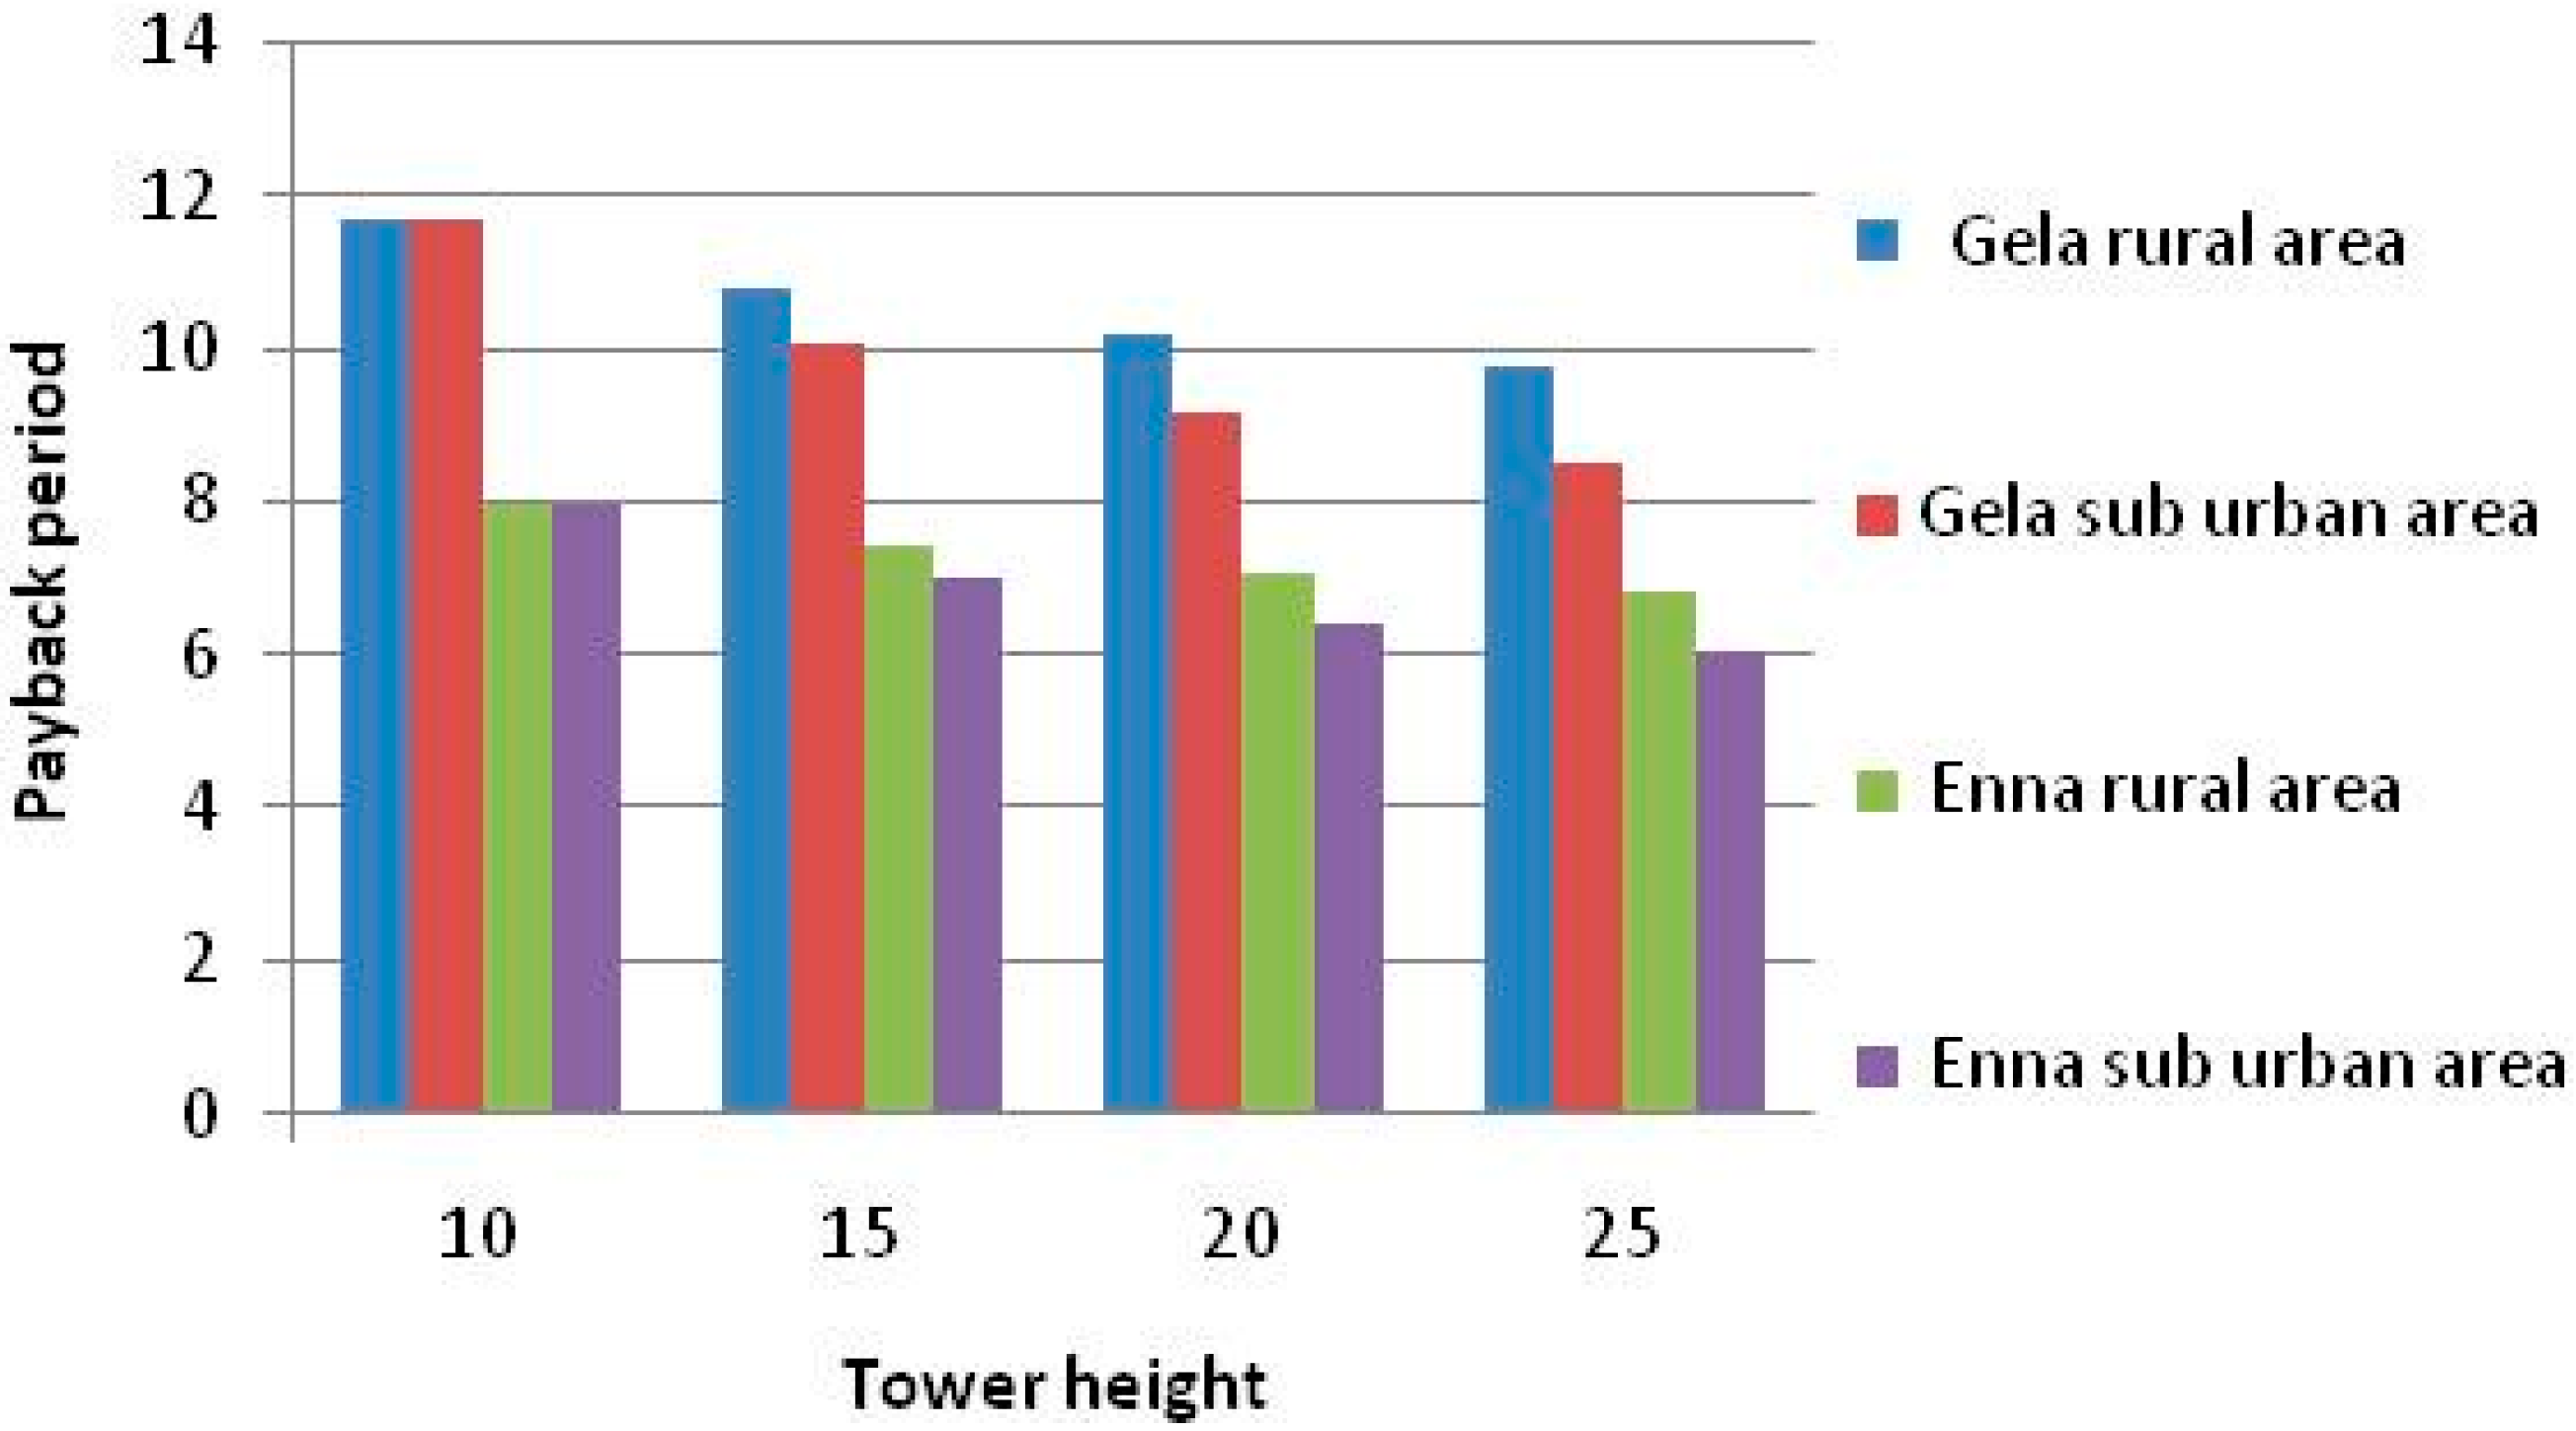

5. Conclusions
Author Contributions
Conflicts of Interest
Nomenclature
| HAWT is the Horizontal Axis Wind Turbine; |
| VAWT is the Vertical Axis Wind turbine; |
| DIA is the simple declaration of the opening activity; |
| GC is the green certificate; |
| α is the wind shear exponent; |
| c is the scale factor (m/s); |
| h0 is the surface roughness; |
| n is the wind speed bins; |
| k is the shape factor (dimensionless); |
| H(Ui) is the number of hours in wind speed bin Ui; |
| P(Ui) is the power output at that wind speed; |
| s is the calm wind frequency (in percentage); |
| t(v) is the Weibull Distribution; |
| v is the wind speed (m/s). |
References
- Vogiatzis, N.; Kotti, K.; Spanomitsion, S.; Stoukides, M. Analysis of wind potential and characteristics in north Aegen, Greece. Renew. Energy 2009, 29, 1193–1208. [Google Scholar] [CrossRef]
- Hopkins, W. Small to medium size wind turbines: Local use of a local resource. Renew. Energy 1999, 16, 944–947. [Google Scholar] [CrossRef]
- Kasbadji, N. Wind energy potential of Algeria. Renew. Energy 2000, 21, 553–562. [Google Scholar]
- Bilgili, M.; Sahin, B.; Kahraman, A. Wind energy potential in Antakya and Iskenderun regions, Turkey. Renew. Energy 2004, 29, 1733–1745. [Google Scholar] [CrossRef]
- Mathew, S.; Pandey, K.P.; Anil Kumar, V. Analysis of wind regimes for energy estimation. Renew. Energy 2002, 25, 381–399. [Google Scholar] [CrossRef]
- Lange, B.; Larsen, S.; Hojstrup, J.; Barthelmie, R. Importance of thermal effects and sea surface roughness for offshore wind resource assessment. J. Wind Eng. Ind. Aerodyn. 2004, 92, 959–988. [Google Scholar] [CrossRef]
- Rehman, S.; Al-Abbadi, N.M. Wind shear coefficients and energy yield for Dhahran, Saudi Arabia. Renew. Energy 2007, 32, 738–749. [Google Scholar] [CrossRef]
- Cabello, M.; Orza, J.A.G. Wind speed analysis in the province of Alicante, Spain. Potential for small-scale wind turbined. Renew. Sustain. Energy Rev. 2010, 14, 3185–3191. [Google Scholar] [CrossRef]
- Culotta, S.; Messineo, A.; Messineo, S. The Application of Different Model of Multi-Layer Perceptrons in the Estimation of Wind Speed. Adv. Mater. Res. 2012, 452–453, 690–694. [Google Scholar] [CrossRef]
- Messineo, A.; Culotta, S. Evaluating the Performances of Small Wind Turbines: A Case Study in the South of Italy. In Proceedings of the Energy Proceia 16 (PART A), Pages International Conference on Future Energy, Environment, and Materials, FEEM 2012, Hong Kong, China, 12–13 April 2012; pp. 137–145.
- Franzitta, V.; di Dio, V.; Milone, D.; Pitruzzella, S.; Trapanese, M.; Viola, A. Design of Bilateral Switched Reluctance Linear Generator to Convert Wave Energy: Case Study in Sicily. Adv. Mater. Res. 2014. [Google Scholar] [CrossRef]
- Bizzarri, G.; Lambertini, E.; Matteucci, F.; Rialti, M. Sistemi Microeolici nel Mercato Energetico Italiano: Previsione di Diffusione Tecnologica Attraverso uno Studio Delle Loro Potenzialità 65°. In Proceedings of the Congresso Nazionale ATI, Chia Laguna Resort, Cagliari, Italy, 13–17 September 2010.
- Burton, T.; Sharpe, D.; Jenkins, N.; Bossanyi, E. Wind Energy Handbook; John Wiley & Sons, Ltd.: Hoboken, NJ, USA, 2001. [Google Scholar]
- Ahmeda, S.A.; Mahammeda, H.O. A Statistical Analysis of Wind Power Density Based on the Weibull and Ralyeigh models of Penjwen Region Sulaimani/Iraq. Jordan J. Mech. Ind. Eng. 2012, 6, 135–140. [Google Scholar]
- Ulgen, K.; Hepbasli, A. determination of Weibull parameters for wind energy analysis of İzmir, Turkey Ege University, Ismir, İzmir, Turkey. Int. J. Energy Res. 2002, 26, 495–506. [Google Scholar] [CrossRef]
- Asdrubali, F.; Baldinelli, G.; D’Alessandro, F.; Scrucca, F. Life Cycle Assessment of electricity production from renewable energies: Review and results harmonization. Renew. Sustain. Energy Rev. 2015, 42, 1113–1122. [Google Scholar] [CrossRef]
© 2015 by the authors; licensee MDPI, Basel, Switzerland. This article is an open access article distributed under the terms and conditions of the Creative Commons Attribution license (http://creativecommons.org/licenses/by/4.0/).
Share and Cite
Culotta, S.; Franzitta, V.; Milone, D.; Moncada Lo Giudice, G. Small Wind Technology Diffusion in Suburban Areas of Sicily. Sustainability 2015, 7, 12693-12708. https://doi.org/10.3390/su70912693
Culotta S, Franzitta V, Milone D, Moncada Lo Giudice G. Small Wind Technology Diffusion in Suburban Areas of Sicily. Sustainability. 2015; 7(9):12693-12708. https://doi.org/10.3390/su70912693
Chicago/Turabian StyleCulotta, Simona, Vincenzo Franzitta, Daniele Milone, and Gino Moncada Lo Giudice. 2015. "Small Wind Technology Diffusion in Suburban Areas of Sicily" Sustainability 7, no. 9: 12693-12708. https://doi.org/10.3390/su70912693
APA StyleCulotta, S., Franzitta, V., Milone, D., & Moncada Lo Giudice, G. (2015). Small Wind Technology Diffusion in Suburban Areas of Sicily. Sustainability, 7(9), 12693-12708. https://doi.org/10.3390/su70912693