2.1. Candidate Site Selection
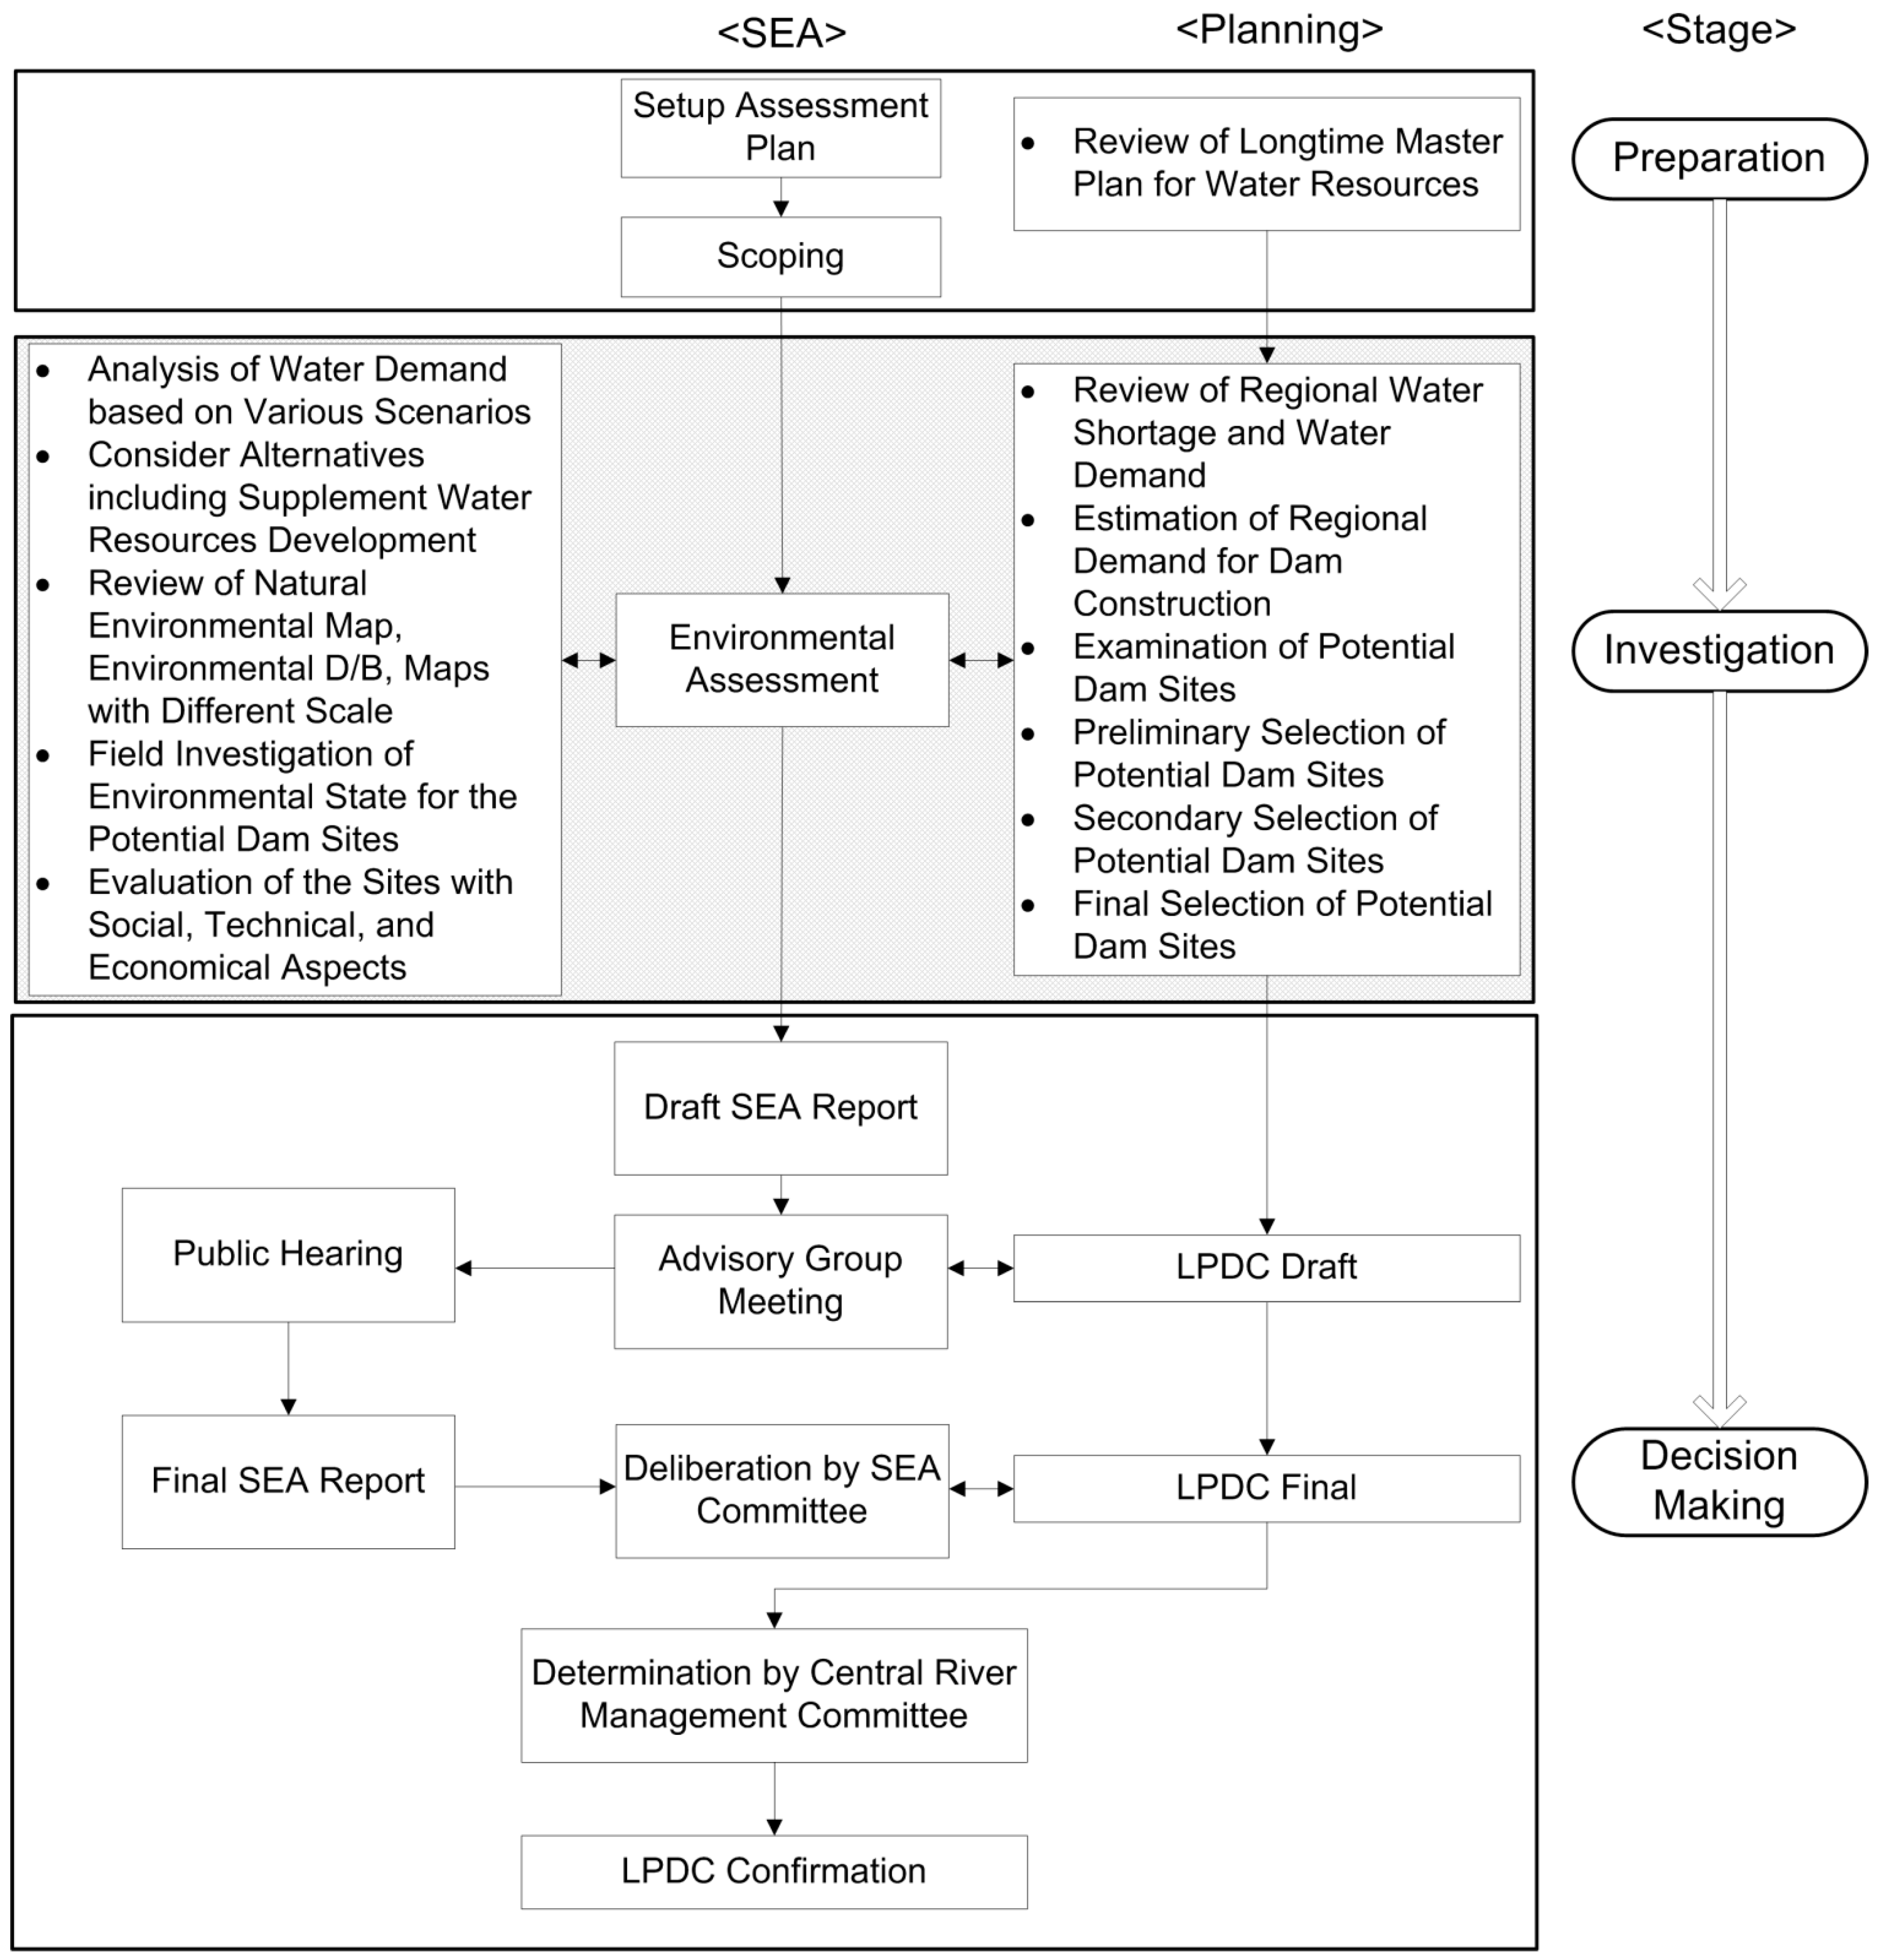
In Korea, the LPDC is established every 10 years and modified every five years. It requires implementation of an SEA.
Table 1 shows the 10 candidate sites for dam construction on four rivers in South Korea. On the Han River, two sites (S1 and S2) are on the northern tributary, and the other two (S3 and S4) are on the southern tributary. Similarly, on the Nakdong River, two sites (S5 and S6) are on the Nam River, a western tributary, and the other two sites (S7 and S8) are on the Geumho River, an eastern tributary. The two sites (S9 and S10) are on the Bocheong River tributary, as shown in
Figure 2. For our purposes, the most appropriate dam site would be the one with the smallest environmental impact. Among the ten dam sites, four are on the Han River, four are on the Nakdong River, and two are on the Geum River, as shown in
Table 1. All candidate sites are generally upstream on the rivers.
Table 1.
Candidate sites for dams in the LPDC SEA.
Table 1.
Candidate sites for dams in the LPDC SEA.
| Watershed | Sites | Site Number |
|---|
| Han River | Sooip stream 1 | S1 |
| Sooip stream 2 | S2 |
| Dal stream 1 | S3 |
| Dal stream 2 | S4 |
| Nam River | Im stream, | S5 |
| Mansoo stream | S6 |
| Geumho River | Gohyun stream | S7 |
| Hoenggye stream | S8 |
| Bocheong River | Bocheong 1 | S9 |
| Bocheong 2 | S10 |
Figure 2.
Location of candidate sites for dam planning in the LPDC SEA.
Figure 2.
Location of candidate sites for dam planning in the LPDC SEA.
To meet Korean water resource planning goals, one dam construction site should be selected on the Han River, one site on the Bocheong River, and two sites on the tributaries of the Nakdong River,
i.e., the Geumho River and Bocheong River [
1]. Abandoned mines exist in the upstream areas, which require precise investigation of possible effects and mitigating alternatives in future dam construction. To evaluate the environmental conditions of the dam site candidates, environmental data were collected and categorized in terms of landscape and geology (LG), ecological worth (EW), water quality (WQ), and environmental toxicity (ET) in the LPDC, as shown in
Table 2.
Table 2.
Assessment considerations in examinations of potential dam sites.
Table 2.
Assessment considerations in examinations of potential dam sites.
| Considerations | Monitoring Factors |
|---|
| Landscape and geology (LG) | |
| Ecological worth (EW) | Land: land plants, birds, mammals, insects, amphibians, and reptiles Water: fish, benthic macro-invertebrates, phytoplankton, and zooplankton
|
| Water quality (WQ) | pH, temperature, BOD, COD, DO, SS, TN, TP, total coliforms, heavy metals (As, Cd, Pb, Cr+6, Cu) (14 items) Stream water quality assessment for investigation results
|
| Environmental toxicity (ET) | |
Table 3.
Landscape and geology.
Table 3.
Landscape and geology.
| Sites | Natural Preserves | Natural Monuments and Cultural Assets |
|---|
| Han River | S1 | DMZ | Jigyeon Falls |
| S2 | DMZ | Dutayeon Falls |
| S3 | 0 | 0 |
| S4 | Songnisan National Park | Yongchu Falls |
| Nam River | S5 | Jirisan National Park | Yongyudam Pond |
| S6 | Jirisan National Park | Silsangsa Temple |
| Geumho River | S7 | − | − |
| S8 | − | − |
| Bocheong River | S9 | 0 | 0 |
| S10 | 0 | 0 |
Table 3 shows the assessment of landscape and geology information based on connected reservation regions and the landscapes of the candidate dam sites. The demilitarized zone (DMZ) and national parks are considered part of the national reserve system, and renowned waterfalls, ponds, and temples are regarded as valuable natural landscapes for topology and geology information. In this study, the Geumho River sites (Gohyun (S7) and Hoenggye (S8) streams) were not part of the natural reserve system and no natural landscape data were available (
Table 3).
Table 4 shows the number of endangered species at the dam candidate sites, as defined by Korean legal protection level 2. The SEA monitored endangered species of plants, mammals, birds, amphibians, reptiles, fish, insects, and invertebrates. The total numbers of endangered species per site ranged between 18 and 0.
Table 5 shows the observed average water quality parameters. The SEA reports biological oxygen demand (BOD), chemical oxygen demand (COD), total nitrogen (TN), and total phosphorus (TP) as water quality parameters. All water quality parameters were monitored three to four times a year at each site.
Table 4.
Number of endangered species.
Table 4.
Number of endangered species.
| Sites | Endangered Species Based on Legal Protection Level 2 |
|---|
| Total | p | m | a | r | f | i | in |
|---|
| Han River | S1 | 18 | 11 | 2 | 2 | 0 | 3 | 0 | 0 |
| S2 | 17 | 11 | 2 | 1 | 0 | 3 | 0 | 0 |
| S3 | 6 | 2 | 1 | 2 | 0 | 1 | 0 | 0 |
| S4 | 13 | 9 | 1 | 1 | 0 | 2 | 0 | 0 |
| Nam River | S5 | 4 | 0 | 1 | 2 | 0 | 1 | 0 | 0 |
| S6 | 9 | 5 | 2 | 1 | 0 | 1 | 0 | 0 |
| Geumho River | S7 | 1 | 1 | 0 | 0 | 0 | 0 | 0 | 0 |
| S8 | 2 | 1 | 1 | 0 | 0 | 0 | 0 | 0 |
| Bocheong River | S9 | 1 | 0 | 0 | 1 | 0 | 0 | 0 | 0 |
| S10 | 0 | 0 | 0 | 0 | 0 | 0 | 0 | 0 |
Table 5.
Water quality parameters and observations.
Table 5.
Water quality parameters and observations.
Parameters
(unit: mg/L) | Han River | Nam River | Geumho River | Bocheong River |
|---|
| S1 | S2 | S3 | S4 | S5 | S6 | S7 | S8 | S9 | S10 |
|---|
| BOD | 0.32 | 0.30 | 0.81 | 0.76 | 1.58 | 1.09 | 0.71 | 0.45 | 0.52 | 0.80 |
| COD | 1.48 | 1.50 | 2.81 | 2.13 | 2.58 | 2.29 | 3.69 | 3.30 | 1.22 | 2.34 |
| TN | 1.324 | 1.245 | 2.484 | 2.546 | 1.119 | 0.901 | 4.459 | 2.911 | 0.863 | 2.581 |
| TP | 0.001 | 0.004 | 0.030 | 0.027 | 0.016 | 0.058 | 0.044 | 0.000 | 0.008 | 0.057 |
Table 6 shows the number of abandoned mines around the candidate sites. An abandoned mine is regarded as an ET, and the number of abandoned mines relates to the effects of ET in this study. Sites S7, S8, and S9 do not include information about abandoned mines. The abandoned mines near the candidate sites required a detailed review of their expected effects and mitigating alternatives in the process of future dam construction.
Table 7 shows the evaluation criteria for the data in
Table 3,
Table 4,
Table 5 and
Table 6. We regulated the evaluation numbers in this study from one to nine with odd numbers.
Table 7 shows the results of the judgment scales for four criteria. Smaller numbers represent worse conditions for dam construction: a one indicates the worst condition for dam construction, and a nine is the best condition [
12,
13]. The results from applying
Table 7 to the data in
Table 3,
Table 4,
Table 5 and
Table 6 are shown in
Table 8. Five cells in
Table 8 contain no information: S7 and S8 in LG and S7, S8, and S9 in ET.
Table 6.
Number of abandoned mining sites.
Table 6.
Number of abandoned mining sites.
| Site | Number of Mines |
|---|
| Han River | S1 | 3 |
| S2 | 1 |
| S3 | 20 |
| S4 | 78 |
| Nam River | S5 | 4 |
| S6 | 2 |
| Geumho River | S7 | − |
| S8 | − |
| Bocheong River | S9 | − |
| S10 | 2 |
Table 7.
Judgment scales in four criteria.
Table 7.
Judgment scales in four criteria.
| Evaluation | 1 | 3 | 5 | 7 | 9 |
|---|
| Landscape and Geology (LG) | None | Not Important | Minimally Important | Important | Very Important |
|---|
| Ecological worth (EW) | 17–20 | 13–16 | 9–12 | 5–8 | 0–4 |
| Water Quality (WQ) | BOD (mg/L as CaCO3) | >9 | 9–6 | 6–3 | 1–3 | <1 |
| COD (mg/L as CaCO3) | >9 | 9–6 | 6–3 | 1–3 | <1 |
| TN (mg/L) | 1–1.5 | 0.6–1 | 0.4–0.6 | 0.2–0.4 | <0.2 |
| TP (mg/L) | 0.1–0.15 | 0.05–0.1 | 0.03–0.05 | 0.01–0.03 | <0.01 |
| Environmental toxicity | >20 | 13–16 | 9–12 | 5–8 | 0–4 |
Table 8.
Site assessment results based on environmental aspects.
Table 8.
Site assessment results based on environmental aspects.
| CRITERIA | S1 | S2 | S3 | S4 | S5 | S6 | S7 | S8 | S9 | S10 |
|---|
| Landscape and geology (LG) | 1 | 1 | 7 | 1 | 1 | 1 | LG1 | LG2 | 7 | 7 |
| Ecological worth (EW) | 1 | 1 | 7 | 3 | 7 | 5 | 9 | 9 | 9 | 9 |
| Water quality (WQ) | 6.5 | 6.5 | 5.5 | 6 | 5.5 | 5 | 5 | 6 | 7 | 5 |
| Environmental toxicity (ET) | 9 | 9 | 1 | 1 | 7 | 9 | ET1 | ET2 | ET3 | 9 |
