1. Introduction
Urban land use is an important topic in the development of Chinese cities, and effective use of urban land is very important for sustainable city management [
1]. According to
China City Statistical Yearbook, the urban land refers to urban built-up area from the perspective of urban production. This is construction area for non-agricultural production, which accounts for most of the output of Chinese secondary and tertiary industries, and unfortunately, most of the industrial pollutant discharge [
2]. Land is an important input in the production process, and it is the main carrier of production activities and the main bearing of pollutants caused by the production activities. With rapid economic development, the scale of Chinese urban development is growing rapidly [
3]. The total urban built-up area in 2012 was as high as 45.57 thousand square kilometers, which is approximately 2.1 times of that in 2000, indicating an alarming average annual growth rate of 8.58% [
2]. Massive urban expansion has occupied a great deal of arable land and forestland resources, exacerbating the problem of food security in China [
4]. On the other hand, many regions in China have large areas of idle land, causing a serious waste of land resources [
5]. It is reported that over four percent of urban land is idle in China, and approximately 40 percent is used inefficiently [
6]. Such mismanagement has aggravated the Marxist dialectical contradiction between people and land, threatening sustainable urban management and development in China [
7]. In addition, land for production, especially for industrial production, has the fastest growth rate of all types of built-up land, producing huge pollutant discharges and causing great damage to the environment [
2]. Urban land use in China is now facing the problems of relatively low economic efficiency and excessive pollutant emissions [
8]. Therefore, analyzing urban land use economic efficiency (ULUEE) under the environment constraints is a meaningful work for the future development of Chinese cities.
The Chinese government has paid attention to the problem of urban land use for a long time. To tackle the problem of unreasonable occupation of arable land, a series of land planning programs were launched in 1985, and the land management law was amended in 1998, effectively curbing the large-scale expropriation of arable land brought about by rapid urbanization and industrialization [
9]. To improve the ULUEE, the Ministry of Land Resources and many relevant departments in China have provided guidance and planning to enhance the intensity of urban land use [
10]. As for environmental protection, the central government has issued a series of laws and regulations, such as the
Water Pollution Control Act, to limit industrial pollutant emissions and improve the ecological environment [
11]. However, the problems of inefficient urban land use and serious environmental pollution have not yet been fundamentally solved. From the economic perspective, the supply of land is inelastic. Because we can save a large amount of land when achieving the same economic output by raising land use efficiency, which helps slow down the unreasonable occupation of arable land for economic production purposes. This means that improving ULUEE has been proven to be the best way to alleviate food security issues and realize sustainable urban management.
The problem of ULUEE was first studied in the early 20th century by describing the external form and spatial distribution of urban land use. This approach was mainly based on the historical experiences of urban land use development and gave rise to models such as the axial growth model, the concentric growth model, the sector growth model, and the multi-core growth model [
12]. Then, the economic location school introduced spatial economics research methods, which assumed that land users were rational economic actors whose pursuits were the maximization of economic interests and the minimization of cost. This school held that optimal allocation of land resources could be achieved through regulation of the land market [
13], which is good guidance for the improvement of ULUEE. Moreover, the social behavior school introduced humanistic ideas into studies of urban land use, emphasizing the importance of human values and other non-economic factors in the distribution of urban land resources [
14]. The political economy school emphasizes the important effects of political power on urban land use and trying to reveal the driving factors behind urban land use modes, which made great contributions to improve ULUEE [
15,
16], and some other studies have also discussed the concept of landscape efficiency and land sustainability [
17,
18]. In recent years, the research focus has shifted to the optimal allocation, intensive utilization and efficiency evaluation of urban land [
19], and domestic scholars have carried out extensive studies on ULUEE in China from multiple aspects, including basic theory, using evaluation indexes, refining methodology, examining driving factors and improving management approaches. Regarding evaluation indexes, multiple-index systems including social, economic and environmental factors have already been adopted in many studies [
20,
21].
Many methods have been applied to the studies of ULUEE, such as the analytic hierarchy process (AHP) [
20,
22], the principal component analysis (PCA) [
23] and the data envelopment analysis (DEA) [
21]. Considering the defects of subjectivity and information compression, AHP and PCA are not suitable for efficiency evaluation. Data envelopment analysis (DEA) has a significant advantage of not needing to set any prior functions or parameter weights. However, many studies have adopted radial DEA models, which neglect the slack variables, leading to biased results. To overcome this problem, a new approach named non-radial and nonparametric (SBM) model was proposed, which incorporates the slack variables directly into the objective function, making evaluation more accurate [
24,
25]. Because many studies only consider economic output, while ignoring the pollutants caused by production, leading overestimates of ULUEE and incorrect policy recommendations, some suggest that the environmental pollution should be incorporated into the evaluation indicator system as an undesirable output [
8]. However, the results based on data in different periods cannot be compared with each other, this paper will apply a sequential slack-based measure (SSBM) model, which extends the SBM approach by taking changing production technology into account [
26].
Considering the fact that few past studies have covered the ULUEE of Chinese cities at the prefecture level, this paper will explore the spatial and temporal disparities of ULUEE in China during 2003–2012, reveal the mechanisms of influencing factors, and present corresponding countermeasures to improve ULUEE. In addition, due to some reasons such as economic policy and urban development habits, cities of different scales show huge gaps in economic development levels and industrial structures. Thus, we will make comparisons of ULUEE among different city scales.
This paper will make three main contributions to the studies on China’s ULUEE. First, this paper is the first to analyze the dynamic changes of ULUEE in China at the prefecture level by using an SBM model. Second, this paper explores the factors influencing ULUEE in China. Third, this paper proposes some effective countermeasures to improve the ULUEE and realize sustainable urban management. Therefore, the following questions will be addressed in this paper.
- (1)
What is the general ULUEE in China? Which are the top or bottom performers?
- (2)
What are the regional and size disparities of ULUEE among China’s cities?
- (3)
Which factors influence ULUEE and what are the influencing mechanisms?
The remainder of this paper is organized as follows.
Section 2 introduces the methods, indicators and data used in this paper.
Section 3 shows the empirical results.
Section 4 concludes with some suggestions for future studies.
2. Methods and Data
2.1. SBM-Undesirable Model
A meaningful assumption of DEA models is that there always be a certain gap between actual resource allocation and the optimal one, which can be called the slack variable and expressed as input excess or output shortage of the observation. One problem of traditional radial DEA models is that the slack variables are not considered in the objective function, which can lead to inaccurate results in efficiency evaluations. To overcome this problem, a new approach named non-radial and nonparametric (SBM) model was proposed, which incorporates the slack variables directly into the objective function. Considering the changing production technology in the study period, we apply a relatively new model named sequential slack-based measure (SSBM) model, which combine the concept of sequential production technology. The SSBM model is described as follows [
26]:
Suppose that there are N DMUs, and each DMU requires M inputs (x) to produce J desirable outputs (y) and K undesirable outputs (b). In this paper, they can be denoted by the vectors , , ; then we can define the matrixes X, Y, B as , , , with X > 0, Y > 0, B > 0.
In this way, the production technology can be expressed as:
where P is always assumed to satisfy the production theory [
25], Considering that production technology will change during the study period, we impose the constraints of
into the function for the variable returns to scale (VRS). Thus, the optimization problem of sequential SBM (SSBM) can be expressed as:
where
m,
j, and
k represent the indexes of inputs, desirable outputs and undesirable outputs;
M,
J,
K is the number of inputs, desirable outputs and undesirable outputs, respectively;
t (
t = 2003, ..., 2012) represent year
t, and the subscript 0 represents the DMU which is under estimated in this model.
,
and
represents the slack variables of inputs, desirable outputs and undesirable outputs, respectively; ρ represents the efficiency of the DMU which is estimated in the model; λ represents the nonnegative multiple vector.
When ρ* = 1, the DMU is efficient. When ρ* < 1, the DMU is inefficient, and it is necessary to adjust the input-output structure. In order to make this DMU efficient in the optimality, we should make adjustments of the form , , and . Thus altered, the SBM model can do efficiency evaluations in the presence of undesirable outputs.
On the other hand, we can know how to improve the input-output efficiency by analyzing the slack variable ratios of inputs, desirable outputs and undesirable outputs, respectively.
The input excess ratio is the proportion of input reduction:
The desirable output shortage ratio is proportion of desirable output increase:
The undesirable output shortage ratio is proportion of undesirable output increase:
2.3. Econometric Model
In this paper, we establish an empirical model to explore the factors influencing ULUEE in China’s cities. The econometric model is as follows:
where
i (
i = 1, ..., 270) and
t (
t = 2003, ..., 2012) represent city
i and year
t, respectively. The term, α
it is a constant, and μ
it is the random error term.
yit is the ULUEE for city
i.
PGDP is the per capita GDP.
LUI is land use intensity, which is represented by economic output per square kilometer of urban construction land.
URB is the urbanization rate, which is expressed as the proportion of population in the municipal district of the total population of the city.
POL represents the land management policy.
LLP refers to land leasing policy for financing local governments, which is very popular in the cities with fiscal problems, and it is expressed as fiscal gap ratio.
FDI refers to the proportion of foreign enterprises’ output account for the total output in the secondary and tertiary industries.
Generally speaking, a higher level of GDP per capita leads to the higher resource efficiency. Because a region with relatively higher GDP per capita always pays more attention to the quality of economic development, which leads to relatively higher resource use efficiency [
29].Therefore, we hypothesize that there might be a positive correlation between GDP per capita and ULUEE. In addition, the greater the land use intensity, the higher the economic value per square kilometer. Therefore, we hypothesize that there might be a positive correlation between land use intensity and ULUEE. As is well known, the higher the urbanization rate, the higher the levels of economic development and technology, which easily lead to relatively high resource use efficiency [
30]. Thus, we hypothesize that there might be a positive correlation between urbanization rate and ULUEE.
The implementation of land management policy has promoted the optimization of urban land layout and improved land use efficiency, so there may be a positive correlation between land management policy and ULUEE. Considering that the
Notice of the relevant issues concerning the adjustment for approval of urban construction land from the State Council, which was implemented by the Ministry of land and resources in 2007 was the most comprehensive and clear document on land resources management in recent years [
31], therefore, the policy variable is assigned the value of 1 from 2007 on, and the value of 0 before 2007.
After the reform of tax system in 1994, the central government occupies most of the taxes, making local governments face serious financial difficulties. Therefore, they have to look for effective ways to make up for the fiscal deficit such as revenue from land leasing. Almost every city actively introduces investment through lowering the land price, in order to promote economic development. However, the pursuit of short-term interests obviously lacks scientific planning of land use, leading to inefficient land use [
32]. Therefore, we hypothesize that the land leasing policy might have a negative impact on the ULUEE. In addition, because Chinese market economy is still less than 40 years old since the reform and opening up in 1978, the foreign capital enterprises have better production and management technology than the domestic ones [
33]. Thus, we hypothesize that the proportion of foreign enterprises’ output account for the total output in the secondary and tertiary industries might have a positive impact on the ULUEE.
2.4. Data
In this paper, the data are sourced from the China City Statistical Yearbook (2003–2013), Regional Economic Statistical Yearbook (2003–2013) and China Statistical Yearbook (2003–2013). Because data are missing from some cities, the results of this study are based on data from 270 cities, which account for more than 95 percent of the total number of Chinese cities. To eliminate the effects of price factors, urban investment in fixed assets and values added in secondary and tertiary industry are converted to 2000 constant prices with fixed asset and GDP deflectors, respectively.
3. Empirical Results
3.1. Overall Analysis of Land Use Efficiency
According to regional distribution and disparities of economic development, we divide Chinese cities into three groups [
8]: the eastern region, central region, and western region. The eastern region contained 11 coastal provinces or municipalities (Beijing, Tianjin, Hebei, Liaoning, Shanghai, Jiangsu, Zhejiang, Fujian, Shandong, Guangdong and Hainan), economic development in this region is much better than that in the other two regions. The central region contained eight inland provinces (Shanxi, Jilin, Heilongjiang, Anhui, Jiangxi, Henan, Hubei, Hunan). This region has a large population and is famous for agricultural production. The western region contained the remaining 12 provinces, municipalities and autonomous regions (Sichuan, Chongqing, Inner Mongolia, Guangxi, Guizhou, Yunnan, Tibet, Shaanxi, Gansu, Qinghai, Ningxia, Xinjiang). This region covers more than half of China’s territory, but population density and economic development levels are the lowest in China’s three regions. According to the latest standard for categorizing groups of city by scale from the
Green Book of Small and Medium-sized Cities (2014), the cities in China can also be divided into five types of scales (huge, very large, large, medium, and small). We treat huge and very large cities together as super cities, due to the cities of these two types being few in number, and their common feature that the population and economy in any one of them is oversized.
Based on the SSBM model, we computed the ULUEEs for 270 cities in China during 2003–2012 (see
Figure 1). Also shown in
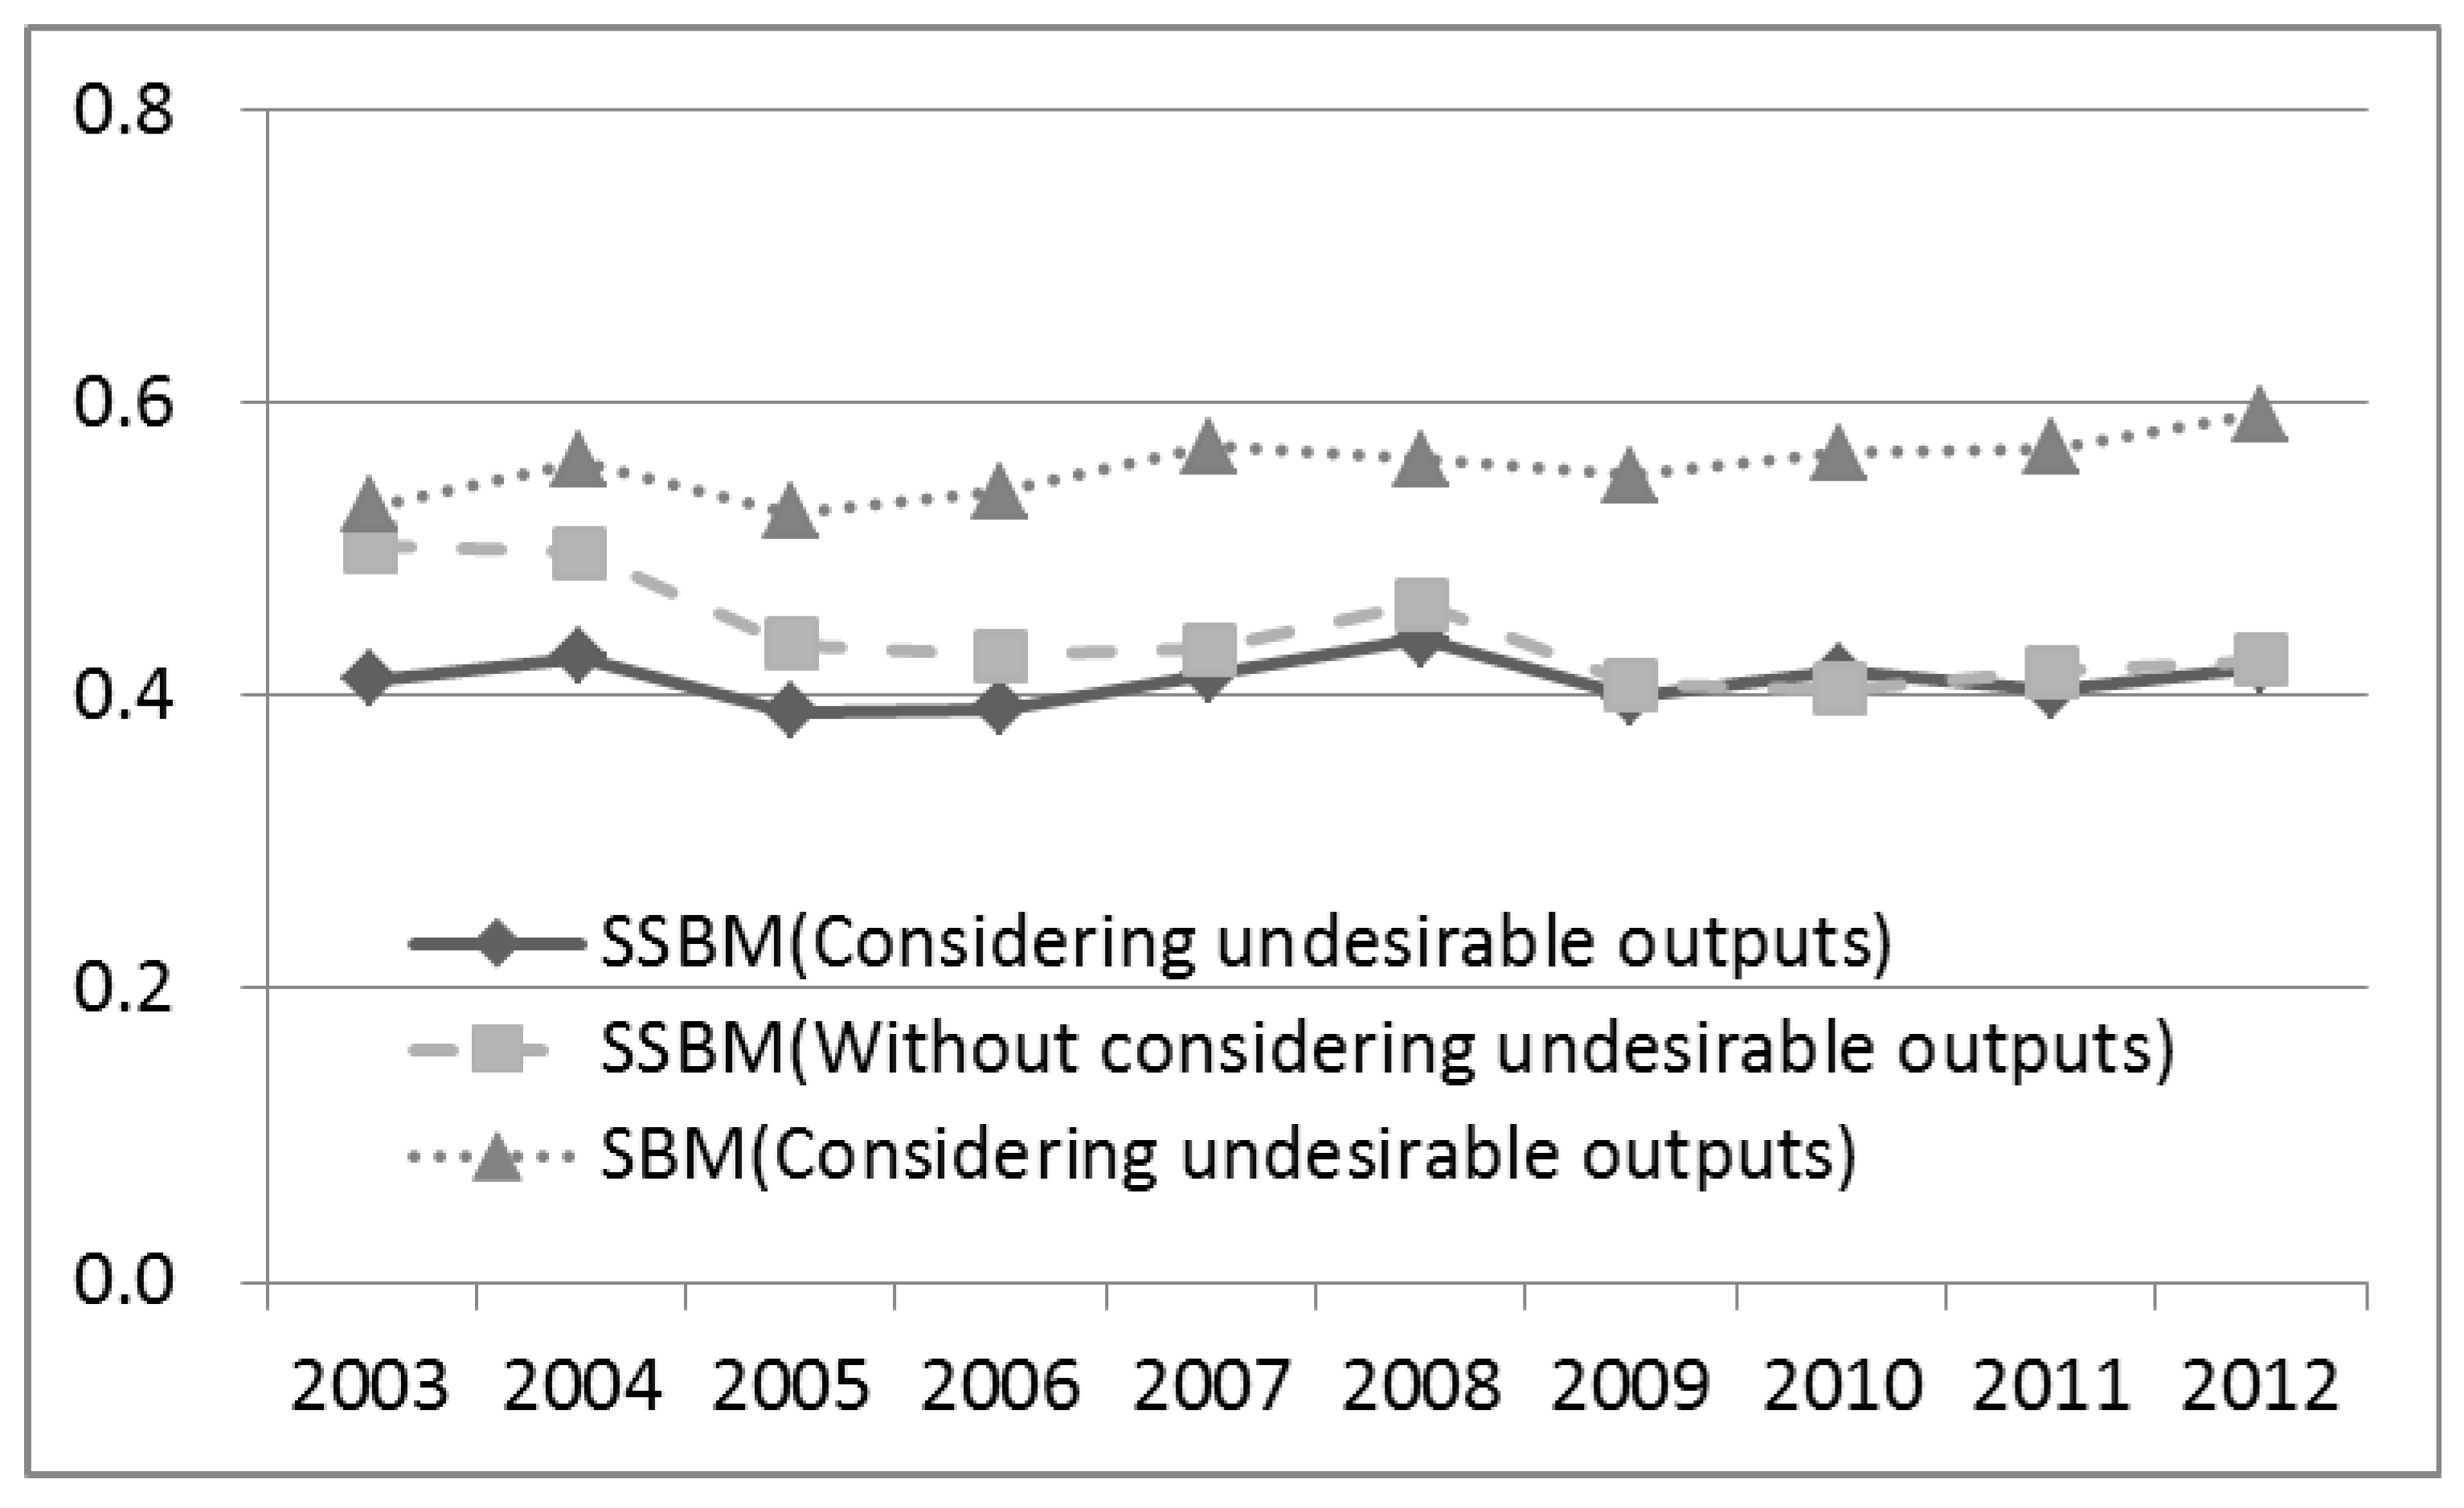
Figure 1 for comparison is the trend of the ULUEE computed without considering undesirable outputs, and the trend of the ULUEE based on the SBM model considering undesirable outputs. As expected, in most of the study period, the ULUEE values based on the SSBM model computed with consideration of undesirable outputs is lower than that computed ignoring undesirable outputs throughout the research period, whose average scores are 0.411 and 0.441, respectively. Therefore, undesirable outputs have obvious influence on ULUEE, and ignoring undesirable outputs could lead to overestimating ULUEE. Moreover, the results based on the SBM model considering undesirable outputs are higher than those based on the SSBM model, this may be because the results based on SBM model have not included the concept of sequential production technology. Therefore, the following analysis will adopt results based on SSBM model considering undesirable outputs.
Figure 1.
Trends of ULUEE in China during 2003–2012.
Figure 1.
Trends of ULUEE in China during 2003–2012.
Figure 1 shows that ULUEE in China has always been very low during the study period without obvious changes. One possible interpretation is that weak land management systems and imperfect land markets have contributed greatly to severe land waste and low ULUEE [
28]. On the other hand, the singular pursuit of economic growth while neglecting environmental protection is also an important reason. In addition, the ULUEE based on the SSBM model without considering undesirable outputs have come close to those based on the SSBM model considering undesirable outputs. This may because there are more environmental protection laws that have been issued in the second half of the study period than ever before, such as
Water Pollution Prevention and Control Law of the People’s Republic of China [
34], thus, China has made great achievements in environmental protection work.
In addition, as shown in
Figure 2, the ULUEE of the eastern region shows a slight downward trend in the study period, however, it is much higher than in the other two regions. The ULUEE of the western region shows a slight upward trend, and the ULUEE of the central does not change much. It is worth noting that the ULUEE of the western region has exceeded that of the central region since 2005, therefore, cities from the central region should do their best to improve their ULUEE.
Figure 2.
Trends of ULUEE in three regions of China during 2003–2012.
Figure 2.
Trends of ULUEE in three regions of China during 2003–2012.
3.2. Disparity of the ULUEE at Regional and Scale Levels
In order to show a more detailed condition for the ULUEE during the study period, we divide the cities into three groups according to their ULUEEs (see
Table 2). The perfect group contains six cities (e.g., Wuxi, Suzhou, Ningde, Shenzhen, Foshan, and Zhongshan) which are efficient during 2003–2012, indicating that land use in these cities has always been in the best condition, with the environment improving concurrently with economic development. We divide the rest of the cities into two groups on average, and they are called good group and bad group. The good group contains 132 cities whose ULUEE is between 0.34 and 1, and the bad group contains the remaining 132 cities whose ULUEE is below 0.34 [
35]. We can note that most cities show relatively poor performance in urban land use, which suggests that some countermeasures should be taken to improve the input-output allocation. In sum, the conditions of ULUEE are not ideal, and as many as 97.78% of China’s cities are inefficient in their use of land. This result indicates that most cities still have much room to improve their ULUEEs.
Table 2.
Clusters of ULUEEs for 270 cities in China.
Table 2.
Clusters of ULUEEs for 270 cities in China.
| Efficiency | Grade | Number of cities | Proportion (%) |
|---|
| 1 | Perfect | 6 | 2.22 |
| 0.34 | Good | 132 | 48.89 |
| <0.34 | Bad | 132 | 48.89 |
| Total | | 270 | 100 |
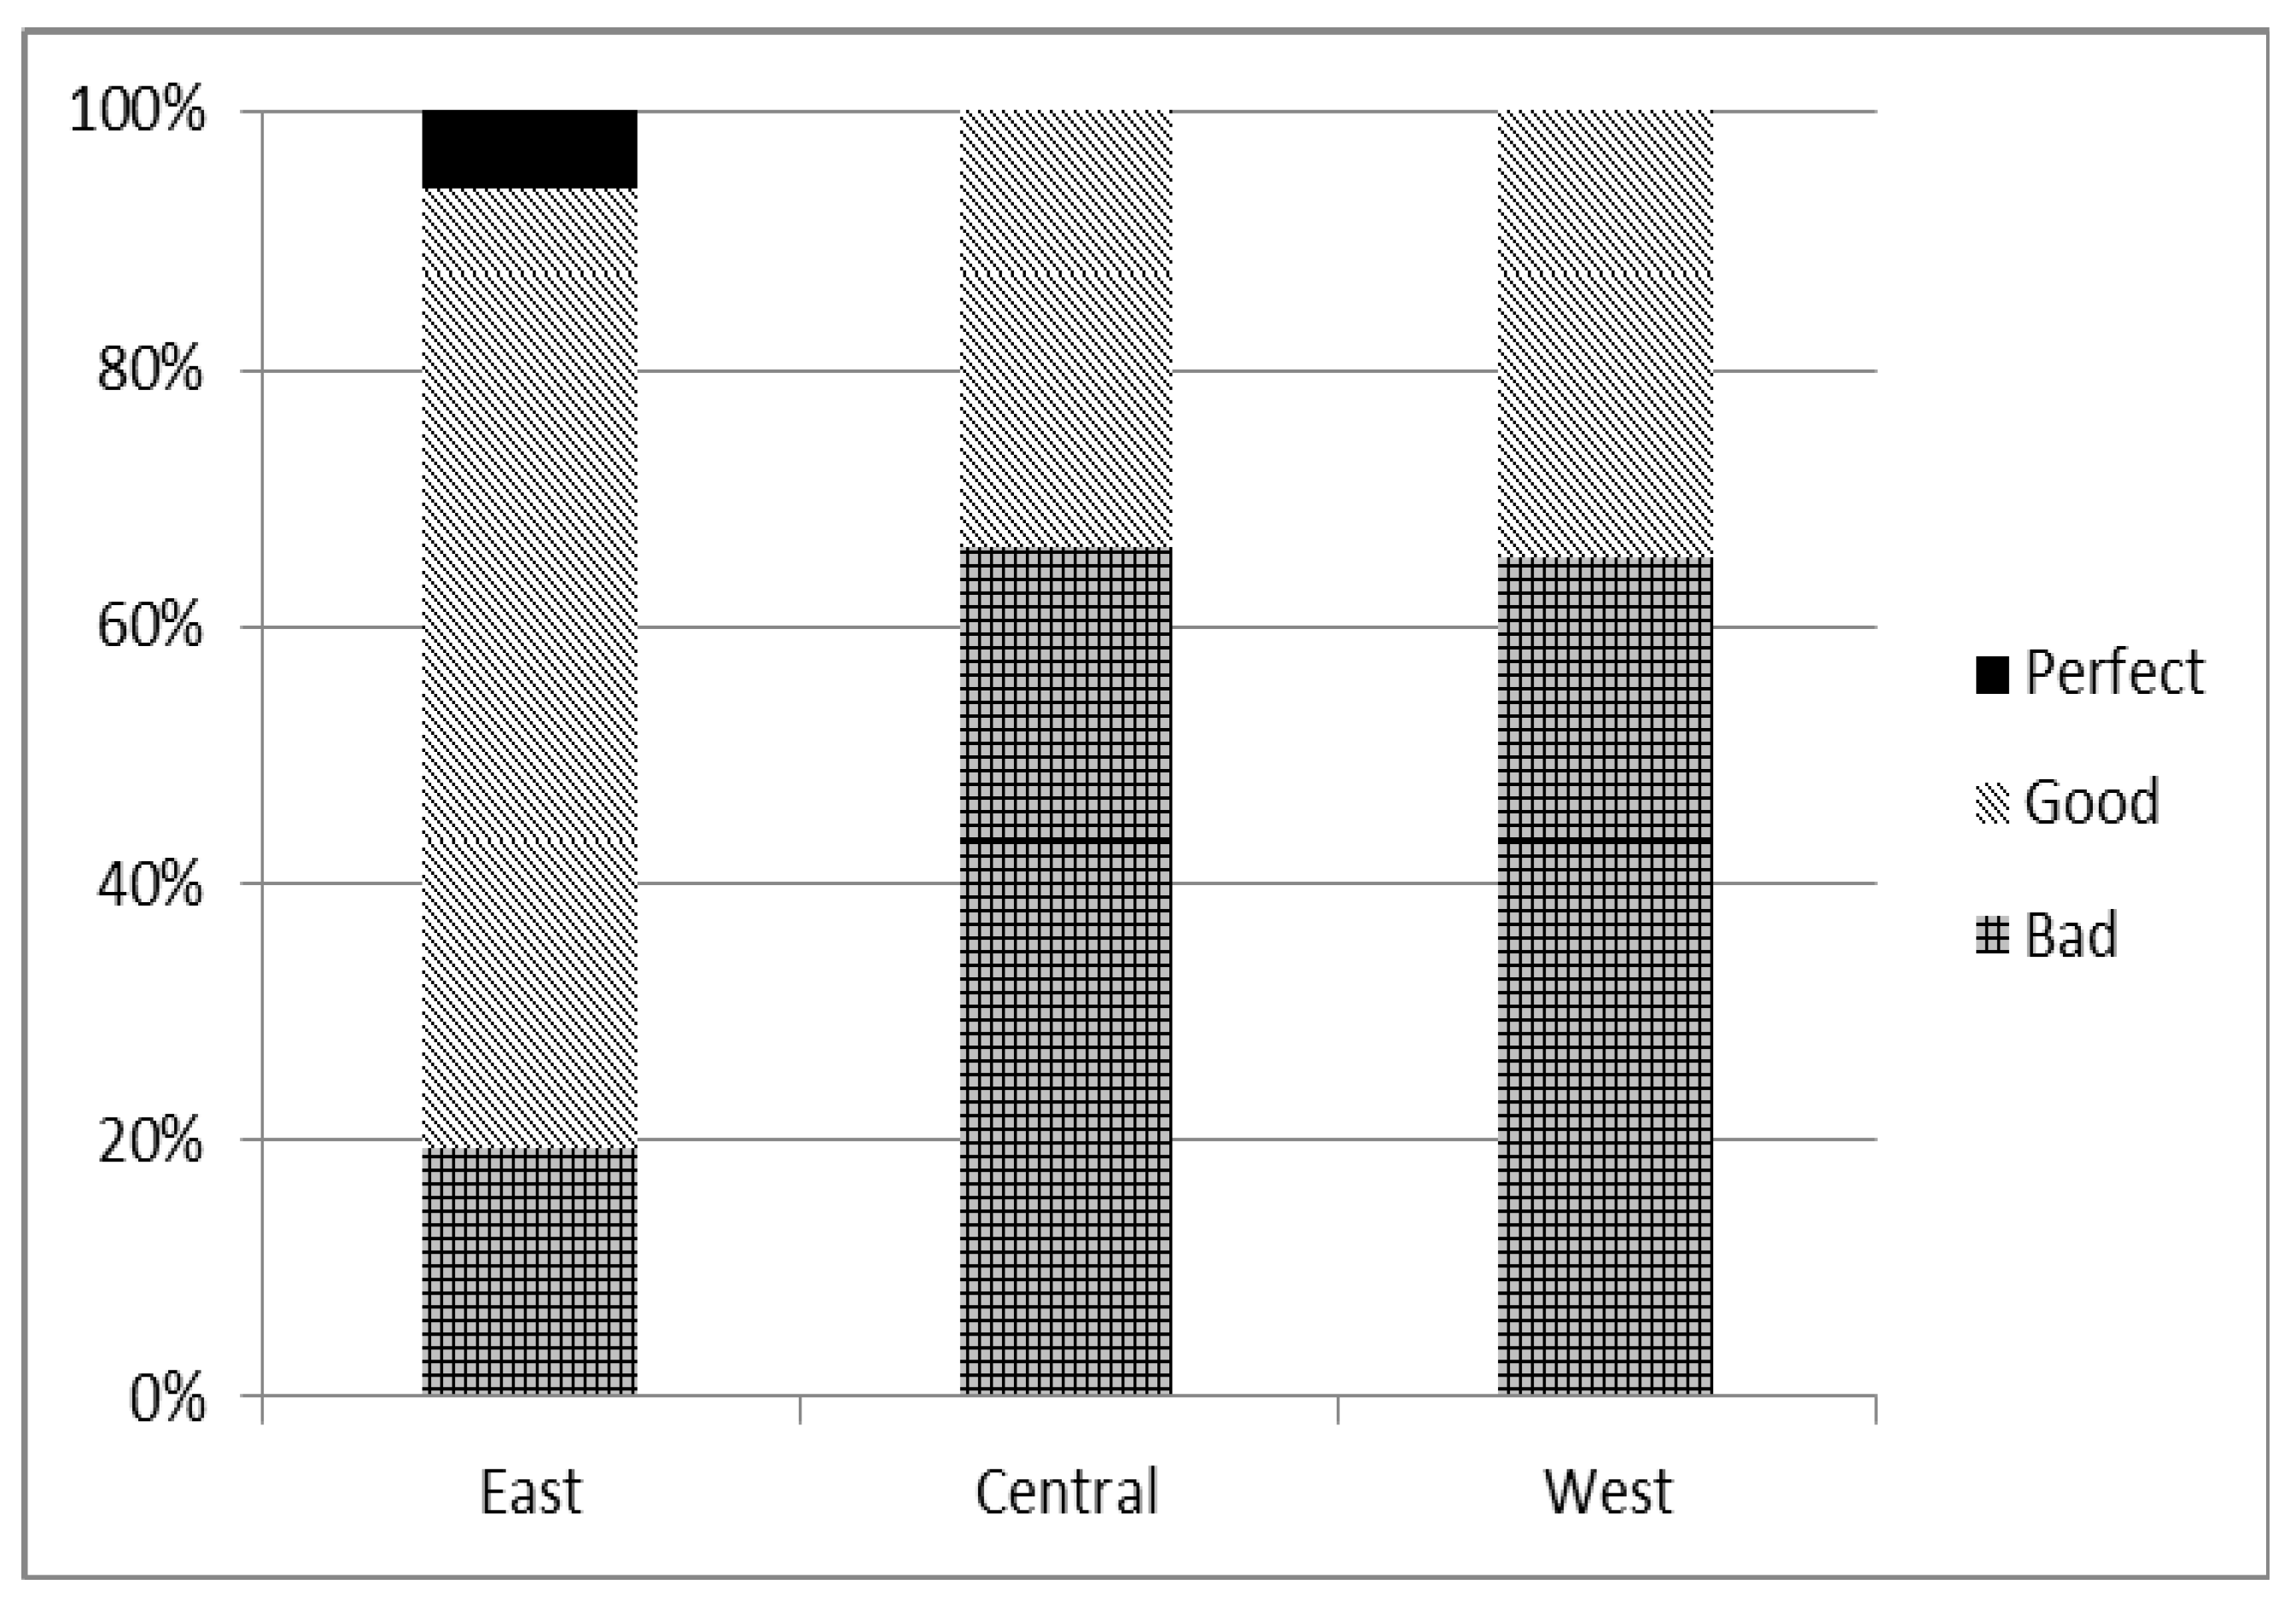
Figure 3 shows the disparities of the ULUEE in the three regions of China. The six cities belongs to the perfect group are all located in the eastern region. In addition, the eastern region enjoys the highest proportion of good cities (74.49%), and the lowest proportion of bad cities (19.39%). However, the central and western regions suffer the highest proportion of bad cities (65.98% and 65.33%, respectively), and neither of the two regions have perfect cities.
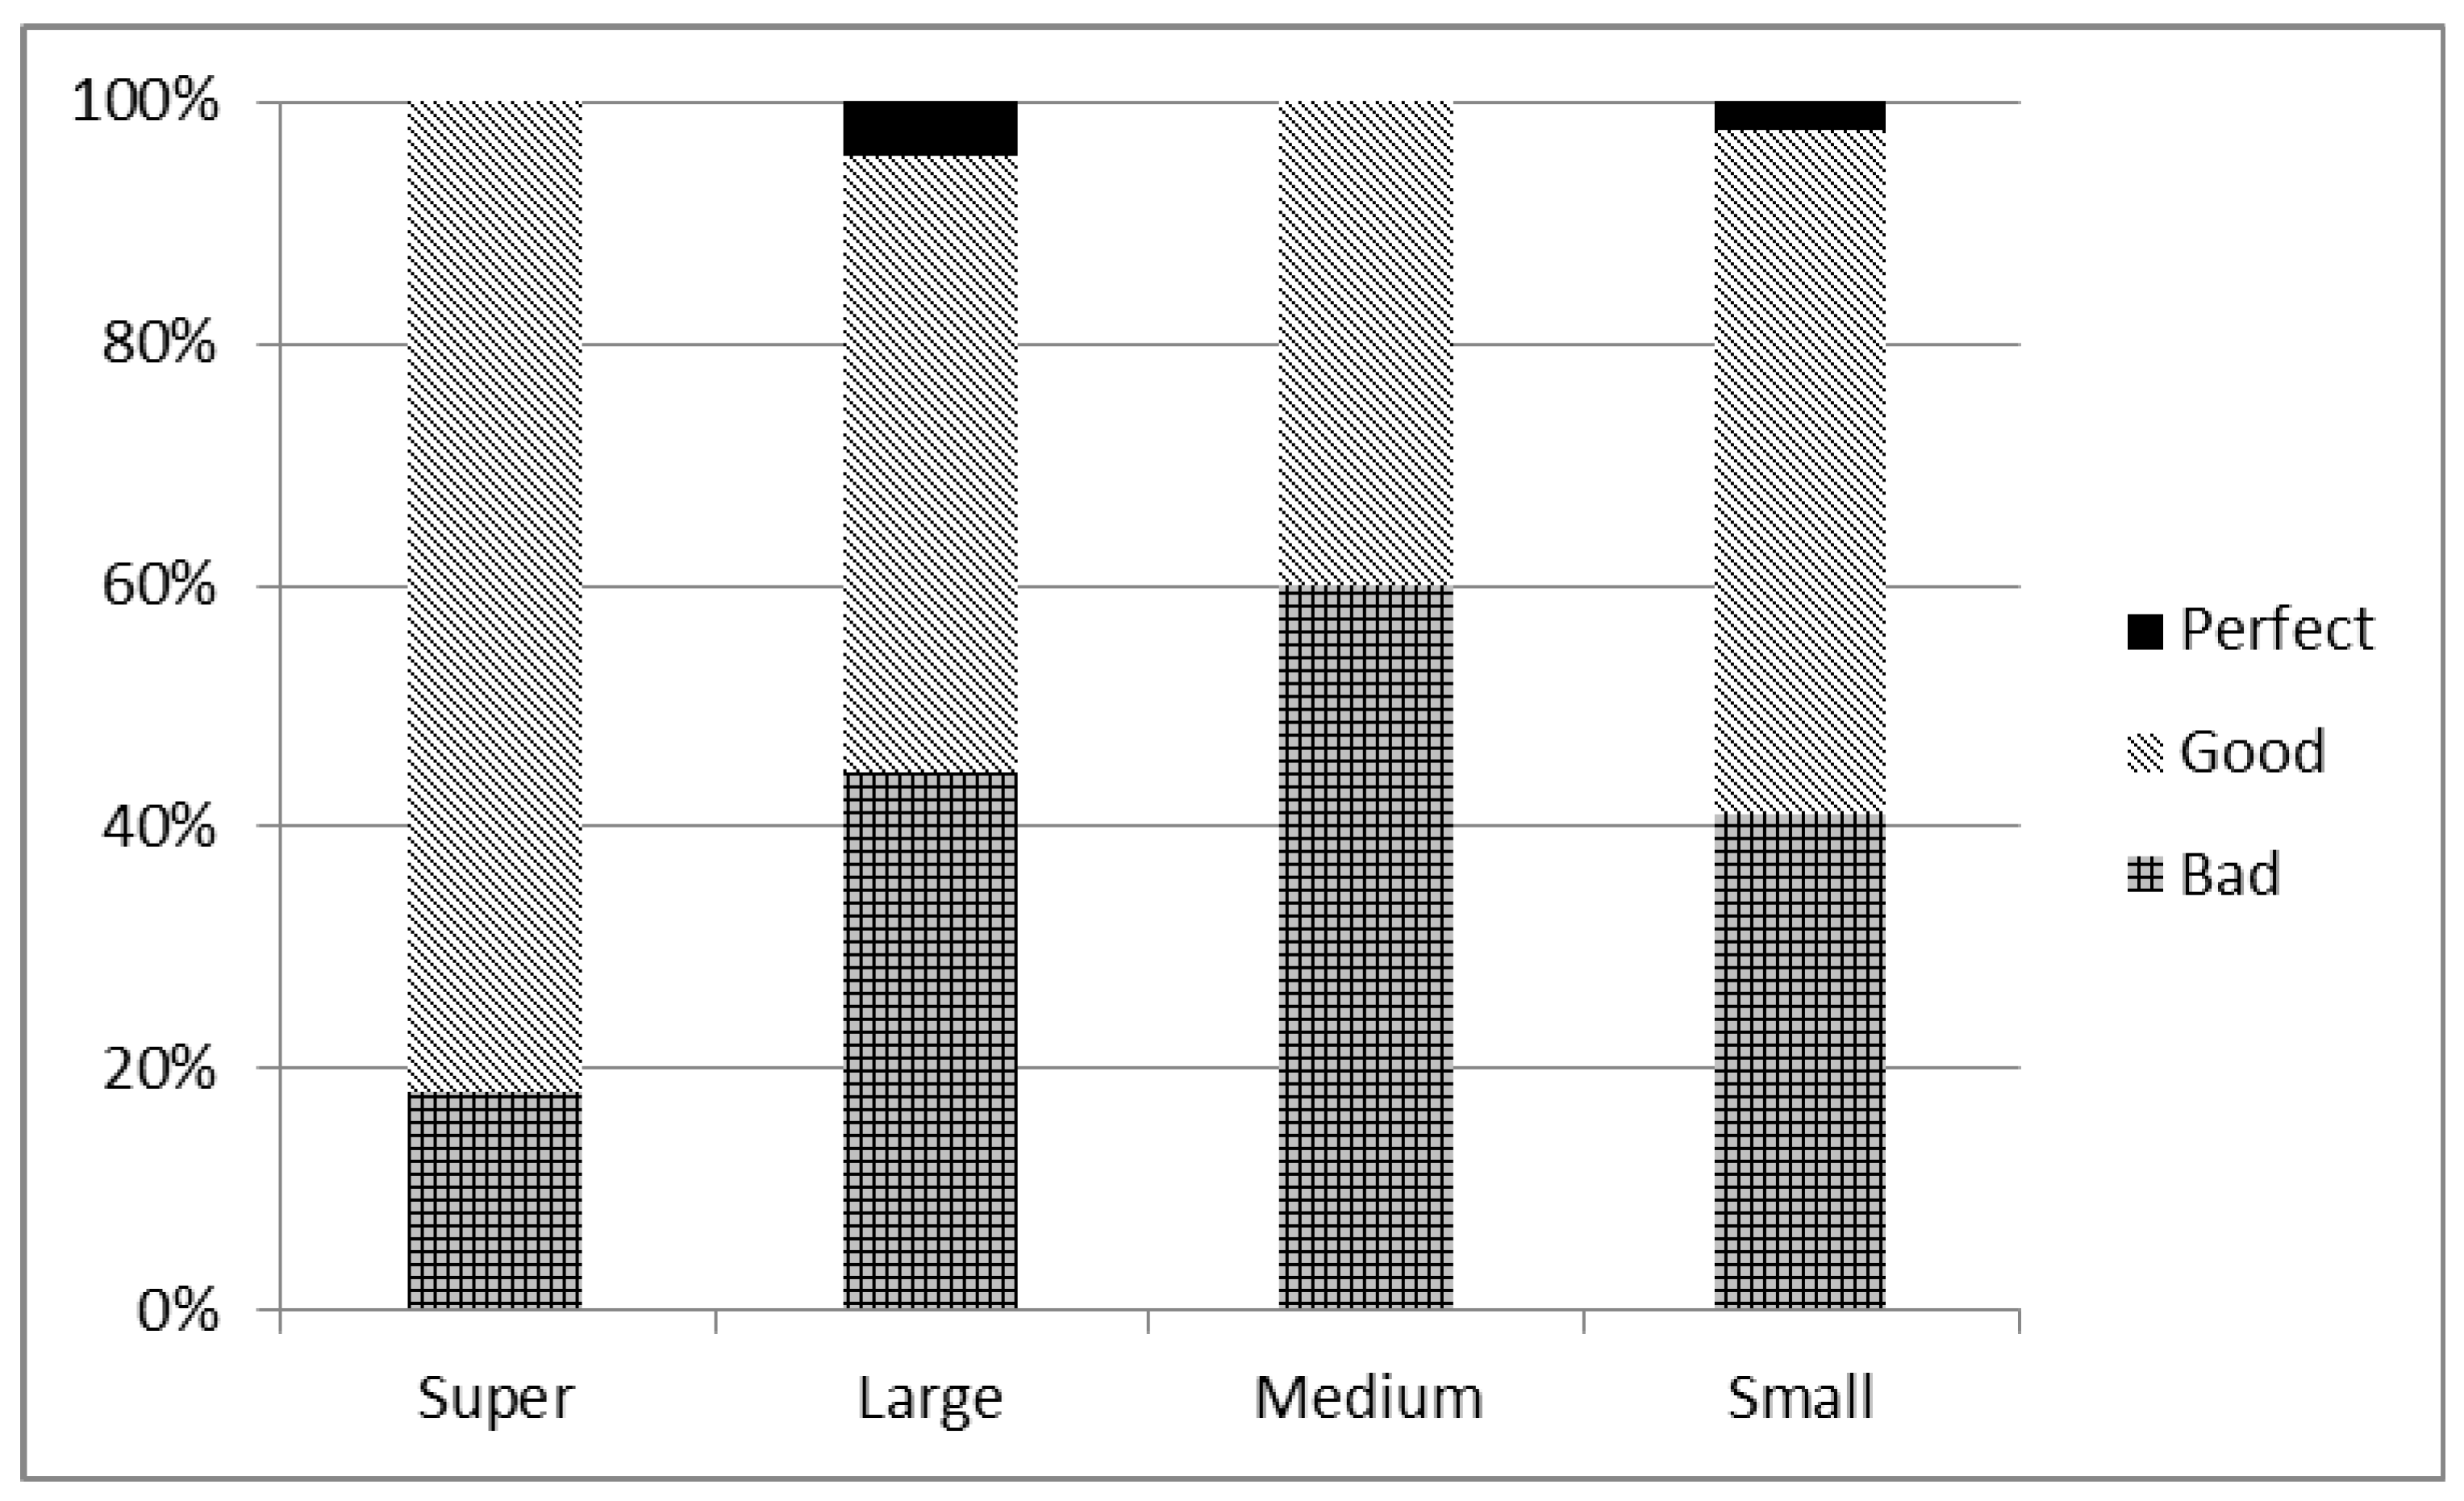
Figure 4 shows the disparities of the ULUEE within the four city scale categories. Only large-scale and small-scale city group have perfect cities. Out of the six perfect cities, five cities belongs to large-scale city group (e.g., Wuxi, Suzhou, Shenzhen, Foshan and Zhongshan), and the rest of the city named Ningde belongs to small-scale city group. Besides, the proportion of good cities in the super-scale city group rank first (81.82%), followed by the small-scale city group cities (56.82%), and the large-scale and medium-scale city groups show relatively low proportions of 50.91% and 40%. The medium-scale city group suffers the highest proportion of bad cities (60%), followed by the large-scale city group (44.55%), and the small-scale and super-scale city groups show relatively low proportions of 40.91% and 18.18%.
Figure 3.
Disparity of the ULUEE in different regions of China.
Figure 3.
Disparity of the ULUEE in different regions of China.
Figure 4.
Disparity of the ULUEE in different city scales.
Figure 4.
Disparity of the ULUEE in different city scales.
3.3. Disparity of the ULUEE at Regional and Scale Levels
In order to show a more detailed condition for the ULUEE during the study period, we divide the cities into three groups according to their ULUEEs. The perfect group contains six cities (e.g., Wuxi, Suzhou, Ningde, Shenzhen, Foshan, and Zhongshan) which are efficient during 2003–2012, indicating that land use in these cities has always been in the best condition, with the environment improving concurrently with economic development. We divide the rest of the cities into two groups on average, and they are called good group and bad group. The good group contains 132 cities whose ULUEE is between 0.34 and 1, and the bad group contains the remaining 132 cities whose ULUEE is below 0.34 [
35]. We can note that most cities show relatively poor performance in urban land use, which suggests that some countermeasures should be taken to improve the input-output allocation. In sum, the conditions of ULUEE are not ideal, and as many as 97.78% of China’s cities are inefficient in their use of land. This result indicates that most cities still have much room to improve their ULUEEs.
Figure 3 shows the disparities of the ULUEE in the three regions of China. The six cities belongs to the perfect group are all located in the eastern region. In addition, the eastern region enjoys the highest proportion of good cities (74.49%), and the lowest proportion of bad cities (19.39%). However, the central and western regions suffer higher proportions of bad cities (65.98% and 65.33%, respectively), and neither of the two regions have perfect cities.
Figure 4 shows the disparities of the ULUEE within the four city scale categories. Only large-scale and small-scale city group have perfect cities. Out of the six perfect cities, five cities belongs to the large-scale city group (e.g., Wuxi, Suzhou, Shenzhen, Foshan, and Zhongshan), and the other city (Ningde) belongs to small-scale city group. Besides, the proportion of good cities in the super-scale city group rank first (81.82%), followed by the small-scale city group cities (56.82%), and the large-scale and medium-scale city groups show relatively low proportions of 50.91% and 40%. The medium-scale city group suffers the highest proportion of bad cities (60%), followed by the large-scale city group cities (44.55%), and the small-scale and super-scale city groups show relatively low proportions of 40.91% and 18.18%.
As is shown in
Table 3, cities in the eastern region are more efficient, with an average efficiency of 0.526, followed by the western region (0.357). The efficiency in the central region (0.336) is the lowest. Considering the fact that the eastern region enjoys the most developed economy while the western region suffers the worst economic conditions, and the central region lies between the eastern and western regions in this respect, this result also provides evidence in favor of the environmental Kuznets curve hypothesis, which posits that environmental improvements do not occur until after economic development reaches a certain level, while environmental damage becomes more severe with economic development before reaching that level.
Table 3 also shows that the small-scale city group enjoys the highest ULUEE with an average score of 0.514, followed by the large-scale city group (0.44) and small-scale city group (0.426). In addition, the medium-scale cities have the lowest ULUEE of 0.364. In summary, cities in eastern China show better performance than those in central and western China as a whole, and the average ULUEE of the super-scale city group is higher than that of the other three scale groups. One possible explanation is that the urban economy in the eastern region is the most developed, leading to the greater economic output and investment in environmental protection, which helps to improve the ULUEE. Another possible reason may be that the super cities have large capital and talent advantages due to supported policies and their good location [
36]. Therefore, they can obtain higher economic output as well as better environmental protection.
Table 3.
Disparity of ULUEE in different scales and regions.
Table 3.
Disparity of ULUEE in different scales and regions.
| Region or Whole County | Level | Average Value at Different Levels | Average Value at Different Regions |
|---|
| East | Super | 0.639 | 0.526 |
| Large | 0.575 |
| Medium | 0.462 |
| Small | 0.452 |
| Central | Super | 0.417 | 0.336 |
| Large | 0.344 |
| Medium | 0.317 |
| Small | 0.363 |
| West | Super | 0.329 | 0.357 |
| Large | 0.333 |
| Medium | 0.31 |
| Small | 0.461 |
| China | Super | 0.514 | 0.411 |
| Large | 0.44 |
| Medium | 0.364 |
| Small | 0.426 |
3.4. Spatio-Temporal Pattern of ULUEE in China
To supplement the general trend of ULUEE in China during 2003–2012 (see
Figure 1), this study explored the spatio-temporal pattern of ULUEE in the four years of 2003, 2006, 2009, and 2012. As shown in
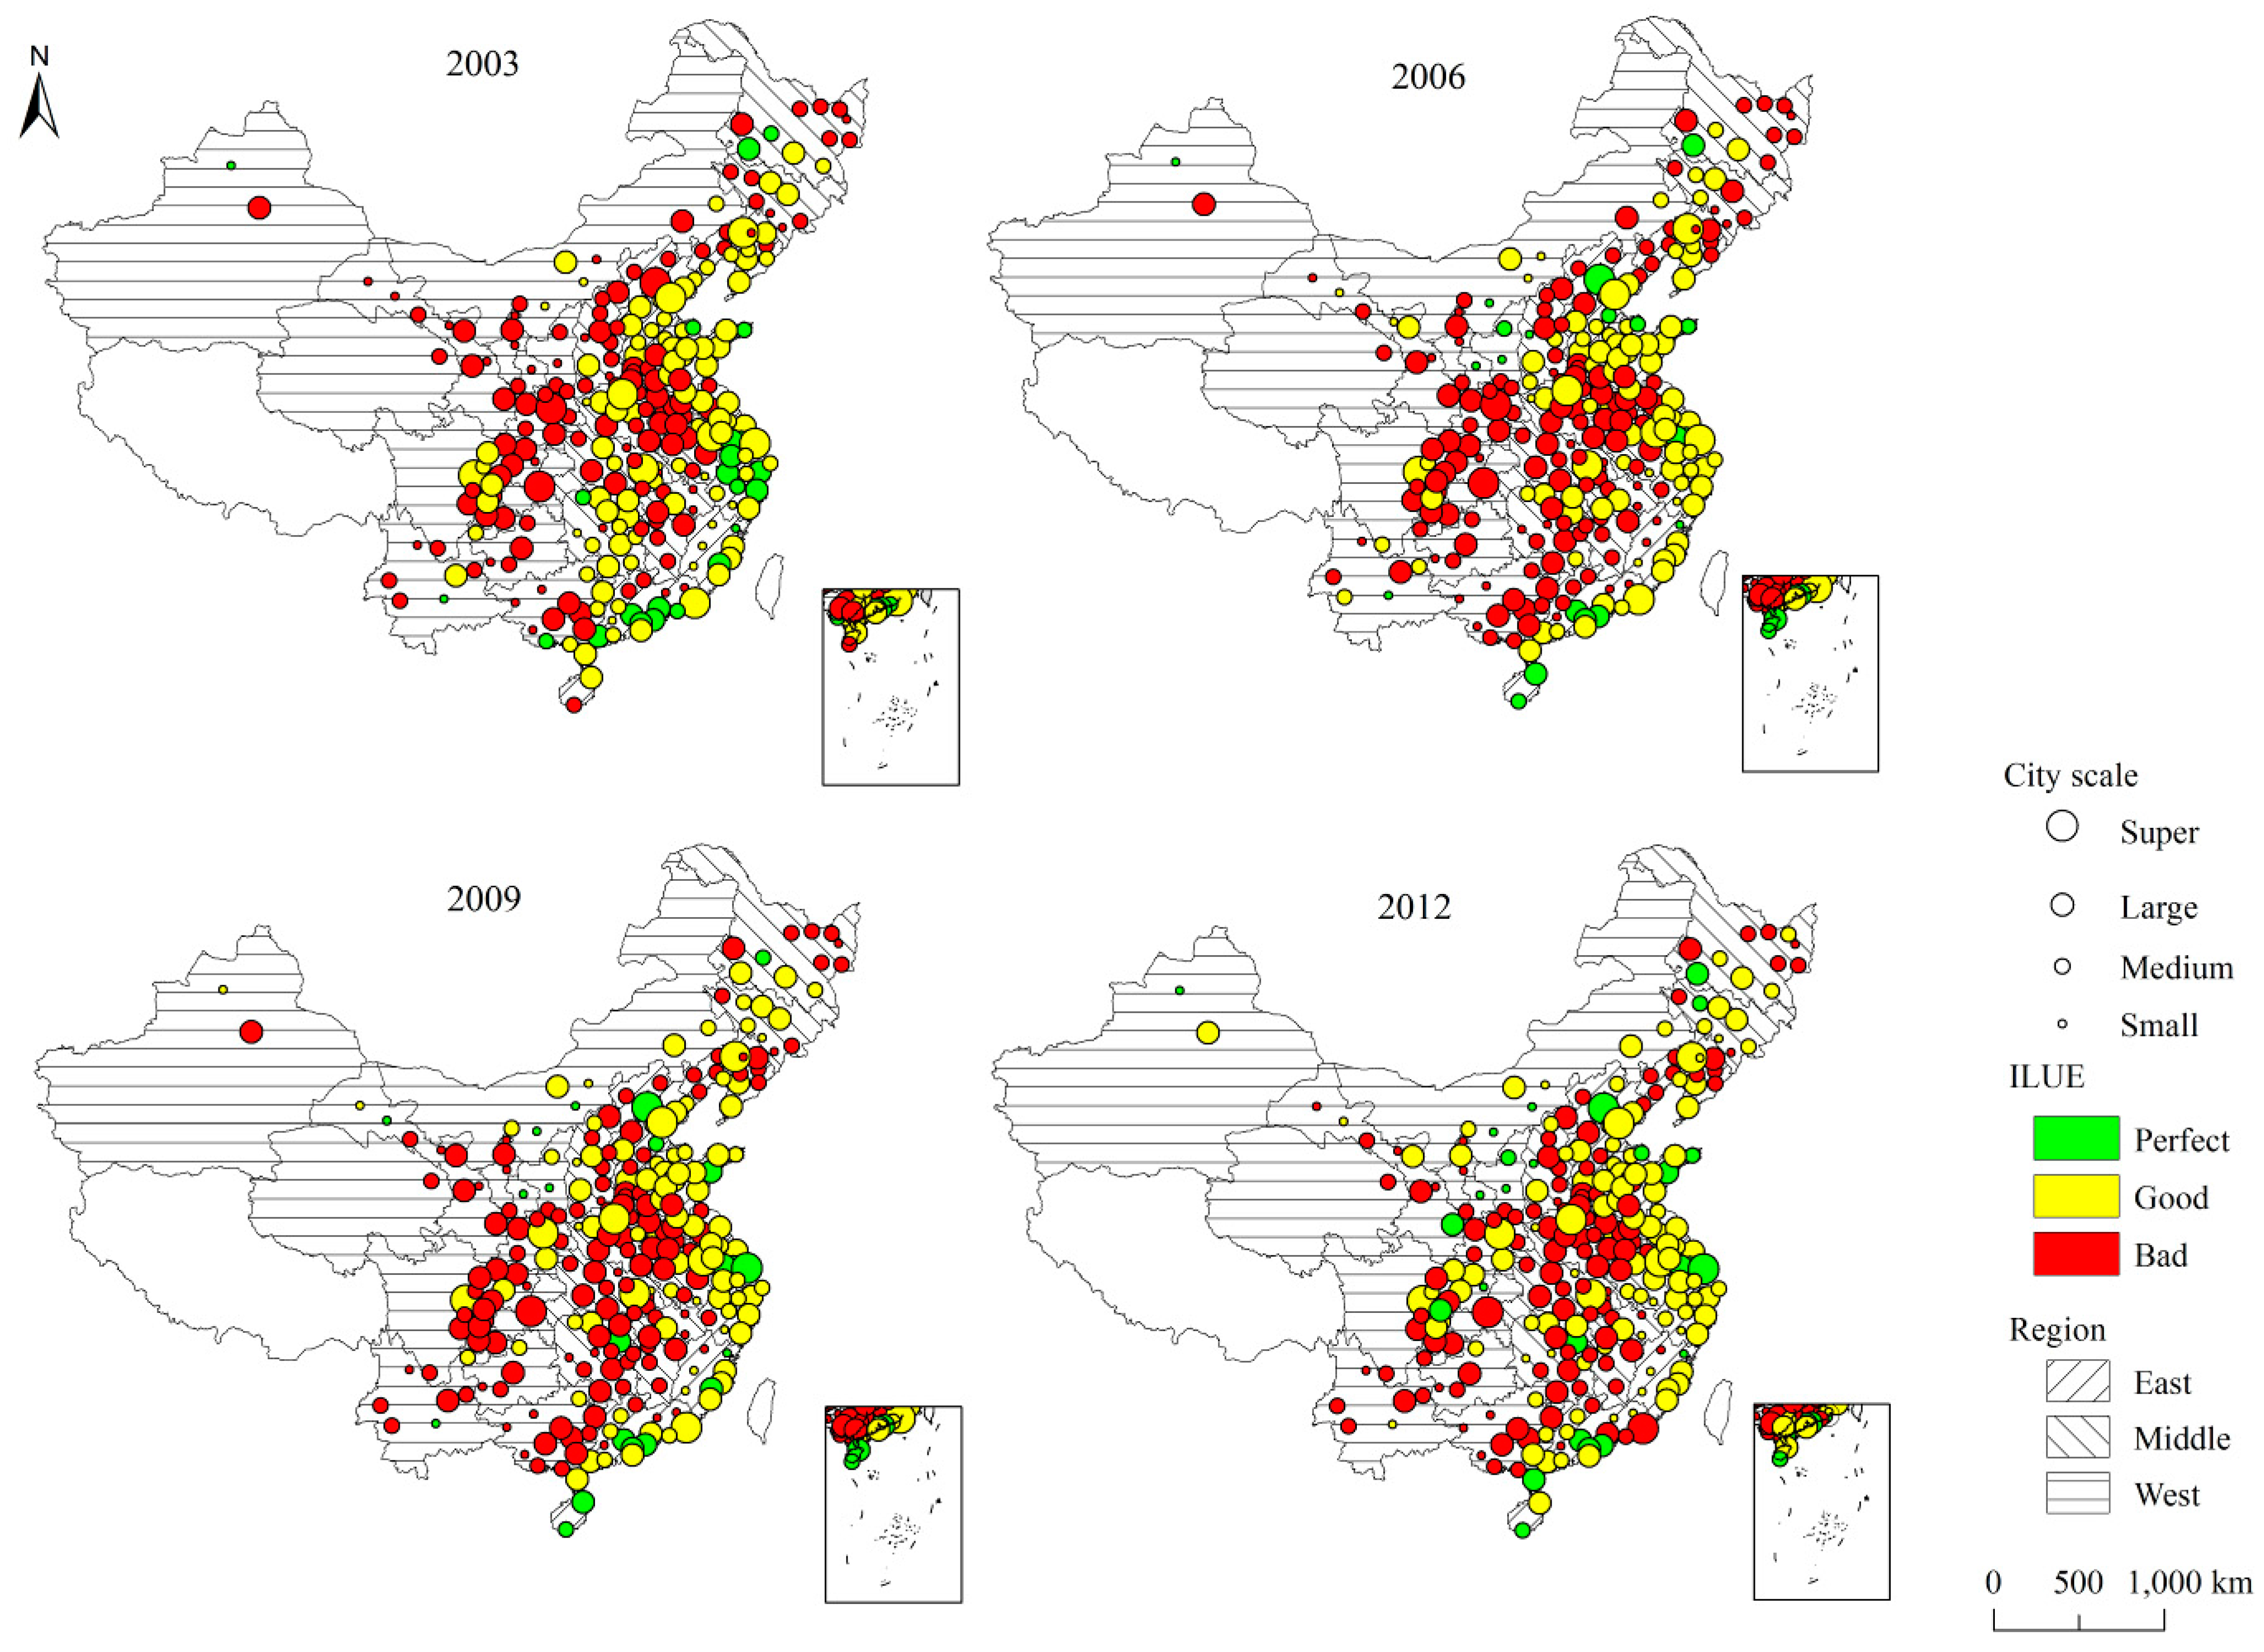
Figure 5, most perfect cities are located in the eastern region with relatively developed economies. This may because most Chinese famous economic zones are located in this region, such as the Yangtze River Delta and Pearl River Delta. However, there are also some cities located in the underdeveloped inland provinces (e.g., Kunming and Zhangjiajie), and the common point of these cities is that industrial layout is mostly focused on tertiary industry, with relatively high economic output and less environmental pollution. Therefore, we can conclude that a higher level of economic development and a reasonable industrial layout contribute to the improvement of ULUEE in China.
Figure 5.
Patterns of ULUEE of China in 2003, 2006, 2009 and 2012.
Figure 5.
Patterns of ULUEE of China in 2003, 2006, 2009 and 2012.
In terms of individual years, the most efficient cities are located in the eastern region in 2003, whose average ULUEE is 0.438, whereas those in the central and western regions are 0.422 and 0.417, respectively. Therefore, the cities in the eastern region were more efficient than those in the other two regions. The number of efficient cities in China is 26, which only accounts for 9.63% of all the cities. Worse performances are found in the three regions, and the number of efficient cities in China is 21, many cities show lower than those in 2003. However, some cities soon turned into efficient cities in 2009 (e.g., Qingdao and Shanghai), and the three regions show increases in average ULUEEs. Better performances in the three regions could be found in 2012. The average ULUEEs of the eastern, central, and western regions are 0.426, 0.418, and 0.423, respectively. The number of efficient cities in China climbs back to 29, which accounts for 10.74% of all the cities.
In summary, the regions with more developed economies have better performance in urban land use (e.g., Beijing, Shanghai, and Shenzhen). One possible explanation of this result is that advantages of capital, technology and talent are obvious in these cities, which can help effectively solve the bottleneck problems in the process of resource allocation and utilization, such as the balance between economic development and environmental protection, which need huge investment of capital and technology [
37]. Moreover, they can bring positive influence on the social and economic developments of surrounding cities, which is beneficial for improving the overall status of the whole region. On the contrary, the cities with less developed economies always show poorer ULUEEs because development goals in these cities blindly focus on scale expansions of economic development, causing the wasteful use of urban land resources and the sidelining of environmental protection. On the other hand, reasonable industrial layout is also an important factor in improving land use efficiency. The cities that focus on the development of industries with high economic output and low pollution find it easier to achieve the goal of efficiency in urban land use. For instance, the cities Zhangjiajie, Huangshan, and Sanya are famous tourist cities in China, which focus on the tourism development rather than industry with heavy pollutions, and their ULUEE is relatively high during the study period.
In addition, the cities focused on industries that produce higher economic output and less environmental pollution can successfully avoid the dangerous mode of bad land use. Such as introducing a large number of heavy polluted enterprises just for short-term economic interests, which can easily lead to vast waste of land resources and great damage to the local ecological environment [
38].
3.5. Optimization of ULUEE
According to the assumptions of the SSBM model, we can conclude that if the ULUEE is less than 1, then the DMU is inefficient, and we can find the reasons for inefficient land use and ways to achieve improvements by analyzing the slack variables from the model.
Table 4 shows the excesses of inputs and undesirable outputs and shortages of desirable outputs, from which we can achieve the optimization direction of the ULUEE.
Table 4.
Optimization of ULUEE for cities in China in 2012.
Table 4.
Optimization of ULUEE for cities in China in 2012.
| | Inputs Excess (%) | Undesirable Output Excess (%) | Desirable Output Shortage (%) |
|---|
| AREA | FIX | EM2 | EM3 | WA | SO2 | DU | P2 | P3 |
|---|
| East | 26.55 | 40.54 | 37.14 | 27.24 | 29.95 | 62.21 | 58.37 | 10.36 | 0.56 |
| Central | 51.63 | 57.42 | 52.55 | 59.19 | 41.25 | 73.87 | 89.82 | 7.57 | 4.70 |
| West | 50.56 | 56.27 | 55.41 | 62.75 | 38.13 | 63.62 | 51.97 | 5.47 | 4.84 |
| Super | 23.48 | 52.04 | 34.39 | 29.47 | 14.16 | 54.42 | 43.87 | 2.32 | 0.00 |
| Large | 37.35 | 47.51 | 44.66 | 43.80 | 30.39 | 65.45 | 62.74 | 9.40 | 1.48 |
| Medium | 55.32 | 51.17 | 55.54 | 61.83 | 41.71 | 72.71 | 87.71 | 12.12 | 5.23 |
| Small | 47.14 | 43.74 | 41.10 | 52.59 | 54.82 | 59.79 | 48.36 | 6.98 | 8.49 |
| China | 38.93 | 48.89 | 44.65 | 44.54 | 34.53 | 66.00 | 75.75 | 8.71 | 2.16 |
From a national perspective, the excess ratio of total investment in fixed assets ranks first in all four inputs, which means that investment in environmental management can be reduced by 48.89% under the condition of the same level of output. This calls for more reasonable use of capital investment during secondary and tertiary industry production processes in Chinese cities. The excess ratios of the number of workers employed in secondary and tertiary industries are, respectively as high as 44.65% and 44.54%, which indicates that severe labor surplus is an urgent issue in these two industries. The excess ratio of urban built-up area is 38.93%, which shows evidence for curbing the unreasonable use of land resources. As for undesirable outputs, the excess ratio of industrial soot ranks first with a score of 68.26%, which implies that the industrial soot can be cut by 75.75% while maintaining the same level of inputs. Industrial wastewater discharge and the industrial sulfur dioxide emissions have excess ratios of 34.53% and 66%, respectively, which indicates that the great benefits of industrial production in China are accompanied by serious environmental pollution. The shortage ratios of the desirable outputs are relatively small, only 8.71% and 2.16% in the secondary and tertiary industries, respectively, which implies that the outputs in these two industries can increase by 8.71% and 2.16%, respectively, in the realization of optimal production.
From a regional perspective, the cities in eastern region show the best performance in all three regions. From the city scale perspective, the super cities are more efficient than the other city scales. Although a few disparities exist in cities from different regions and city scales, most of them have problems in the unreasonable use of land, funds, labor surplus, excessive discharge of pollutants, and economic output shortage. Therefore, a series of targeted policies should be introduced to improve the ULUEE in China.
3.6. Influencing Factors of the ULUEE
The results of a Hausman test showed that the fixed effect model was better than the random effect model. This study uses the fixed effect model to investigate how the different explanatory factors influence ULUEE.
Table 5 shows the estimation results of the panel data model regression at a regional level, and
Table 6 the shows estimation results of the panel data model regression for different city scales.
As
Table 5 shown, Per capita GDP (PGDP) and land use intensity (LUI) have significant positive impacts on ULUEE in all the three regions and four types of city scale groups, which are consistent with the hypotheses. This means we can improve the ULUEE by increasing Per capita GDP and land use intensity in Chinese cities. The urbanization rate (URB) and the proportion of foreign enterprises’ output account for the total output in the secondary and tertiary industries (FDI) have significant positive impacts on ULUEE in the eastern and central regions, which are also consistent with the hypotheses. However, land management policy (POL) has negative impacts on ULUEE in all the three regions and four types of city scale groups, which is inconsistent with the hypotheses. This may because the central land policies have not been effectively implemented in Chinese cities [
39]. In addition, the urbanization rate (URB) has significant positive impacts on ULUEE in the eastern region, while it has an opposite effect in the central region. This may due to the rapidly increasing population and the gradually slowdown of labor transfer speed in the central region, which lead to severe population burden and labor surplus problems. Moreover, the urbanization rate (URB) has significant positive impacts on ULUEE in the super city group, while it has opposite effect in the medium city group.
Table 5.
Results of the panel data model regression for different regions.
Table 5.
Results of the panel data model regression for different regions.
| Variables | East | Central | West |
|---|
| PGDP | 0.04037 *** | 0.04704 *** | 0.04698 *** |
| (12.84563) | (15.98672) | (14.61161) |
| LUI | 0.01664 *** | 0.01117 *** | 0.01829 *** |
| (19.99913) | (14.89497) | (17.01049) |
| POL | −0.20301 *** | −0.12314 *** | −0.12962 *** |
| (−18.56826) | (−14.24576) | (−13.25553) |
| URB | 0.14689 *** | −0.09111 *** | 0.01133 |
| (5.79202) | (−5.54864) | (0.52791) |
| LLP | −0.00003 | −0.00019 ** | −0.00015 *** |
| (0.60169) | (−2.00119) | (−3.45475) |
| FDI | 0.00061 *** | 0.00043 * | 0.00011 |
| (2.95261) | (1.86889) | (0.50279) |
| Constant | 0.17406 *** | 0.21703 *** | 0.14958 *** |
| (14.08999) | (28.79594) | (13.89071) |
| R2 | 0.60144 | 0.46702 | 0.58148 |
| Adjusted-R2 | 0.59898 | 0.46369 | 0.57807 |
| F-statistic | 244.71080 | 140.48980 | 170.88940 |
| Prob. | 0.00000 | 0.00000 | 0.00000 |
Table 6.
Results of the panel data model regression for different city scales.
Table 6.
Results of the panel data model regression for different city scales.
| Variables | Super | Large | Medium | Small |
|---|
| PGDP | 0.03457 ** | 0.05042 *** | 0.04568 *** | 0.03419 *** |
| (2.84485) | (18.34933) | (16.03002) | (7.08167) |
| LUI | 0.01767 ** | 0.01306 *** | 0.01454 *** | 0.02121 *** |
| (2.93964) | (14.73244) | (20.52423) | (16.03803) |
| POL | −0.08726 * | −0.15637 *** | −0.12486 *** | −0.13124 *** |
| (−1.9837) | (−16.84201) | (−12.81364) | (−5.42657) |
| URB | 0.26486 ** | −0.02016 | −0.05199 *** | 0.09233 |
| (2.72825) | (−1.0294) | (−2.67407) | (1.80282) |
| LLP | −0.00006 | −0.00003 | −0.00058 *** | −0.00099 *** |
| (−0.7452) | (−0.74724) | (−4.98737) | (−2.98753) |
| FDI | 0.00317 | 0.00179 *** | 0.00027** | −0.00141 ** |
| (1.84166) | (7.14713) | (2.09296) | (−2.25177) |
| Constant | −0.03534 | 0.18827 *** | 0.19836 *** | 0.17421 *** |
| (−0.58574) | (19.34132) | (22.51948) | (8.69024) |
| R2 | 0.63134 | 0.65951 | 0.60613 | 0.53565 |
| Adjusted-R2 | 0.60986 | 0.65764 | 0.60386 | 0.52918 |
| F-statistic | 29.39783 | 352.52980 | 266.74590 | 82.86234 |
| Prob. | 0.00000 | 0.00000 | 0.00000 | 0.00000 |
As for the land leasing policy (LLP), it has negative impacts on ULUEE in all the three regions and four types of city scale groups, which is consistent with the hypotheses. This may indicate that making up for the deficit by selling land resources is not a wise choice. In addition, the proportion of foreign enterprises’ output account for the total output in the secondary and tertiary industries (FDI) has positive impacts on ULUEE in all the three regions and four types of city scale groups except small-scale cities, this may imply that small-scale cities should attract more foreign investment and expand the scale of economic development.


