Carbon Footprints and Embodied Carbon Flows Analysis for China’s Eight Regions: A New Perspective for Mitigation Solutions
Abstract
:1. Introduction
2. Methodology and Data
2.1. Methodology
2.2. Economic Data
| Number | Sector | Number | Sector |
|---|---|---|---|
| 1 | Agriculture | 10 | machine manufacturing |
| 2 | coal mining | 11 | transport manufacturing |
| 3 | food manufacturing | 12 | electric manufacturing |
| 4 | textiles clothing | 13 | other manufacturing |
| 5 | wood processing | 14 | electric and steam supply |
| 6 | paper printing | 15 | construction |
| 7 | petroleum processing | 16 | transport and warehousing |
| 8 | nonmetal manufacturing | 17 | other service |
| 9 | iron smelt |
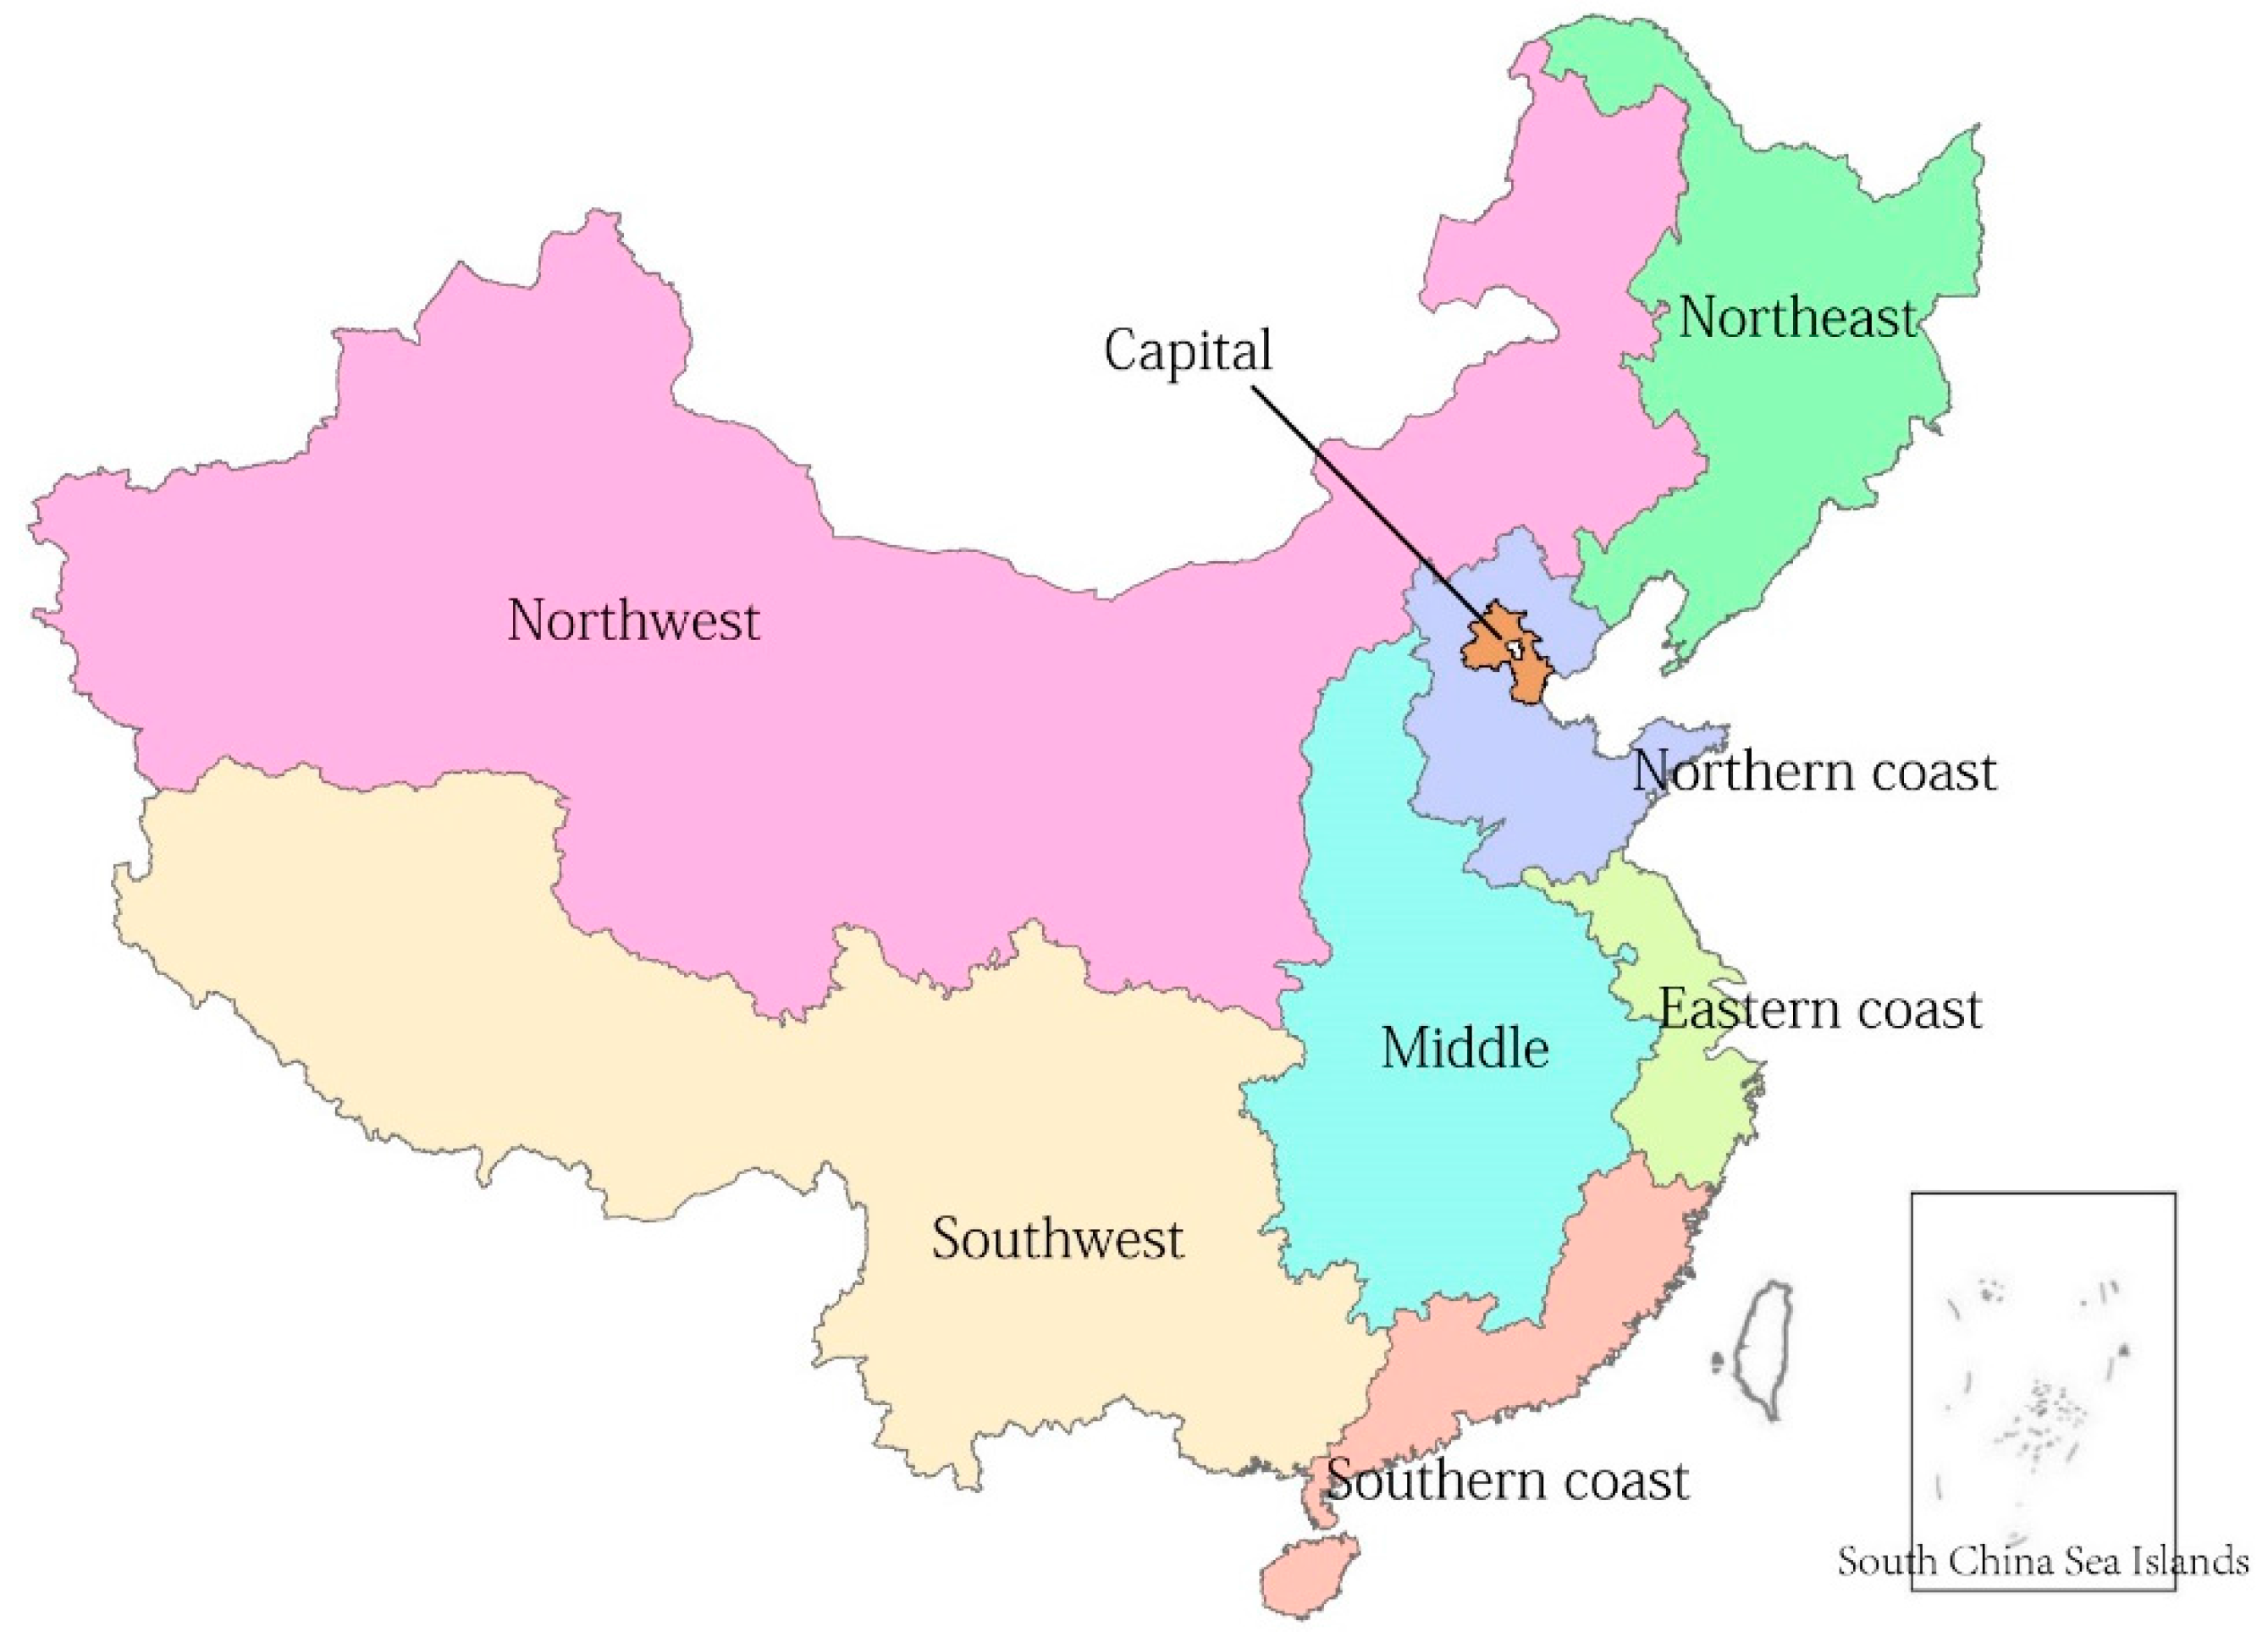
2.3. Carbon Emission Data
3. Results
3.1. Direct and Total Carbon Emission Coefficients
| No. of Sectors | Northeast | Capital | Northern Coast | Eastern Coast | Southern Coast | Middle | Northwest | Southwest |
|---|---|---|---|---|---|---|---|---|
| 1 | 0.23 | 0.48 | 0.11 | 0.27 | 0.20 | 0.24 | 0.33 | 0.25 |
| 2 | 1.05 | 0.26 | 0.47 | 0.61 | 0.18 | 0.97 | 0.81 | 1.19 |
| 6 | 0.46 | 0.14 | 0.41 | 0.31 | 0.26 | 0.45 | 0.72 | 0.62 |
| 7 | 0.76 | 0.62 | 0.75 | 0.45 | 0.35 | 1.21 | 1.85 | 1.68 |
| 8 | 2.62 | 1.61 | 1.41 | 1.65 | 2.05 | 2.15 | 4.49 | 5.23 |
| 9 | 2.41 | 1.23 | 1.89 | 0.77 | 0.47 | 1.56 | 2.21 | 1.77 |
| 10 | 0.18 | 0.08 | 0.13 | 0.07 | 0.09 | 0.15 | 0.17 | 0.17 |
| 11 | 0.08 | 0.06 | 0.11 | 0.05 | 0.04 | 0.14 | 0.08 | 0.08 |
| 12 | 0.05 | 0.01 | 0.05 | 0.02 | 0.02 | 0.05 | 0.09 | 0.04 |
| 14 | 11.79 | 4.90 | 11.16 | 7.70 | 5.06 | 10.56 | 20.03 | 6.71 |
| 15 | 0.06 | 0.11 | 0.24 | 0.07 | 0.05 | 0.08 | 0.15 | 0.08 |
| 16 | 1.07 | 0.66 | 0.88 | 0.75 | 0.93 | 1.00 | 1.71 | 1.32 |
| No. of Sectors | Northeast | Capital | Northern Coast | Eastern Coast | Southern Coast | Middle | Northwest | Southwest |
|---|---|---|---|---|---|---|---|---|
| 1 | 0.94 | 1.66 | 1.33 | 0.99 | 0.71 | 1.06 | 1.73 | 0.85 |
| 2 | 2.54 | 1.60 | 4.05 | 2.85 | 1.29 | 3.33 | 2.71 | 2.90 |
| 6 | 2.09 | 1.78 | 2.99 | 1.89 | 1.58 | 2.47 | 3.36 | 2.28 |
| 7 | 2.41 | 2.30 | 3.81 | 2.36 | 1.87 | 3.44 | 5.06 | 3.90 |
| 8 | 5.99 | 4.19 | 4.72 | 4.53 | 5.19 | 5.33 | 8.74 | 8.32 |
| 9 | 5.68 | 3.83 | 5.85 | 3.28 | 2.60 | 4.66 | 6.75 | 4.50 |
| 10 | 2.61 | 1.92 | 3.62 | 2.18 | 1.68 | 2.70 | 4.17 | 2.25 |
| 11 | 1.94 | 1.60 | 2.83 | 1.91 | 1.33 | 2.54 | 2.46 | 2.05 |
| 12 | 2.43 | 1.17 | 3.59 | 1.59 | 1.14 | 2.35 | 2.61 | 2.24 |
| 14 | 19.02 | 11.51 | 15.70 | 13.52 | 10.08 | 14.57 | 28.16 | 10.98 |
| 15 | 3.04 | 2.86 | 3.43 | 2.89 | 2.94 | 3.13 | 3.79 | 3.34 |
| 16 | 2.21 | 1.68 | 2.59 | 1.66 | 1.49 | 2.35 | 3.40 | 2.44 |
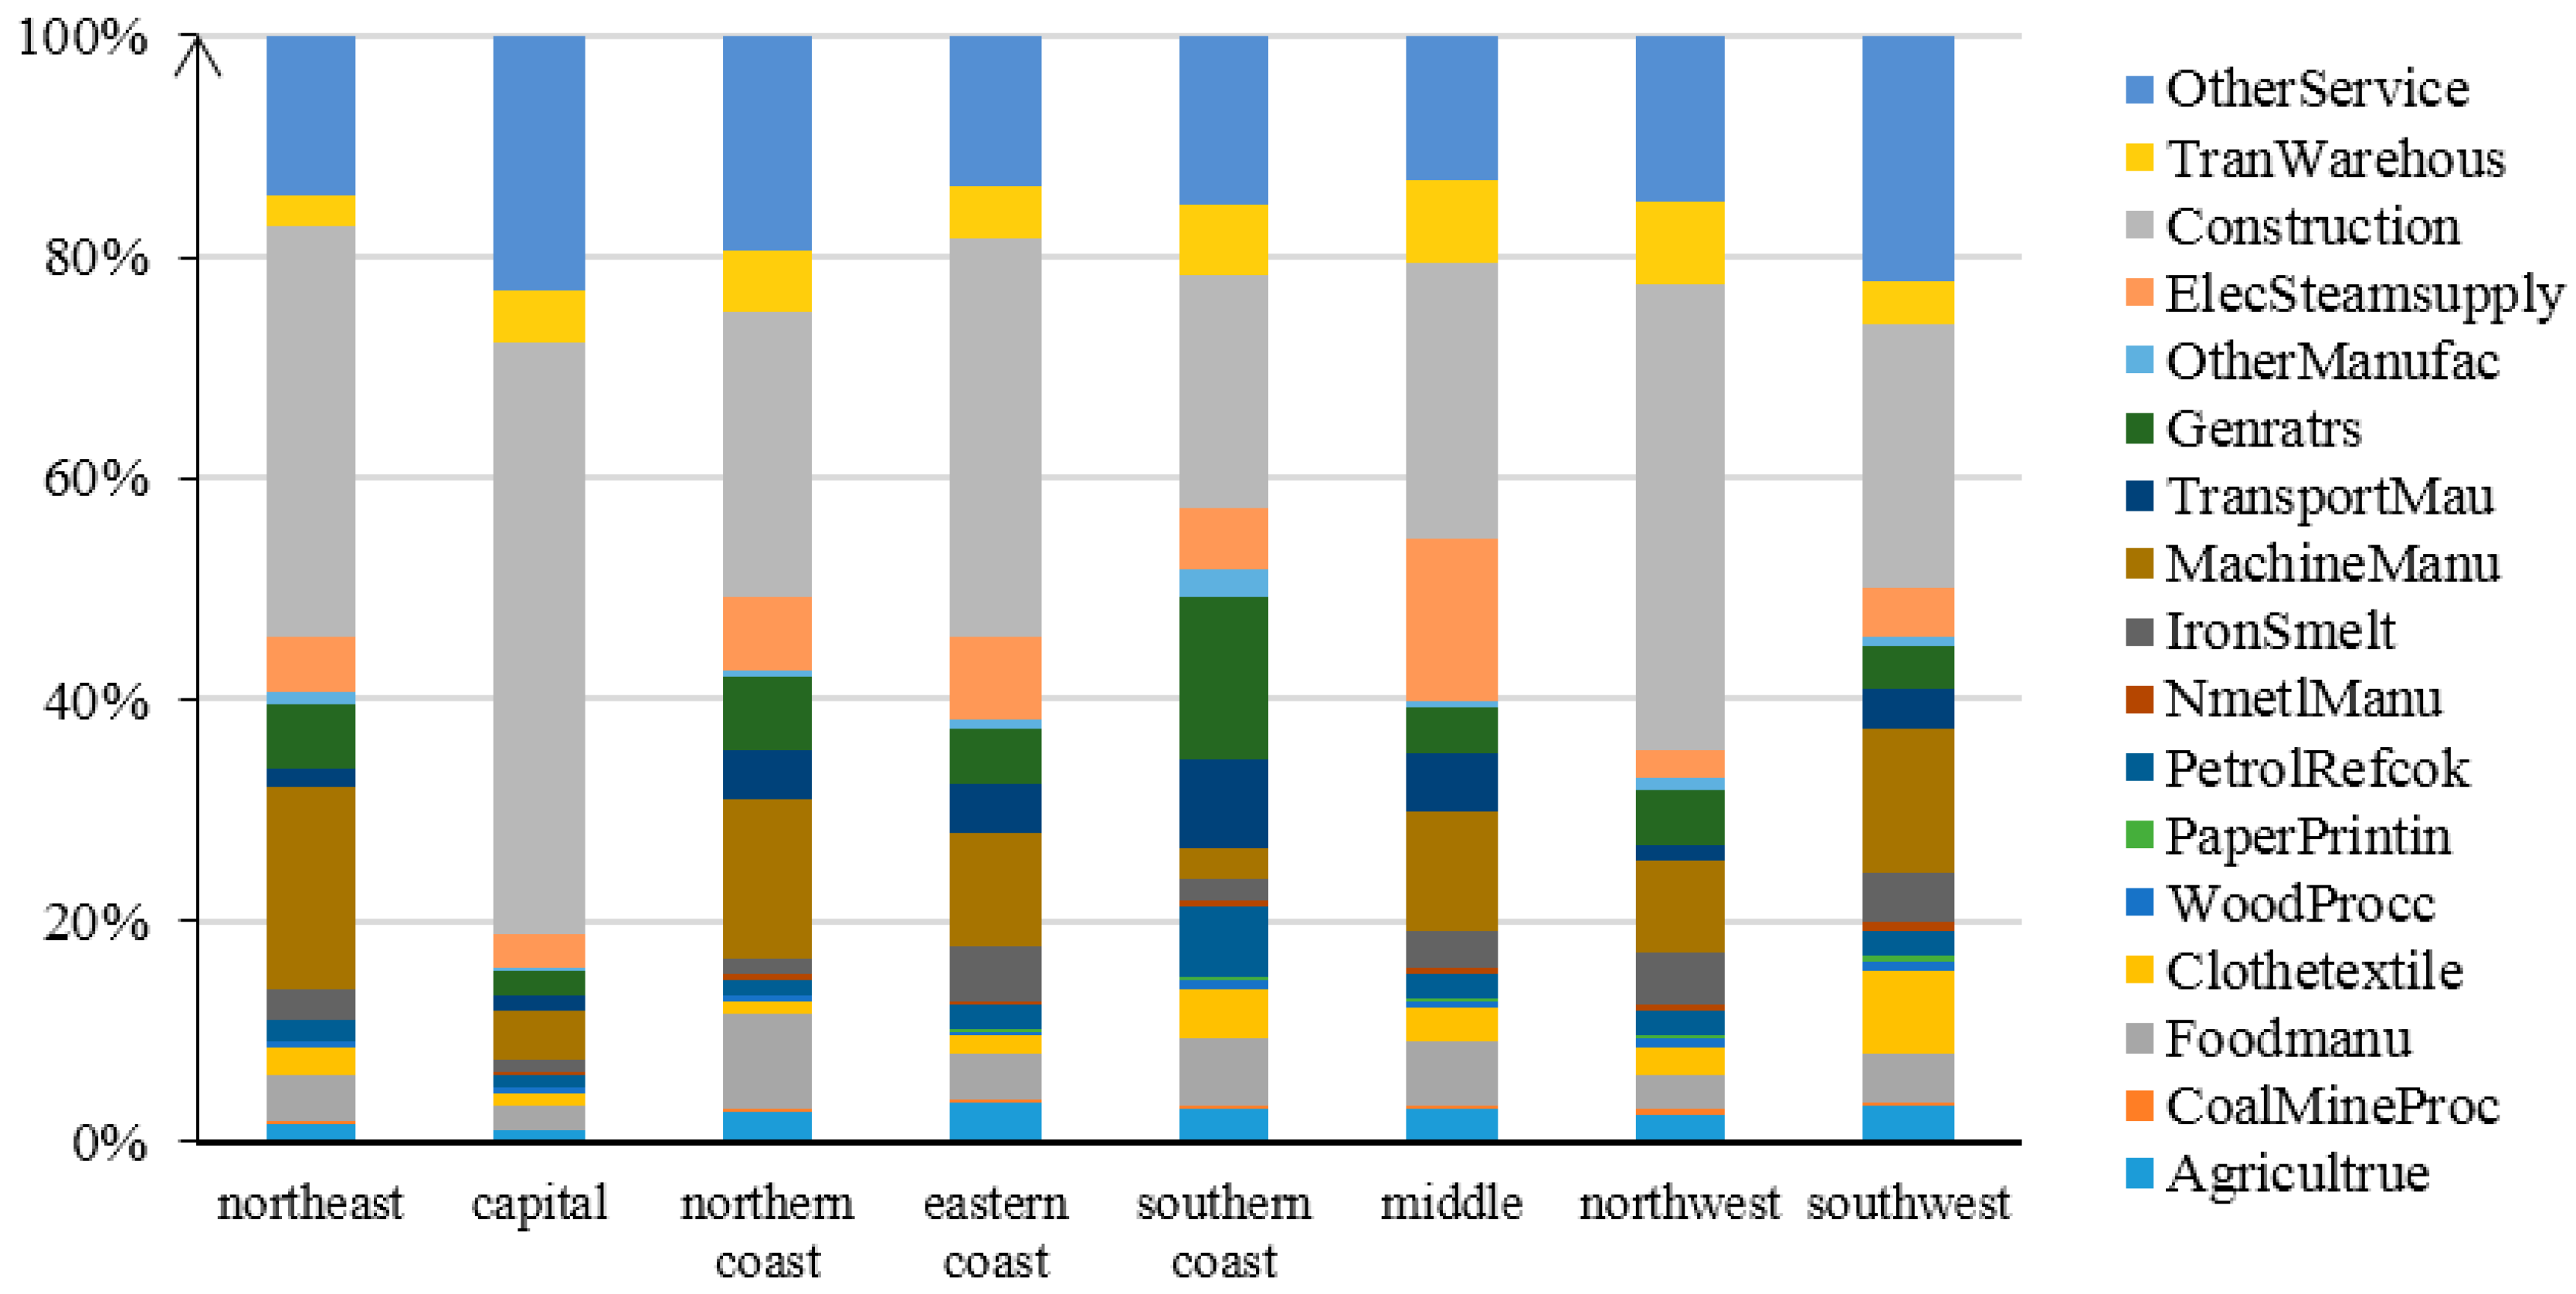
3.2. Regional Carbon Footprints
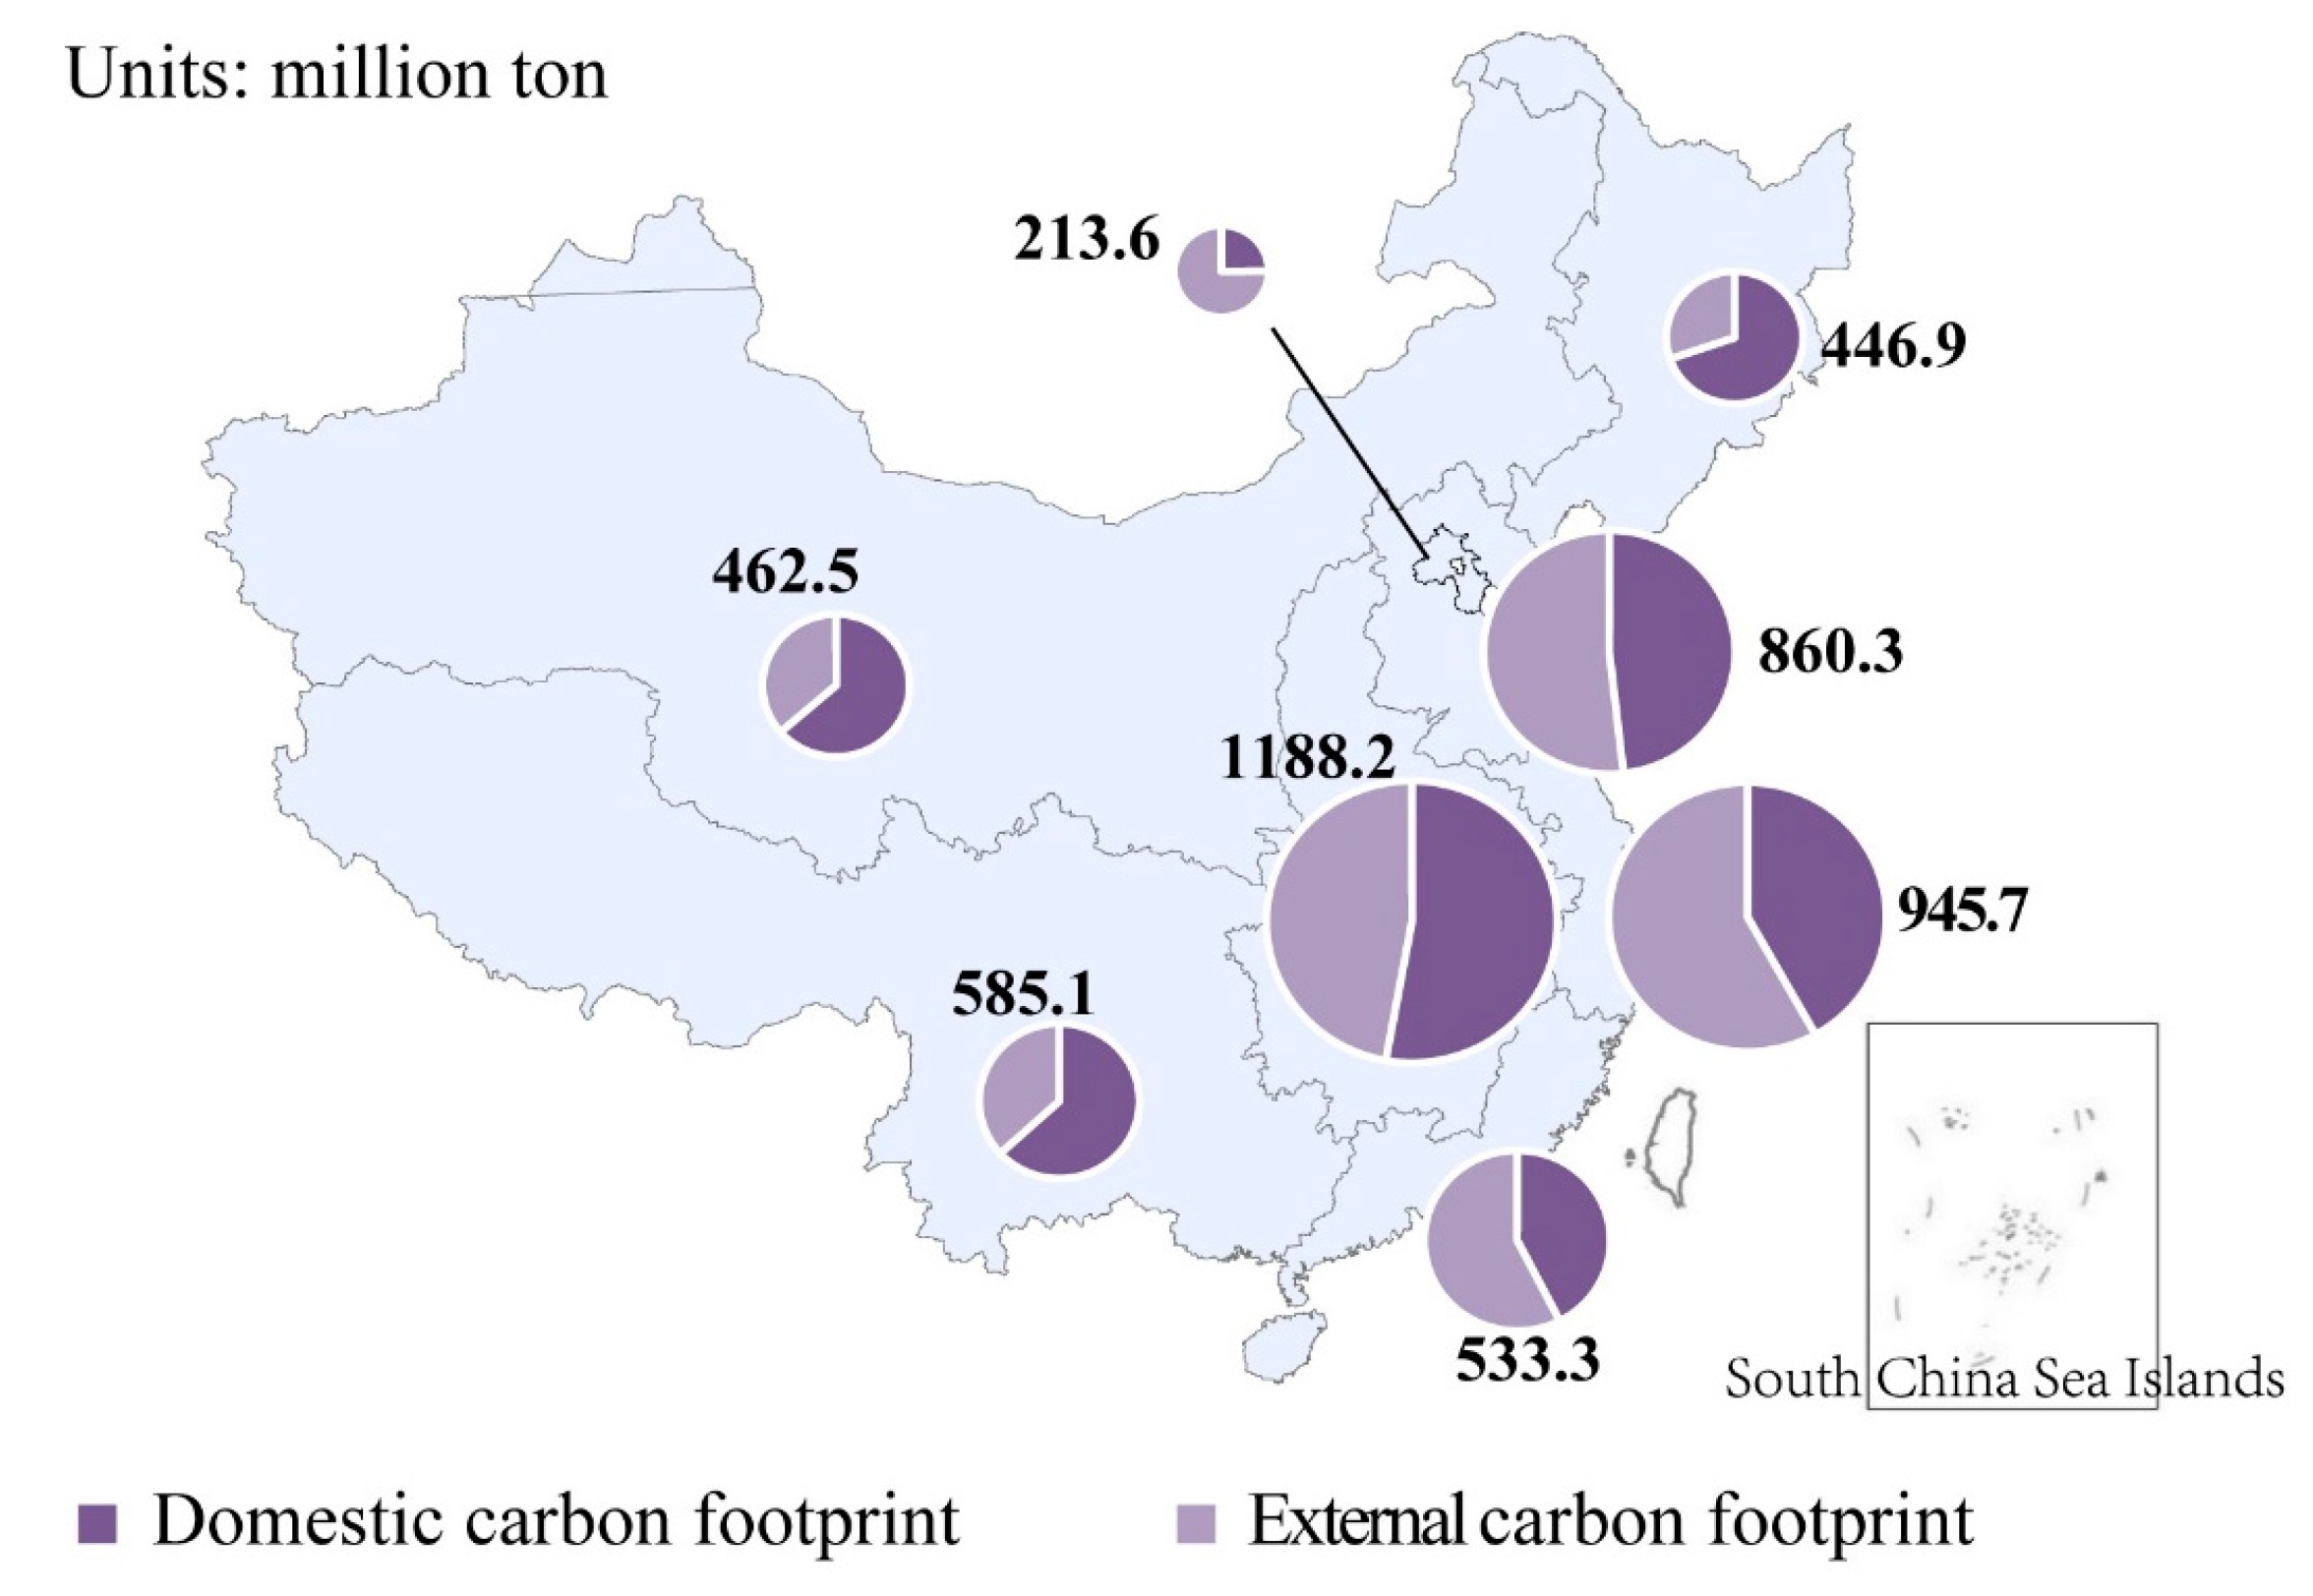
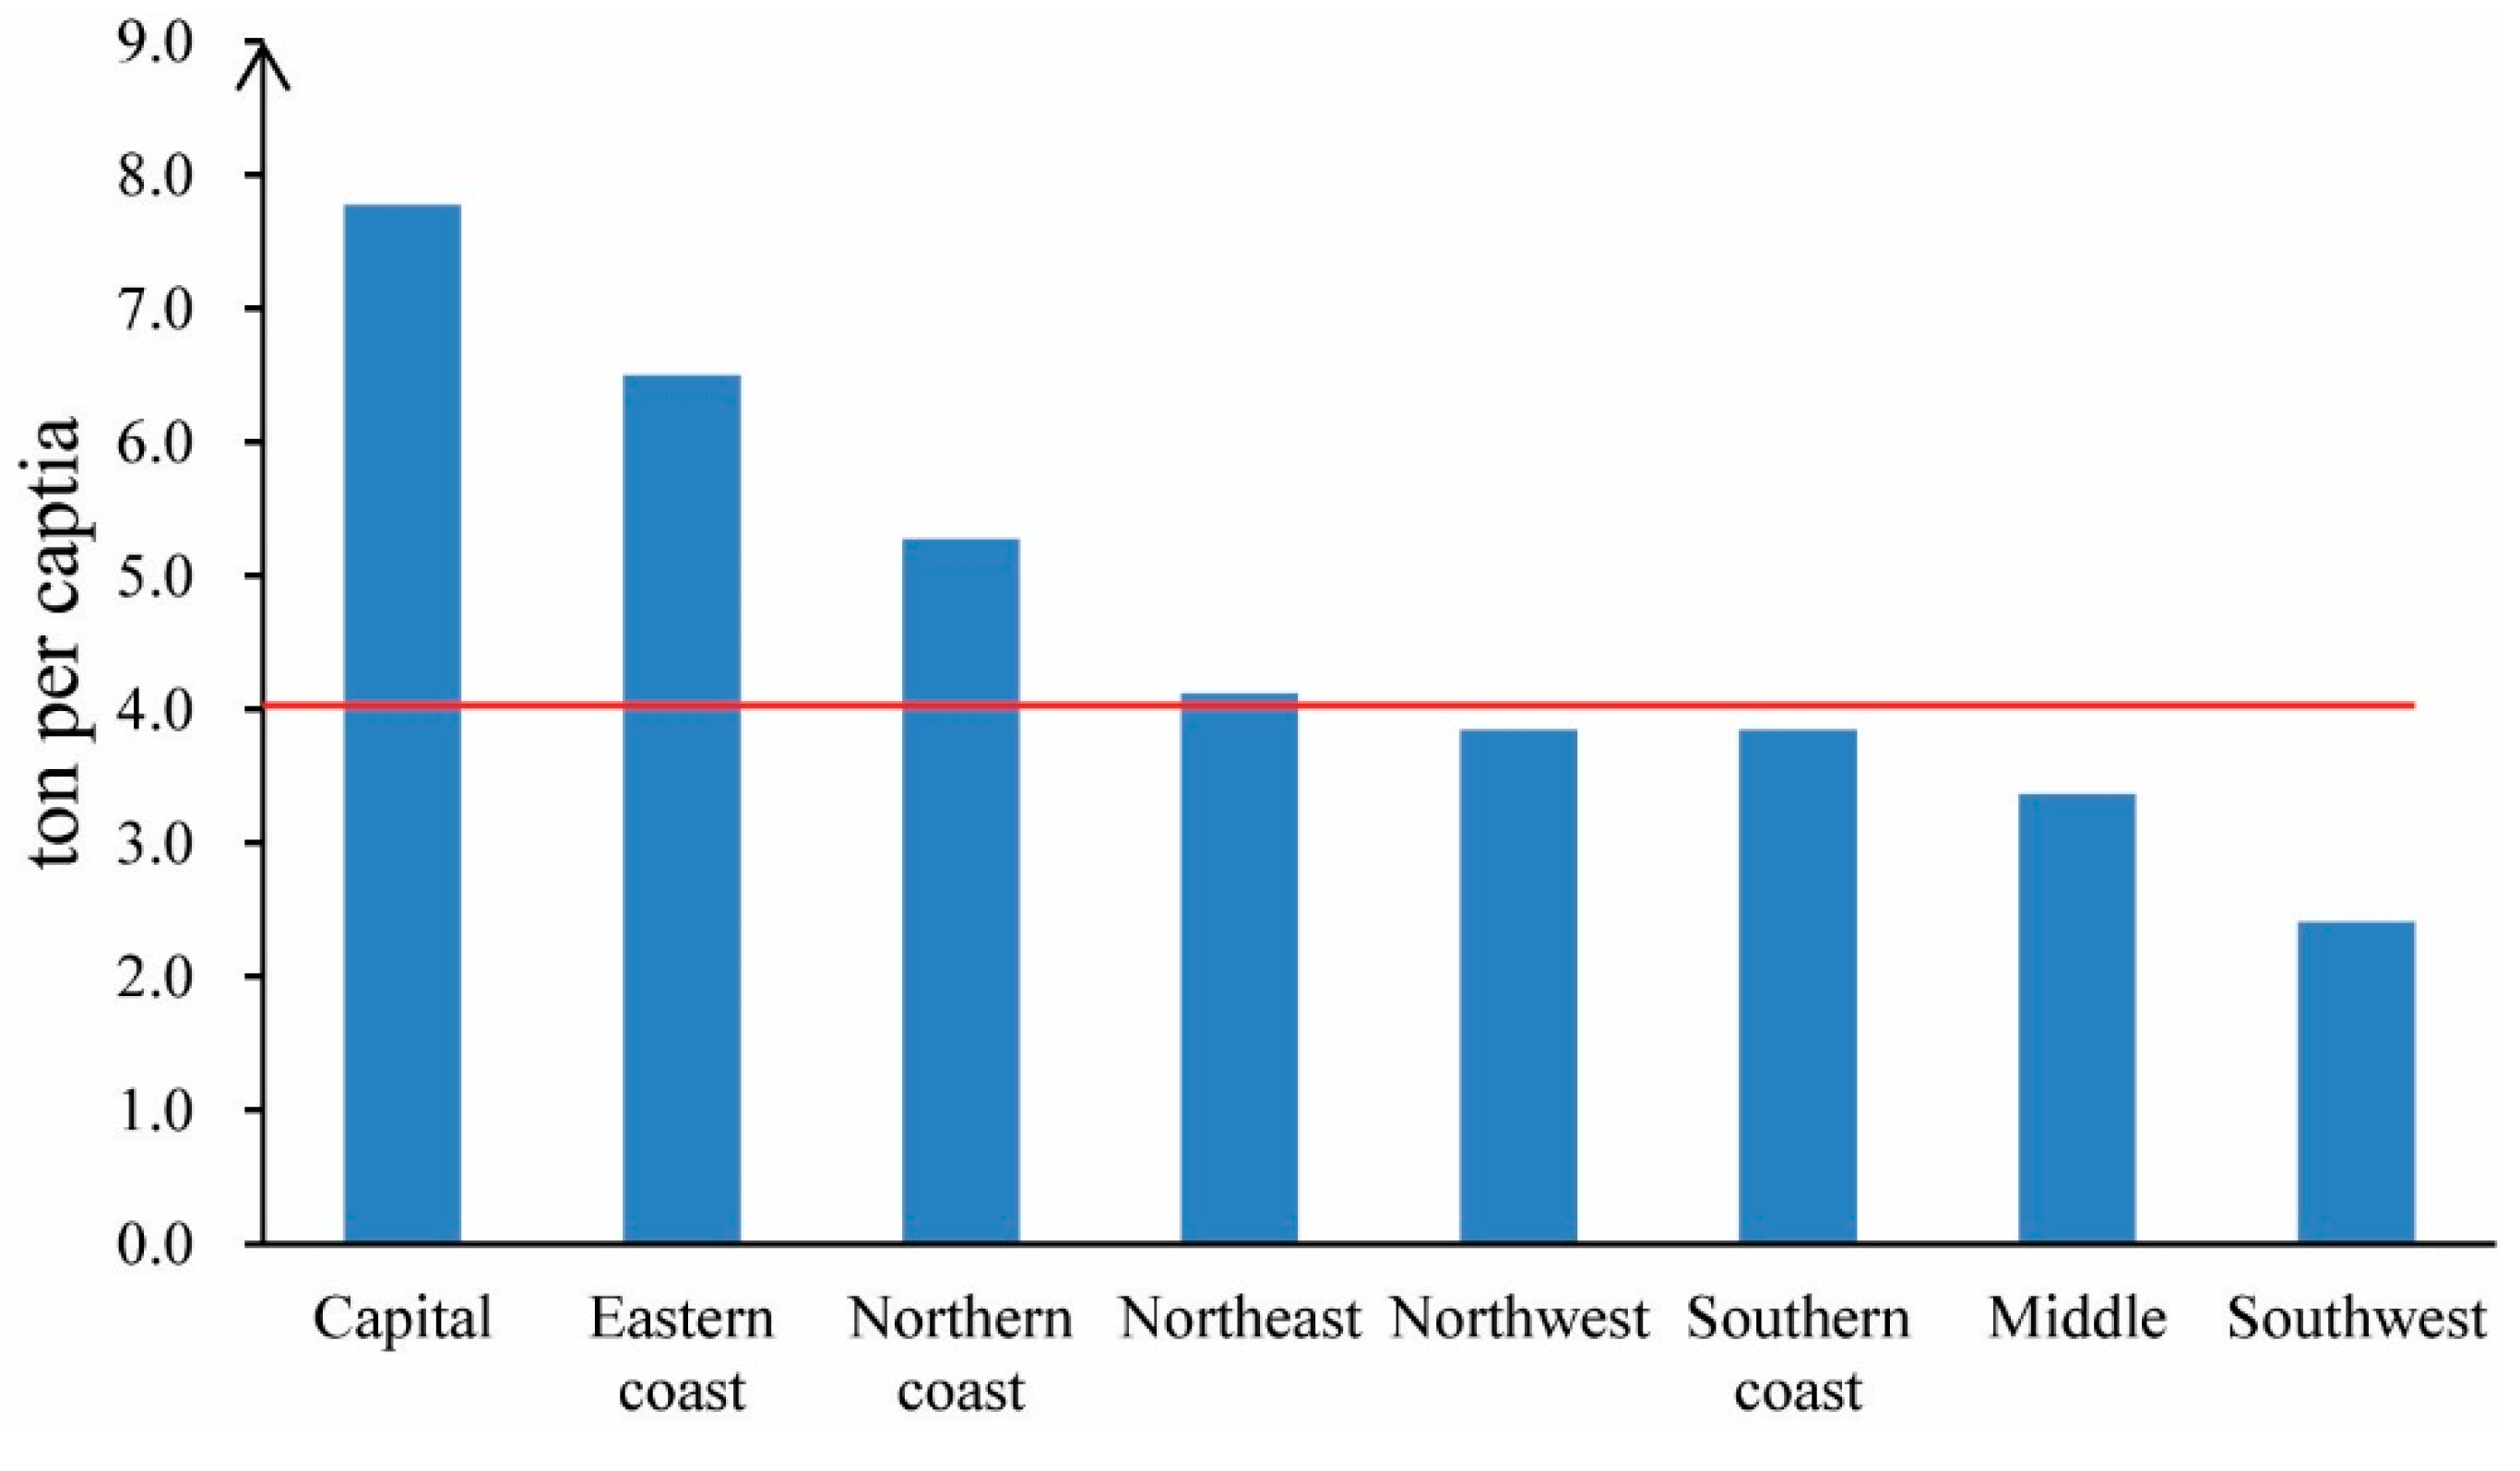
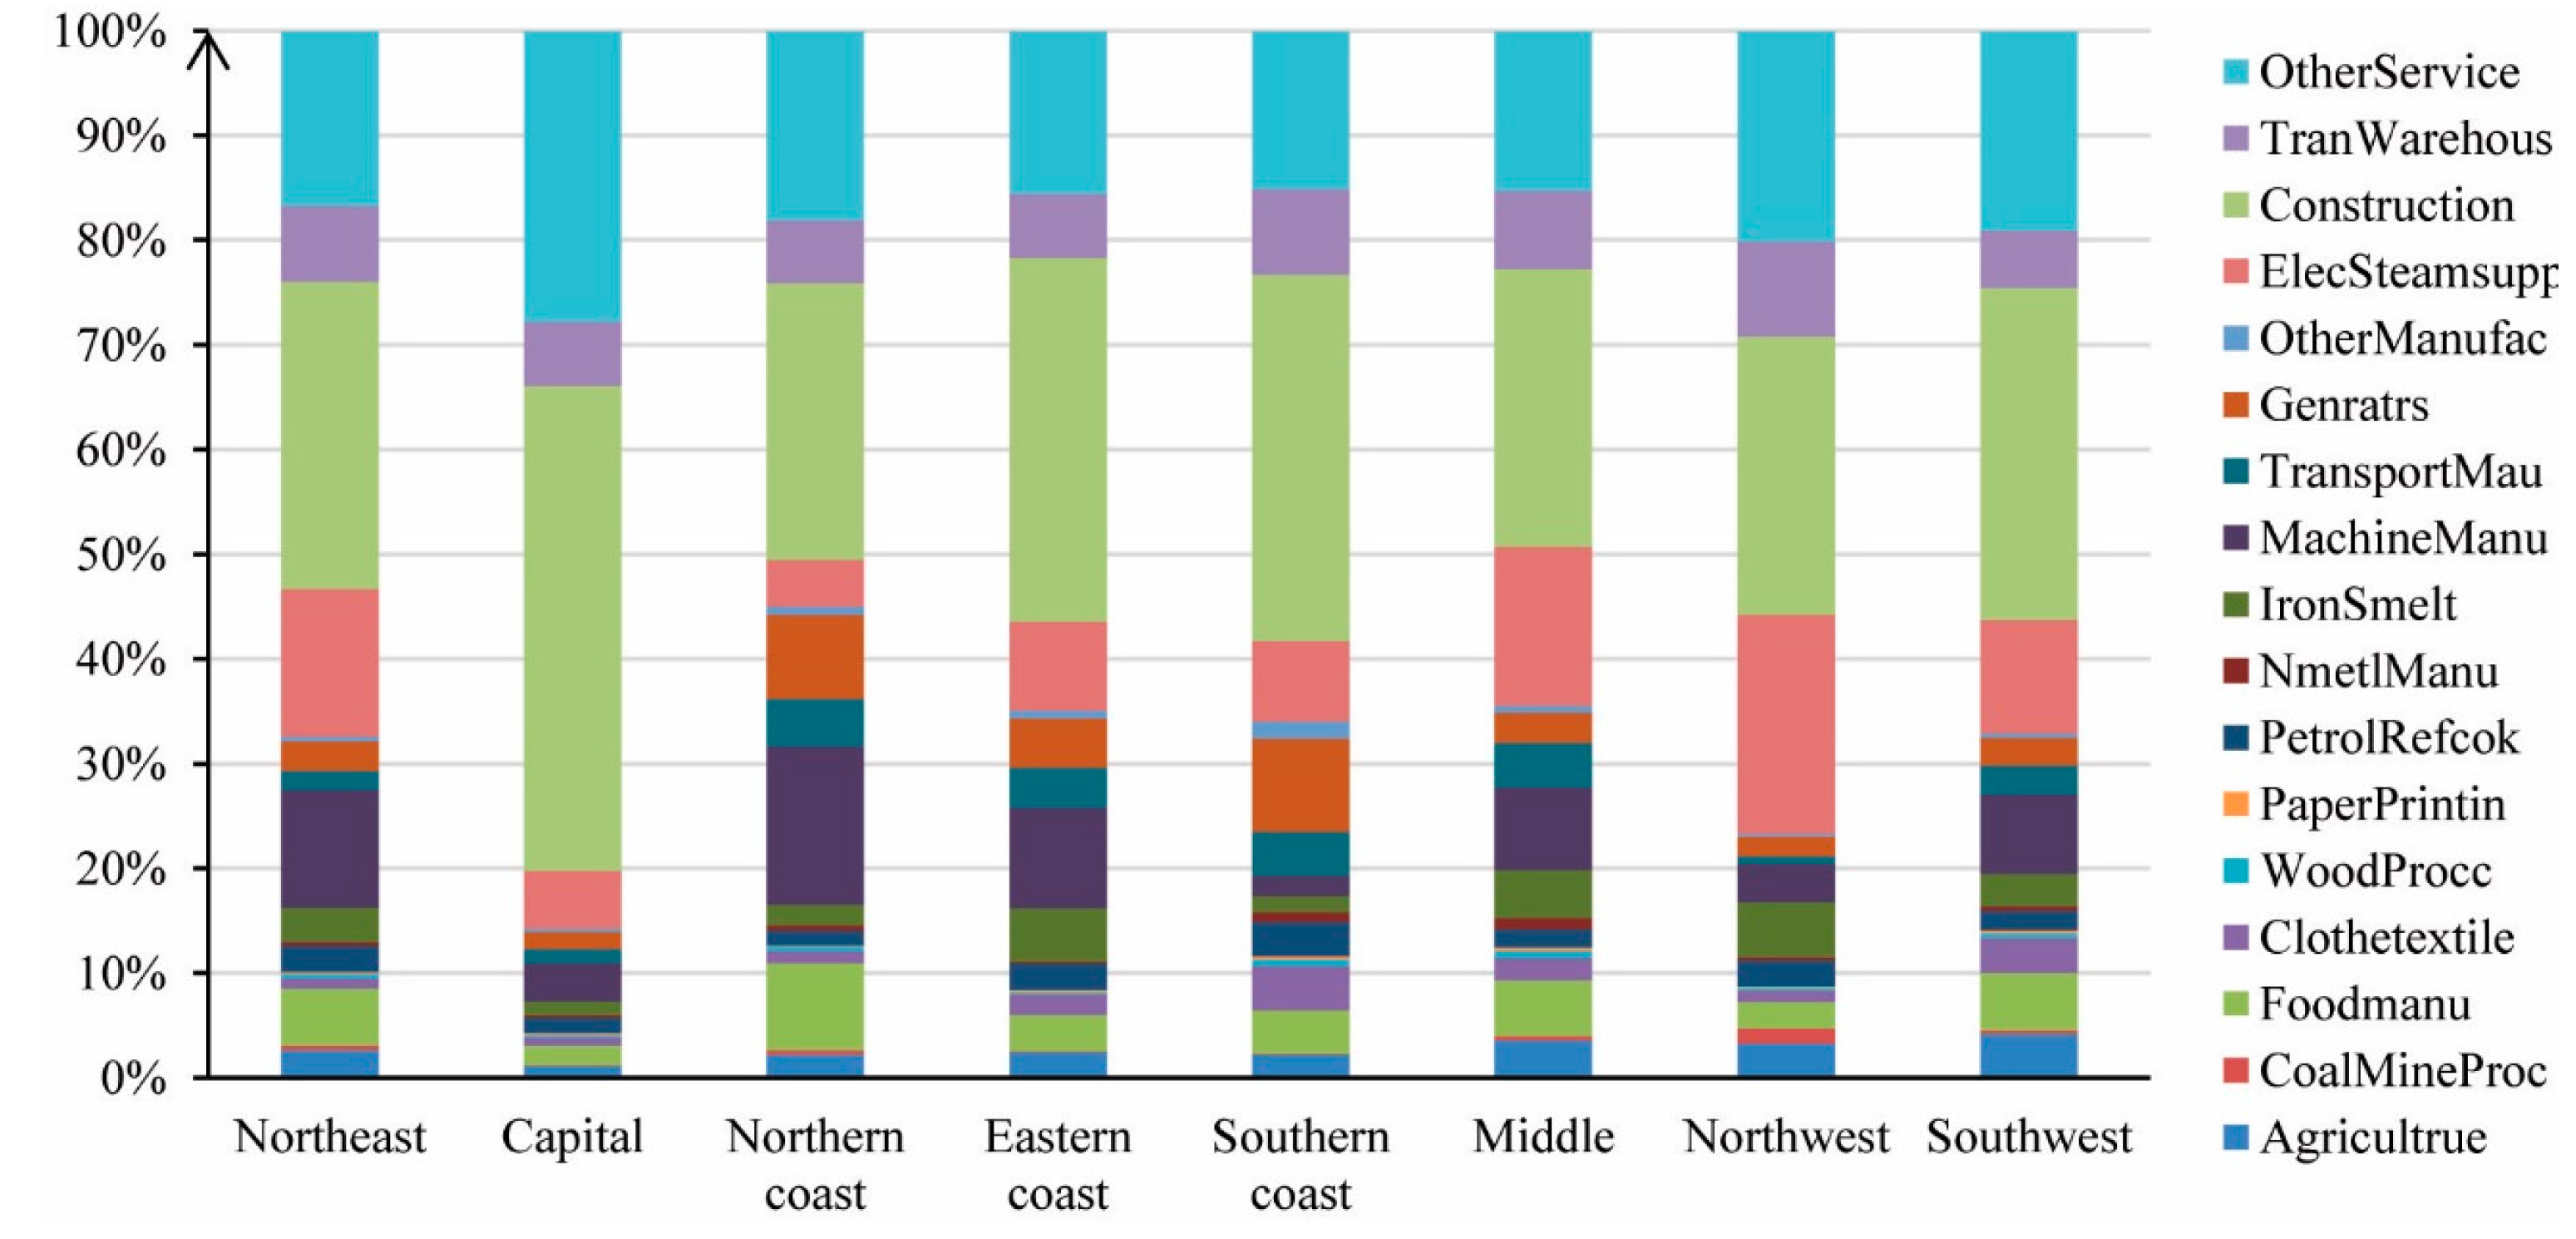
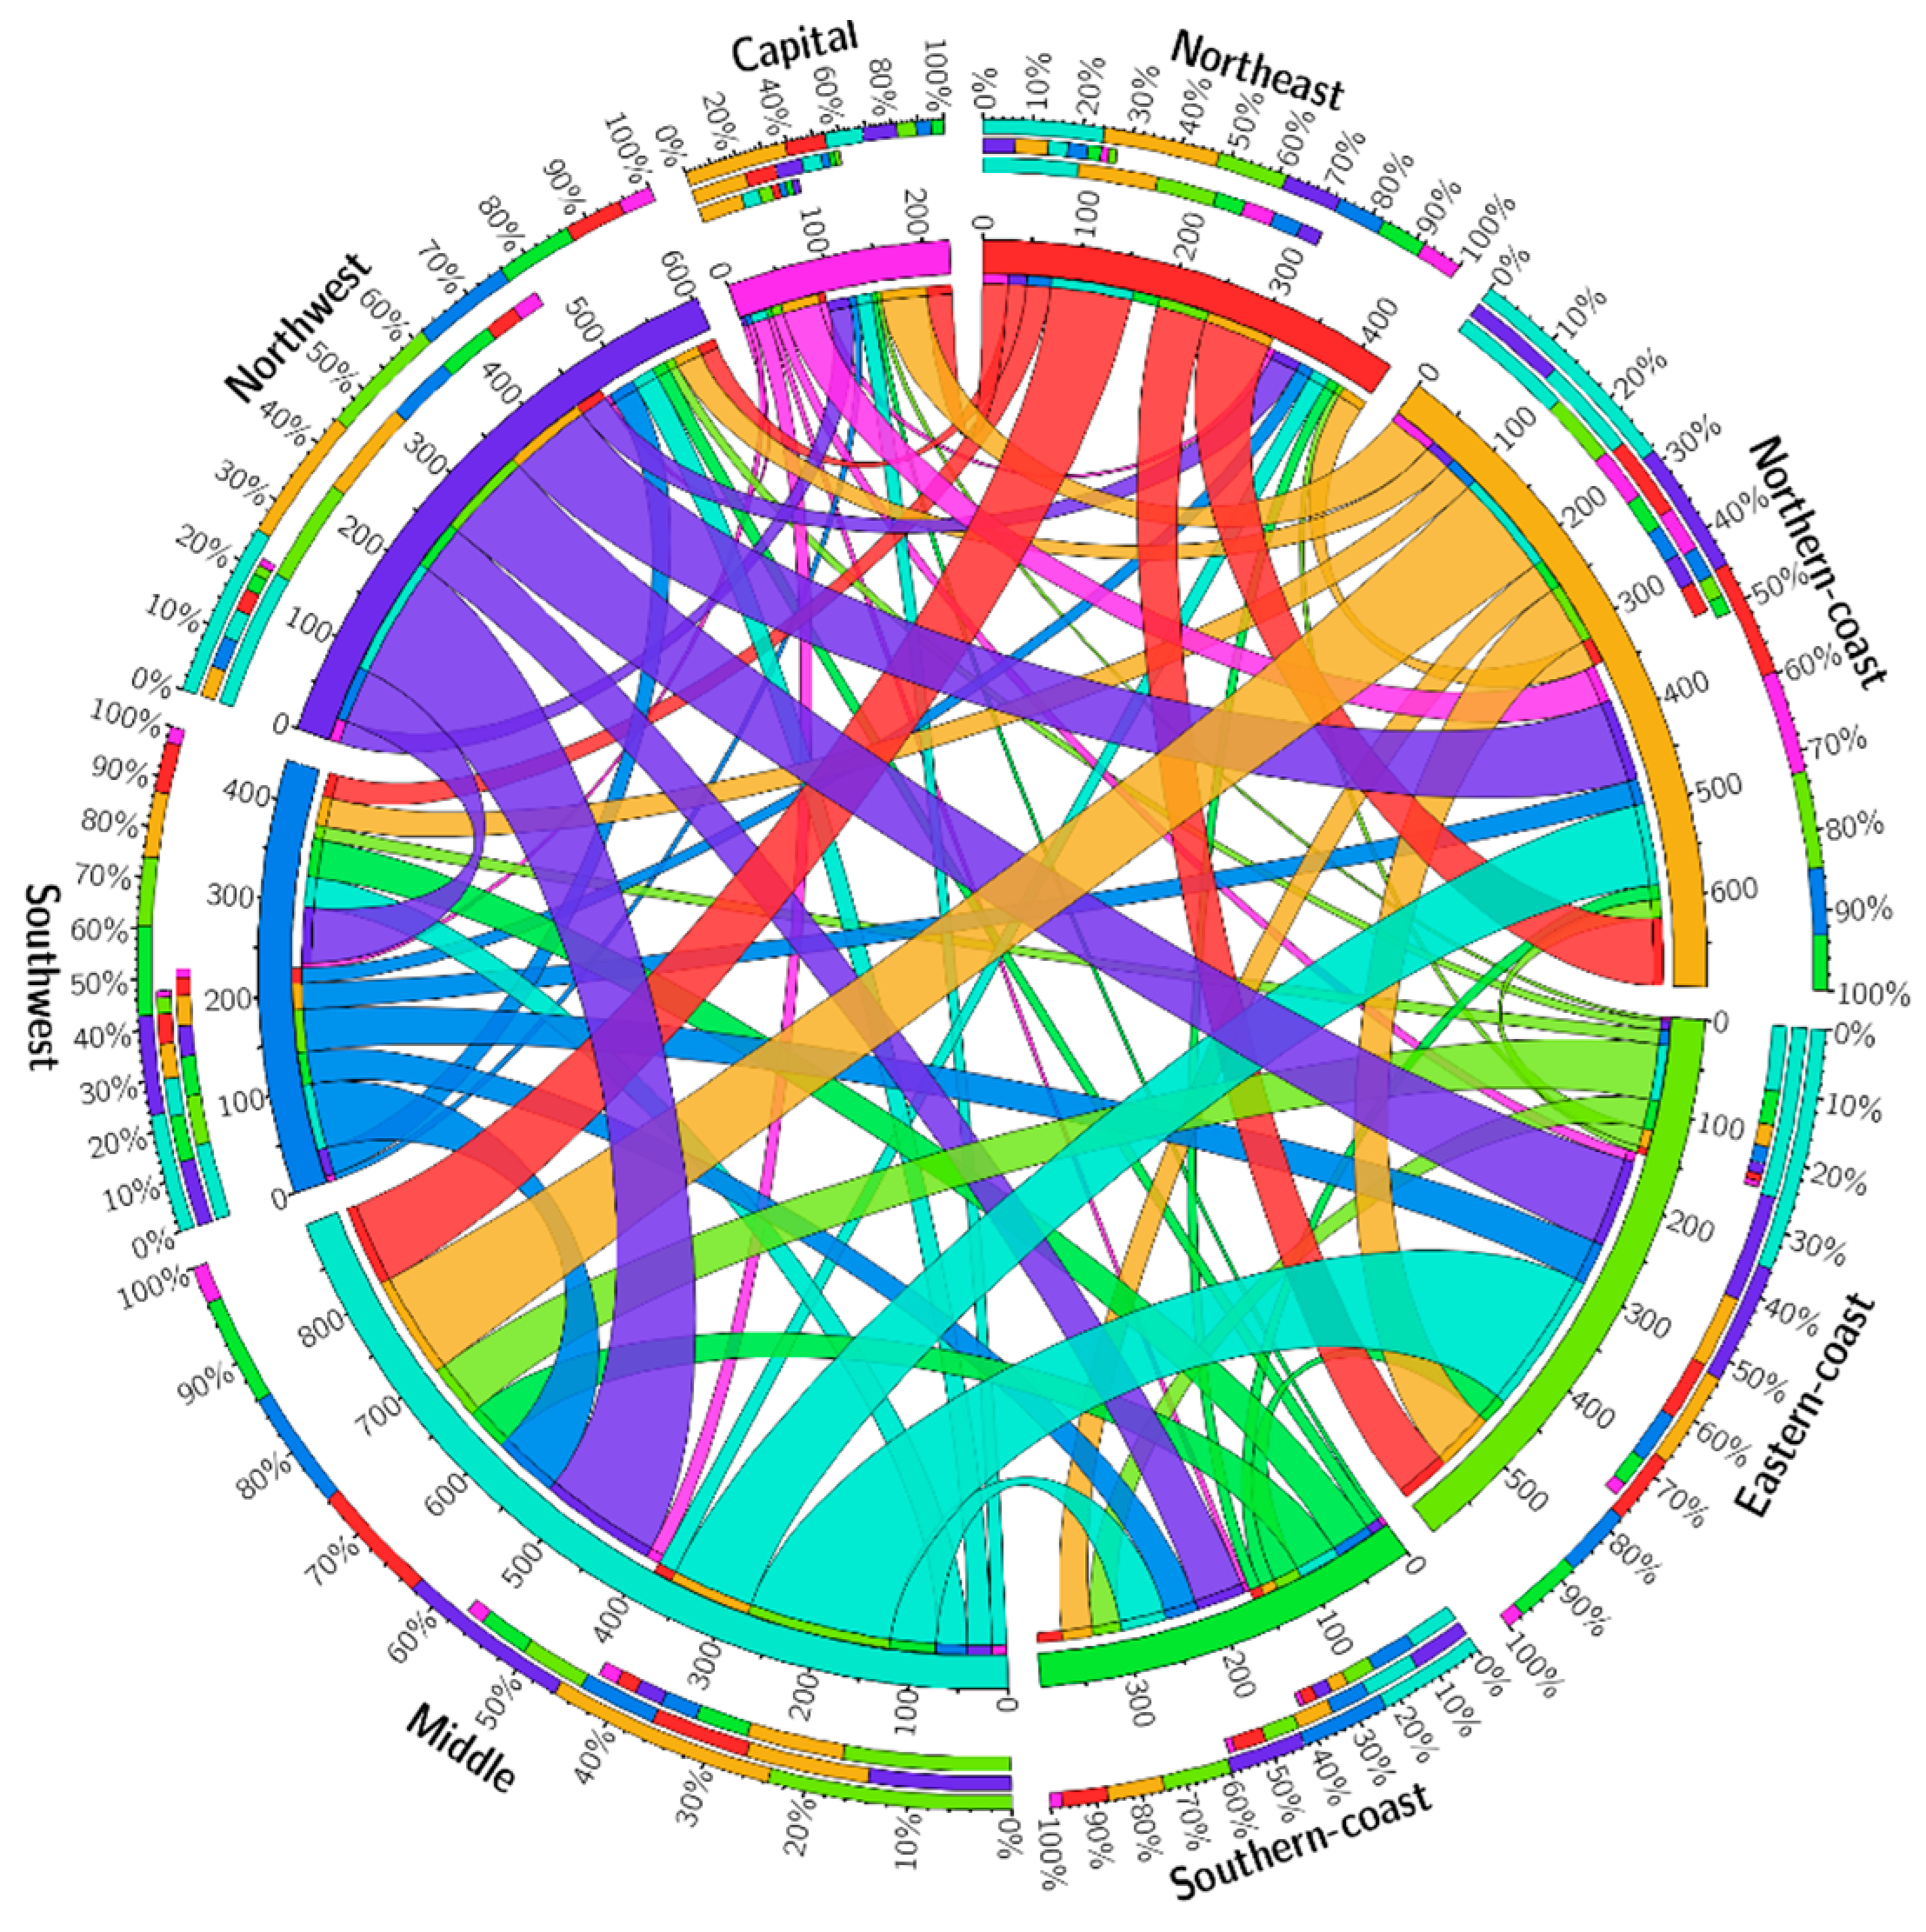
3.3. Embodied Carbon Flows
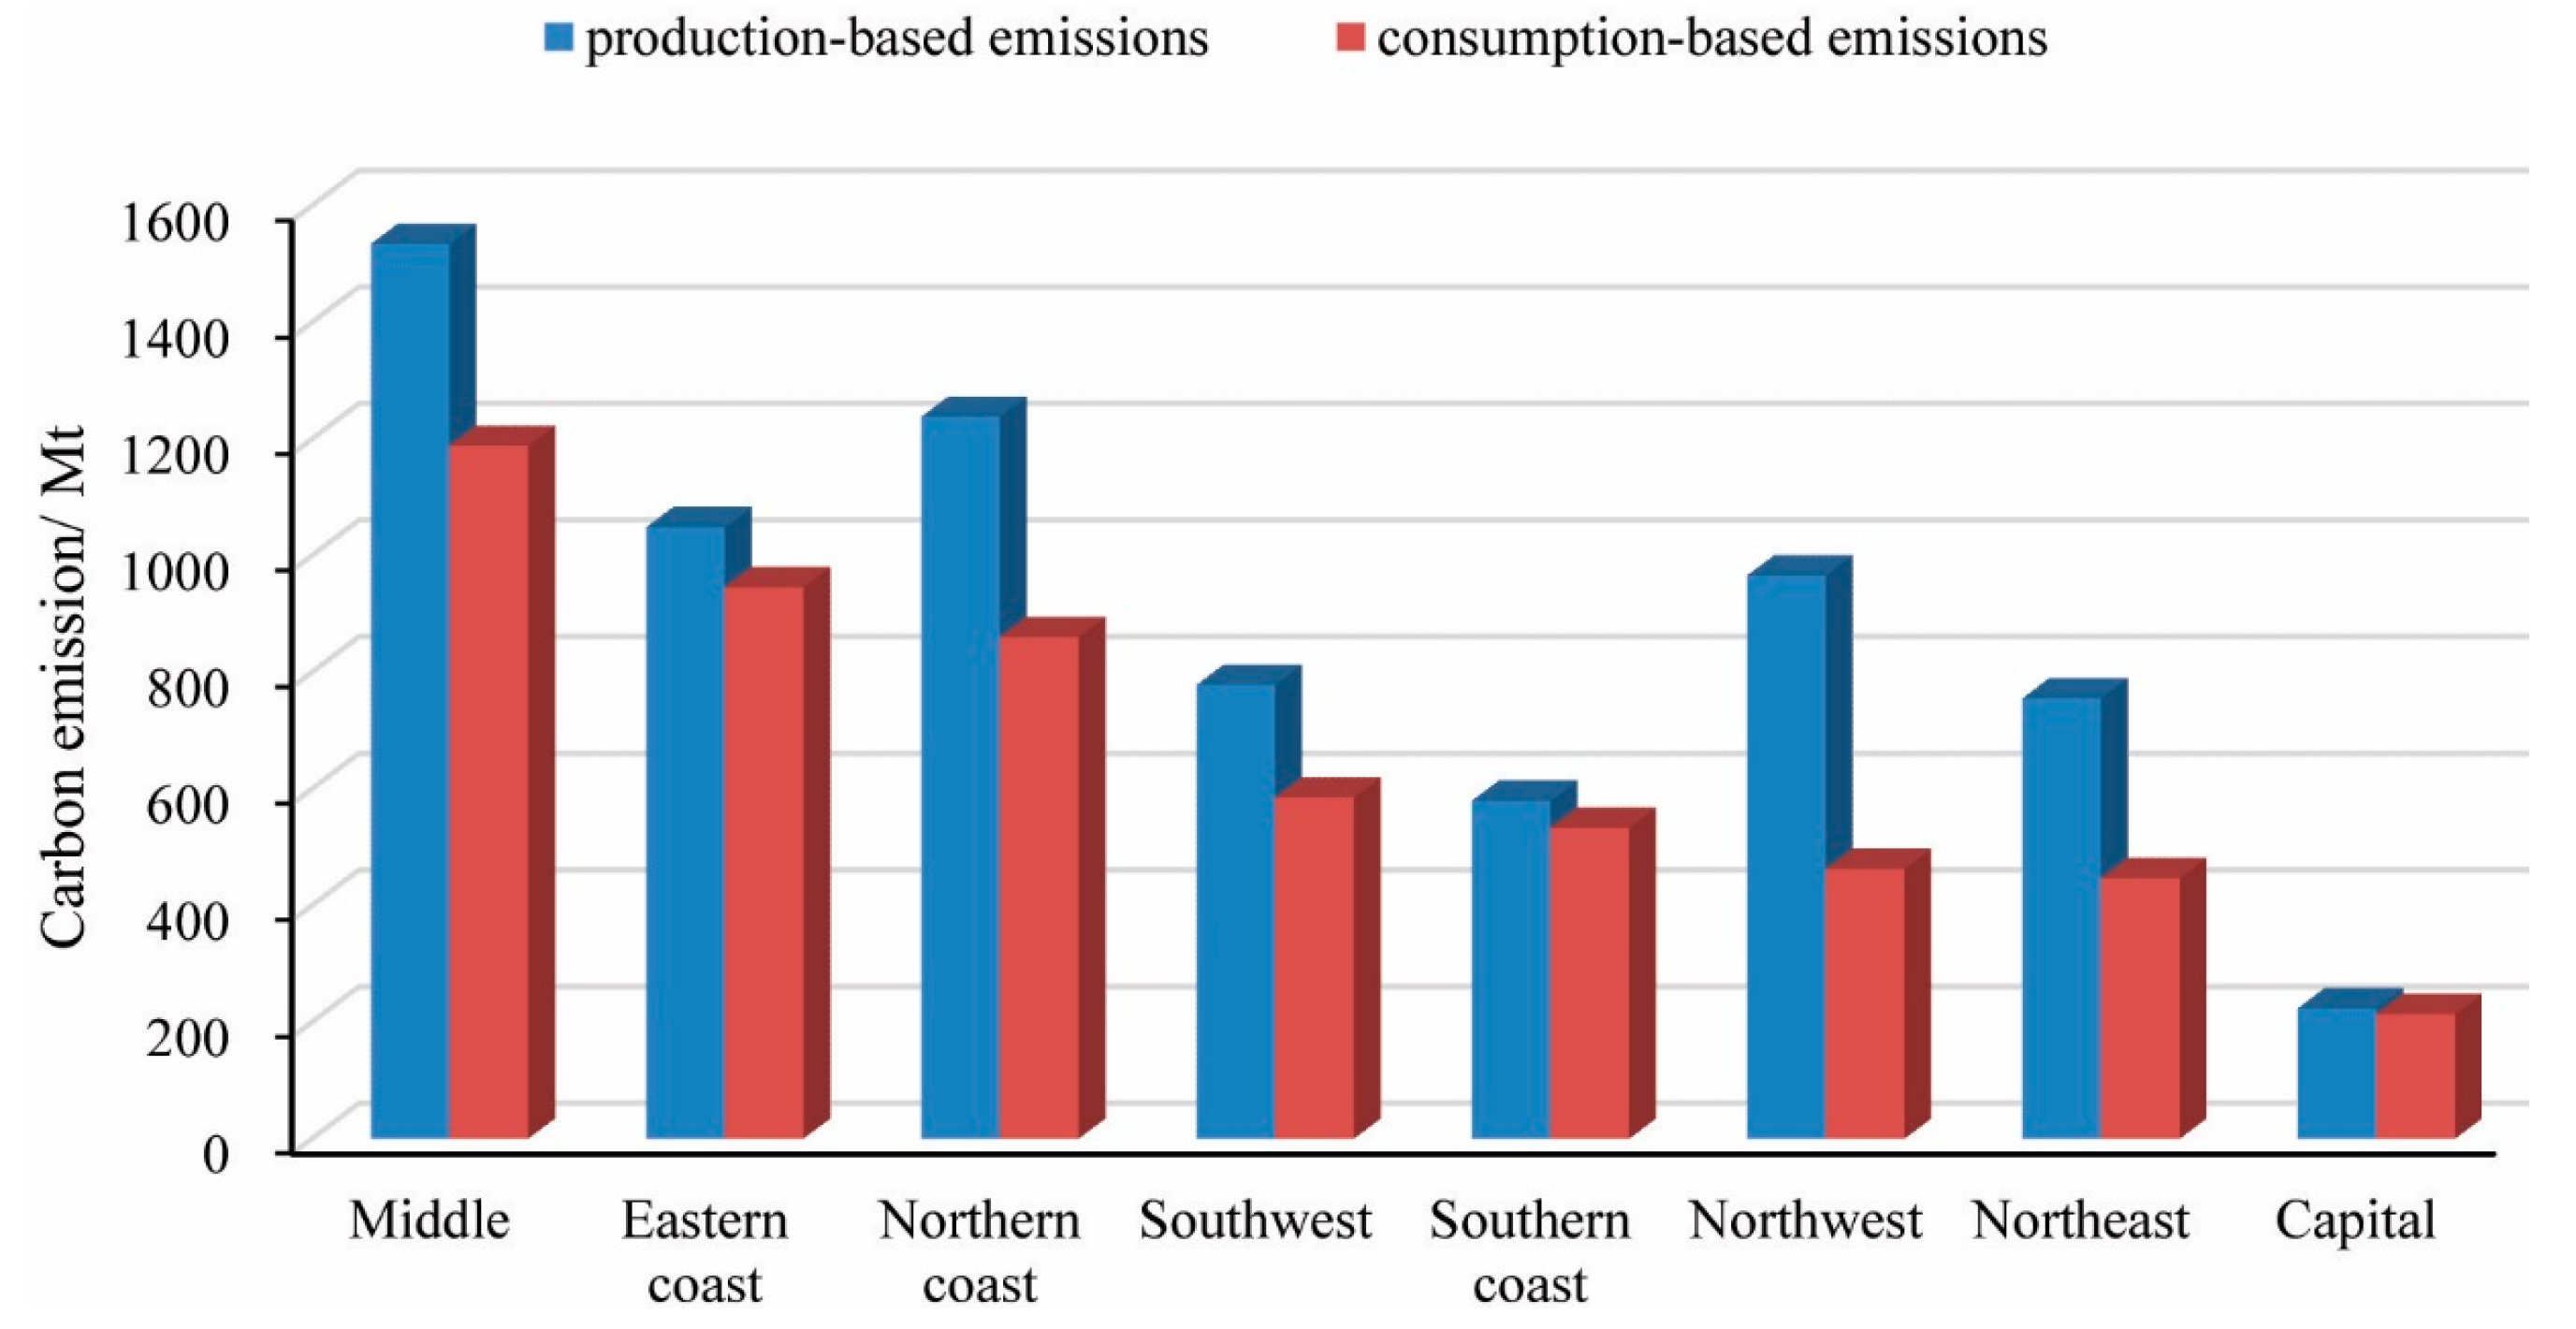
3.4. Production-Based Emissions vs. Consumption-Based Emissions
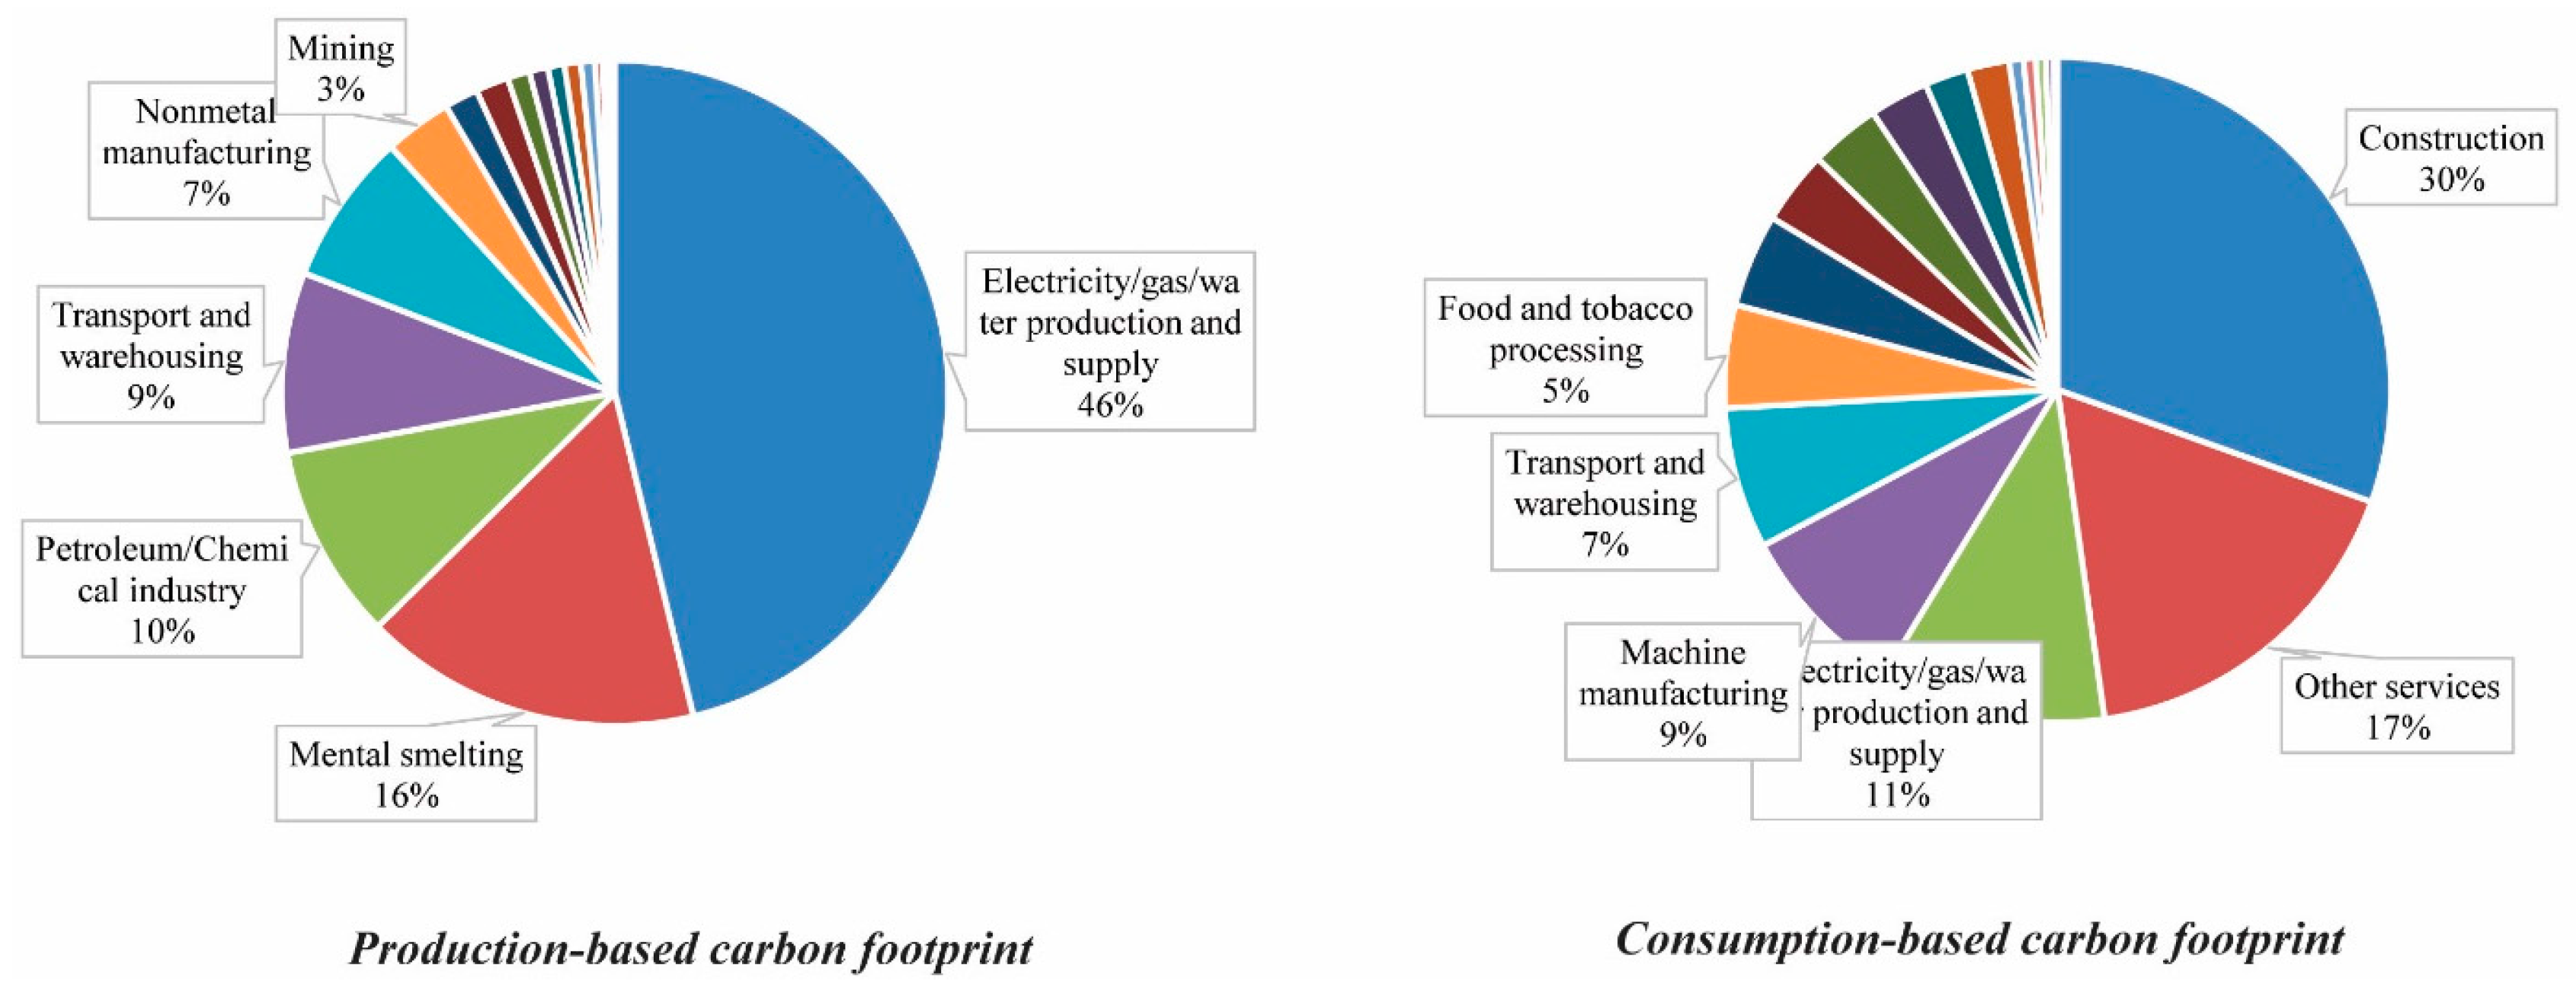
3.5. Policy Implication
4. Conclusions
Acknowledgments
Author Contributions
Conflicts of Interest
References
- Kenny, T.; Gray, N.F. Comparative performance of six carbon footprint models for use in Ireland. Environ. Impact Assess. Rev. 2009, 29, 1–6. [Google Scholar] [CrossRef]
- Dwyer, L.; Forsyth, P.; Spurr, R.; Hoque, S. Estimating the carbon footprint of Australian tourism. J. Sustain. Tour. 2010, 18, 355–376. [Google Scholar] [CrossRef]
- Piecyk, M.I.; Mckinnon, A.C. Forecasting the carbon footprint of road freight transport in 2020. Int. J. Prod. Econ. 2010, 128, 31–42. [Google Scholar] [CrossRef]
- Lee, K.H. Integrating carbon footprint into supply chain management: The case of Hyundai Motor Company (HMC) in the automobile industry. J. Clean. Prod. 2011, 19, 1216–1223. [Google Scholar] [CrossRef]
- Perry, S.; Klemes, J.; Bulatov, I. Integrating waste and renewable energy to reduce the carbon footprint of locally integrated energy sectors. Energy 2008, 33, 1489–1497. [Google Scholar] [CrossRef]
- Weber, C.L.; Matthews, H.S. Quantifying the global and distributional aspects of American household carbon footprint. Ecol. Econ. 2008, 66, 379–391. [Google Scholar] [CrossRef]
- Lam, H.L.; Varbanov, P.; Klemes, J. Minimising carbon footprint of regional biomass supply chains. Resour. Conserv. Recycl. 2010, 54, 303–309. [Google Scholar] [CrossRef]
- Druckman, A.; Jackson, T. The carbon footprint of UK households 1990–2004: A socio-economically disaggregated, quasi-multi-regional input-output model. Ecol. Econ. 2009, 68, 2066–2077. [Google Scholar] [CrossRef]
- Galli, A.; Wiedmann, T.; Ercin, E.; Knoblauch, D.; Ewing, B.; Giljum, S. Integrating Ecological, Carbon and Water footprint into a “Footprint Family” of indicators: Definition and role in tracking human pressure on the planet. Ecol. Indic. 2012, 316, 100–112. [Google Scholar] [CrossRef]
- International Energy Agency (IEA). CO2 Emissions from Fuel Combustion-highlights 2012. Available online: http://www.iea.org/publications/freepublications/publication/name.32870.en.html (accessed on 25 January 2015).
- Wang, C.; Lin, J.; Cai, W.; Zhang, Z. Policies and Practices of Low Carbon City Development in China. Energy Environ. 2013, 24, 1347–1372. [Google Scholar] [CrossRef]
- Wang, C.; Ye, M.; Cai, W.; Chen, J. The value of a clear, long-term climate policy agenda: A case study of China’s power sector using a multi-region optimization model. Appl. Energy 2014, 125, 276–288. [Google Scholar] [CrossRef]
- Yang, Y.; Cai, W.; Wang, C. Industrial CO2 intensity, indigenous innovation and R&D spillovers in China’s provinces. Appl. Energy 2014, 131, 117–127. [Google Scholar]
- Wang, C.; Lin, J.; Cai, W.; Liao, H. China’s Carbon Mitigation Strategies: Enough? Energy Policy 2014, 73, 47–56. [Google Scholar] [CrossRef]
- Wang, C.; Zhang, W.; Cai, W.; Xie, X. Employment impacts of CDM projects in China’s power sector. Energy Policy 2013, 51, 481–491. [Google Scholar] [CrossRef]
- Lin, B.Q.; Sun, C.W. Evaluating carbon dioxide emissions in international trade of China. Energy Policy 2010, 38, 613–621. [Google Scholar] [CrossRef]
- Liu, H.T.; Xi, Y.M.; Guo, J.E.; Li, X. Energy embodied in the international trade of China: An energy input-output analysis. Energy Policy 2010, 38, 3957–3964. [Google Scholar] [CrossRef]
- Shui, B.; Harriss, R.C. The role of CO2 embodiment in US-China trade. Energy Policy 2006, 34, 4063–4068. [Google Scholar] [CrossRef]
- Li, Y.; Hewitt, C.N. The effect of trade between China and the UK on national and global carbon dioxide emissions. Energy Policy 2008, 36, 1907–1914. [Google Scholar] [CrossRef]
- Liu, Z.; Geng, Y.; Lindner, S.; Zhao, H.; Fujita, T.; Guan, D. Embodied energy use in China’s industrial sectors. Energy Policy 2012, 49, 751–758. [Google Scholar] [CrossRef]
- Zhu, Q.; Peng, X.Z.; Wu, K.Y. Calculation and decomposition of indirect carbon emissions from residential consumption in China based on the input-output model. Energy Policy 2012, 48, 618–626. [Google Scholar] [CrossRef]
- Chen, G.Q.; Guo, S.; Shao, L.; Li, J.S.; Chen, Z.M. Three-scale input-output modeling for urban economy Carbon emission by Beijing 2007. Commun. Nonlinear Sci. Numer. Simul. 2013, 18, 2493–2506. [Google Scholar] [CrossRef]
- Virtanen, Y.; Kurppa, S.; Saarinen, M.; Katajajuuria, J.; Usvaa, K.; Mäenpääb, I.; Mäkeläc, J.; Grönroosd, J.; Nissinend, A. Carbon footprint of food-approaches from national input-output statistics and a LCA of a food portion. J. Clean. Prod. 2011, 19, 1849–1856. [Google Scholar] [CrossRef]
- Flysjo, A.; Cederberg, C.; Henriksson, M.; Ledgard, S. How does co-product handling affect the carbon footprint of milk? Case study of milk production in New Zealand and Sweden. Int. J. Life Cycle Assess. 2011, 16, 420–430. [Google Scholar] [CrossRef]
- Collins, F. Inclusion of carbonation during the life cycle of built and recycled concrete: Influence on their carbon footprint. Int. J. Life Cycle Assess. 2010, 15, 549–556. [Google Scholar] [CrossRef]
- Weber, C.L.; Clavin, C. Life Cycle Carbon Footprint of Shale Gas: Review of Evidence and Implications. Environ. Sci. Technol. 2012, 44, 5688–5695. [Google Scholar] [CrossRef] [PubMed]
- Filimonau, V.; Dickinson, J.; Robbins, D.; Huijbregts, M.A. Reviewing the carbon footprint analysis of hotels: Life Cycle Energy Analysis (LCEA) as a holistic method for carbon impact appraisal of tourist accommodation. J. Clean. Prod. 2011, 19, 1917–1930. [Google Scholar] [CrossRef]
- Trappey, A.; Trappey, C.V.; Hsiao, C.T.; Ou, J.J.; Chang, C.T. System dynamics modelling of product carbon footprint life cycles for collaborative green supply chains. Int. J. Comput. Integr. Manuf. 2012, 25, 934–945. [Google Scholar] [CrossRef]
- Strohbach, M.W.; Arnold, E.; Haase, D. The carbon footprint of urban green space—A life cycle approach. Landsc. Urban Plan. 2012, 105, 220–229. [Google Scholar] [CrossRef]
- Majeau-Bettez, G.; Stromman, A.H.; Hertwich, E.G. Evaluation of Process- and Input-Output-based Life Cycle Inventory Data with Regard to Truncation and Aggregation Issues. Environ. Sci. Technol. 2011, 45, 10170–10177. [Google Scholar] [CrossRef] [PubMed]
- Leontief, W.W. The Structure of American Economy, 1919–1939: An Empirical Application of Equilibrium Analysis; Oxford University Press: Oxford, UK, 1951. [Google Scholar]
- Munksgaard, J.; Wier, M.; Lenzen, M.; Dey, C. Using input-output analysis to measure the environmental pressure of consumption at different spatial levels. J. Ind. Ecol. 2005, 9, 169–185. [Google Scholar] [CrossRef]
- Wiedmann, T.; Wood, R.; Minx, J.C.; Lenzen, M.; Guan, D.; Harris, R. A carbon footprint time series of the UK—Results from a multi-region input-output model. Econ. Syst. Res. 2010, 22, 19–42. [Google Scholar] [CrossRef]
- Andrew, R.; Peters, G.P.; Lennox, J. Approximation and regional aggregation in multi-regional input-output analysis for national carbon footprint accounting. Econ. Syst. Res. 2009, 21, 311–335. [Google Scholar] [CrossRef]
- Hertwich, E.G.; Peters, G.P. Carbon Footprint of Nations: A Global, Trade-Linked Analysis. Environ. Sci. Technol. 2009, 43, 6414–6420. [Google Scholar] [CrossRef] [PubMed]
- Wiedmann, T. Carbon footprint and input-output analysis—An introduction. Econ. Syst. Res. 2009, 21, 175–186. [Google Scholar] [CrossRef]
- Chen, Z.M.; Chen, G.Q. Embodied carbon dioxide emission at supra-national scale: A coalition analysis for G7, BRIC, and the rest of the world. Energy Policy 2011, 39, 2899–2909. [Google Scholar] [CrossRef]
- Machado, G.; Schaeffer, R.; Worrell, E. Energy and carbon embodied in the international trade of Brazil: an input-output approach. Ecol. Econ. 2001, 39, 409–424. [Google Scholar] [CrossRef]
- Lenzen, M.; Wood, R.; Wiedmann, T. Uncertainty analysis for multi-region input-output models—A case study of the UK’s carbon footprint. Econ. Syst. Res. 2010, 22, 43–63. [Google Scholar] [CrossRef]
- Feng, K.S.; Siu, Y.L.; Guan, D.B.; Hubacek, K. Assessing regional virtual water flows and water footprints in the Yellow River Basin, China: A consumption based approach. Appl. Geogr. 2012, 32, 691–701. [Google Scholar] [CrossRef]
- Jiang, Y.; Cai, W.; Wan, L.; Wang, C. An index decomposition analysis of China’s interregional embodied carbon flows. J. Clean. Prod. 2015, 88, 289–296. [Google Scholar] [CrossRef]
- Jiang, Y.; Cai, W.; Du, P.; Pan, W.; Wang, C. Virtual water in interprovincial trade with implications for China’s water policy. J. Clean. Prod. 2015, 87, 655–665. [Google Scholar] [CrossRef]
- Zhang, Y. 2007 China Regional Input-Output Tables; China Statistics Press: Beijing, China, 2012.
- IPCC. IPCC Guidelines for National Greenhouse Gas Inventories; Tokyo IGES: Tokyo, Japan, 2006. [Google Scholar]
- National Bureau of Statistics. China Energy Statistical Yearbook 2008; China Statistics Press: Beijing, China, 2008.
- Leading Group Office of the Second National Economic Census of the State Council. China Economic Census Yearbook 2008 (Energy); China Statistics Press: Beijing, China, 2010.
- Ren, J.; Manzardo, A.; Toniolo, S.; Scipioni, A.; Tan, S.; Dong, L.; Gao, S. Design and modeling of sustainable bioethanol supply chain by minimizing the total ecological footprint in life cycle perspective. Bioresour. Technol. 2013, 146, 771–774. [Google Scholar] [CrossRef] [PubMed]
- Ren, J.; Manzardo, A.; Toniolo, S.; Scipioni, A. Sustainability of hydrogen supply chain. Part I: Identification of critical criteria and cause–effect analysis for enhancing the sustainability using DEMATEL. Int. J. Hydrogen Energy 2013, 38, 14159–14171. [Google Scholar] [CrossRef]
- Lee, W.S.; Huang, A.Y.H.; Chang, Y.Y.; Cheng, C.M. Analysis of decision making factors for equity investment by DEMATEL and Analytic Network Process. Expert Syst. Appl. 2011, 38, 8375–8383. [Google Scholar] [CrossRef]
- Lee, Y.C.; Li, M.L.; Yen, T.M.; Huang, T.H. Analysis of adopting an integrated decision making trial and evaluation laboratory on a technology acceptance model. Expert Syst. Appl. 2010, 37, 1745–1754. [Google Scholar] [CrossRef]
© 2015 by the authors; licensee MDPI, Basel, Switzerland. This article is an open access article distributed under the terms and conditions of the Creative Commons Attribution license (http://creativecommons.org/licenses/by/4.0/).
Share and Cite
Xie, X.; Cai, W.; Jiang, Y.; Zeng, W. Carbon Footprints and Embodied Carbon Flows Analysis for China’s Eight Regions: A New Perspective for Mitigation Solutions. Sustainability 2015, 7, 10098-10114. https://doi.org/10.3390/su70810098
Xie X, Cai W, Jiang Y, Zeng W. Carbon Footprints and Embodied Carbon Flows Analysis for China’s Eight Regions: A New Perspective for Mitigation Solutions. Sustainability. 2015; 7(8):10098-10114. https://doi.org/10.3390/su70810098
Chicago/Turabian StyleXie, Xi, Wenjia Cai, Yongkai Jiang, and Weihua Zeng. 2015. "Carbon Footprints and Embodied Carbon Flows Analysis for China’s Eight Regions: A New Perspective for Mitigation Solutions" Sustainability 7, no. 8: 10098-10114. https://doi.org/10.3390/su70810098
APA StyleXie, X., Cai, W., Jiang, Y., & Zeng, W. (2015). Carbon Footprints and Embodied Carbon Flows Analysis for China’s Eight Regions: A New Perspective for Mitigation Solutions. Sustainability, 7(8), 10098-10114. https://doi.org/10.3390/su70810098


