
Development of a Framework for Sustainable Outsourcing: Analytic Balanced Scorecard Method (A-BSC)


Abstract
:1. Introduction
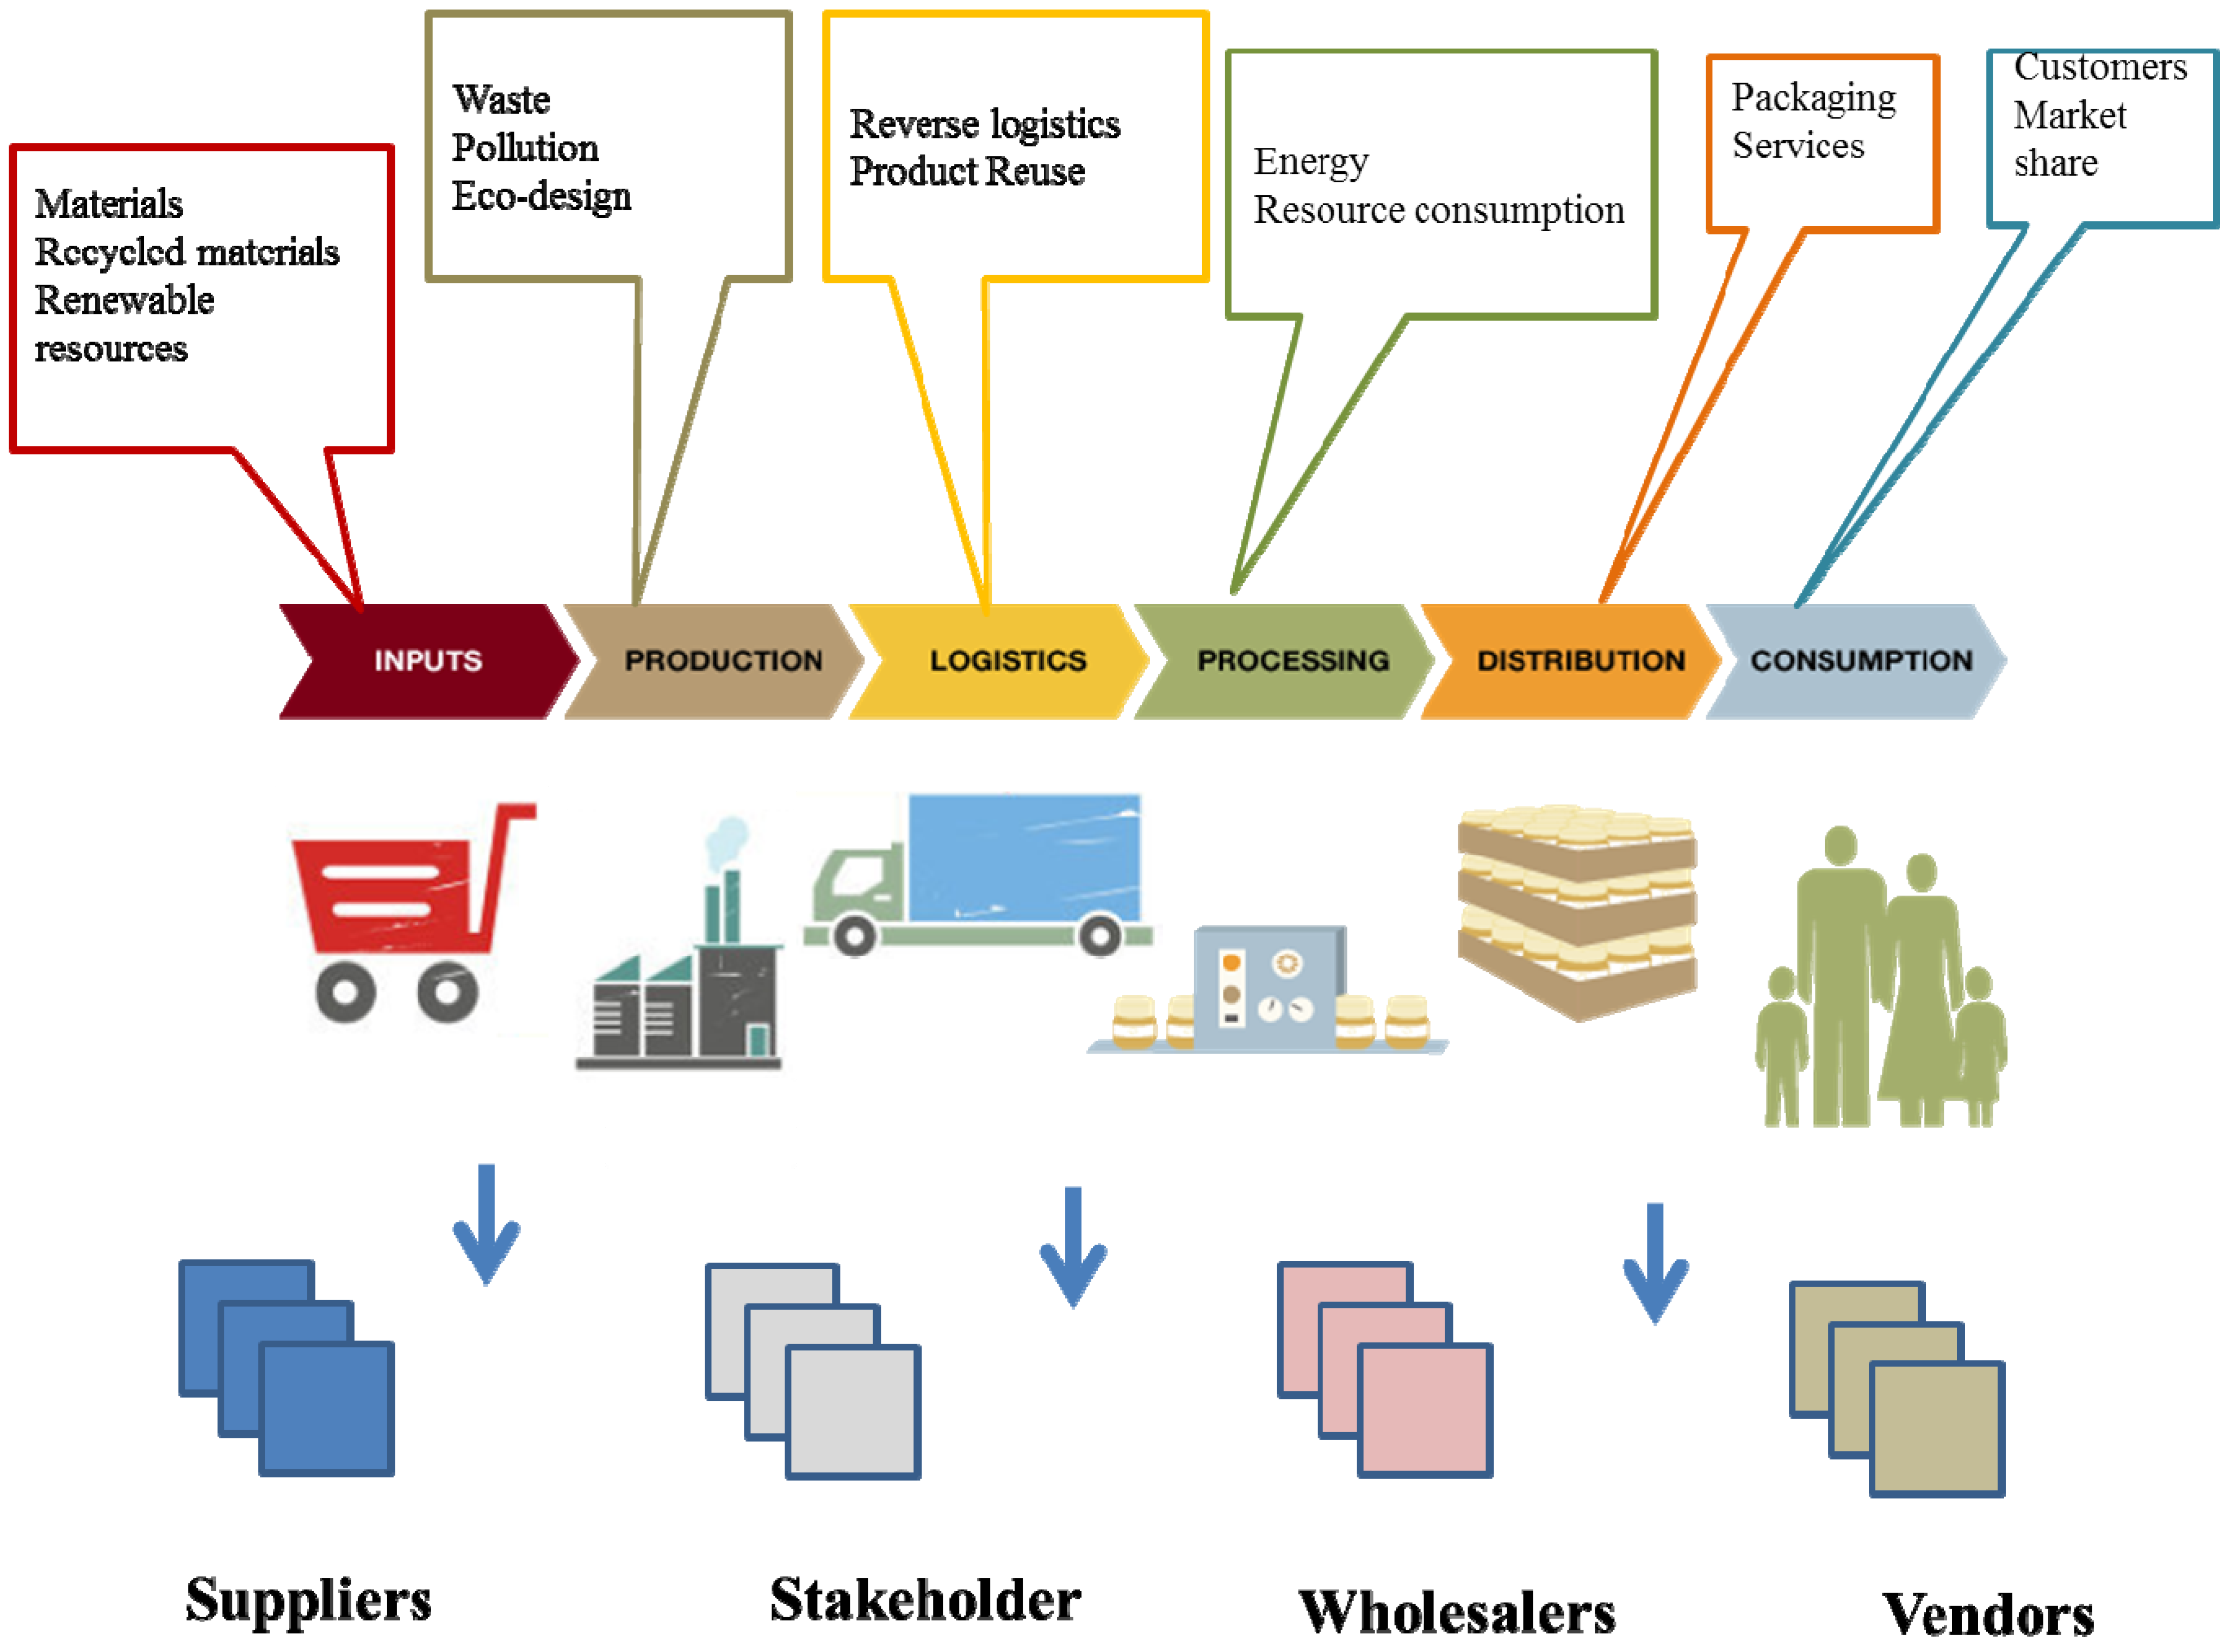
2. Background: Efficiency Metrics of Outsourcing and Supply Chain
3. The Rationale: Analytic Balanced Scorecard Model (A-BSC)
- (1)
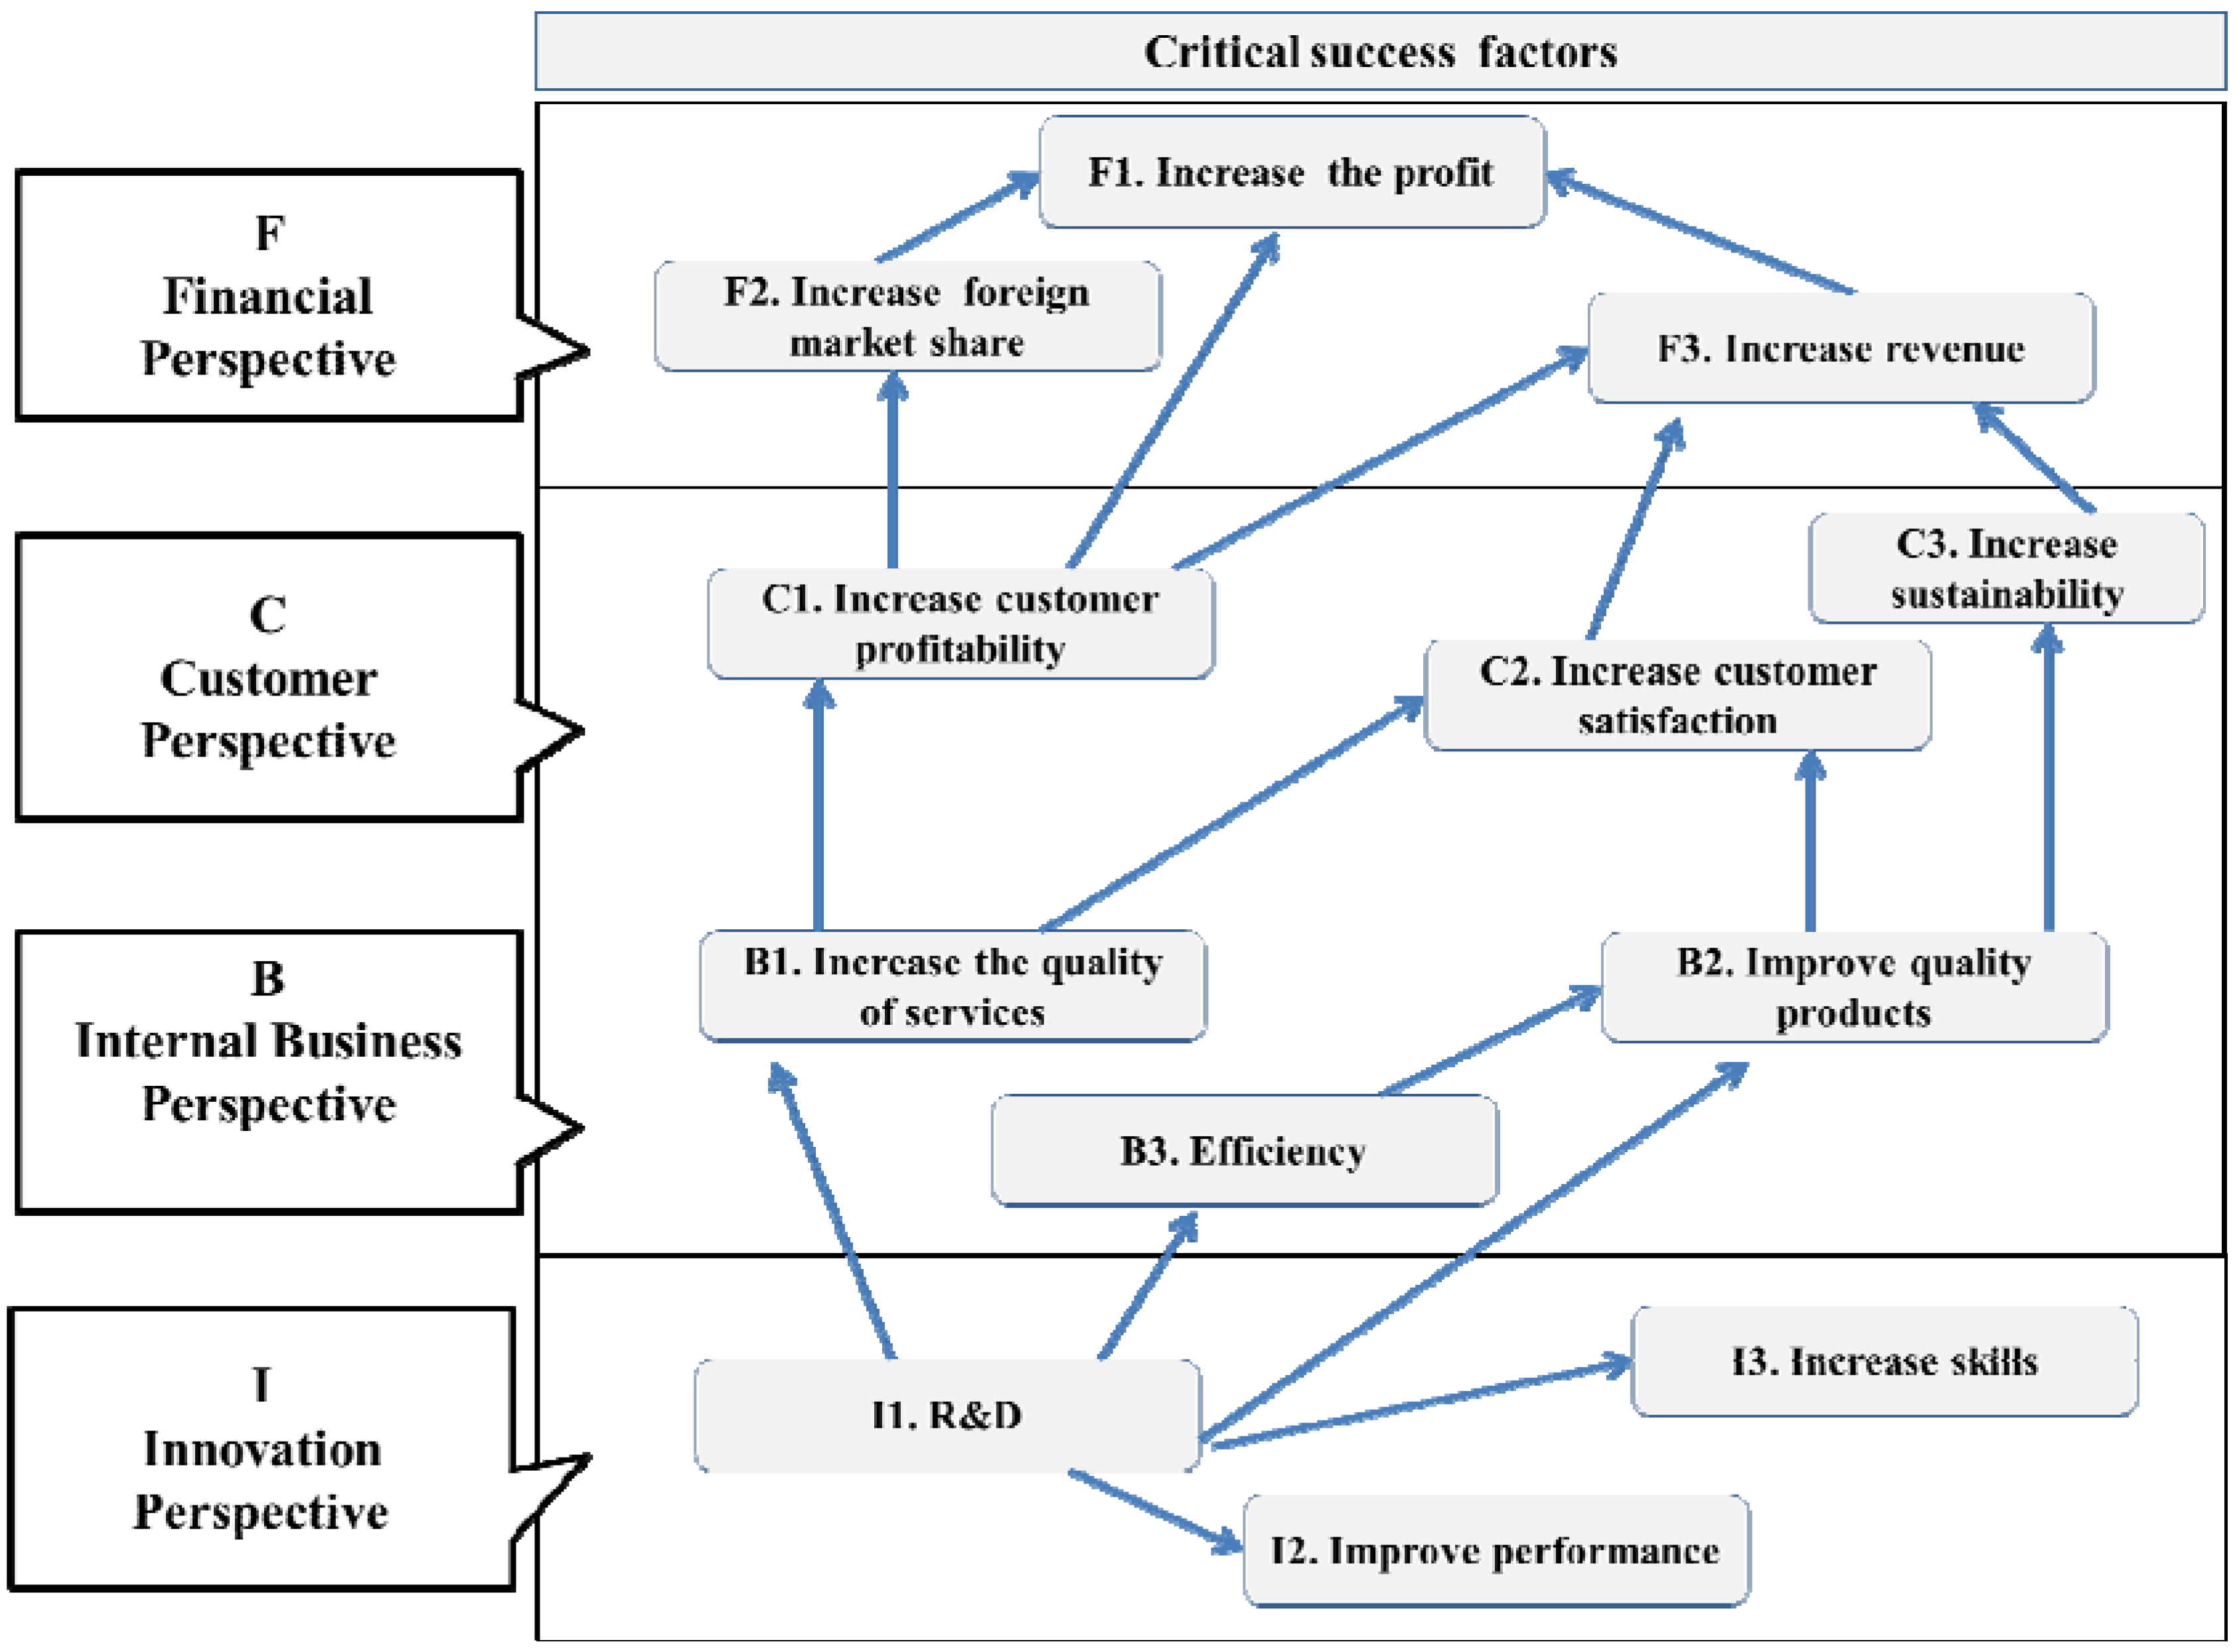
- Financial perspective indicates whether a company’s strategy, implementation and execution are contributing to bottom-line improvement. The measurement criteria are usually profit, cash flow, ROI, return on invested capital, and economic value added.
- (2)
- Customer perspective provides a way for managers to identify the customer and market segments in which the business unit will compete and the measures of the business unit’s performance. To meet the organizational objectives and customers’ expectations, organizations must identify the key business processes at which they must excel.
- (3)
- Internal business perspective aims to satisfy shareholders and customers by excelling at some business process.
- (4)
- Innovation perspective identifies the infrastructure that the organization must build to create long-term improvement (i.e., employee satisfaction, continuity, training and skills, etc.).
- (1)
- Pairwise comparison and relative weight estimation. Pairwise comparisons of the elements in each level are conducted with respect to their relative importance towards their control criterion. Saaty suggested a scale of 1–9 when comparing two components. For example, number 9 represents extreme importance over another element. And number 8 represents it is between “very important” and “extremely important” over another element. For a general AHP application, we can consider that A1, A2, …, Am denote the set of elements, while aij represents a quantified judgment on a pair of Ai, Aj. Through the nine-value scale for pairwise comparisons; this yields an (m × m) matrix A as follows:
where aij > 0 (i, j = 1, 2,..,,m), aii = 1 (i = 1, 2,…,m), and aij = 1/aji ( 1, 2, …, m). A is a positive reciprocal matrix. The result of the comparison is the so-called dominance coefficient aij that represents the relative importance of the component on row (i) over the component on column (j), i.e., aij = wi/wj. The pairwise comparisons can be represented in the form of a matrix. A score of 1 represents equal importance of two components and 9 represents extreme importance of the component i over the component j. In matrix A, the problem becomes one of assigning to the m elements A1, A2, …, Am a set of numerical weights w1, w2, …, wm that reflects the recorded judgments. If A is a consistency matrix, the relations between weights wi, wj and judgments aij are simply given by aij = wi / wj (for i,j = 1, 2, …, m) andA1 A2 Am A1 1 a12 a1m A = aij = A2 1/a12 1 a2m Am 1/a1m 1/a2m 1
If matrix w is a non-zero vector, there is a λmax of Aw = λmaxw, which is the largest eigenvalue of matrix A. If matrix A is perfectly consistent, then λmaxw = m. But given that aij denotes the subjective judgment of decision-makers, who give comparison and appraisal, with the actual value (wi/wj) having a certain degree of variation. Therefore, Ax = λmaxw cannot be set up. So the judgment matrix of the traditional AHP always needs to be revised for its consistency.w1/w1 w1/w2 w1/wm A1 w2/w1 w2/w2 w2/wm A = A2 Am wm/w1 wm/w2 wm/wm - (2)
- Priority vector: After all pairwise comparison is completed, the priority weight vector (w) is computed as the unique solution of Aw = λmaxw, where λmax is the largest eigenvalue of matrix A.
- (3)
- Consistency index estimation: Saaty [48] proposed utilizing consistency index (CI) to verify the consistency of the comparison matrix. The consistency index (CI) of the derived weights could then be calculated by: CI = (λmax − n)/ n − 1. In general, if CI is less than 0.10, satisfaction of judgments may be derived.
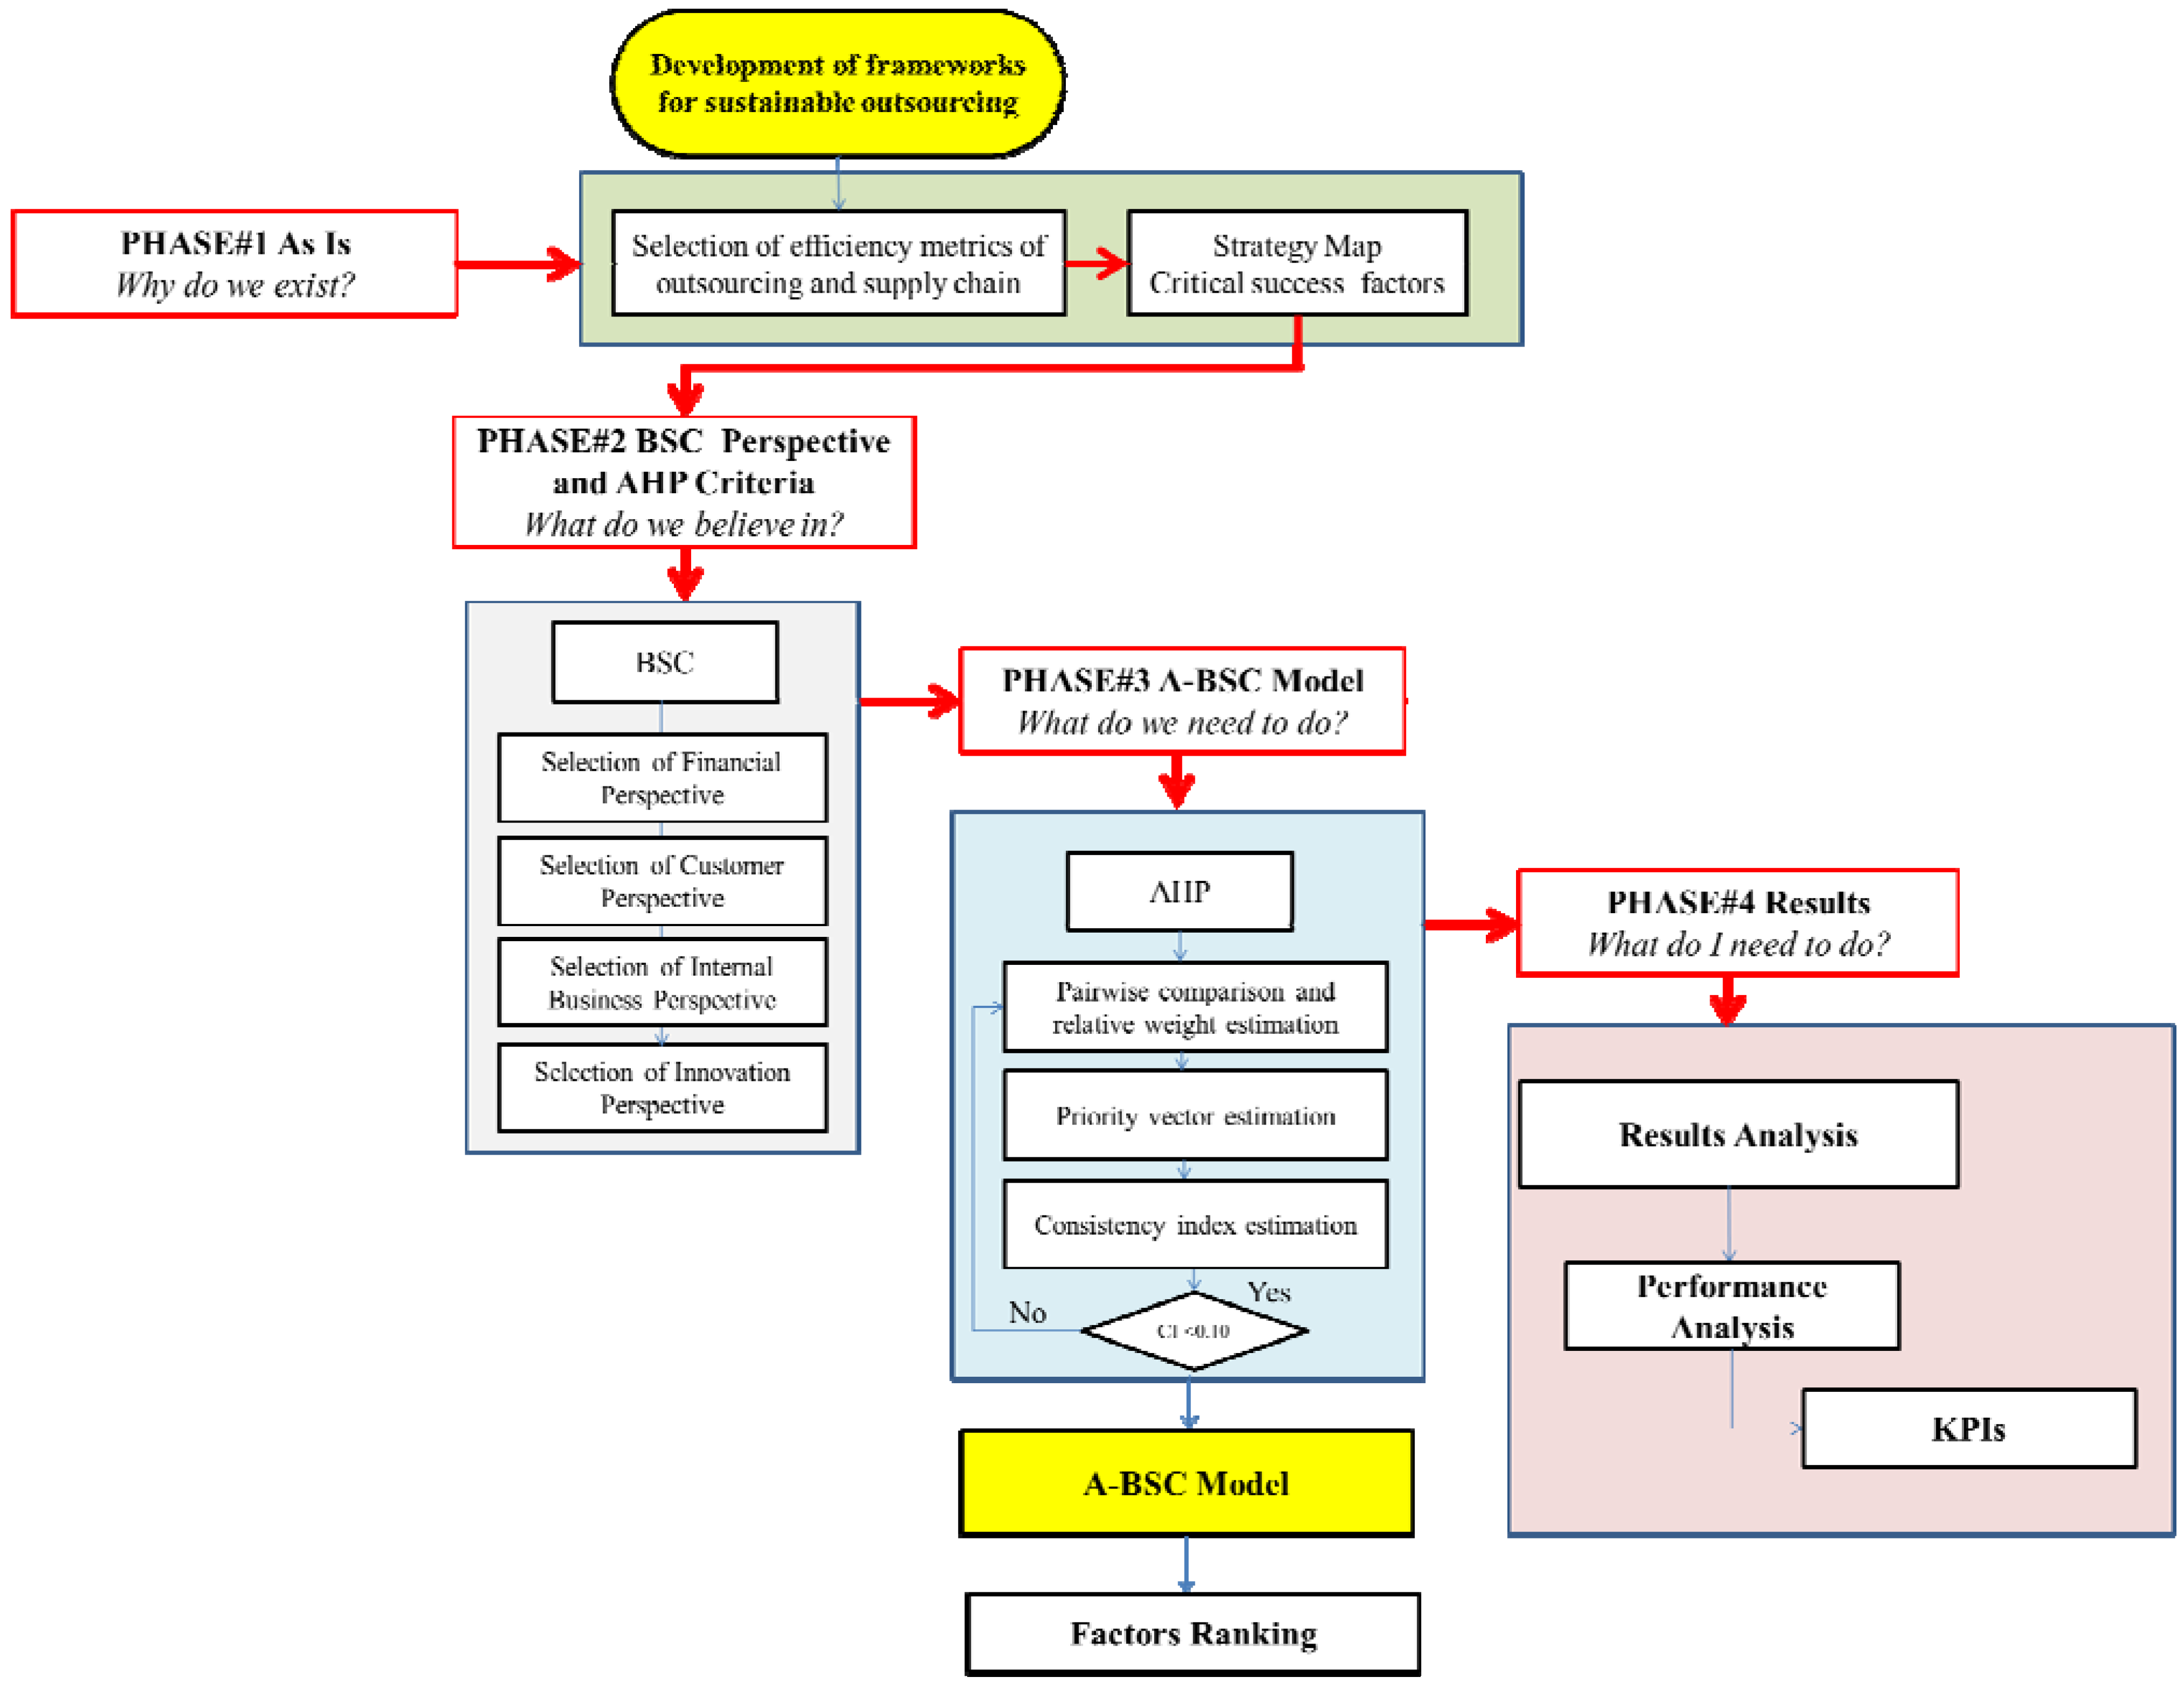
- Phase #1—As Is Analysis.
- Phase #2—BSC Perspective and AHP Criteria.
- Phase #3—A-BSC Model.
- Phase #4—Results Analysis.

4. Case Study
4.1. Phase#1: As Is Analysis
4.2. Phase#2: BSC Perspective and AHP Criteria

| Perspective | Critical success factors | Metrics | Code |
|---|---|---|---|
| F
Financial Perspective | F1 Increase in market share | Revenues | F1.1 |
| Market Share | F1.2 | ||
| Delivery reliability | F1.3 | ||
| F2 Increase in profitability | EBITDA | F2.1 | |
| EBIT | F2.2 | ||
| F3 Increase revenue | ROI | F3.1 | |
| ROE | F3.2 | ||
| Net Cash Flow | F3.3 | ||
| Supplier cost saving initiatives | F3.4 | ||
| Supply chain cash-to-cash cycle time (The average number of days between paying for raw materials and getting paid for product for the trading partners. calculated by inventory days of supply plus days of sales outstanding minus average payment period for material) | F3.5 | ||
| C Customer perspective | C1 Increase customer profitability | Cost of goods sold | C1.1 |
| C2 Increase customer satisfaction | Customer perception of product value | C2.1 | |
| Customer order response time | C2.2 | ||
| Supply chain response time | C2.3 | ||
| C3 Increase sustainability | Green product design | C3.1 | |
| Green manufacturing process | C3.2 | ||
| B Business process perspective | B1 Increase the quality of services | Lead time from defect detection to correction | B1.1 |
| Purchased Supplier lead time against industry norms | B1.2 | ||
| B2 Improve quality products | Average setup time | B2.1 | |
| Total supply chain cycle time | B2.2 | ||
| B3 Efficiency | Efficiency of purchase order cycle time | B3.1 | |
| The use of energy and materials | B3.2 | ||
| I Innovation Perspective | I1 R&D | Accuracy of forecasting techniques | I1.1 |
| I2 Improve performance | Capacity utilization | I2.1 | |
| Supplier cost saving initiatives | I2.2 | ||
| I3 Increase skills | Supplier ability to respond to quality problems | I3.1 |
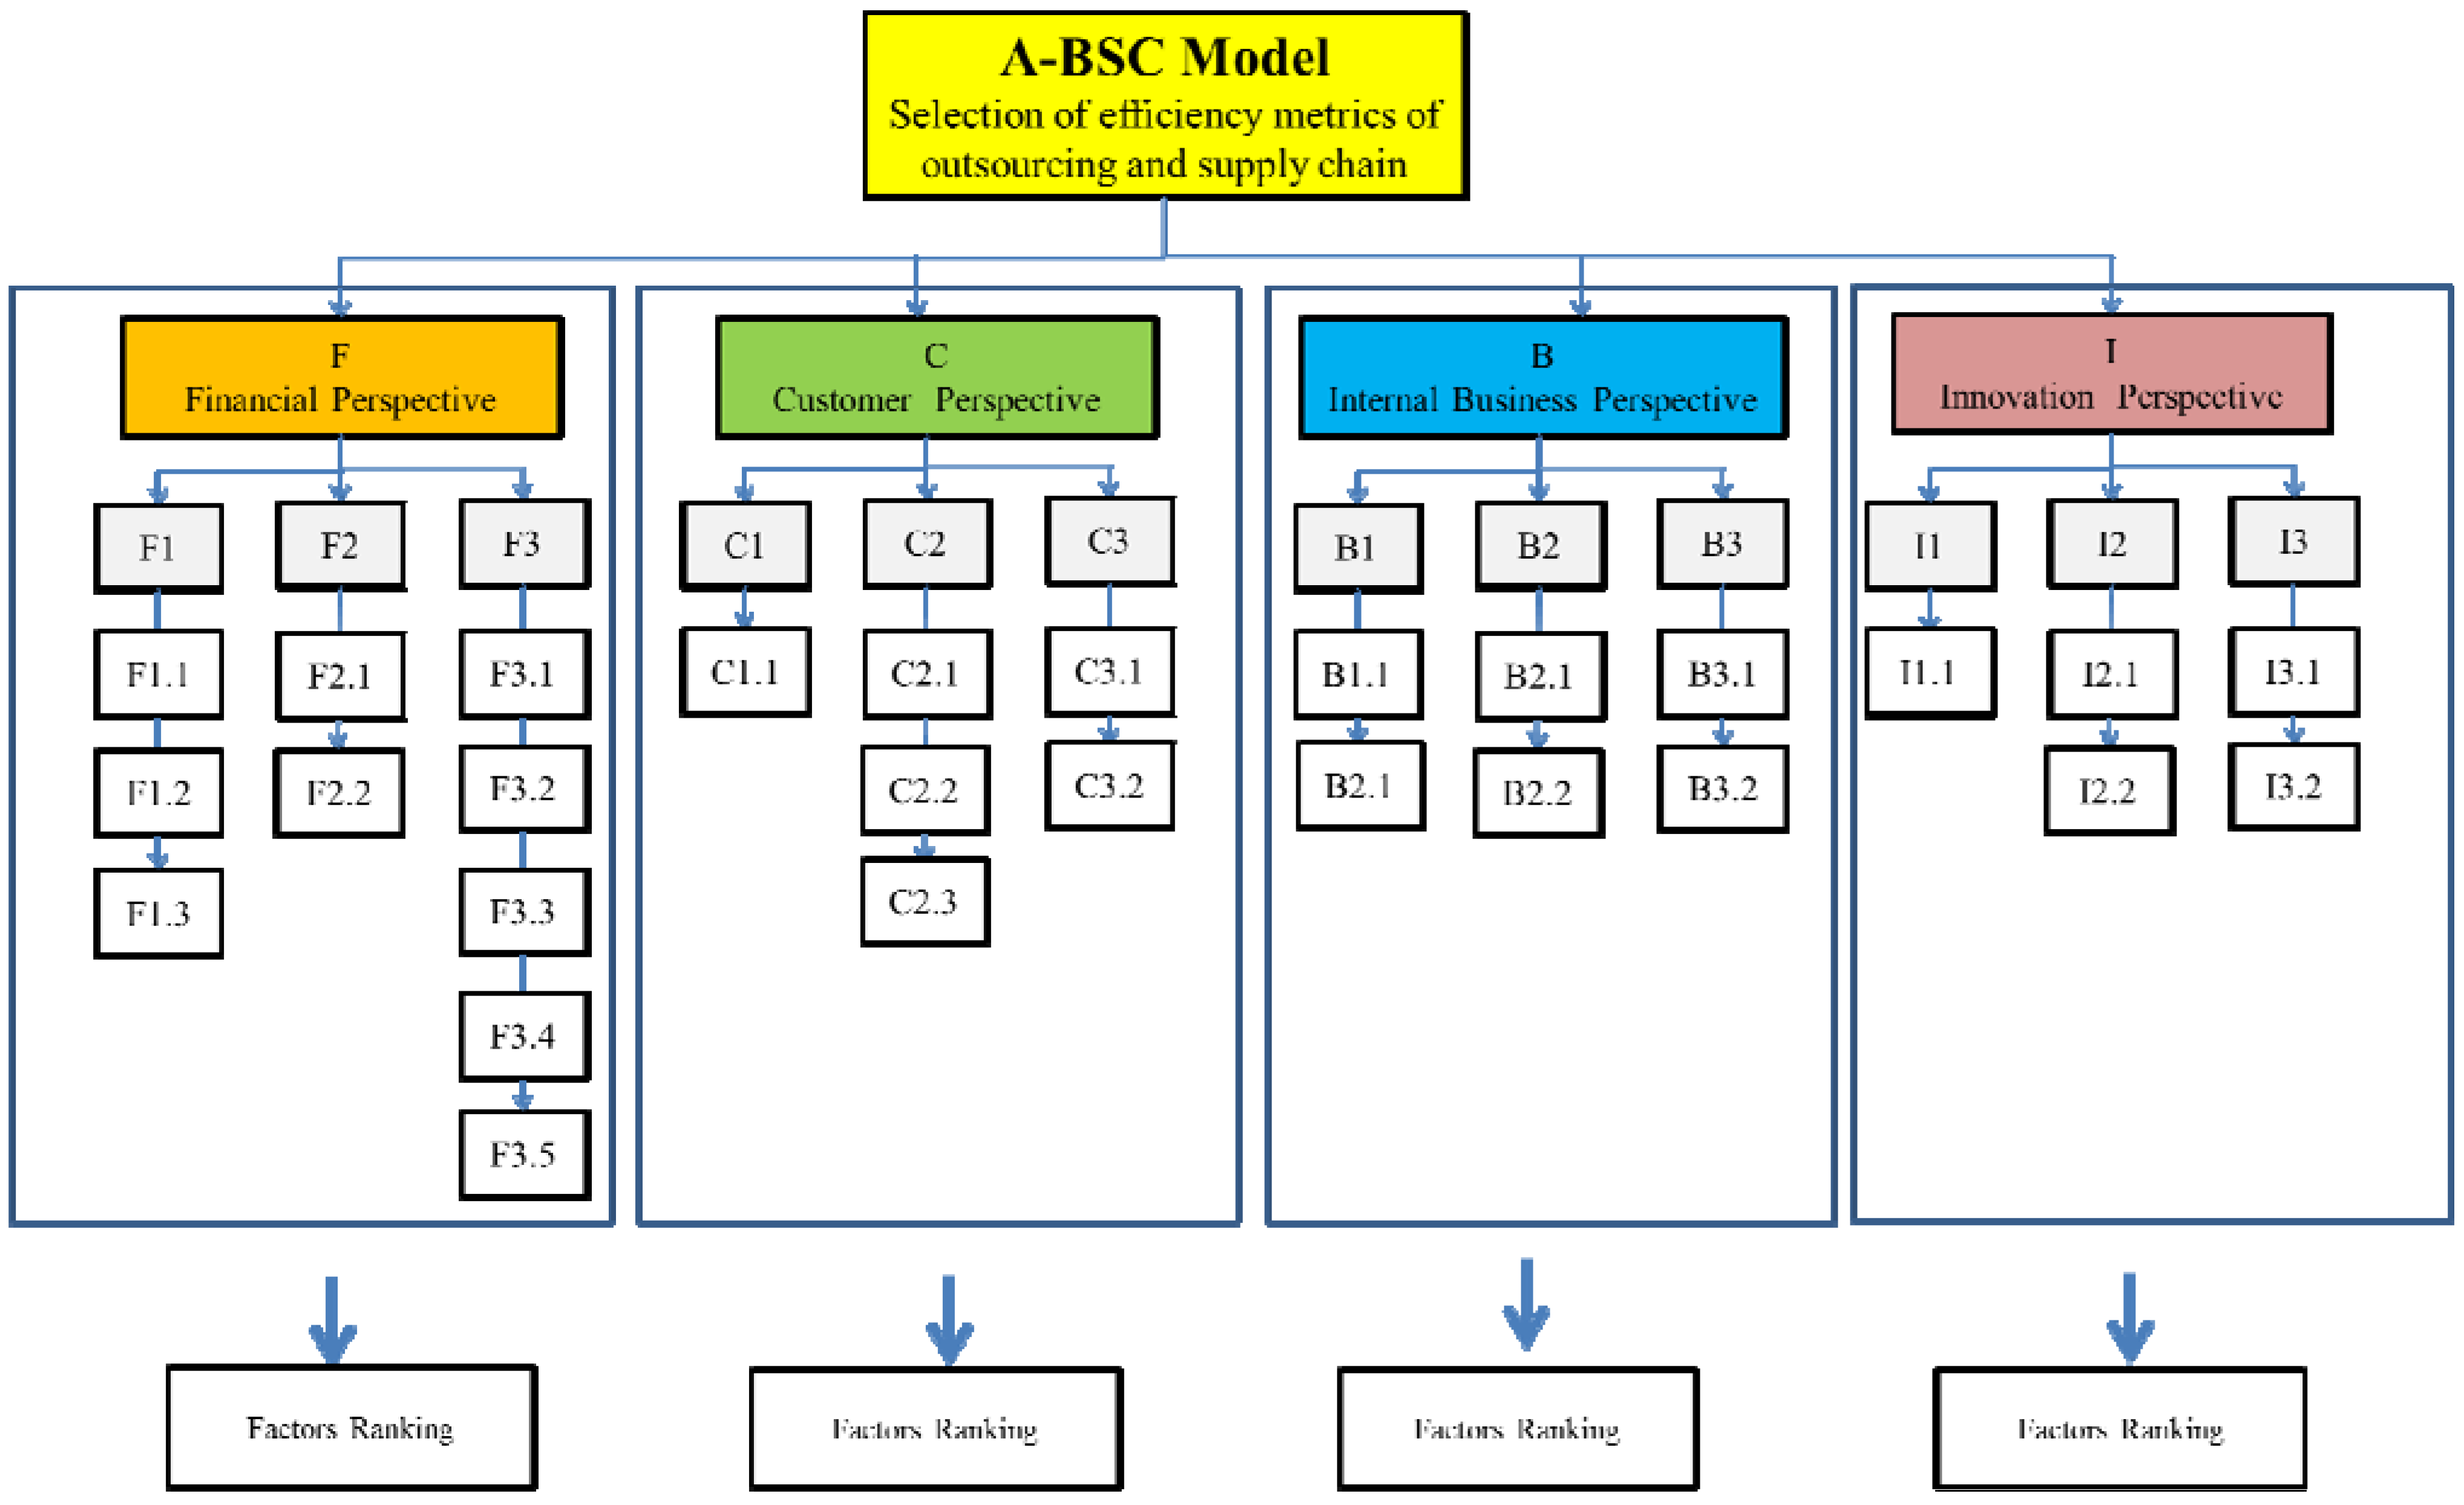
4.3. Phase#3: A-BSC Model
| F | C | B | I | Weight | |
|---|---|---|---|---|---|
| F | 1 | 5 | 4 | 4 | 0.56891 |
| C | 1/5 | 1 | 1/3 | 1/2 | 0.07917 |
| B | 1/4 | 3 | 1 | 3 | 0.23265 |
| I | 1/4 | 2 | 4 | 1 | 0.11927 |
| CI | 0.063 < 0.10 | ||||
| F1 | F2 | F3 | Weight | |
|---|---|---|---|---|
| F1 | 1 | 3 | 4 | 0.6250 |
| F2 | 1/3 | 1 | 2 | 0.2384 |
| F3 | 1/4 | 1/2 | 1 | 0.1365 |
| CI | 0.017 | |||
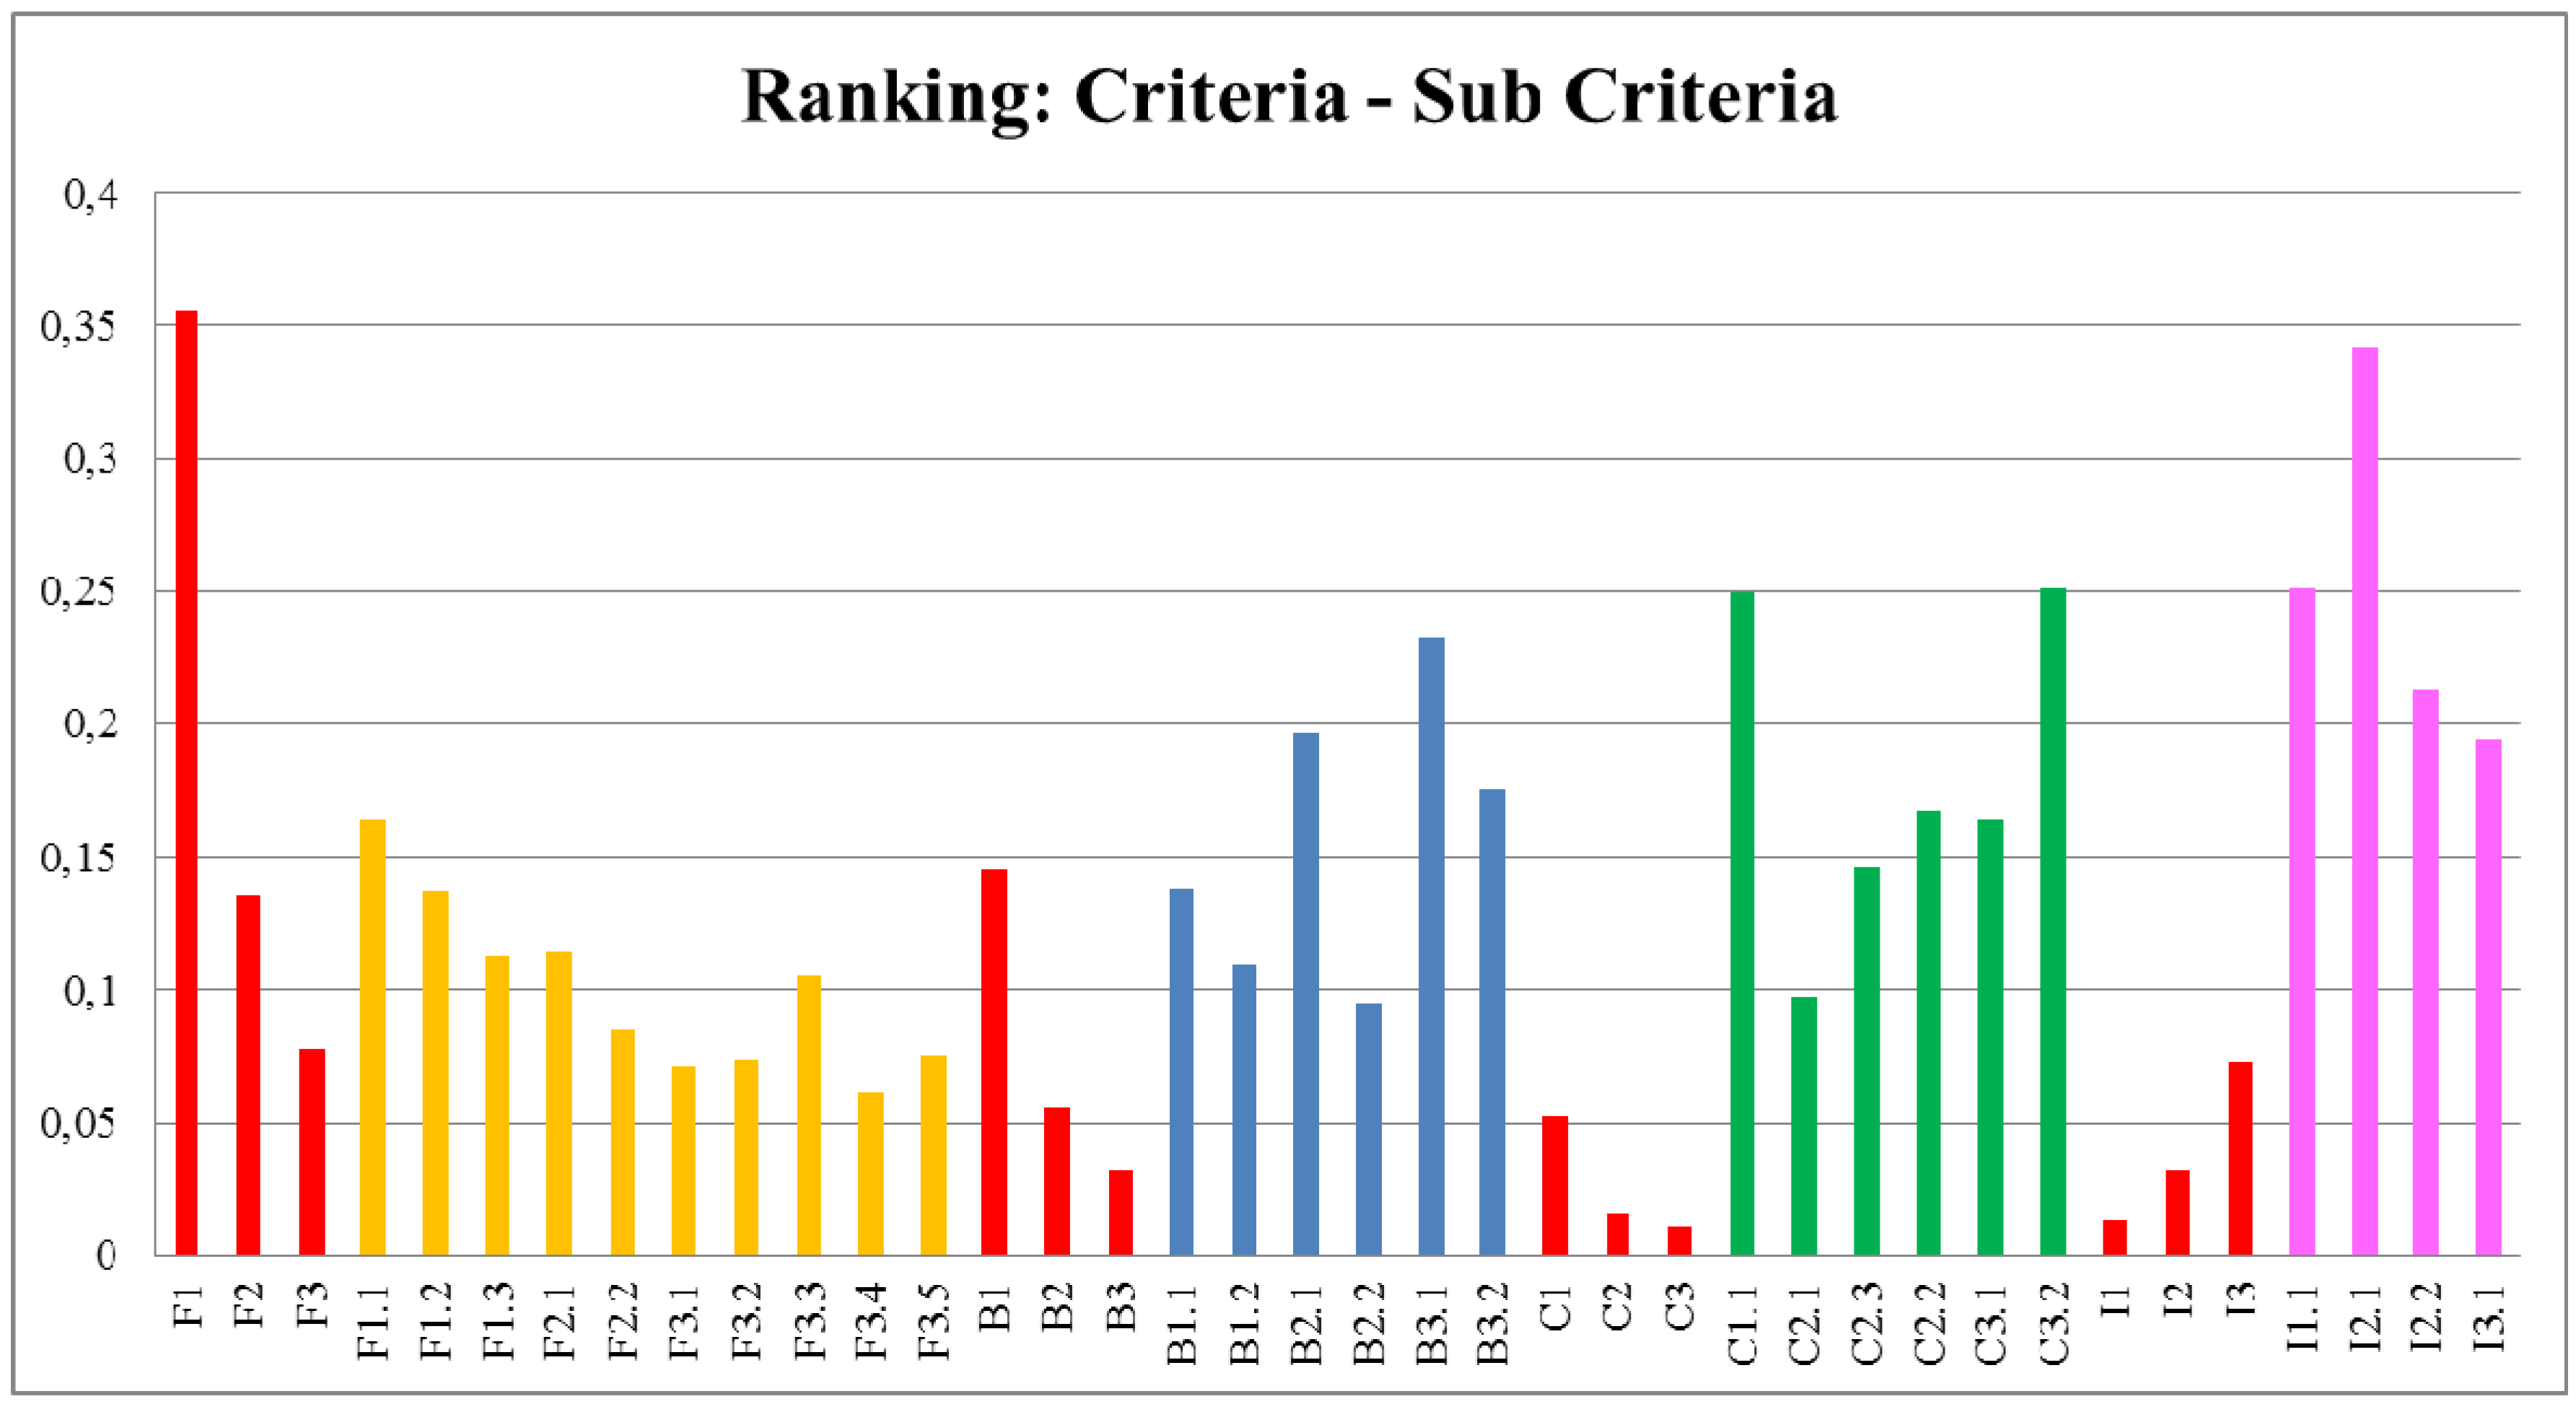
| Criterai | Weight |
|---|---|
| F1 | 0.35558 |
| F2 | 0.13568 |
| F3 | 0.07766 |
| C1 | 0.05231 |
| C2 | 0.01648 |
| C3 | 0.01038 |
| B1 | 0.14541 |
| B2 | 0.05549 |
| B3 | 0.03176 |
| I1 | 0.01398 |
| I2 | 0.03201 |
| I3 | 0.07328 |
| Financial SUB Criteria | Weight |
|---|---|
| F1.1 | 0.16418 |
| F1.2 | 0.13714 |
| F1.3 | 0.11247 |
| F2.1 | 0.11432 |
| F2.2 | 0.08477 |
| F3.1 | 0.07159 |
| F3.2 | 0.07359 |
| F3.3 | 0.10534 |
| F3.4 | 0.06143 |
| F3.5 | 0.07515 |
| Business SUB Criteria | Weight |
|---|---|
| B1.1 | 0.22763 |
| B1.2 | 0.13777 |
| B2.1 | 0.10945 |
| B2.2 | 0.19675 |
| B3.1 | 0.09533 |
| B3.2 | 0.23306 |
| Business SUB Criteria | Weight |
|---|---|
| C1.1 | 0.17629 |
| C2.1 | 0.24939 |
| C2.2 | 0.09754 |
| C2.3 | 0.14556 |
| C3.1 | 0.16727 |
| C3.2 | 0.16394 |
| Innovation SUB Criteria | Weight |
|---|---|
| I1.1 | 0.25095 |
| I2.1 | 0.34195 |
| I2.2 | 0.21299 |
| I3.1 | 0.1941 |
4.4. Phase #4: Results Analysis (Performance Analysis and KPIs)
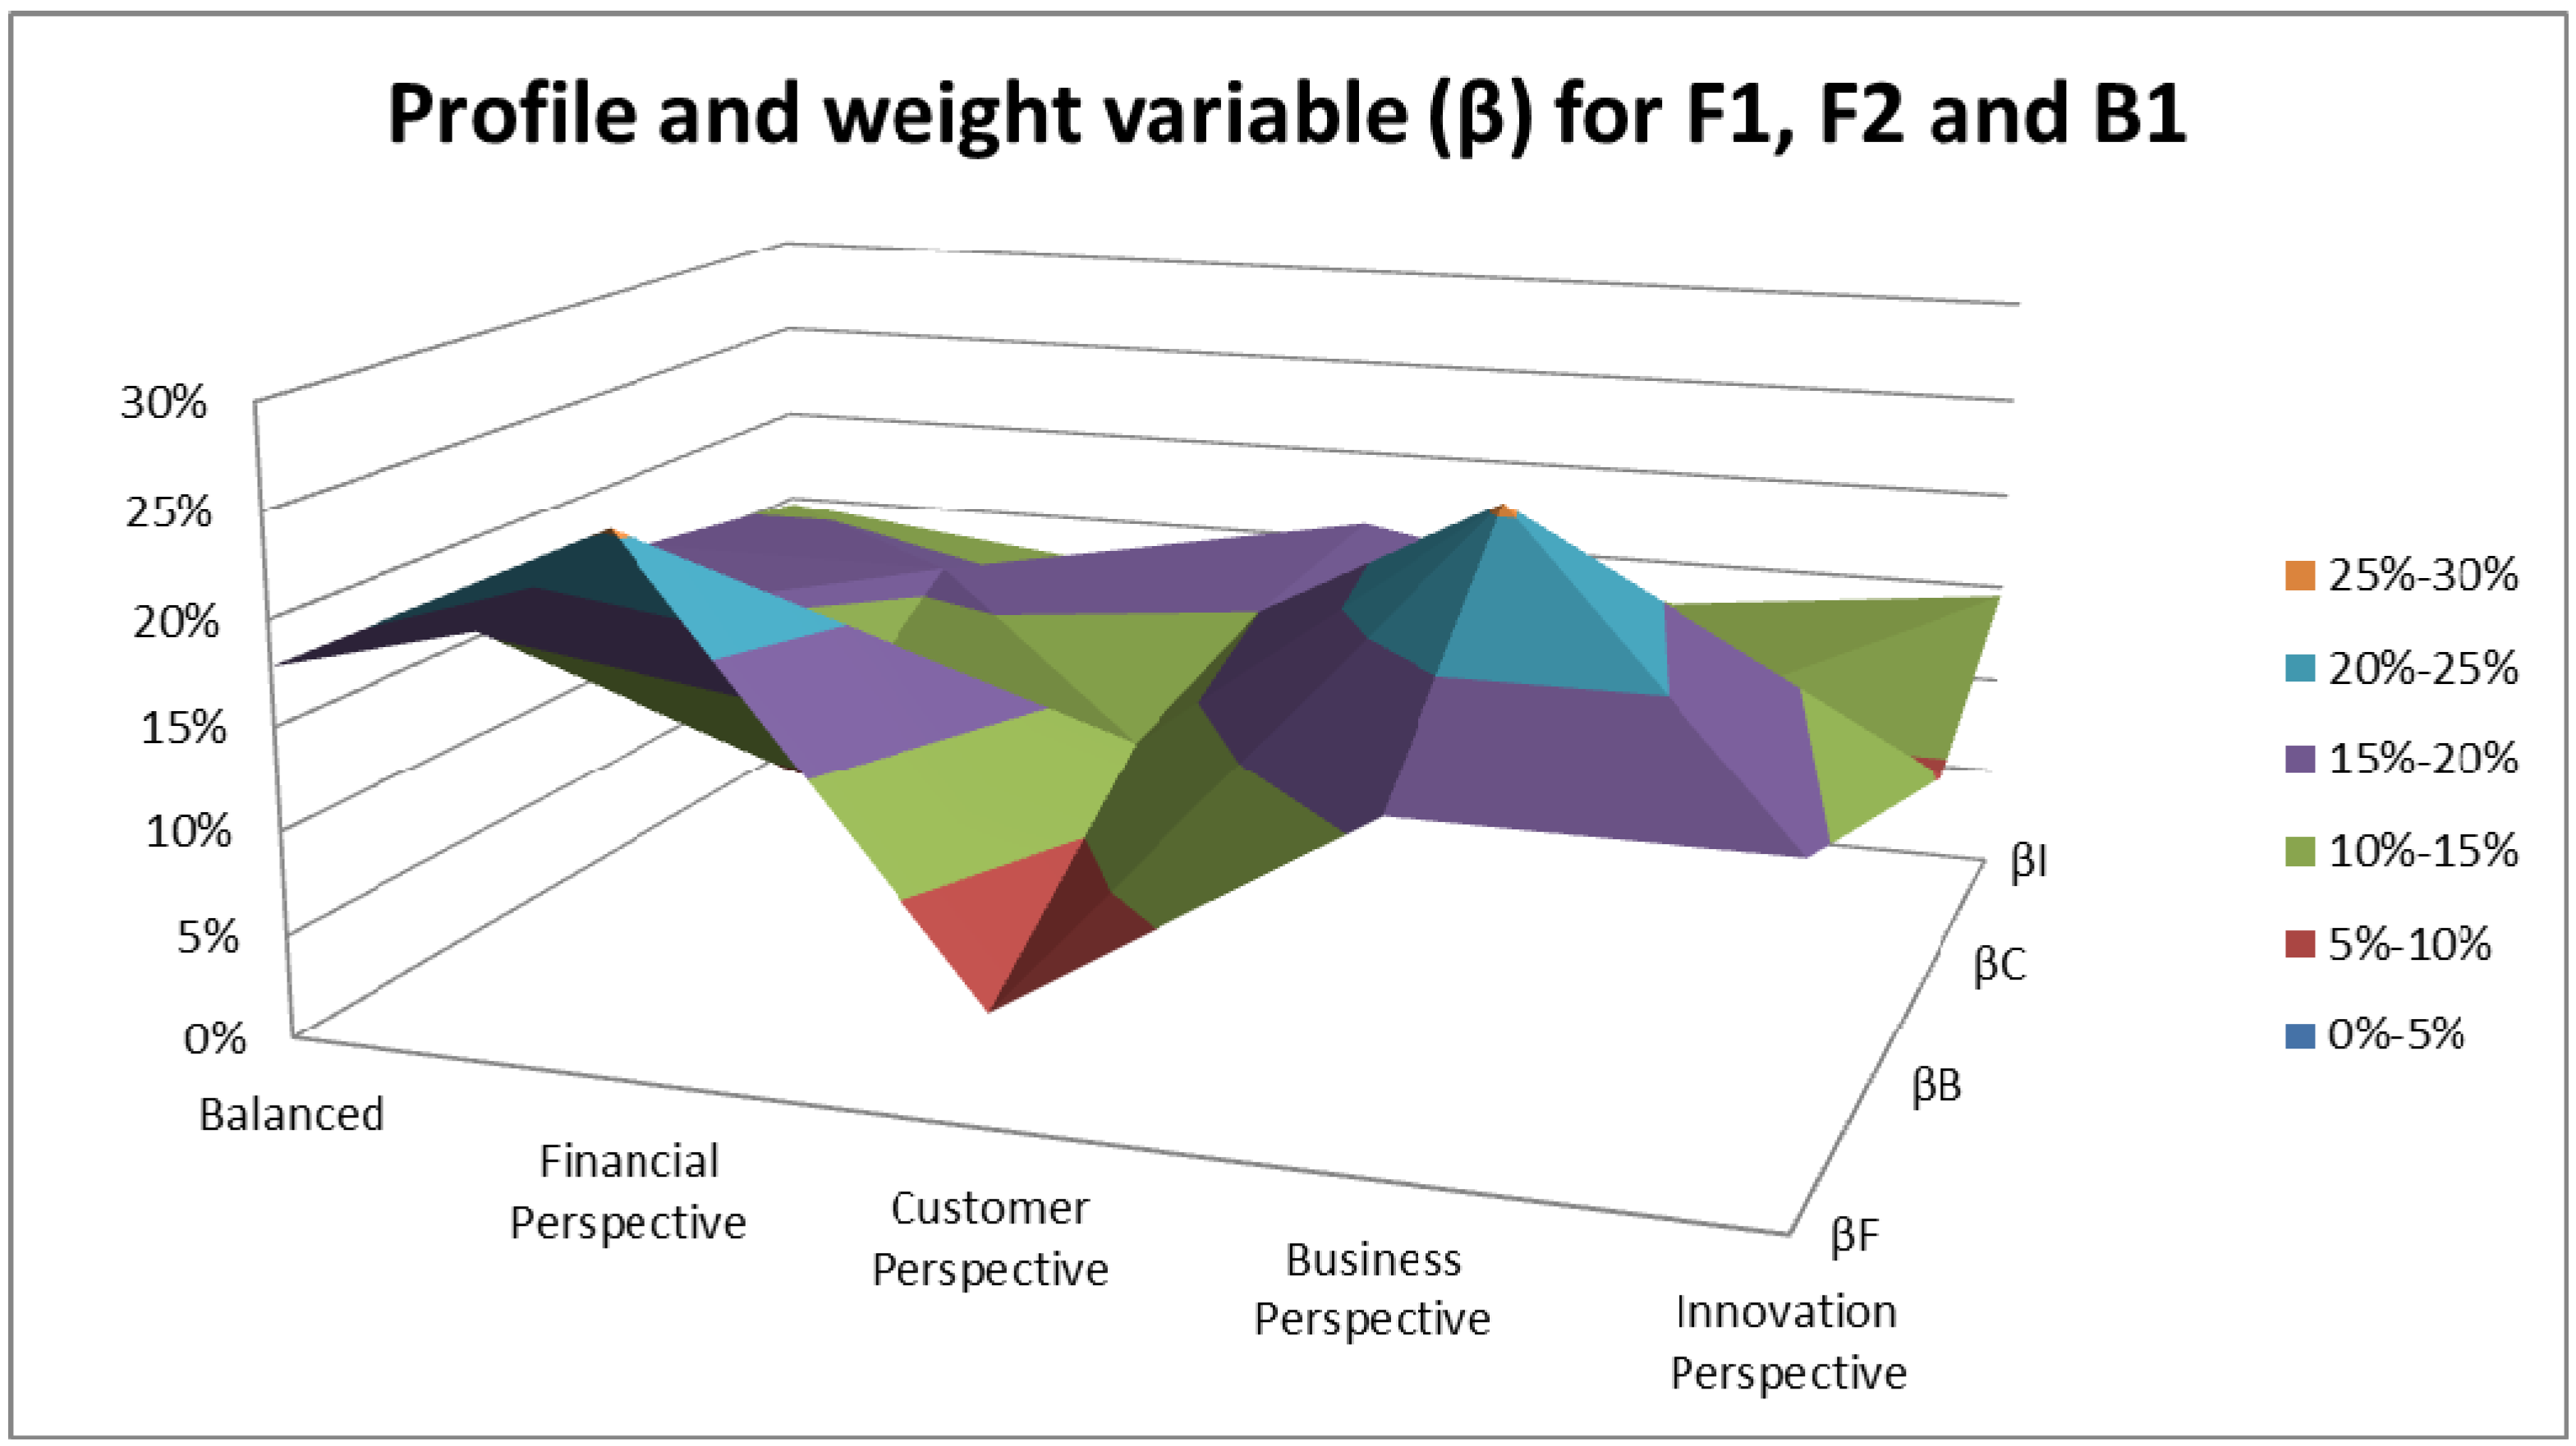
| # | Profile | βF | βB | βC | βI |
|---|---|---|---|---|---|
| 1 | Balanced | 28% | 24% | 25% | 23% |
| 2 | Financial | 40% | 15% | 25% | 20% |
| 3 | Customer | 15% | 20% | 40% | 25% |
| 4 | Business | 25% | 40% | 15% | 20% |
| 5 | Innovation | 25% | 20% | 15% | 40% |
| Profile | PF | PB | PC | PI |
|---|---|---|---|---|
| Balanced | 18% | 15% | 16% | 15% |
| Financial Perspective | 25% | 10% | 16% | 13% |
| Customer Perspective | 5% | 13% | 15% | 16% |
| Business Perspective | 16% | 25% | 10% | 13% |
| Innovation Perspective | 16% | 13% | 10% | 15% |
| KPIs | Definition | Example with a graphical representation |
|---|---|---|
| Carrying Cost of Inventory | Measures how much it costs your organization to store inventory over a given period of time. |  |
| Inventory to Sales Ratio | Measures the ratio of in-stock items versus the amount of sales orders you are currently filling. |  |
| Accounts Payable Turnover | Measures the rate at which a company pays off suppliers and other expenses. |  |
| Email Marketing Engagement Score | Measure how effective campaigns are at generating actions and interactions with your target audience |  |
5. Conclusions
Author Contributions
Conflicts of Interest
References
- Shokravi, S.; Kurnia, S. A Step towards Developing a Sustainability Performance Measure within Industrial Networks. Sustainability 2014, 6, 2201–2222. [Google Scholar] [CrossRef]
- Kang, M.; Wu, X.; Hong, P. Strategic outsourcing practices of multi-national corporations (MNCs) in China. Strateg. Outsourcing Int. J. 2009, 2, 240–256. [Google Scholar] [CrossRef]
- Shafiee, M.; Lotfi, F.H.; Saleh, H. Supply chain performance evaluation with data envelopment analysis and balanced scorecard approach. Appl. Math. Model. 2014, 38, 5092–5112. [Google Scholar] [CrossRef]
- Porter, M.E.; Kramer, M.R. Strategy and society: The link between competitive advantage and corporate social responsibility. HarvardBus 2006, 84, 76–92. [Google Scholar]
- Hollos, D.; Blome, C.; Foerstl, K. Does sustainable supplier co-operation affect performance? Examining implications for the triple bottom line. Int. J. Prod. Res. 2012, 50, 2968–2986. [Google Scholar] [CrossRef]
- Brandenburg, M.; Rebs, T. Sustainable supply chain management: A modeling perspective. Ann. Oper. Res. 2015, 229, 213–252. [Google Scholar] [CrossRef]
- Reefke, H.; Trocchi, M. Balanced scorecard for sustainable supply chains: Design and development guidelines. Int. J. Prod. Perform. Manag. 2013, 62, 805–826. [Google Scholar]
- Chen, I.J.; Paulraj, A. Understanding supply chain management: Critical research and a theoretical framework. Int. J. Prod. Res. 2004, 42, 131–163. [Google Scholar] [CrossRef]
- De Felice, F.; Petrillo, A. Key success factors for organizational innovation in the fashion industry. Int. J. Eng. Bus. Manag. 2013, 5, 47–57. [Google Scholar]
- Tseng, M.; Lim, M.; Wong, W.P. Sustainable supply chain management: A closed-loop network hierarchical approach. Ind. Manag. Data Syst. 2015, 115, 436–461. [Google Scholar] [CrossRef]
- Sainaghi, R.; Phillips, P.; Corti, V. Measuring hotel performance: Using a balanced scorecard perspectives’ approach. Int. J. Hosp. Manag. 2014, 34, 150–159. [Google Scholar] [CrossRef]
- Kaplan, R.; Norton, D. The Strategy-Focused Organization: How Balanced Scorecard Companies Thrive in the New Business Environment; Harvard Business School Press: Boston, MA, USA, 2001. [Google Scholar]
- Varma, S.; Wadhwa, S.; Deshmukh, S.G. Evaluating petroleum supply chain performance. Asia Pac. J. Market. Logist 2008, 20, 343–356. [Google Scholar] [CrossRef]
- Banker, R.D.; Chang, H.; Janakiraman, S.N.; Konstans, C. A balanced scorecard analysis of performance metrics. Eur. J. Oper. Res. 2004, 154, 423–436. [Google Scholar] [CrossRef]
- Kanga, J.-S.; Chiangb, C.-F.; Huangthanapanc, K.; Downing, S. Corporate social responsibility and sustainability balanced scorecard: The case study of family-owned hotels. Int. J. Hosp. Manag. 2015, 48, 124–134. [Google Scholar] [CrossRef]
- Singh, S.; Olugu, E.U.; Musa, S.N.; Mahat, A.B. Fuzzy-based sustainability evaluation method for manufacturing SMEs using balanced scorecard framework. J. Intell. Manuf. 2015. [Google Scholar] [CrossRef]
- Rabbani, A.; Zamani, M.; Yazdani-Chamzini, A.; Zavadskas, E.K. Proposing a new integrated model based on sustainability balanced scorecard (SBSC) and MCDM approaches by using linguistic variables for the performance evaluation of oil producing companies. Expert Syst. Appl. 2014, 41, 7316–7327. [Google Scholar] [CrossRef]
- Bhattacharya, A.; Mohapatra, P.; Kumar, V.; Dey, P.K.; Brady, M.; Tiwari, M.K.; Nudurupati, S.S. Green supply chain performance measurement using fuzzy ANP-based balanced scorecard: A collaborative decision-making approach. Prod. Plan. Control 2014, 25, 698–714. [Google Scholar] [CrossRef]
- Stankeviciene, J. Multi-attribute value measurement approach to assess business sustainability. Available online: http://www.linknovate.com/publication/multi-attribute-value-measurement-approach-to-assess-business-sustainability-1574262/ (accessed on 22 June 2015).
- Wang, Y. Research on performance evaluation of supply chain based on improved BSC. In Proceedings of the International Conference on Transportation, Mechanical, and Electrical Engineering, TMEE, Changchun, China, 16–18 December 2011; pp. 212–215.
- De Felice, F.; Petrillo, A. Proposal of a structured methodology for the measure of intangible criteria and for decision making. Int. J. Simul. Process. Model. 2014, 9, 157–166. [Google Scholar] [CrossRef]
- Veronese Bentes, A.; Carneiro, J.; Ferreira da Silva, J.; Kimura, H. Multidimensional assessment of organizational performance: Integrating BSC and AHP. J. Bus. Res. 2012, 65, 1790–1799. [Google Scholar] [CrossRef]
- Kumar, M.; Bhagwat, R. An integrated BSC-AHP approach for supply chain management evaluation. Meas. Bus. Excell. 2007, 11, 57–68. [Google Scholar]
- Leung, L.; Lam, K.; Cao, D. Implementing the Balanced Scorecard using the Analytic Hierarchy Process and the Analytic Network Process. J. Oper. Res. Soc. 2006, 57, 682–691. [Google Scholar] [CrossRef]
- Wua, C.-R.; Lin, C.-T.; Tsai, P.-H. Evaluating business performance of wealth management banks. Eur. J. Oper. Res. 2010, 207, 971–979. [Google Scholar] [CrossRef]
- Tjader, Y.; Maya, J.H.; Shang, J.; Vargas, L.G.; Gao, N. Firm-level outsourcing decision making: A balanced scorecard-based analytic Network process model. Int. J. Prod. Econ. 2014, 147, 614–623. [Google Scholar] [CrossRef]
- Saaty, T.L. The Analytic Hierarchy Process; McGraw-Hill: New York, NY, USA, 1980. [Google Scholar]
- Guo, Z.; Liu, Y.; Guo, W. The decision analysis evaluation of project investment based on BSC-AHP model. In Proceedings of the International Conference on Computational and Information Sciences, ICCIS, Shiyang, China, 21–23 June 2013; pp. 414–417.
- Saaty, T.L. Theory and Applications of the Analytic Network Process: Decision Making with Benefits, Opportunities, Costs, and Risks; RWS Publications: Pittsburgh, PA, USA, 2005. [Google Scholar]
- Lambert, D.M.; Cooper, M.C. Issues in supply chain management. Ind. Mark. Manag. 2000, 29, 65–84. [Google Scholar] [CrossRef]
- Christoper, M. Logistics and Supply Chain Management, Strategies for Reducing Cost and Improving Services, 2nd ed.; Pitman Publishing: London, UK, 1998. [Google Scholar]
- Gunasekaran, A.; Patel, C.; Ronald, E.; McGaughey, R. A framework for supply chain performance measurement. Int. J. Prod. Econ. 2004, 87, 333–348. [Google Scholar] [CrossRef]
- Chan, F.T.S.; Qi, H.J. An innovative performance measurement method for supply chain management. Supply Chain Manag. Int. J. 2003, 8, 209–223. [Google Scholar] [CrossRef]
- Chan, F.T.S. Performance measurement in a supply chain. Int. J. Adv. Manuf. Technol. 2003, 21, 534–548. [Google Scholar] [CrossRef]
- Fill, C.; Visser, E. The Outsourcing Dilemma: A Composite Approach to the Make or Buy Decision. Manag. Decis. 2000, 38, 43–50. [Google Scholar] [CrossRef]
- Costantino, F.; Di Gravio, G.; Nonino, F. Insights from action research: Implementing an innovative lean procurement framework for global sourcing. Int. Bus. Manag. 2015, 9, 416–424. [Google Scholar]
- Handfield, R.B.; Nichols, E.L. Introduction to Supply Chain Management; Prentice Hall Inc.: Upper Saddle Riverm, NY, USA, 1999. [Google Scholar]
- Costantino, F.; di Gravio, G.; Shaban, A. Multi-criteria logistics distribution network design for mass customization. Int. J. Appl. Decis. Sci. 2014, 7, 151–167. [Google Scholar] [CrossRef]
- McIvor, R. Outsourcing: Insights from the Telecommunications Industry. Supply Chain Manag. Int. J. 2003, 8, 380–394. [Google Scholar] [CrossRef]
- Mann, N. The Risks and Benefits of Outsourcing Supply Chain Management. Available online: http://www.businessbee.com/resources/operations/supplier-management/the-risks-and-benefits-of-outsourcing-supply-chain-management/ (accessed on 22 June 2015).
- Ishizaka, A.; Blakiston, R. The 18C’s model for a successful long-term outsourcing arrangement. Ind. Market. Manag. 2012, 41, 1071–1080. [Google Scholar] [CrossRef]
- Amer, Y.; Luong, L.; Lee, S.; Wang, Y. A systems approach to order fulfillment using design for six sigma methodology. Int. J. Bus. Syst. Res. 2007, 1, 302–316. [Google Scholar] [CrossRef]
- Bourne, M.; Mills, J.; Wilcox, M.; Neely, A.; Platts, K. Designing, implementing and updating performance measurement systems. Int. J. Oper. Prod. Manag. 2000, 20, 754–771. [Google Scholar] [CrossRef]
- Ramaa, A.; Rangaswamy, T.; Subramanya, K. A review of literature on performance measurement of supply chain network. In Proceedings of the 2nd International Conference Emerging Trends Engineering Technology, Nagpur, India, 16–18 December 2009; pp. 802–807.
- Udoncy, E.; Wong, K. Supply chain performance evaluation: Trends and challenges. Am. J. Eng. Appl. Sci. 2009, 2, 202–211. [Google Scholar]
- Kaplan, R.; Norton, D. The balanced scorecard: Measures that drive performance. Harv. Bus. Rev. 1992, 70, 71–79. [Google Scholar] [PubMed]
- Kaplan, R.; Norton, D. Using the balanced scorecard as a strategic management system. Harv. Bus. Rev. 1996, 74, 75–85. [Google Scholar]
- Saaty, T.L. How to make a decision: The analytic hierarchy process. Eur. J. Oper. Res. 1990, 48, 9–26. [Google Scholar] [CrossRef]
- De Felice, F. Editorial Research and applications of AHP/ANP and MCDA for decision making in manufacturing. Int. J. Prod. Res. 2012, 50, 4735–4737. [Google Scholar] [CrossRef]
- Bhagwat, R.; Sharma, M.K. Performance measurement of supply chain management: A balanced scorecard approach. Comput. Ind. Eng. 2007, 53, 43–62. [Google Scholar] [CrossRef]
- Park, J.H.; Lee, J.K.; Yoo, J.S. A framework for designing the balanced supply chain scorecard. Eur. J. Inf. Syst. 2005, 14, 335–346. [Google Scholar] [CrossRef]
- Yang, J. A balanced performance measurement scorecard approach for Product Service Systems. In Proceedings of the 2009 International Conference on Business Intelligence and Financial Engineering, Beijing, China, 24–26 July 2009; pp. 548–551.
- Subic, A.; Shabani, B.; Hedayati, M.; Crossin, E. Performance Analysis of the Capability Assessment Tool for Sustainable Manufacturing. Sustainability 2013, 5, 3543–3561. [Google Scholar] [CrossRef]
© 2015 by the authors; licensee MDPI, Basel, Switzerland. This article is an open access article distributed under the terms and conditions of the Creative Commons Attribution license ( https://creativecommons.org/licenses/by/4.0/).
Share and Cite
De Felice, F.; Petrillo, A.; Autorino, C. Development of a Framework for Sustainable Outsourcing: Analytic Balanced Scorecard Method (A-BSC). Sustainability 2015, 7, 8399-8419. https://doi.org/10.3390/su7078399
De Felice F, Petrillo A, Autorino C. Development of a Framework for Sustainable Outsourcing: Analytic Balanced Scorecard Method (A-BSC). Sustainability. 2015; 7(7):8399-8419. https://doi.org/10.3390/su7078399
Chicago/Turabian StyleDe Felice, Fabio, Antonella Petrillo, and Claudio Autorino. 2015. "Development of a Framework for Sustainable Outsourcing: Analytic Balanced Scorecard Method (A-BSC)" Sustainability 7, no. 7: 8399-8419. https://doi.org/10.3390/su7078399
APA StyleDe Felice, F., Petrillo, A., & Autorino, C. (2015). Development of a Framework for Sustainable Outsourcing: Analytic Balanced Scorecard Method (A-BSC). Sustainability, 7(7), 8399-8419. https://doi.org/10.3390/su7078399