
Determinants of Electricity Demand in Nonmetallic Mineral Products Industry: Evidence from a Comparative Study of Japan and China


Abstract
:1. Introduction
- ➣
- What are determinants of electricity demand in the non-metallic mineral products industry?
- ➣
- What implications can be drawn from the comparative study of Japan and China?
- ➣
- Which factors are significant for electricity conservation?
- ➣
- How large are the electricity conservation potentials in the Chinese non-metallic mineral products industry?
2. Literature Review
3. Methodology and Data Source
3.1. Methodology
3.2. Variables and Data Source

| Variables | Abbreviation | Measurable Indicators | Units | Data Sources |
|---|---|---|---|---|
| Economic growth | EGJ, EGC | Gross domestic product | Billion yen, Billion CNY (at constant 1990 prices) | [1,43] |
| Industrial activity | IAJ, IAC | Sectoral value added | Million yen, Million CNY (at constant 1990 prices) | [43,44] |
| R&D intensity | RIJ, RIC | Sectoral R&D-sales ratio | %, % | [43,45] |
| Electricity price | PJ, PC | Consumer price index of electricity charges of Japan, Fossil fuel price index of China | 1990 = 100, 1990 = 100 | [1,43] |
| Per capita productivity | PCPJ, PCPC | Sectoral value added per capita | 10,000 yen/ person, 10,000 CNY/person | [1,43] |
4. Data Processing
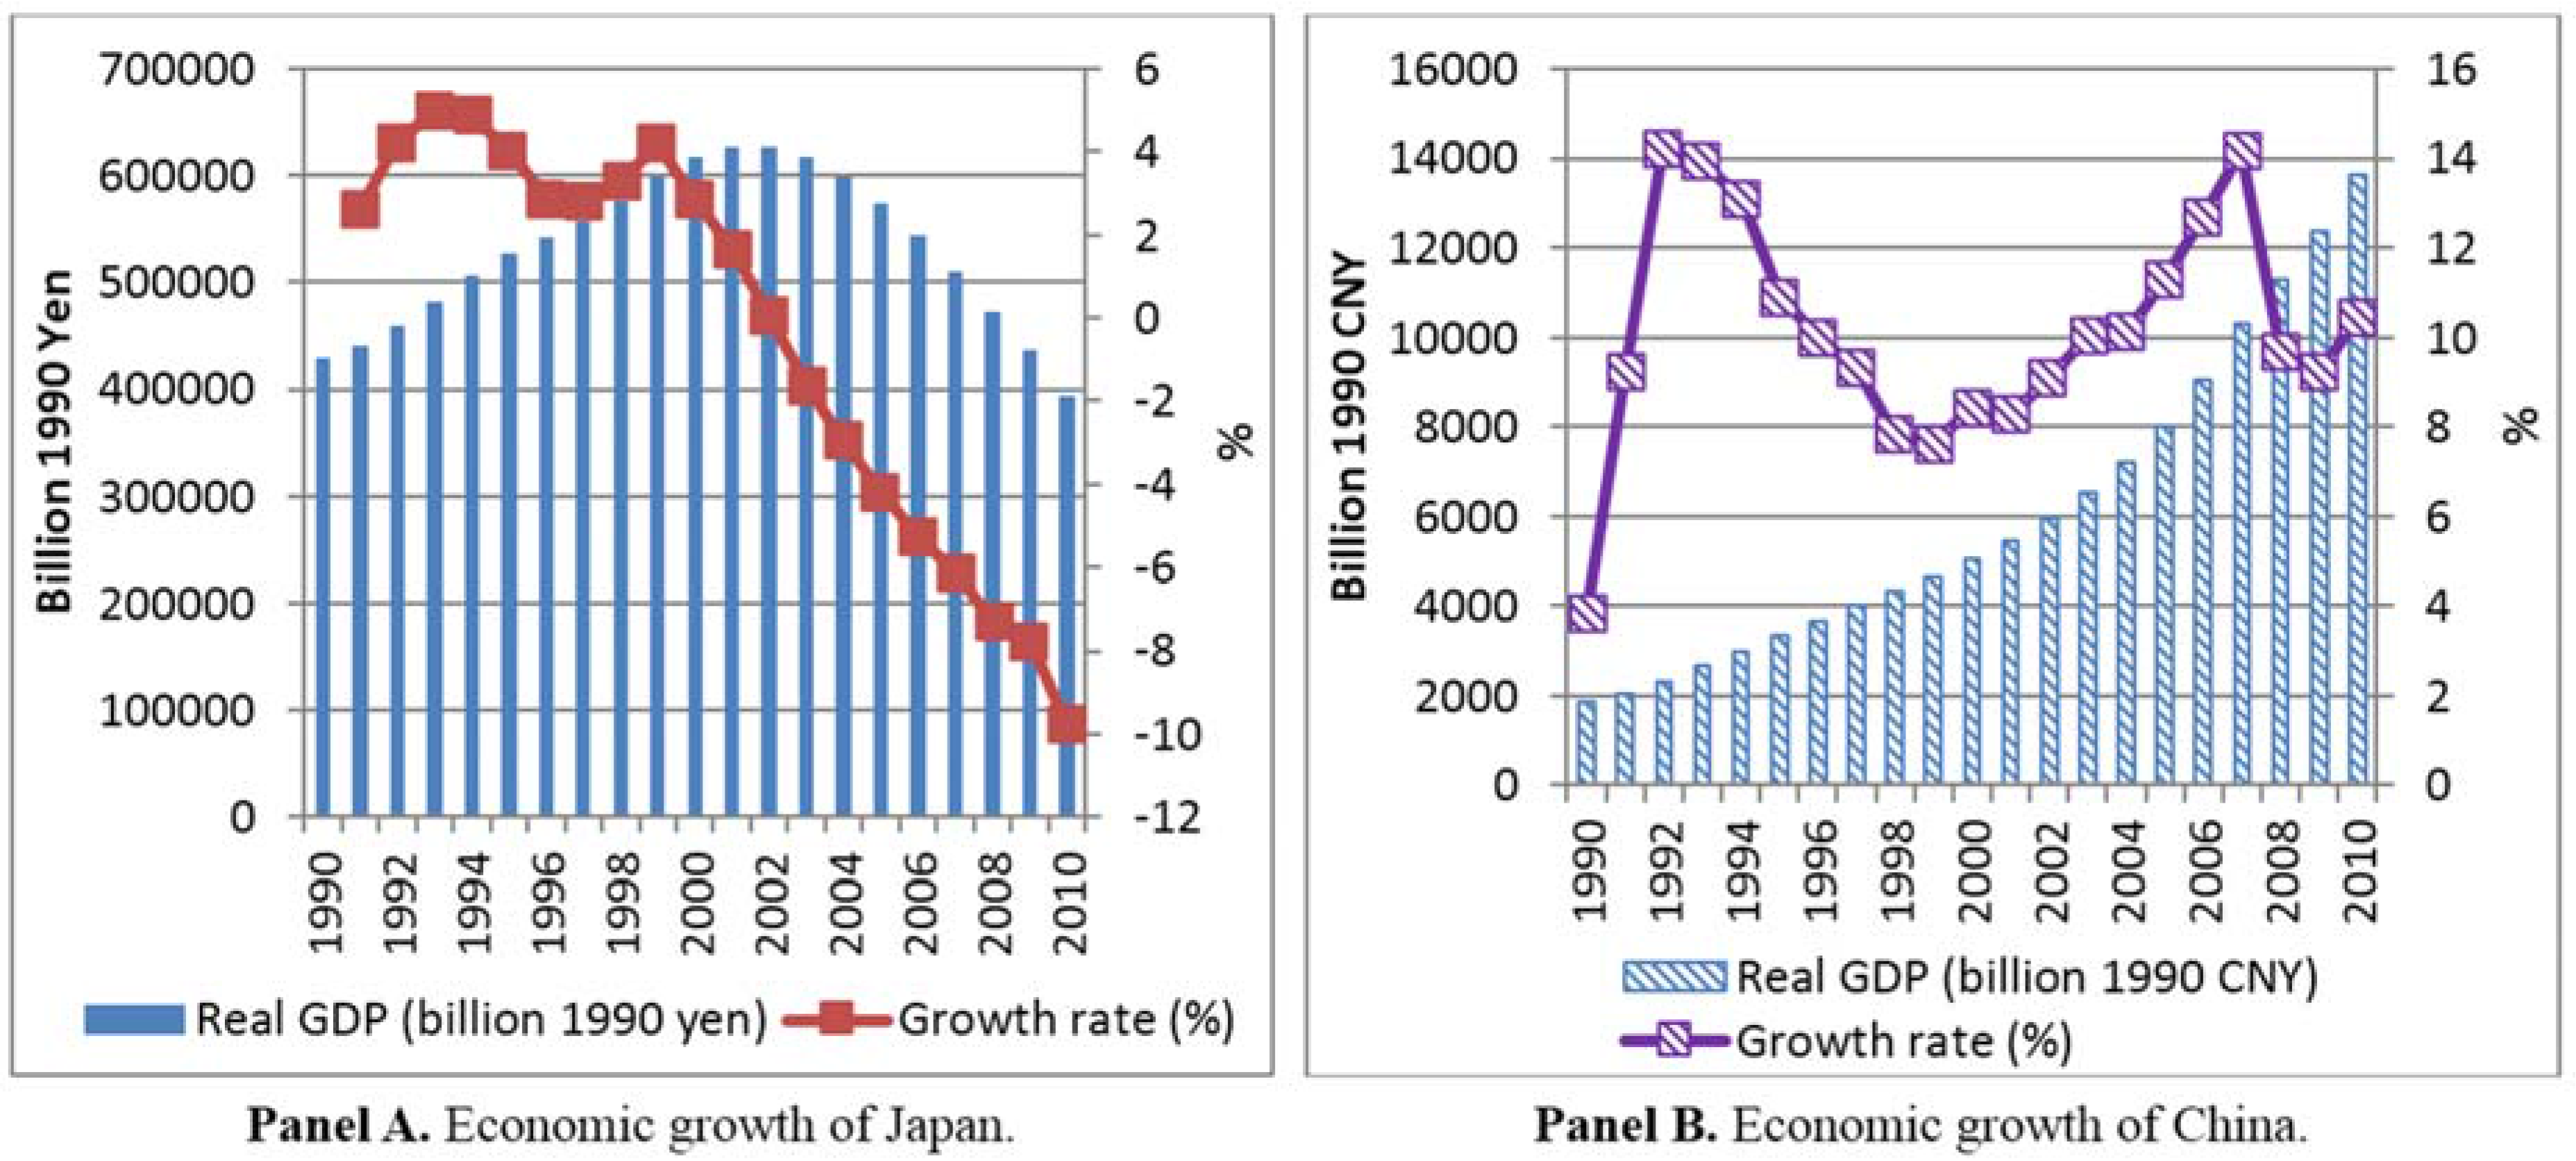
4.1. Economic Growth (/)
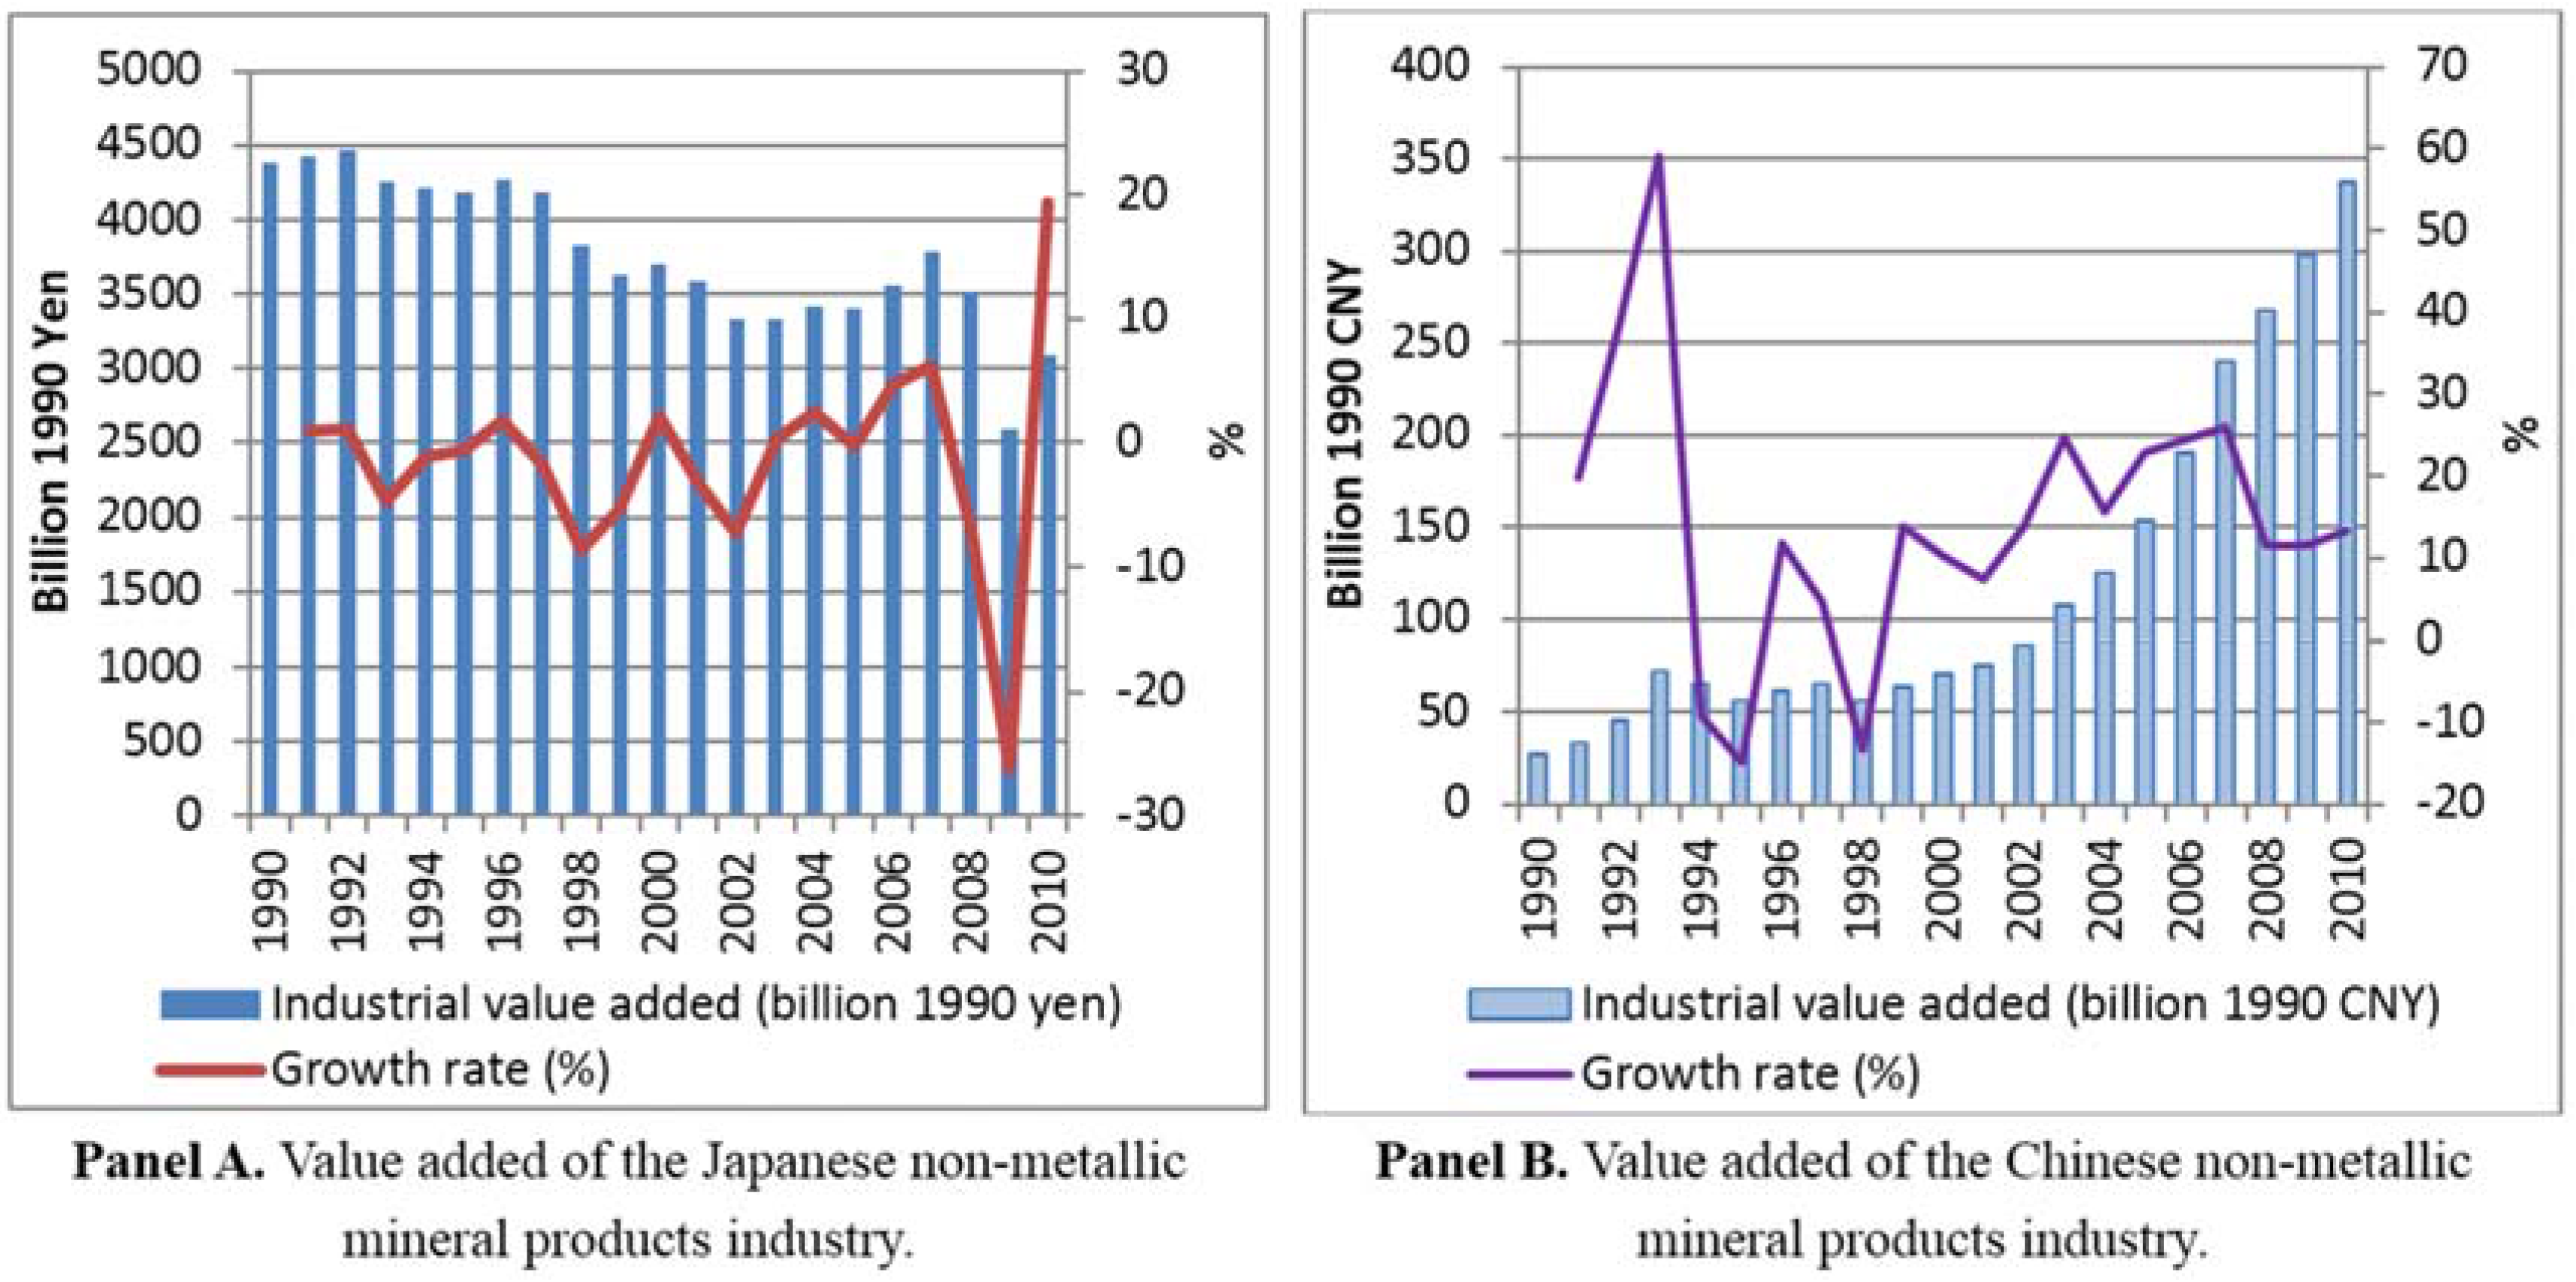
4.2. Industrial Activity (/)
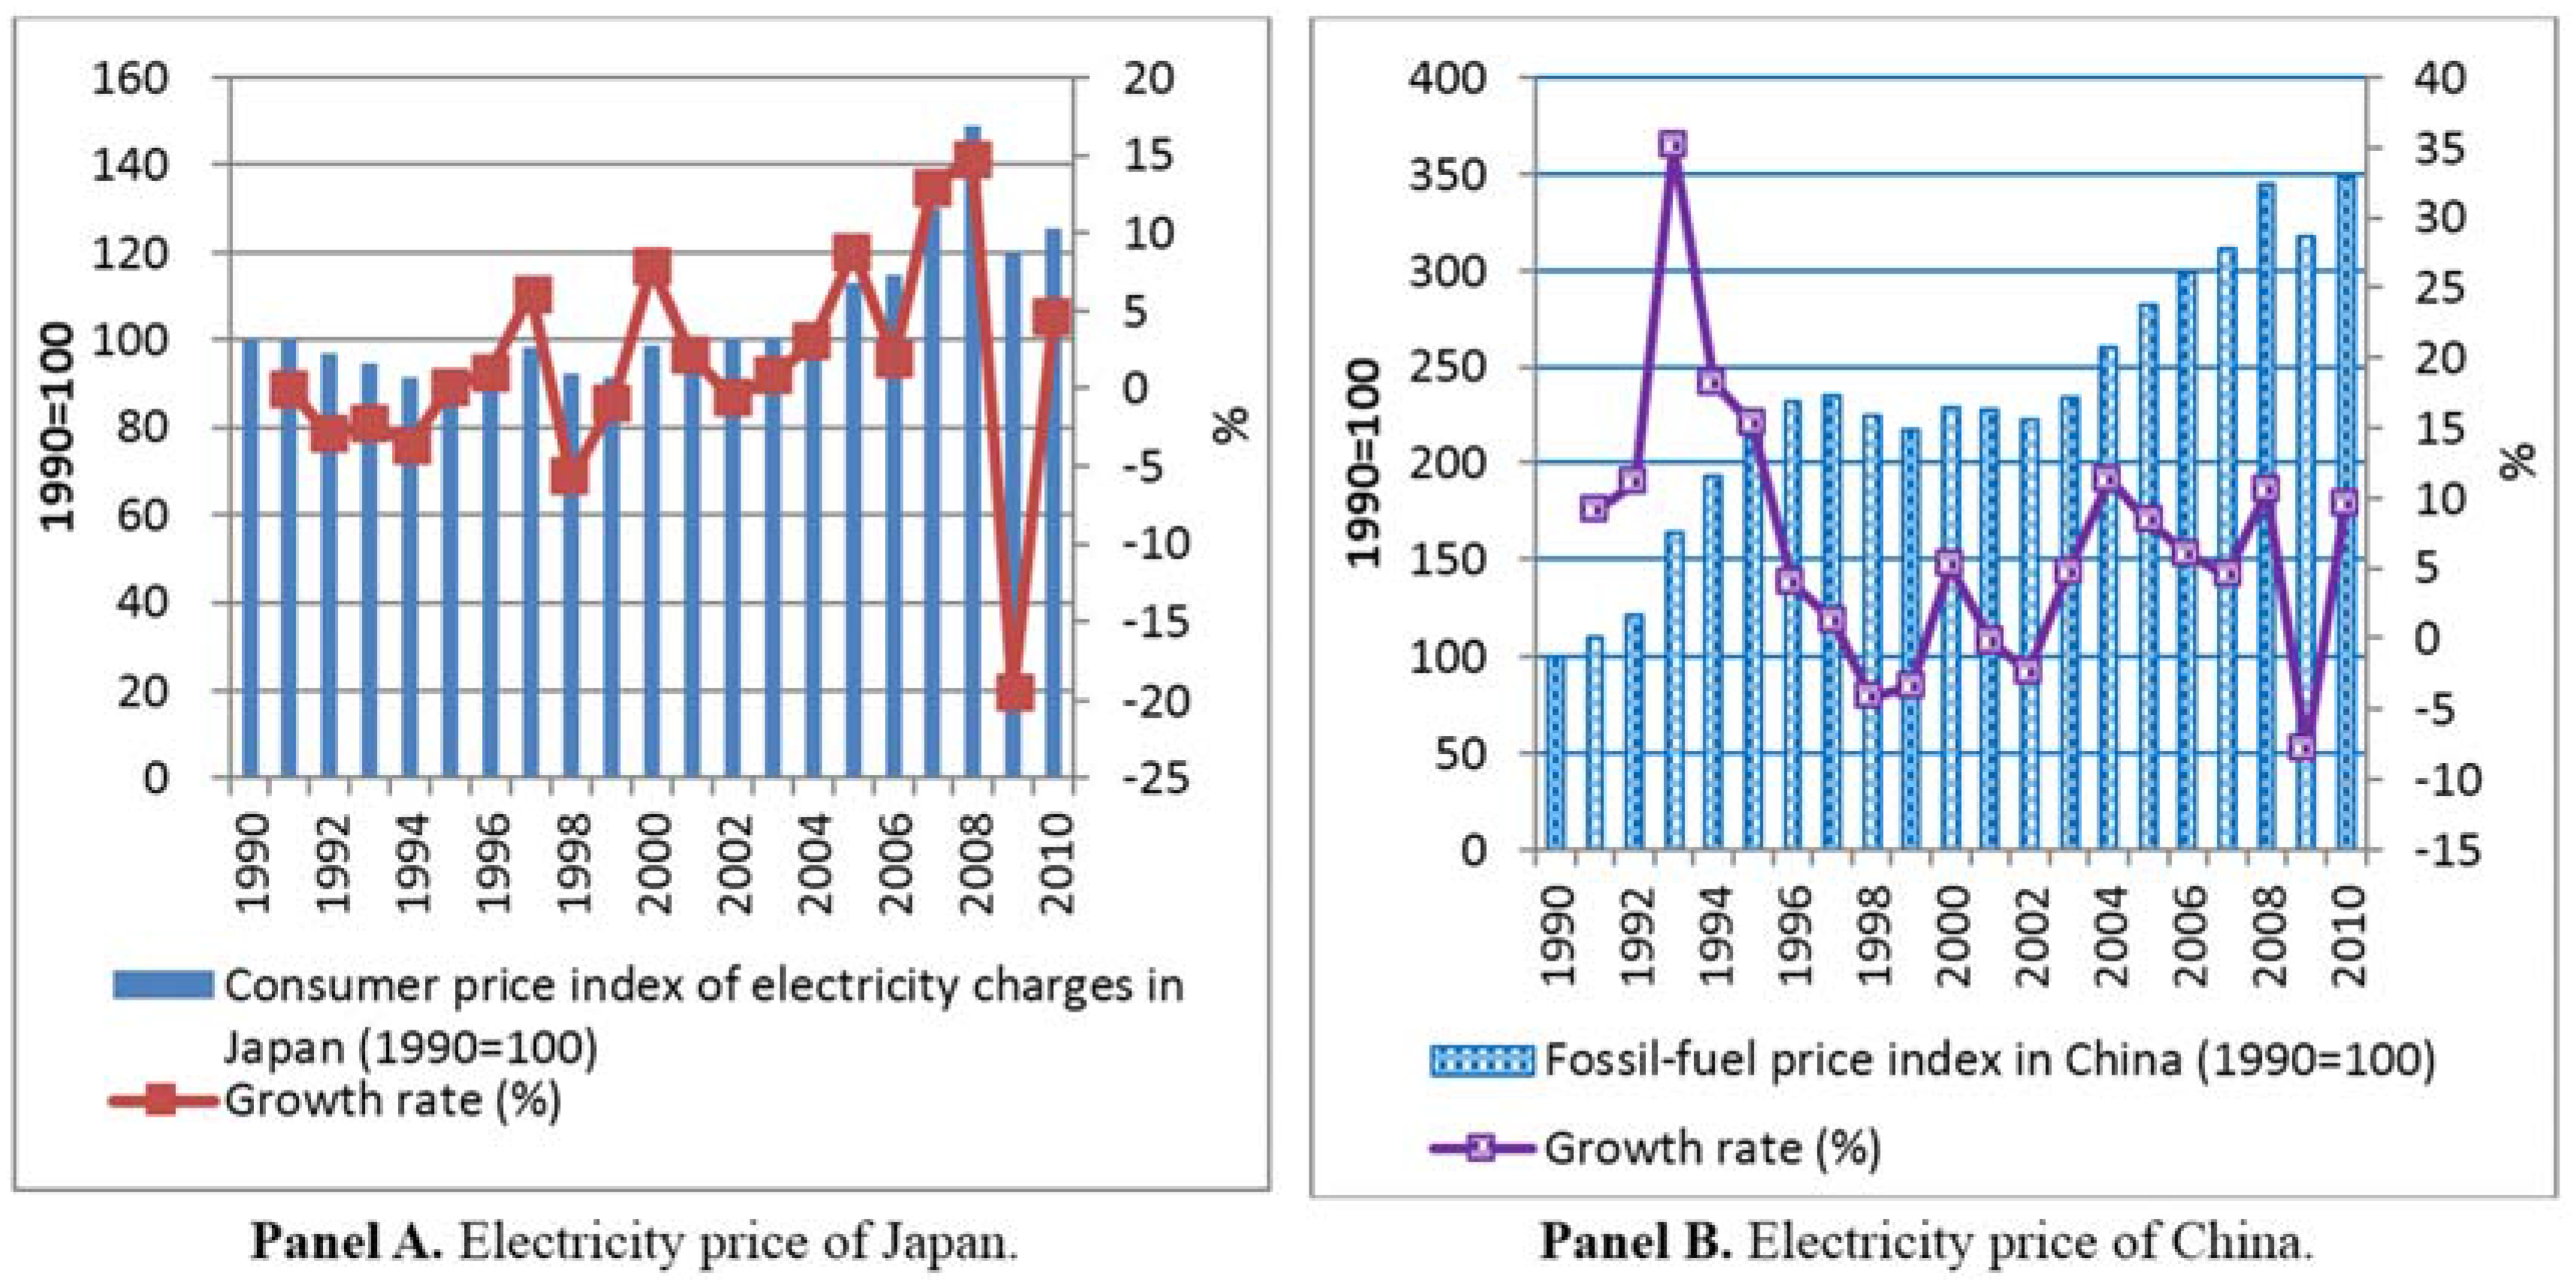
4.3. Electricity Price (/)
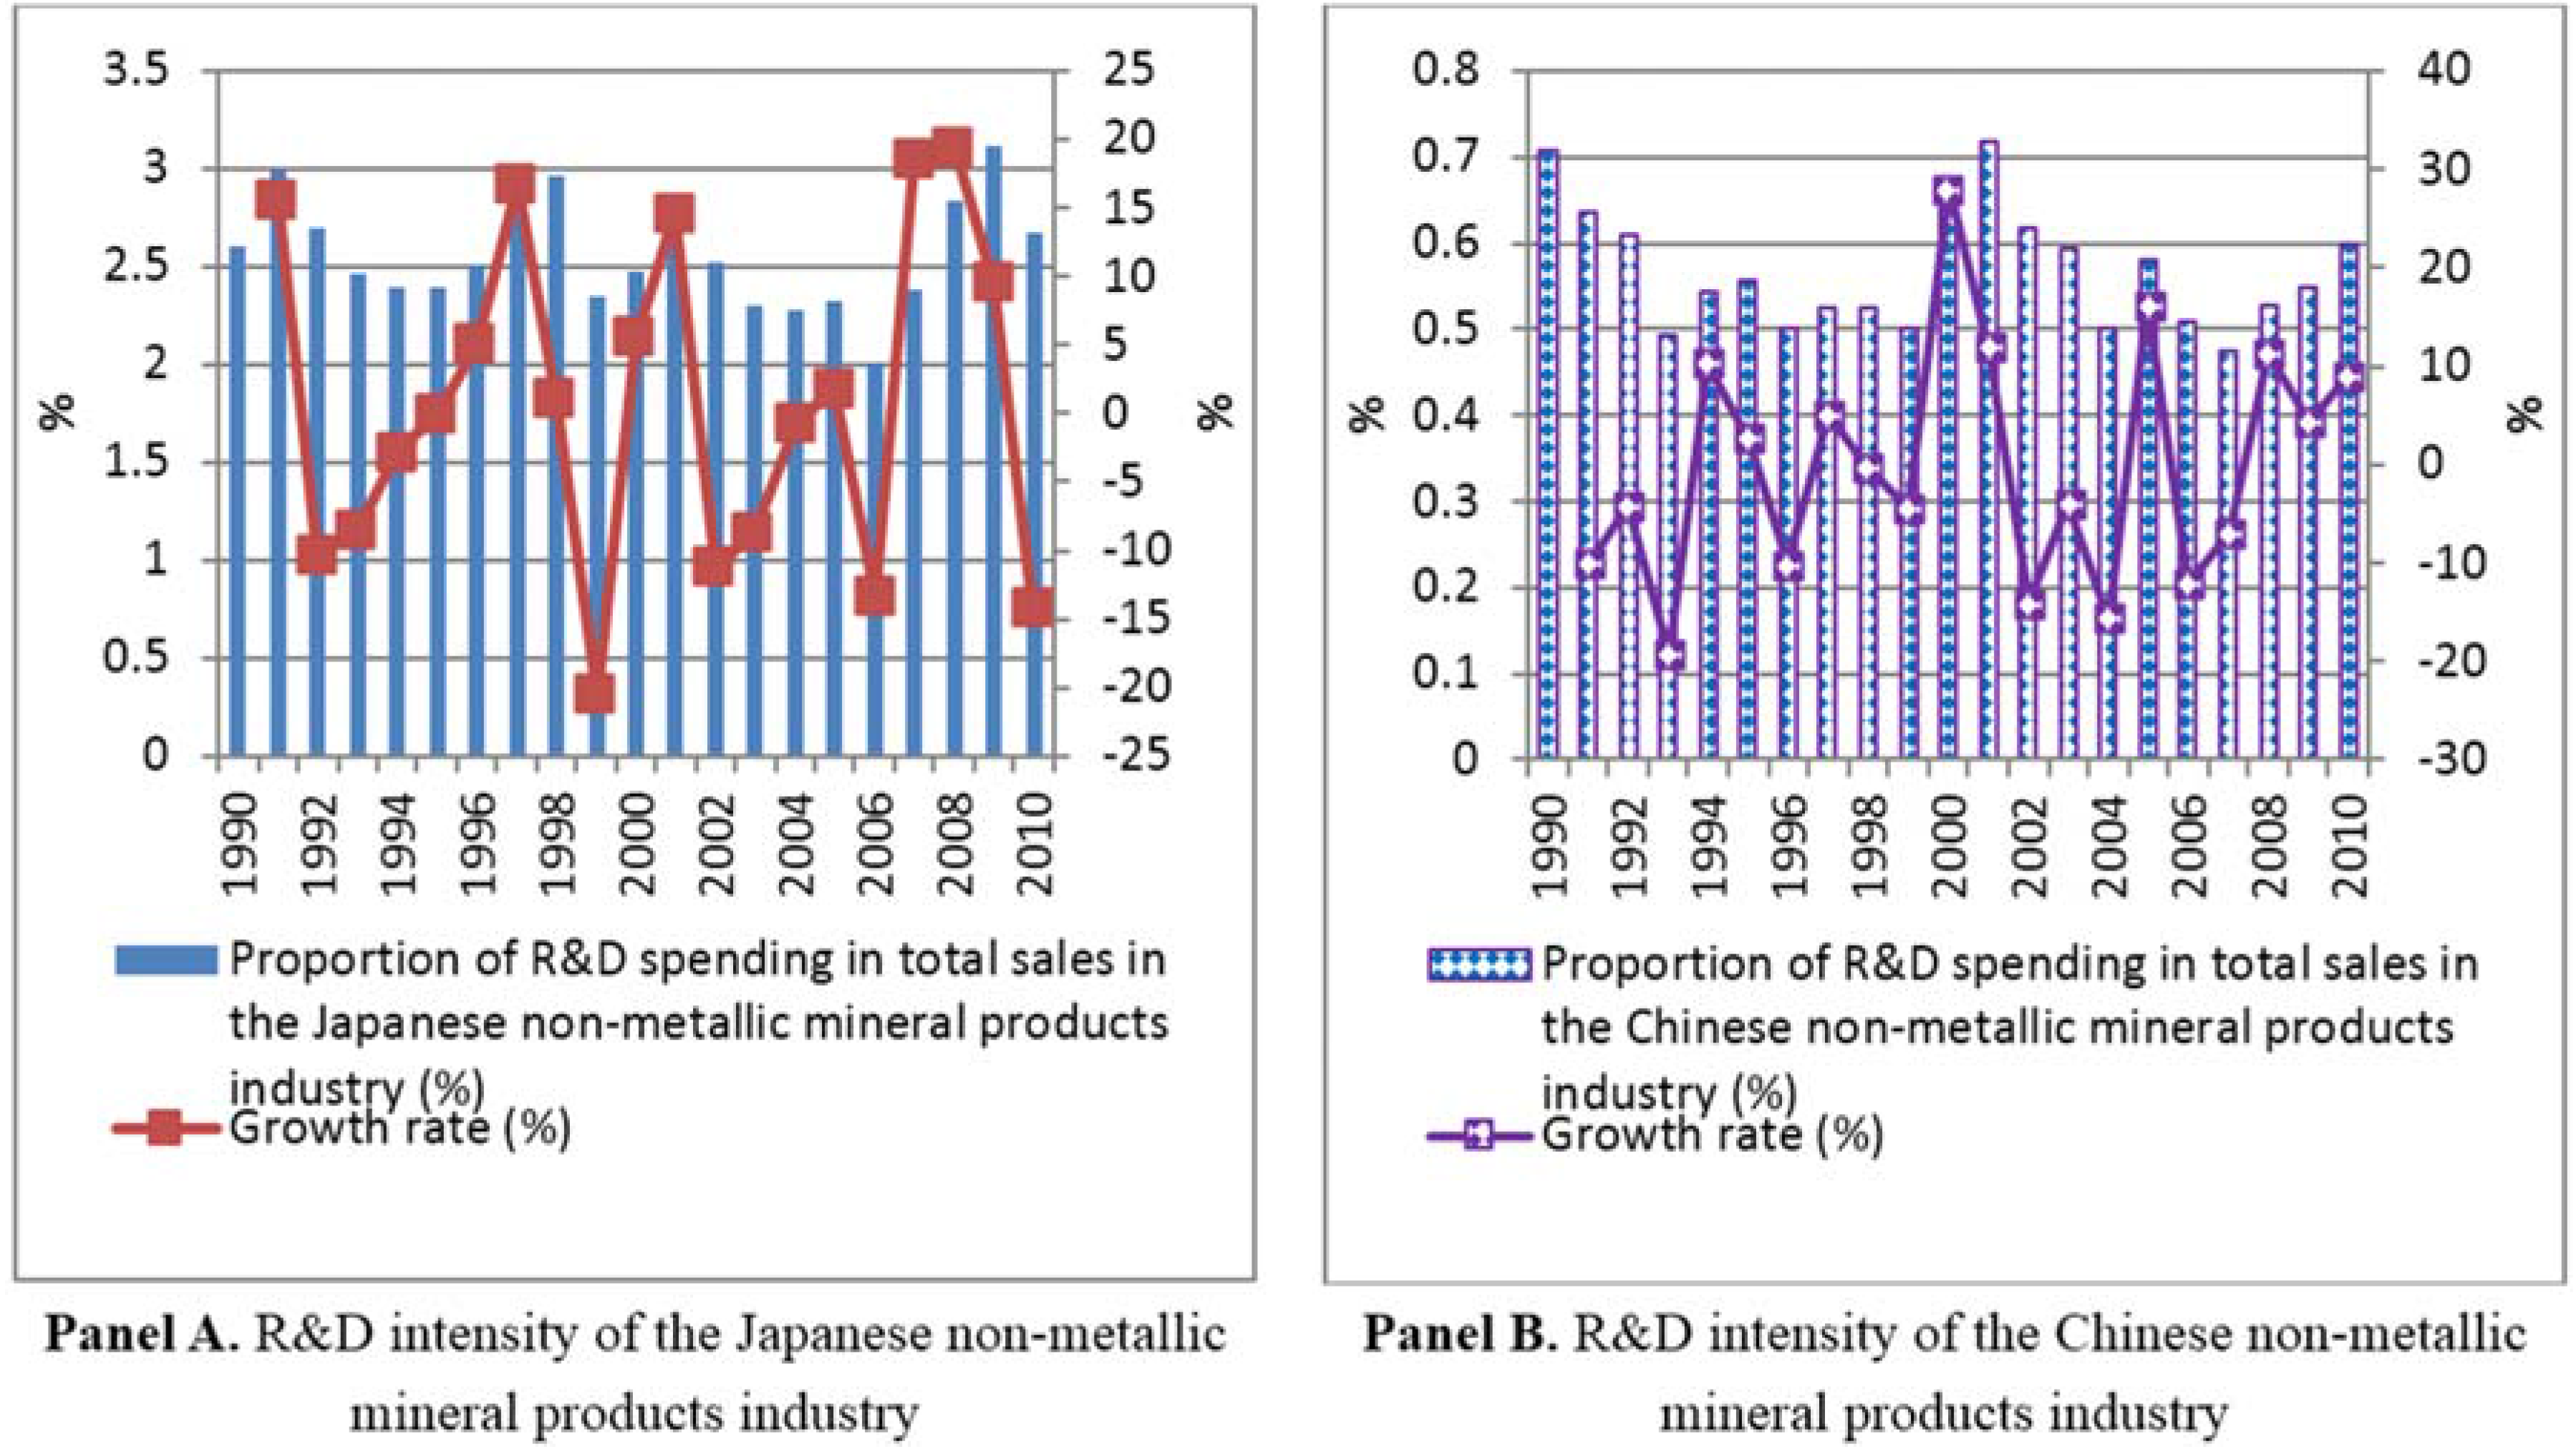
4.4. R&D Intensity (/)
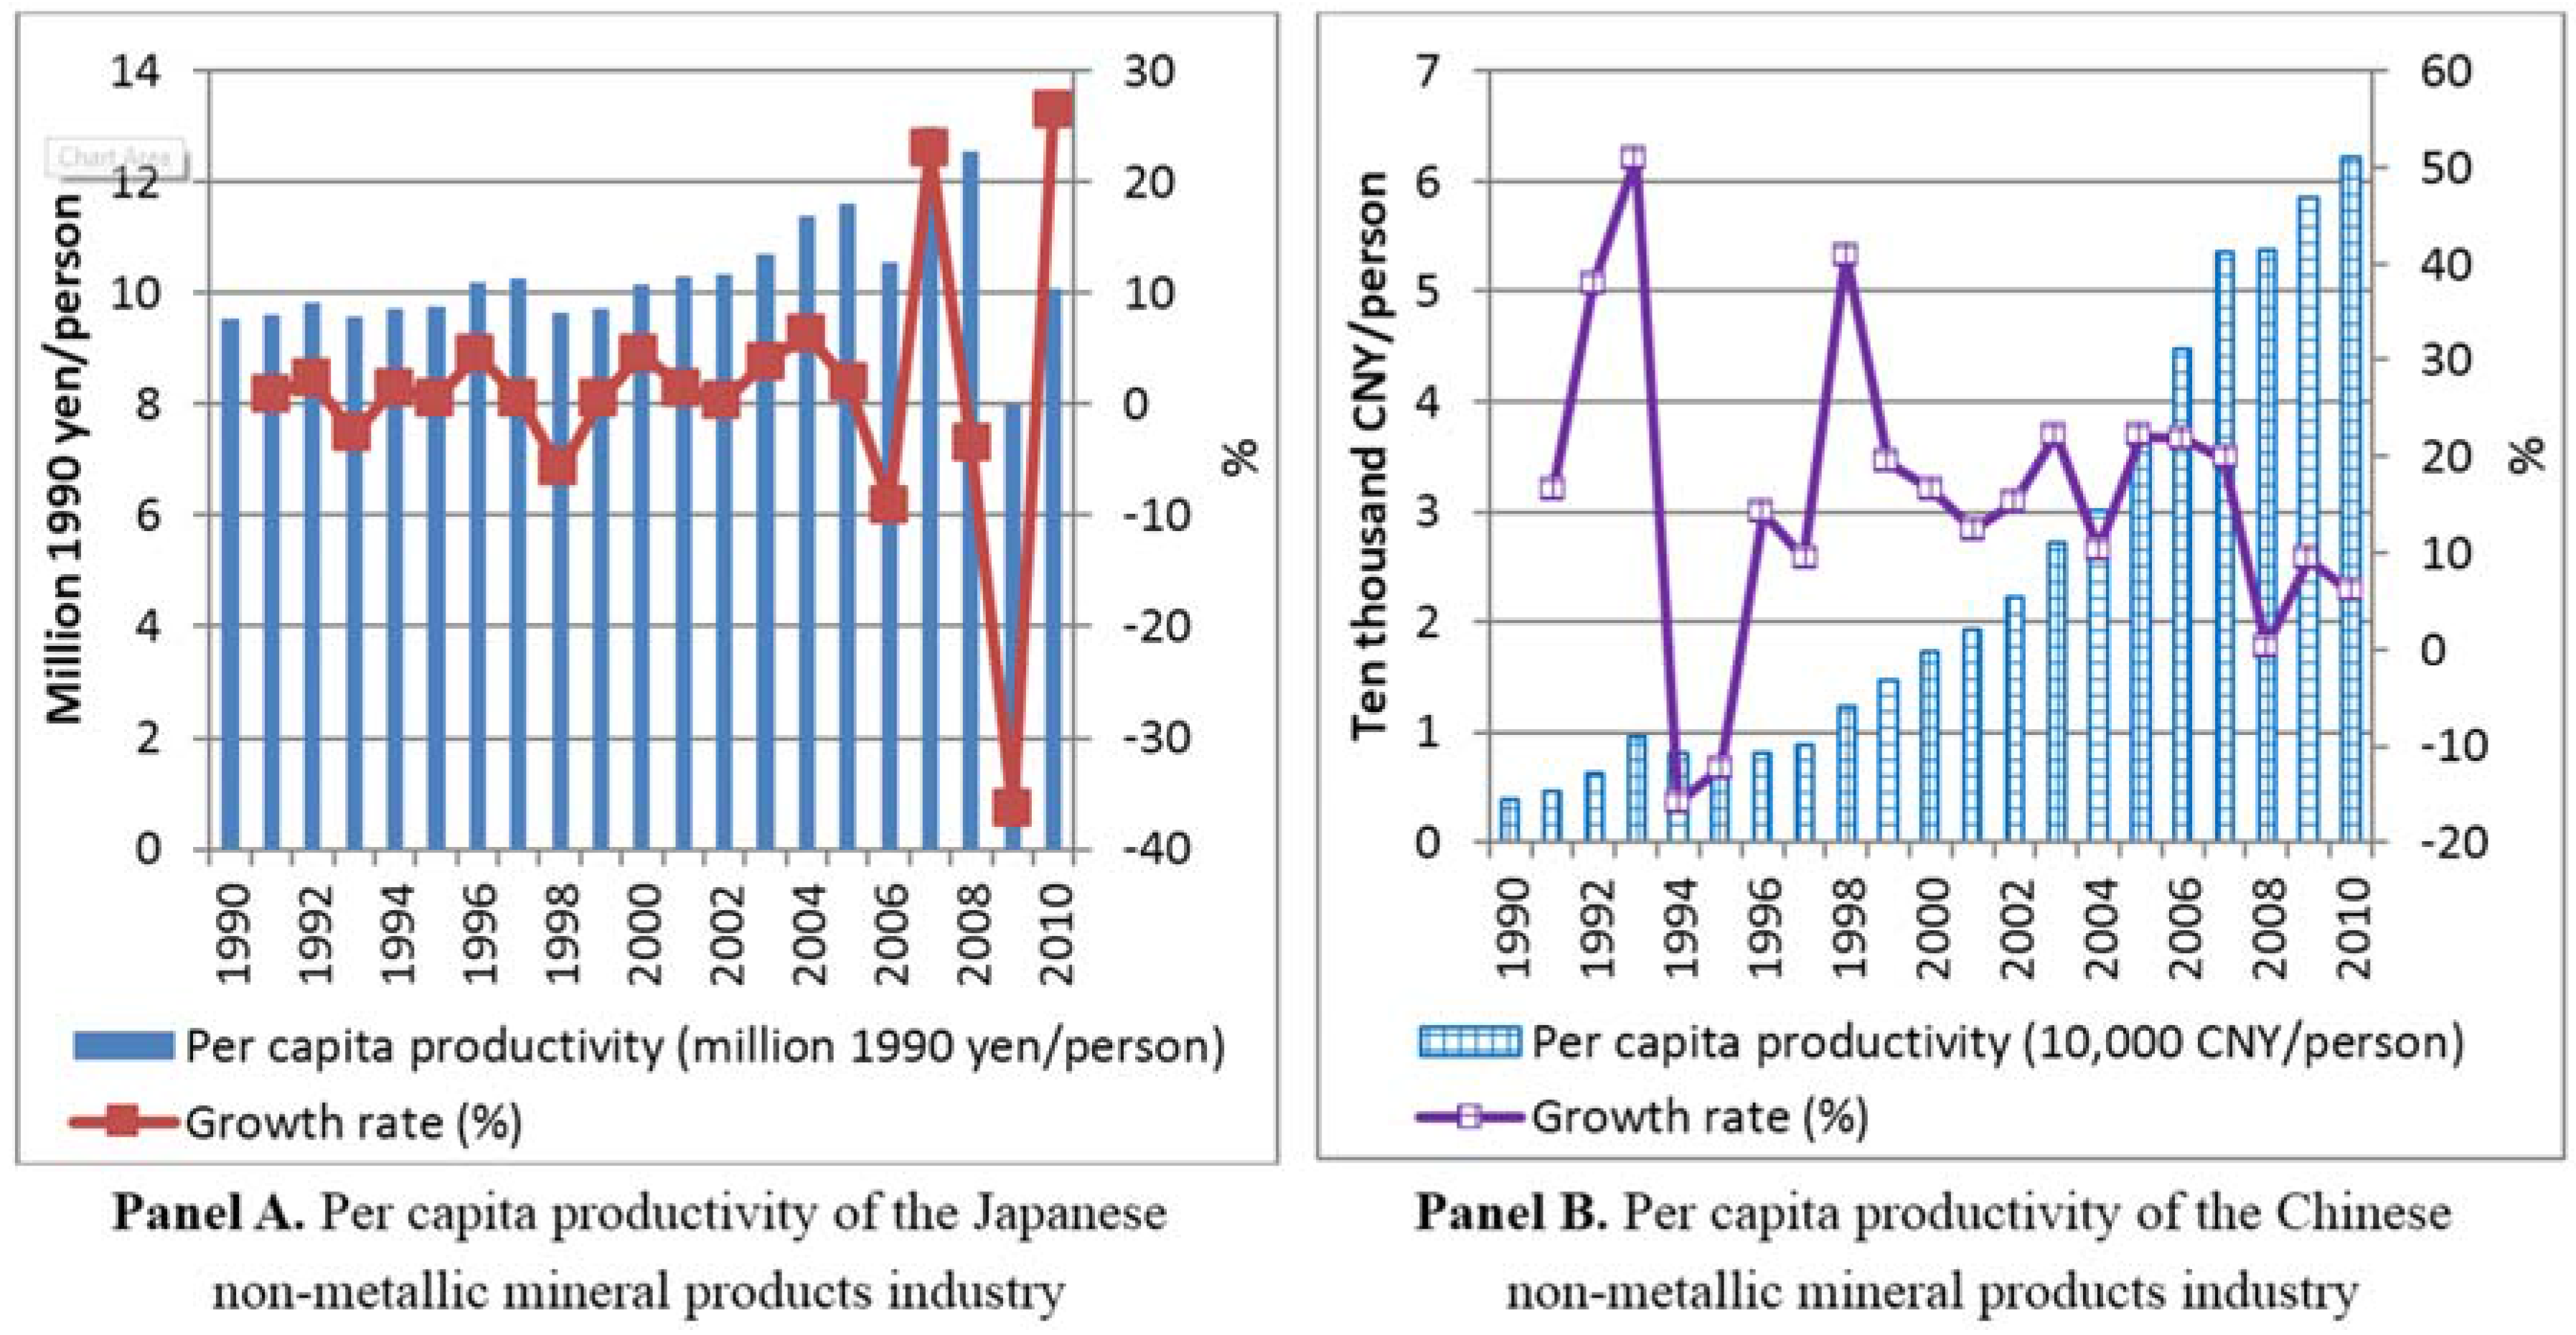
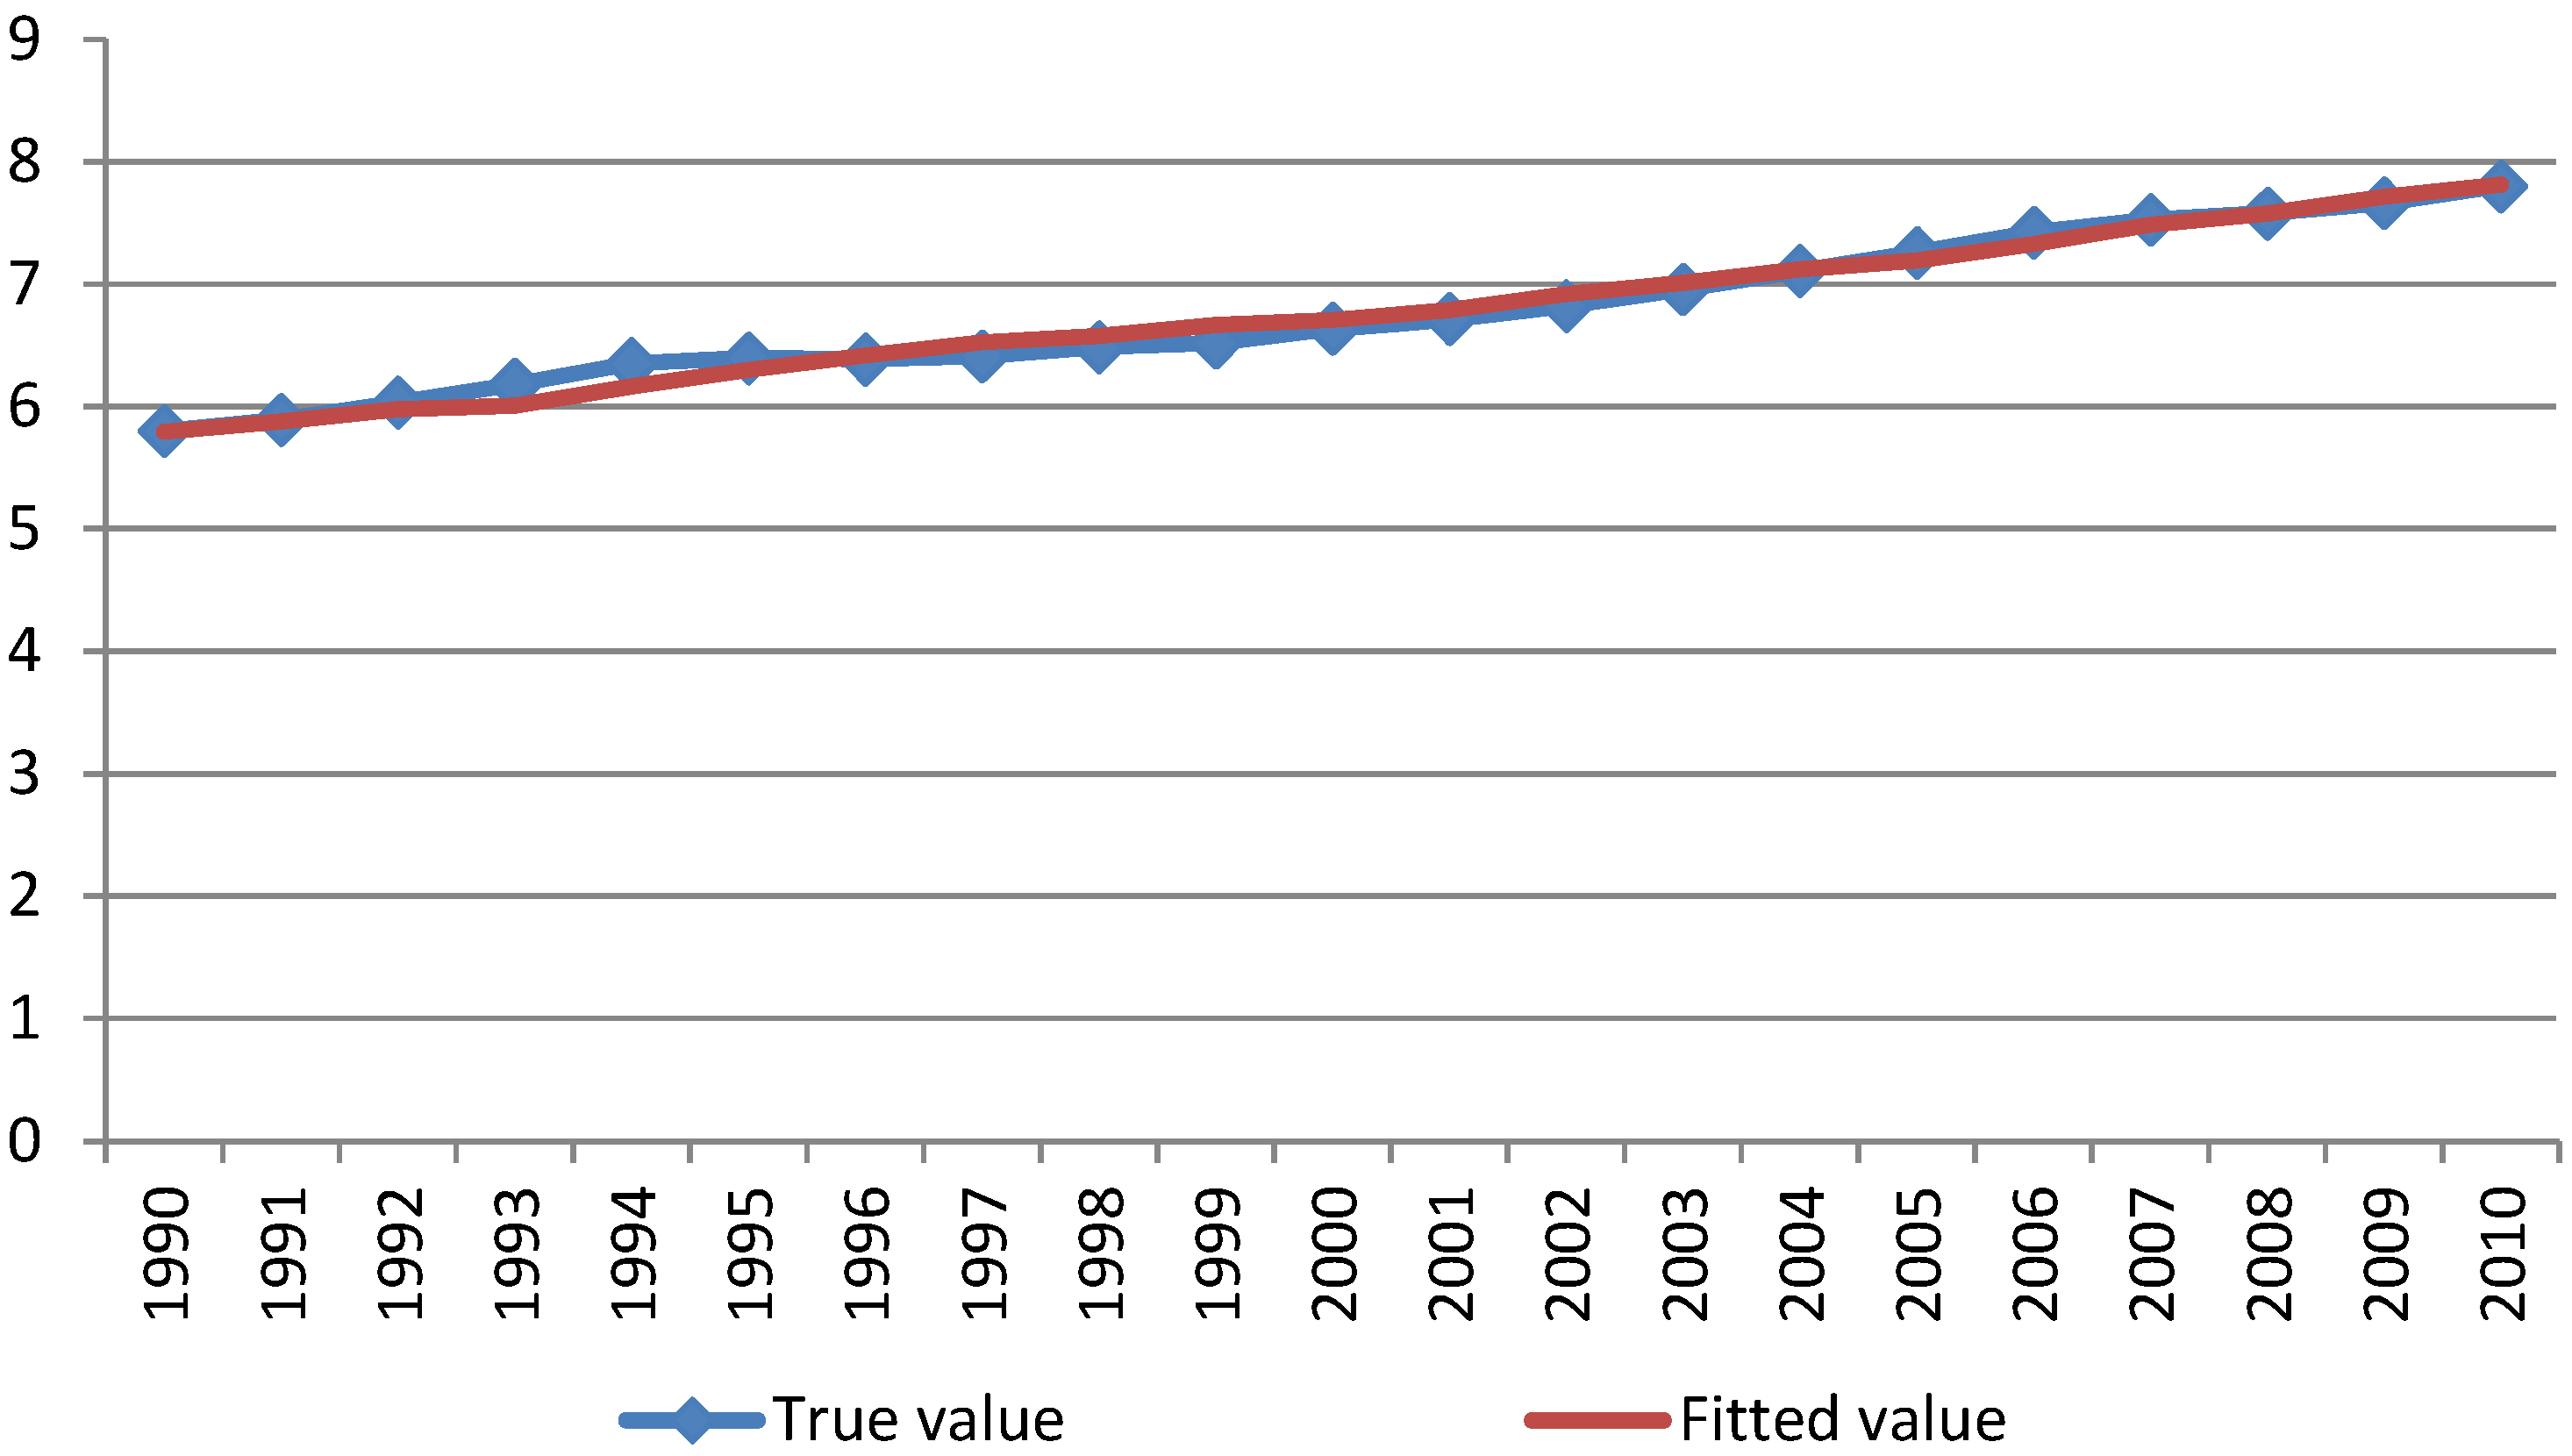
4.5. Per Capita Productivity (/)
5. Results and Discussion
5.1. Results of the Unit-Root Test
| Series | Level | First Difference | Second Difference | |||
|---|---|---|---|---|---|---|
| ADF | PP | ADF | PP | ADF | PP | |
| LNQJ | 1.1311 | 0.5152 | −4.9569 *** | −5.3006 *** | −5.7623 *** | −6.1252 *** |
| LNEGJ | −1.2334 | −1.7143 | 1.5763 | 0.0232 | −5.4226 *** | −4.9489 *** |
| LNIAJ | −0.8445 | −1.0175 | −5.4582 *** | −7.4310 *** | −6.4063 *** | −4.9137 *** |
| LNPCPJ | −0.8889 | −3.3509 * | −8.5866 *** | −8.7428 *** | −13.1735 *** | −9.2960 *** |
| LNPJ | −0.8249 | −0.6669 | −3.5487 ** | −5.0048 *** | −6.2832 *** | −11.7678 *** |
| LNRIJ | −3.8770 *** | −2.4852 | −4.7318 *** | −5.1346 *** | −3.2524 ** | −7.8020 *** |
| Series | Level | First Difference | Second Difference | |||
|---|---|---|---|---|---|---|
| ADF | PP | ADF | PP | ADF | PP | |
| LNQC | 0.4862 | 0.1156 | −2.2874 | −2.2874 | −4.1693 *** | −4.2109 *** |
| LNEGC | −0.7708 | −0.4969 | −2.0625 | −2.2175 | −4.8386 *** | −4.8550 *** |
| LNIAC | −0.2148 | −0.2148 | −3.6329 * | −2.9535 * | −2.2096 | −7.4610 *** |
| LNPCPC | −0.8644 | −0.8885 | −3.4667 ** | −3.4668 * | −5.3574 *** | −7.4432 *** |
| LNPC | −2.6389 | −2.48 | −2.6288 | −2.5923 | −5.6489 *** | −5.6766 *** |
| LNRIC | −3.0982 ** | −3.1057 *** | −4.7255 *** | −4.9111 *** | −5.6494 *** | −18.362 *** |
5.2. Selection of the Lag Intervals for VAR Models
| Lag | LogL | LR | FPE | AIC | SC | HQ |
|---|---|---|---|---|---|---|
| 0 | 222.8412 | NA | 4.93E-18 | −22.8254 | −22.5271 | −22.7749 |
| 1 | 353.6276 | 165.2039 | 2.84E-22 | −32.8029 | −30.7152 | −32.4496 |
| 2 | 464.8284 | 70.23209 * | 5.22e-25 * | −40.71878 * | −36.84161 * | −40.06261 * |
| Lag | LogL | LR | FPE | AIC | SC | HQ |
|---|---|---|---|---|---|---|
| 0 | 72.67842 | NA | 3.61E-11 | −7.018781 | −6.720537 | −6.968306 |
| 1 | 219.7184 | 185.7347 | 3.76E-16 | −18.7072 | −16.61949 | −18.35387 |
| 2 | 359.5257 | 88.29938 * | 3.40e-20 * | −29.63429 * | −25.75711 * | −28.97811 * |
5.3. Johansen Cointegration Test
| Hypothesized No. of CE(s) | Eigenvalue | Trace Statistic | 0.05 Critical Value | Prob.** |
| None * | 0.999024 | 280.2414 | 103.8473 | 0 |
| At most 1 * | 0.922853 | 148.5401 | 76.97277 | 0 |
| At most 2 * | 0.888222 | 99.86129 | 54.07904 | 0 |
| At most 3 * | 0.814209 | 58.22769 | 35.19275 | 0 |
| At most 4 * | 0.640704 | 26.24817 | 20.26184 | 0.0066 |
| At most 5 | 0.300839 | 6.79961 | 9.164546 | 0.1374 |
| Hypothesized No. of CE(s) | Eigenvalue | Max-Eigen Statistic | 0.05 Critical Value | Prob.** |
| None * | 0.999024 | 131.7013 | 40.9568 | 0 |
| At most 1 * | 0.922853 | 48.67884 | 34.80587 | 0.0006 |
| At most 2 * | 0.888222 | 41.6336 | 28.58808 | 0.0006 |
| At most 3 * | 0.814209 | 31.97952 | 22.29962 | 0.0016 |
| At most 4 * | 0.640704 | 19.44856 | 15.8921 | 0.0132 |
| At most 5 | 0.300839 | 6.79961 | 9.164546 | 0.1374 |
| Hypothesized No. of CE(s) | Eigenvalue | Trace Statistic | 0.05 Critical Value | Prob.** |
| None * | 0.999984 | 363.1655 | 103.8473 | 0 |
| At most 1 * | 0.96277 | 152.7468 | 76.97277 | 0 |
| At most 2 * | 0.888088 | 90.22437 | 54.07904 | 0 |
| At most 3 * | 0.75748 | 48.61361 | 35.19275 | 0.0011 |
| At most 4 * | 0.529567 | 21.69687 | 20.26184 | 0.0315 |
| At most 5 | 0.321478 | 7.368928 | 9.164546 | 0.1083 |
| Hypothesized No. of CE(s) | Eigenvalue | Max-Eigen Statistic | 0.05 Critical Value | Prob.** |
| None * | 0.999984 | 210.4187 | 40.9568 | 0.0001 |
| At most 1 * | 0.96277 | 62.52239 | 34.80587 | 0 |
| At most 2 * | 0.888088 | 41.61075 | 28.58808 | 0.0007 |
| At most 3 * | 0.75748 | 26.91674 | 22.29962 | 0.0105 |
| At most 4 | 0.529567 | 14.32794 | 15.8921 | 0.0866 |
| At most 5 | 0.321478 | 7.368928 | 9.164546 | 0.1083 |
| LNQJ a | LNEGJ | LNIAJ | LNRIJ | LNPCPJ | LNPJ | CJ |
| 1 | −0.502227 | −1.923447 | 0.435954 | 3.984515 | 3.920969 | −2.856658 |
| (0.01202) | (0.03754) | (0.02208) | (0.03827) | (0.21894) | (0.30846) | |
| LNQC b | LNEGC | LNIAC | LNRIC | LNPCPC | LNPC | Cc |
| 1 | −1.546948 | −0.000245 | 0.138289 | 0.231137 | 0.355525 | 4.7116 |
| (0.00164) | (0.0005) | (0.00082) | (0.00085) | (0.00083) | (0.01078) |
5.4. Estimates of Electricity Demand and Conservation Potentials in China
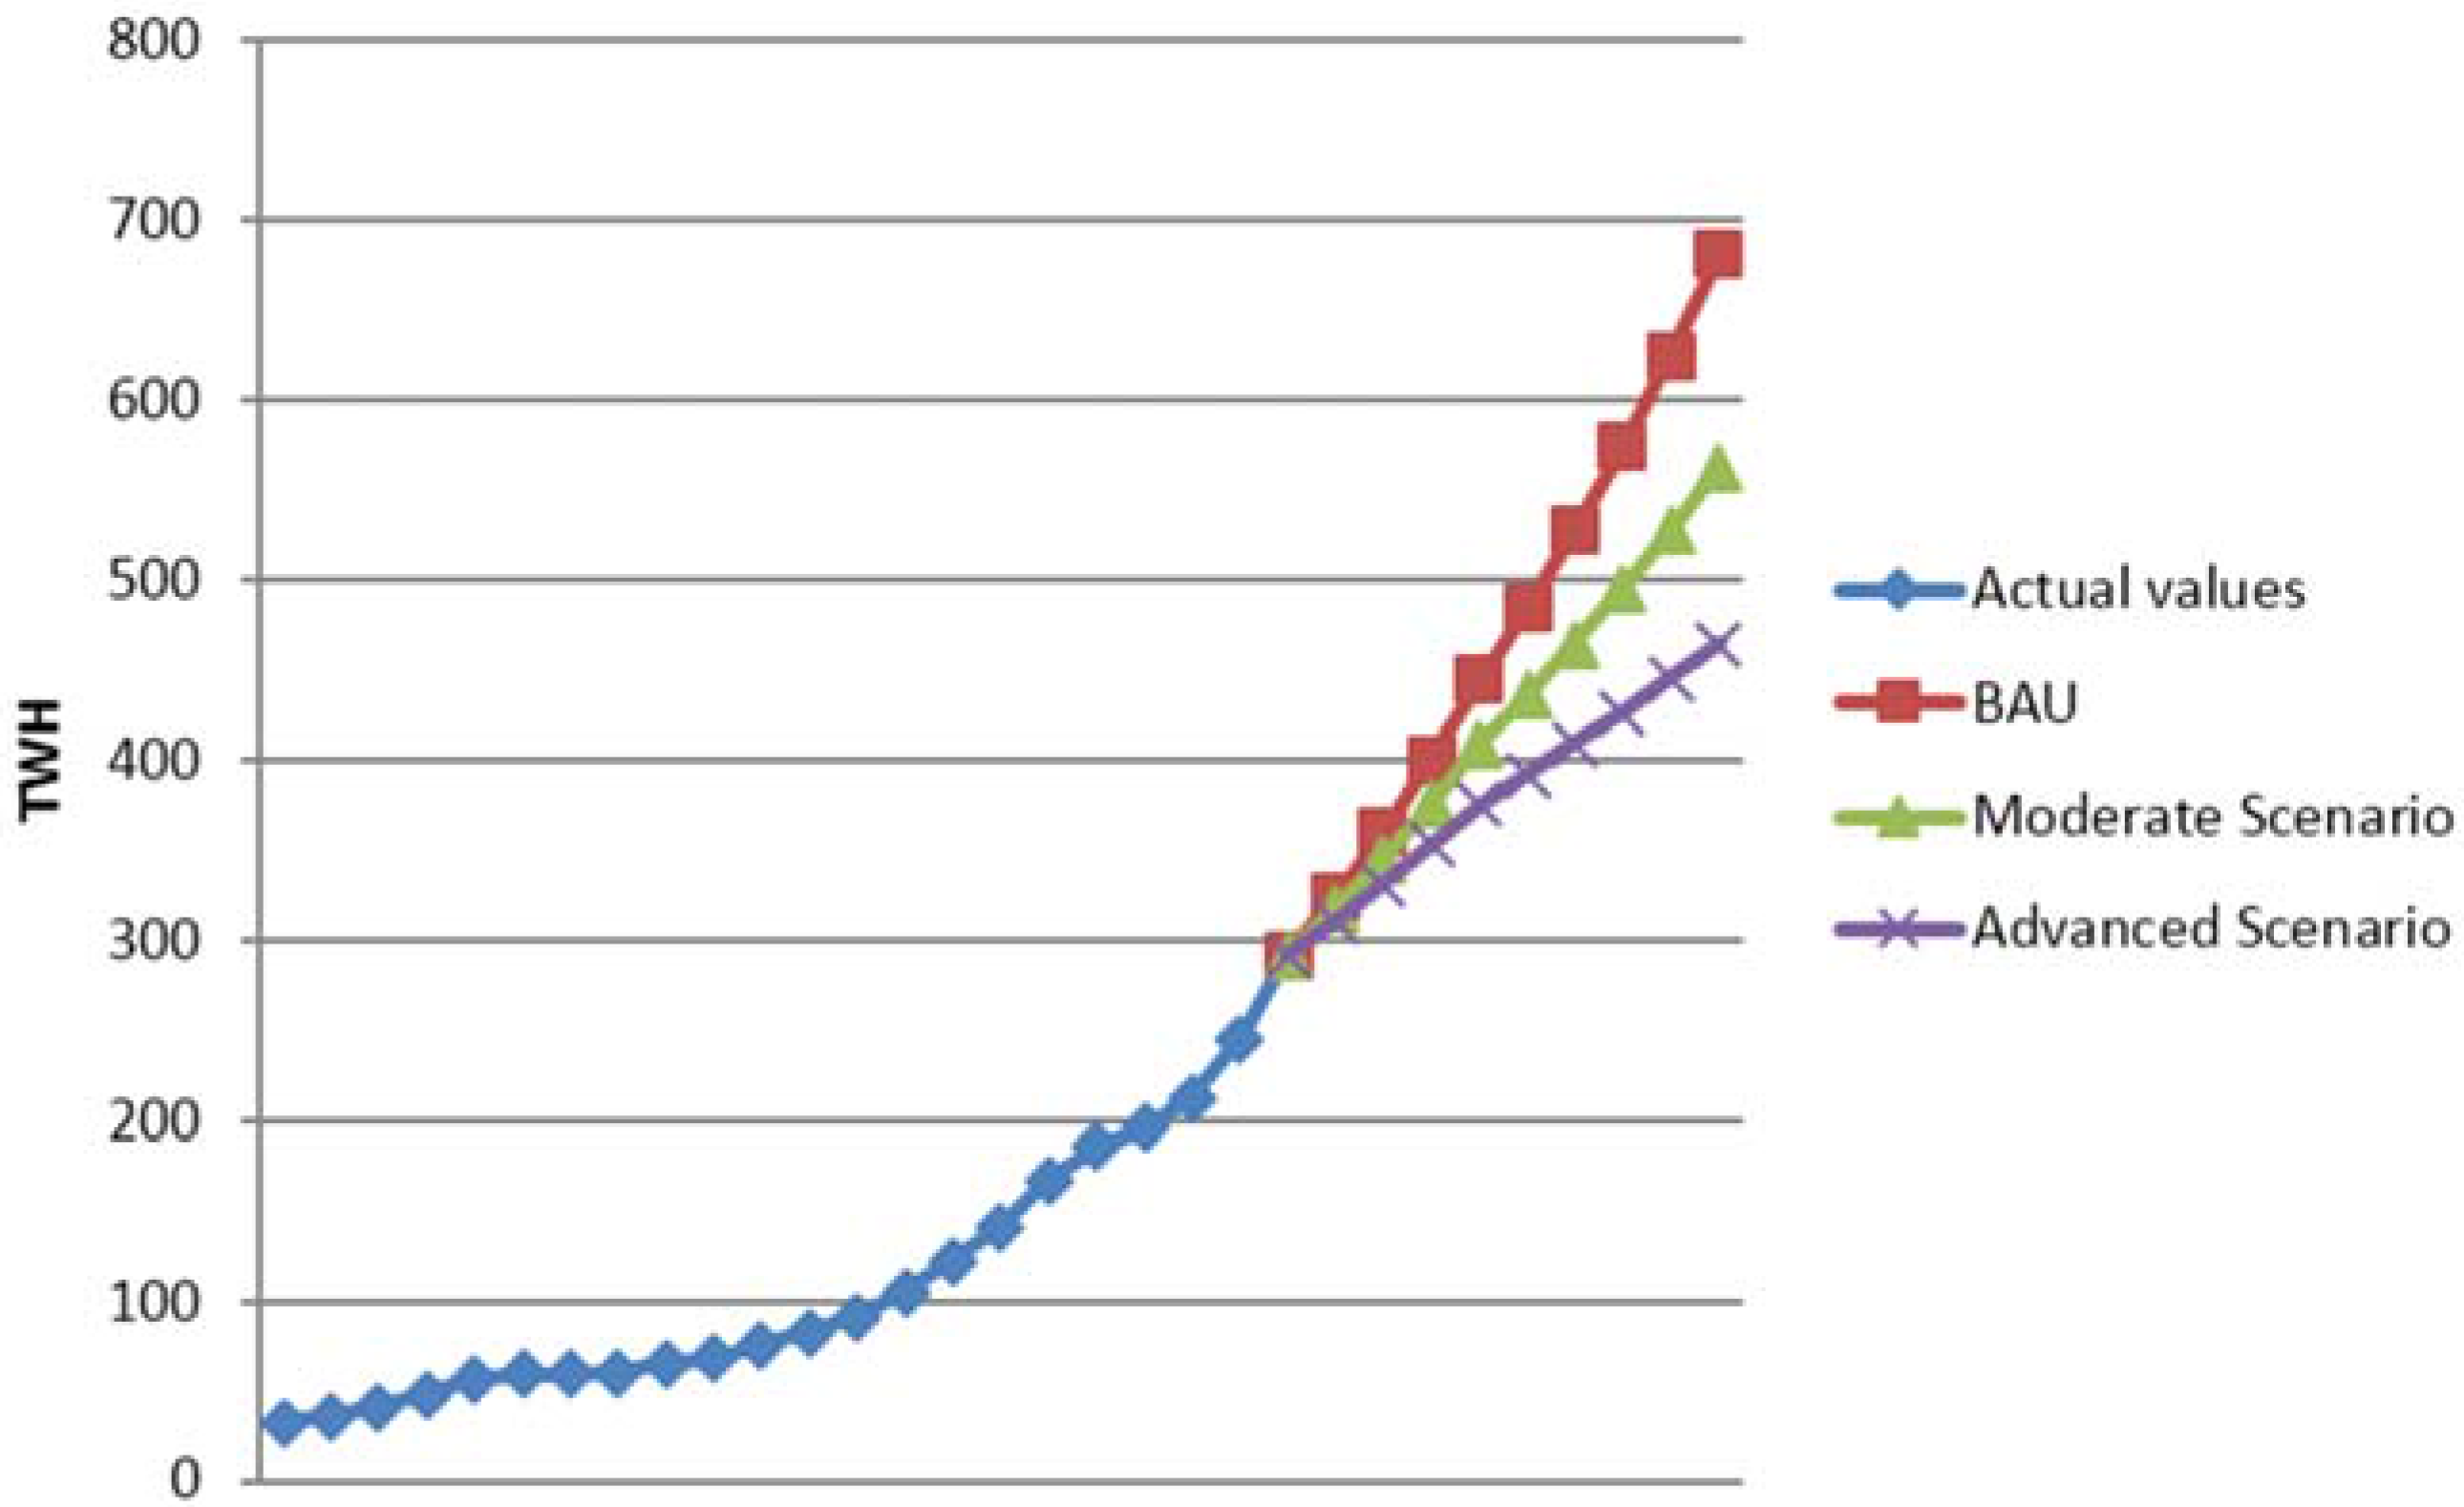
5.4.1. Estimates of Electricity Demand in the Chinese Non-Metallic Mineral Products Industry
| Variables | BAU (%) | The Moderate Scenario (%) | The Advanced Scenario (%) | |||
|---|---|---|---|---|---|---|
| 2012–2015 | 2016–2020 | 2012–2015 | 2016–2020 | 2012–2015 | 2016–2020 | |
| EGC | 9.3 | 8 | 8.3 | 7 | 7.3 | 6 |
| IAC | 15 | 12 | 13 | 10 | 11 | 8 |
| PCOC | 6 | 7 | 7 | 8 | 8 | 9 |
| PIC | 1 | 2 | 2 | 3 | 3 | 4 |
| PC | 5 | 4.5 | 6 | 5.5 | 7 | 6.5 |
| Year | BAU | The Moderate Scenario | The Advanced Scenario | |||
|---|---|---|---|---|---|---|
| Amount | Share | Amount | Share | Amount | Share | |
| (TWH) | (%) | (TWH) | (%) | (TWH) | (%) | |
| 2015 | 444.80 | 7.86 | 408.76 | 7.23 | 375.54 | 6.64 |
| 2020 | 680.53 | 9.04 | 562.27 | 7.47 | 464.28 | 6.17 |
5.4.2. Electricity Conservation Potentials
| Year | The Moderate Electricity-Saving Scenario | The Advanced Electricity-Saving Scenario | ||
|---|---|---|---|---|
| Electricity-Saving Amount | Impact on National Electricity Demand | Electricity-Saving Amount | Impact on National Electricity Demand | |
| 2015 | 36.04 TWh | 0.64% | 69.26 TWh | 1.22% |
| 2020 | 118.26 TWh | 1.57% | 216.25 TWh | 2.87% |
6. Conclusions and Policy Recommendations
Acknowledgments
Author Contributions
Conflicts of Interest
References
- CEIC China Database. Available online: http://ceicdata.securities.com/cdmWeb/ (accessed on 12 May 2015).
- Ouyang, X.; Lin, B. A projection of future electricity intensity and conservation potential in the Chinese building materials industry. Energy Build. 2014, 84, 268–276. [Google Scholar] [CrossRef]
- Wen, Z.; Xu, C.; Zhang, X. Integrated Control of Emission Reductions, Energy-Saving, and Cost-Benefit Using a Multi-Objective Optimization Technique in the Pulp and Paper Industry. Environ. Sci. Technol. 2015, 49, 3636–3643. [Google Scholar] [CrossRef] [PubMed]
- Wen, Z.; Chen, M.; Meng, F. Evaluation of energy saving potential in China’s cement industry using the Asian-Pacific Integrated Model and the technology promotion policy analysis. Energy Policy 2015, 77, 227–237. [Google Scholar] [CrossRef]
- Selvakkumaran, S.; Limmeechokchai, B.; Masui, T.; Hanaokab, T.; Matsuokac, Y. Low carbon society scenario 2050 in Thai industrial sector. Energy Convers. Manag. 2014, 85, 663–674. [Google Scholar] [CrossRef]
- Zhou, D.; Li, S.; David, K.T. The impact of FDI on the productivity of domestic firms: The case of China. Int. Bus. Rev. 2002, 11, 465–484. [Google Scholar] [CrossRef]
- Dees, S. Foreign direct investment in China: Determinants and effects. Econ. Plan. 1998, 31, 175–194. [Google Scholar] [CrossRef]
- Liu, X.; Buck, T. Innovation performance and channels for international technology spillovers: Evidence from Chinese high-tech industries. Res. Policy 2007, 36, 355–366. [Google Scholar] [CrossRef]
- Geller, H.S.; Goldemberg, J.; Roberto Moreira, J.; Hukai, R.; Scarpinella, C.; Ysohizawa, M. Electricity conservation in Brazil: Potential and progress. Energy 1988, 13, 469–483. [Google Scholar] [CrossRef]
- Jaccard, M.; Nyboer, J.; Fogwill, A. How big is the electricity conservation potential in industry? Energy J. 1993, 14, 139–156. [Google Scholar] [CrossRef]
- Hong, G.B.; Su, T.L.; Lee, J.D.; Hsu, T.C.; Chen, H.W. Energy conservation potential in Taiwanese textile industry. Energy Policy 2010, 38, 7048–7053. [Google Scholar] [CrossRef]
- Lu, S.M.; Lu, C.; Tseng, K.T.; Chen, F.; Chen, C.L. Energy-saving potential of the industrial sector of Taiwan. Renew. Sustain. Energy Rev. 2013, 21, 674–683. [Google Scholar] [CrossRef]
- Su, T.L.; Hung, C.Y.; Hong, G.B. The status of energy conservation in Taiwan’s cement industry. Energy Policy 2013, 60, 481–486. [Google Scholar] [CrossRef]
- Zhou, P.; Ang, B.W.; Poh, K.L. A survey of data envelopment analysis in energy and environmental studies. Eur. J. Oper. Res. 2008, 189, 1–18. [Google Scholar] [CrossRef]
- Charnes, A.; Cooper, W.W.; Rhodes, E. Measuring the efficiency of decision making units. Eur. J. Oper. Res. 1978, 3, 392–444. [Google Scholar] [CrossRef]
- Mukherjee, K. Energy use efficiency in the Indian manufacturing sector: An interstate analysis. Energy Policy 2008, 36, 662–672. [Google Scholar] [CrossRef]
- Mukherjee, K. Measuring energy efficiency in the context of an emerging economy: The case of Indian manufacturing. Eur. J. Oper. Res. 2010, 201, 933–941. [Google Scholar] [CrossRef]
- Yadav, V.K.; Padhy, N.P.; Gupta, H.O. A micro level study of an Indian electric utility for efficiency enhancement. Energy 2010, 35, 4053–4063. [Google Scholar] [CrossRef]
- Wen, Z.; Li, H. Analysis of potential energy conservation and CO2 emissions reduction in China’s non-ferrous metals industry from a technology perspective. Int. J. Greenh. Gas Control 2014, 28, 45–56. [Google Scholar] [CrossRef]
- Wen, Z.; Meng, F.; Chen, M. Estimates of the potential for energy conservation and CO2 emissions mitigation based on Asian-Pacific integrated model (AIM): The case of the iron and steel industry in China. J. Clean. Prod. 2014, 65, 120–130. [Google Scholar] [CrossRef]
- Wen, Z.; Zhang, X.; Chen, J.; Tan, Q.; Zhang, X. Forecasting CO2 Mitigation and Policy Options for China’s Key Sectors in 2010–2030. Energy Environ. 2014, 25, 635–660. [Google Scholar] [CrossRef]
- Meier, A.; Rosenfeld, A.H.; Wright, J. Supply curves of conserved energy for California’s residential sector. Energy 1982, 7, 347–358. [Google Scholar] [CrossRef]
- Hasanbeigi, A.; Morrow, W.; Sathaye, J.; Masanet, E.; Xu, T.F. A bottom-up model to estimate the energy efficiency improvement and CO2 emission reduction potentials in the Chinese iron and steel industry. Energy 2013, 50, 315–325. [Google Scholar] [CrossRef]
- Hasanbeigi, A.; Price, L.; Hongyou, L.; Lan, W. Analysis of energy-efficiency opportunities for the cement industry in Shandong Province, China: A case-study of sixteen cement plants. Energy 2010, 35, 3461–3473. [Google Scholar] [CrossRef]
- Hasanbeigi, A.; Menke, C.; Therdyothin, A. The use of conservation supply curves in energy policy and economic analysis: The case study of Thai cement industry. Energy Policy 2010, 38, 392–405. [Google Scholar] [CrossRef]
- Huntington, H.G. The impact of sectoral shifts in industry on US energy demands. Energy 1989, 14, 363–372. [Google Scholar] [CrossRef]
- Worrell, E.; Martin, N.; Price, L. Potentials for energy efficiency improvement in the US cement industry. Energy 2000, 25, 1189–1214. [Google Scholar] [CrossRef]
- Erdogdu, E. Electricity demand analysis using cointegration and ARIMA modelling: A case study of Turkey. Energy Policy 2007, 35, 1129–1146. [Google Scholar] [CrossRef]
- Engle, R.F.; Granger, C.W.J.; Hallman, J.J. Merging short-and long-run forecasts: An application of seasonal cointegration to monthly electricity sales forecasting. J. Econ. 1989, 40, 45–62. [Google Scholar] [CrossRef]
- Hunt, L.C.; Manning, D.N. Energy price- and income-elasticities of demand: Some estimates for the UK using the cointegration procedure. Scott. J. Polit. Econ. 1989, 36, 183–193. [Google Scholar] [CrossRef]
- Bentzen, J.; Engsted, T. Short- and long-run elasticities in energy demand: A cointegration approach. Energy Econ. 1993, 15, 9–16. [Google Scholar] [CrossRef]
- Dergiades, T.; Tsoulfidis, L. Estimating residential demand for electricity in the United States, 1965–2006. Energy Econ. 2008, 30, 2722–2730. [Google Scholar] [CrossRef]
- He, X.P.; Liu, X.Y.; Lin, Y.P. China’s electricity demand forecast under urbanization process. Econ. Res. J. 2009, 1, 118–130. [Google Scholar]
- Athukorala, P.P.A.; Wilson, C. Estimating short and long-term residential demand for electricity: New evidence from Sri Lanka. Energy Econ. 2010, 32, S34–S40. [Google Scholar] [CrossRef]
- El-Shazly, A. Electricity demand analysis and forecasting: A panel cointegration approach. Energy Econ. 2013, 40, 251–258. [Google Scholar] [CrossRef]
- Lin, B.; Wu, Y.; Zhang, L. Estimates of the potential for energy conservation in the Chinese steel industry. Energy Policy 2011, 39, 3680–3689. [Google Scholar] [CrossRef]
- Lin, B.; Ouyang, X. Electricity demand and conservation potential in the Chinese nonmetallic mineral products industry. Energy Policy 2014, 68, 243–253. [Google Scholar] [CrossRef]
- Engle, R.F. Granger, C.W.J. Cointegration and error correction: Representation, estimation and testing. Econometrica 1987, 55, 251–276. [Google Scholar] [CrossRef]
- Dickey, D.A.; Fuller, W.A. Distribution of the estimators for autoregressive time series with a unit root. J. Am. Stat. Assoc. 1979, 74, 427–431. [Google Scholar]
- Phillips, P.C.B.; Perron, P. Testing for a unit root in time series regression. Biometrica 1988, 75, 335–346. [Google Scholar] [CrossRef]
- Johansen, S.; Juselius, K. Maximum likelihood estimation and inferences on cointegration with applications to the demand for money. Oxf. Bull. Econ. Stat. 1990, 52, 169–210. [Google Scholar] [CrossRef]
- Johansen, S. Likelihood-Based Inference in Cointegrated Vector Autoregressive Models; Oxford University Press: Oxford, UK, 1995. [Google Scholar]
- Japan Statistical Yearbook 1990–2011. Available online: http://www.stat.go.jp/english/S (accessed on 12 May 2015).
- National Bureau of Statistics of China. China Statistical Yearbook; China Statistics Press: Beijing, China, 1991–2011. Available online: http://www.stats.gov.cn/tjsj/ndsj/ (accessed on 12 May 2015).
- National Bureau of Statistics of China and Ministry of Science and Technology of China. China Statistical Yearbook on Science and Technology; China Statistics Press: Beijing, China, 1990–2011. Available online: http://tongji.cnki.net/kns55/navi/HomePage.aspx?id=N2013010081&name=YBVCX&floor=1 (accessed on 12 May 2015).
- Kraft, J.; Kraft, A. On the relationship between energy and GNP. J. Energy Dev. 1978, 3, 401–403. [Google Scholar]
- Asafu-Adjaye, J. The relationship between energy consumption, energy prices and economic growth: Time series evidence from Asian developing countries. Energy Econ. 2000, 22, 615–625. [Google Scholar] [CrossRef]
- Al-Iriani, M.A. Energy-GDP relationship revisited: An example from GCC countries using panel causality. Energy Policy 2006, 34, 3342–3350. [Google Scholar] [CrossRef]
- Ozturk, I.; Aslan, A.; Kalyoncu, H. Energy consumption and economic growth relationship: Evidence from panel data for low and middle income countries. Energy Policy 2010, 38, 4422–4428. [Google Scholar] [CrossRef]
- Tang, C.F.; Tan, E.C. Exploring the nexus of electricity consumption, economic growth, energy prices and technology innovation in Malaysia. Appl. Energy 2013, 104, 297–305. [Google Scholar] [CrossRef]
- Herrerias, M.J.; Joyeux, R.; Girardin, E. Short-and long-run causality between energy consumption and economic growth: Evidence across regions in China. Appl. Energy 2013, 112, 1483–1492. [Google Scholar] [CrossRef]
- Steenhof, P.A. Decomposition of electricity demand in China’s industrial sector. Energy Econ. 2006, 28, 370–384. [Google Scholar] [CrossRef]
- Liu, L.C.; Fan, Y.; Wu, G.; Wei, Y.M. Using LMDI method to analyze the change of China’s industrial CO2 emissions from final fuel use: An empirical analysis. Energy Policy 2007, 35, 5892–5900. [Google Scholar] [CrossRef]
- Cole, M.A.; Elliott, R.J.; Wu, S. Industrial activity and the environment in China: An industry-level analysis. China Econ. Rev. 2008, 19, 393–408. [Google Scholar] [CrossRef]
- Lin, B.Q. Energy Shortage in China: A rethinking; Science Press: Beijing, China, 2012. [Google Scholar]
- Elkhafif, M.A. Estimating disaggregated price elasticities in industrial energy demand. Energy J. 1992, 13, 209–218. [Google Scholar] [CrossRef]
- Yuan, C.; Liu, S.; Wu, J. The relationship among energy prices and energy consumption in China. Energy Policy 2010, 38, 197–207. [Google Scholar] [CrossRef]
- Lin, B.; Zhang, L.; Wu, Y. Evaluation of electricity saving potential in China’s chemical industry based on cointegration. Energy Policy 2012, 44, 320–330. [Google Scholar] [CrossRef]
- Lin, B.; Ouyang, X. A revisit of fossil-fuel subsidies in China: Challenges and opportunities for energy price reform. Energy Convers. Manag. 2014, 82, 124–134. [Google Scholar] [CrossRef]
- Lin, B.; Jiang, Z. Estimates of energy subsidies in China and impact of energy subsidy reform. Energy Econ. 2011, 33, 273–283. [Google Scholar] [CrossRef]
- Deeds, D.L. The role of R&D intensity, technical development and absorptive capacity in creating entrepreneurial wealth in high technology start-ups. J. Eng. Technol. Manag. 2001, 18, 29–47. [Google Scholar]
- Nordhaus, W.D. Modelling Induced Innovation in Climate Change Policy; Grubler, A., Ed.; Resources for the Future Press: Washington, DC, USA, 2002. [Google Scholar]
- Ogawa, K. Debt, R&D investment and technological progress: A panel study of Japanese manufacturing firms’ behavior during the 1990s. J. Jpn. Int. Econ. 2007, 21, 403–423. [Google Scholar]
- Wakelin, K. Productivity growth and R&D expenditure in UK manufacturing firms. Res. Policy 2001, 30, 1079–1090. [Google Scholar]
- Scherer, F.M. Industrial Market Structure and Economic Performance, 2nd ed.; Rand McNally: Chicago, IL, USA, 1980. [Google Scholar]
- Audretsch, D.B.; Feldman, M.P. R&D spillovers and the geography of innovation and production. Am. Econ. Rev. 1996, 86, 630–640. [Google Scholar]
- Mueller-Fuerstenberger, G.; Stephan, G. Integrated assessment of global climate change with learning-by-doing and energy-related research and development. Energy Policy 2007, 35, 5298–5309. [Google Scholar] [CrossRef]
- Grossman, G.M.; Helpman, E. Endogenous innovation in the theory of growth. Natl. Bur. Econ. Res. 1993, 8, 23–44. [Google Scholar]
- Liang, Q.M.; Fan, Y.; Wei, Y.M. The effect of energy end-use efficiency improvement on China’s energy use and CO2 emissions: A CGE model-based analysis. Energy Effic. 2009, 2, 243–262. [Google Scholar] [CrossRef]
- Lin, B.; Wang, X. Promoting energy conservation in China’s iron & steel sector. Energy 2014, 73, 465–474. [Google Scholar]
- Goel, R.K.; Ram, R. Irreversibility of R&D investment and the adverse effect of uncertainty: Evidence from the OECD countries. Econ. Lett. 2001, 71, 287–291. [Google Scholar]
- Kothari, S.P.; Laguerre, T.E.; Leone, A.J. Capitalization vs. expensing: Evidence on the uncertainty of future earnings from capital expenditures vs. R&D outlays. Rev. Account. Stud. 2002, 7, 355–382. [Google Scholar]
- Griliches, Z. Returns to research and development expenditures in the private sector. In New Developments in Productivity Measurement; Kendrick, J.W., Vaccara, B.N., Eds.; University of Chicago Press: Chicago, IL, USA, 1980; pp. 419–462. [Google Scholar]
- Bala Subrahmanya, M.H. Labour productivity, energy intensity and economic performance in small enterprises: A study of brick enterprises cluster in India. Energy Convers. Manag. 2006, 47, 763–777. [Google Scholar] [CrossRef]
- MacKinnon, J.G.; Haug, A.A.; Michelis, L. Numerical distribution functions of likelihood ratio tests for cointegration. J. Appl. Econ. 1999, 14, 563–577. [Google Scholar] [CrossRef]
- Phillips, P.C.B. Time series regression with a unit root. Econom. J. Econom. Soc. 1987, 55, 277–301. [Google Scholar] [CrossRef]
- Hendry, D.F.; Juselius, K. Explaining cointegration analysis: Part II. Energy J. 2001, 22, 75–120. [Google Scholar] [CrossRef]
- Bazilian, M.; Nussbaumer, P.; Rogner, H.H.; Brew-Hammond, A.; Foster, V.; Pachauri, S.; Williams, E.; Howells, M.; Niyongabo, P.; Musabah, L.; et al. Energy access scenarios to 2030 for the power sector in sub-Saharan Africa. Util. Policy 2012, 20, 1–16. [Google Scholar] [CrossRef]
- Ma, L.; Fu, F.; Li, Z.; Liu, P. Oil development in China: Current status and future trends. Energy Policy 2012, 45, 43–53. [Google Scholar] [CrossRef]
- Zhang, H.; Wen, Z.G. Residents’ Household Solid Waste (HSW) Source Separation Activity: A Case Study of Suzhou, China. Sustainability 2014, 6, 6446–6466. [Google Scholar] [CrossRef]
- Ou, X.; Zhang, X.; Chang, S. Scenario analysis on alternative fuel/vehicle for China’s future road transport: Life-cycle energy demand and GHG emissions. Energy Policy 2010, 38, 3943–3956. [Google Scholar] [CrossRef]
- IEA. World Energy Outlook 2012; OECD: Paris, France, 2012. [Google Scholar]
- Zhang, Q.; Ishihara, K.N.; Mclellan, B.C.; Tezuka, T. Scenario analysis on future electricity supply and demand in Japan. Energy 2012, 38, 376–385. [Google Scholar] [CrossRef]
- The World Bank. China 2030: Building a Modern, Harmonious, and Creative High-Income Society; The World Bank: Washington, DC, USA, 2012. [Google Scholar]
- Lin, B.; Ouyang, X. Analysis of energy-related CO2 (carbon dioxide) emissions and reduction potential in the Chinese non-metallic mineral products industry. Energy 2014, 68, 688–697. [Google Scholar] [CrossRef]
- The Central People’s Government. The 12th Five-Year (2011–2015) Plan for China’s Building Materials Industry. 2011. Available online: http://www.gov.cn/gzdt/att/att/site1/20111129/001e3741a2cc103e75b901.pdf (assessed on 21 August 2013). [Google Scholar]
- Denison, E.F. Explanations of Declining Productivity Growth (No. 354); The Brookings Institution: Washington, DC, USA, 1979. [Google Scholar]
- US Energy Information Administration (EIA). International Energy Statistics. In Total Electricity Net Consumption (Billion Kilowatthours); EIA: Paris, France, 2013. [Google Scholar]
- International Energy Agency (IEA). Key World Energy Statistics; OECD: Paris, France, 2012. [Google Scholar]
© 2015 by the authors; licensee MDPI, Basel, Switzerland. This article is an open access article distributed under the terms and conditions of the Creative Commons Attribution license (http://creativecommons.org/licenses/by/4.0/).
Share and Cite
Du, G.; Sun, C. Determinants of Electricity Demand in Nonmetallic Mineral Products Industry: Evidence from a Comparative Study of Japan and China. Sustainability 2015, 7, 7112-7136. https://doi.org/10.3390/su7067112
Du G, Sun C. Determinants of Electricity Demand in Nonmetallic Mineral Products Industry: Evidence from a Comparative Study of Japan and China. Sustainability. 2015; 7(6):7112-7136. https://doi.org/10.3390/su7067112
Chicago/Turabian StyleDu, Gang, and Chuanwang Sun. 2015. "Determinants of Electricity Demand in Nonmetallic Mineral Products Industry: Evidence from a Comparative Study of Japan and China" Sustainability 7, no. 6: 7112-7136. https://doi.org/10.3390/su7067112
APA StyleDu, G., & Sun, C. (2015). Determinants of Electricity Demand in Nonmetallic Mineral Products Industry: Evidence from a Comparative Study of Japan and China. Sustainability, 7(6), 7112-7136. https://doi.org/10.3390/su7067112