
Vulnerability Analysis of Urban Rail Transit Networks: A Case Study of Shanghai, China

Abstract
:1. Introduction
2. Model Descriptions
2.1. Construction of Urban Rail Transit Networks
- (1)
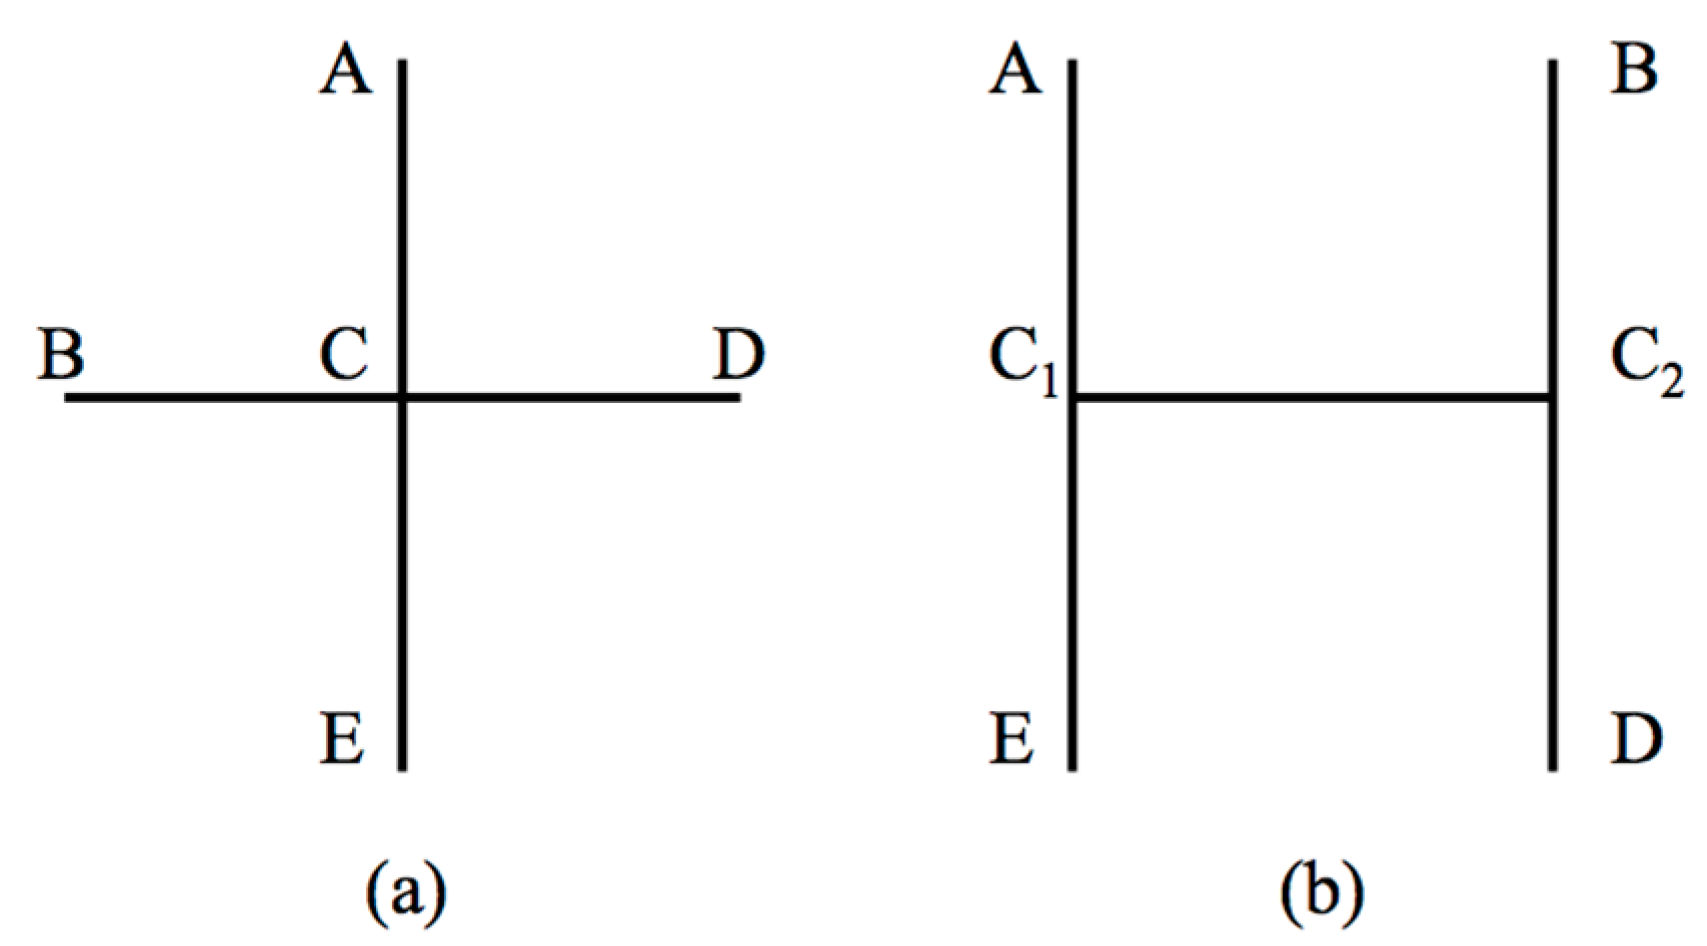
- Each interchange station (with degree as Di) is divided into Di/2 virtual nodes. These virtual nodes, connecting with each other, belong to separate metro lines, and the related network adjacency matrix can then be obtained.
- (2)
- Input: the network adjacency matrix, including node names (virtual nodes that belong to one interchange station have the same node name vi) and other parameters.
- (3)
- Calculate the shortest paths based on the expanding network adjacency matrix with the Floyd algorithm [26] and obtain the corresponding matrix.
- (4)
- For all paths, whose origins or destinations have the same node name vi (the same interchange station), find the shortest path, and delete the others. In Figure 1b, for example, OD pair A-C has two paths, A-C1 and A-C2, with lengths of one and two, respectively, and consequently, the longer path A-C2 was deleted. Similarly, the paths E-C2, B-C1, D-C1, C1-D, C1-B, C2-E and C2-A were also removed.
- (5)
- Each interchange station is divided into several virtual nodes to consider the interchange effort. Paths between these nodes need to be deleted, as they do not exist in reality. For example, C1-C2 and C2-C1 in Figure 1b are removed as C1 and C2 denote the same interchange station.
- (6)
- Output: the shortest path (lij) between any two stations vi and vj in the network.
2.2. Vulnerability Evaluation Model
2.2.1. Topological Vulnerability
2.2.2. Functional Vulnerability
2.2.3. Station Vulnerability
3. Case Study of Shanghai Metro
3.1. Basic Network Information

| Station Ranking Based on Node Degree (Di) | Station Ranking Based on Node Betweenness (Bi) | ||||
|---|---|---|---|---|---|
| No. | Di | Station Name | No. | Bi | Station Name |
| 1 | 8 | Century Avenue | 1 | 19,114 | Caoyang Road |
| 2 | 6 | Xujiahui | 2 | 18,738 | Xujiahui |
| 3 | 6 | People’s Square | 3 | 18,566 | Century Avenue |
| 4 | 5 | Oriental Sports Center | 4 | 18,180 | Zhenping Road |
| 5 | 5 | Yishan Road | 5 | 17,848 | People’s Square |
| 6 | 4 | South Shaanxi Road | 6 | 17,574 | Shanghai Railway Station |
| 7 | 4 | Changshu Road | 7 | 14,206 | Baoshan Road |
| 8 | 4 | Shanghai Railway Station | 8 | 13,556 | Oriental Sports Center |
| 9 | 4 | Shanghai Indoor Stadium | 9 | 12,868 | Hailun Road |
| 10 | 4 | Zhaojiabang Road | 10 | 12,560 | Zhongtan Road |
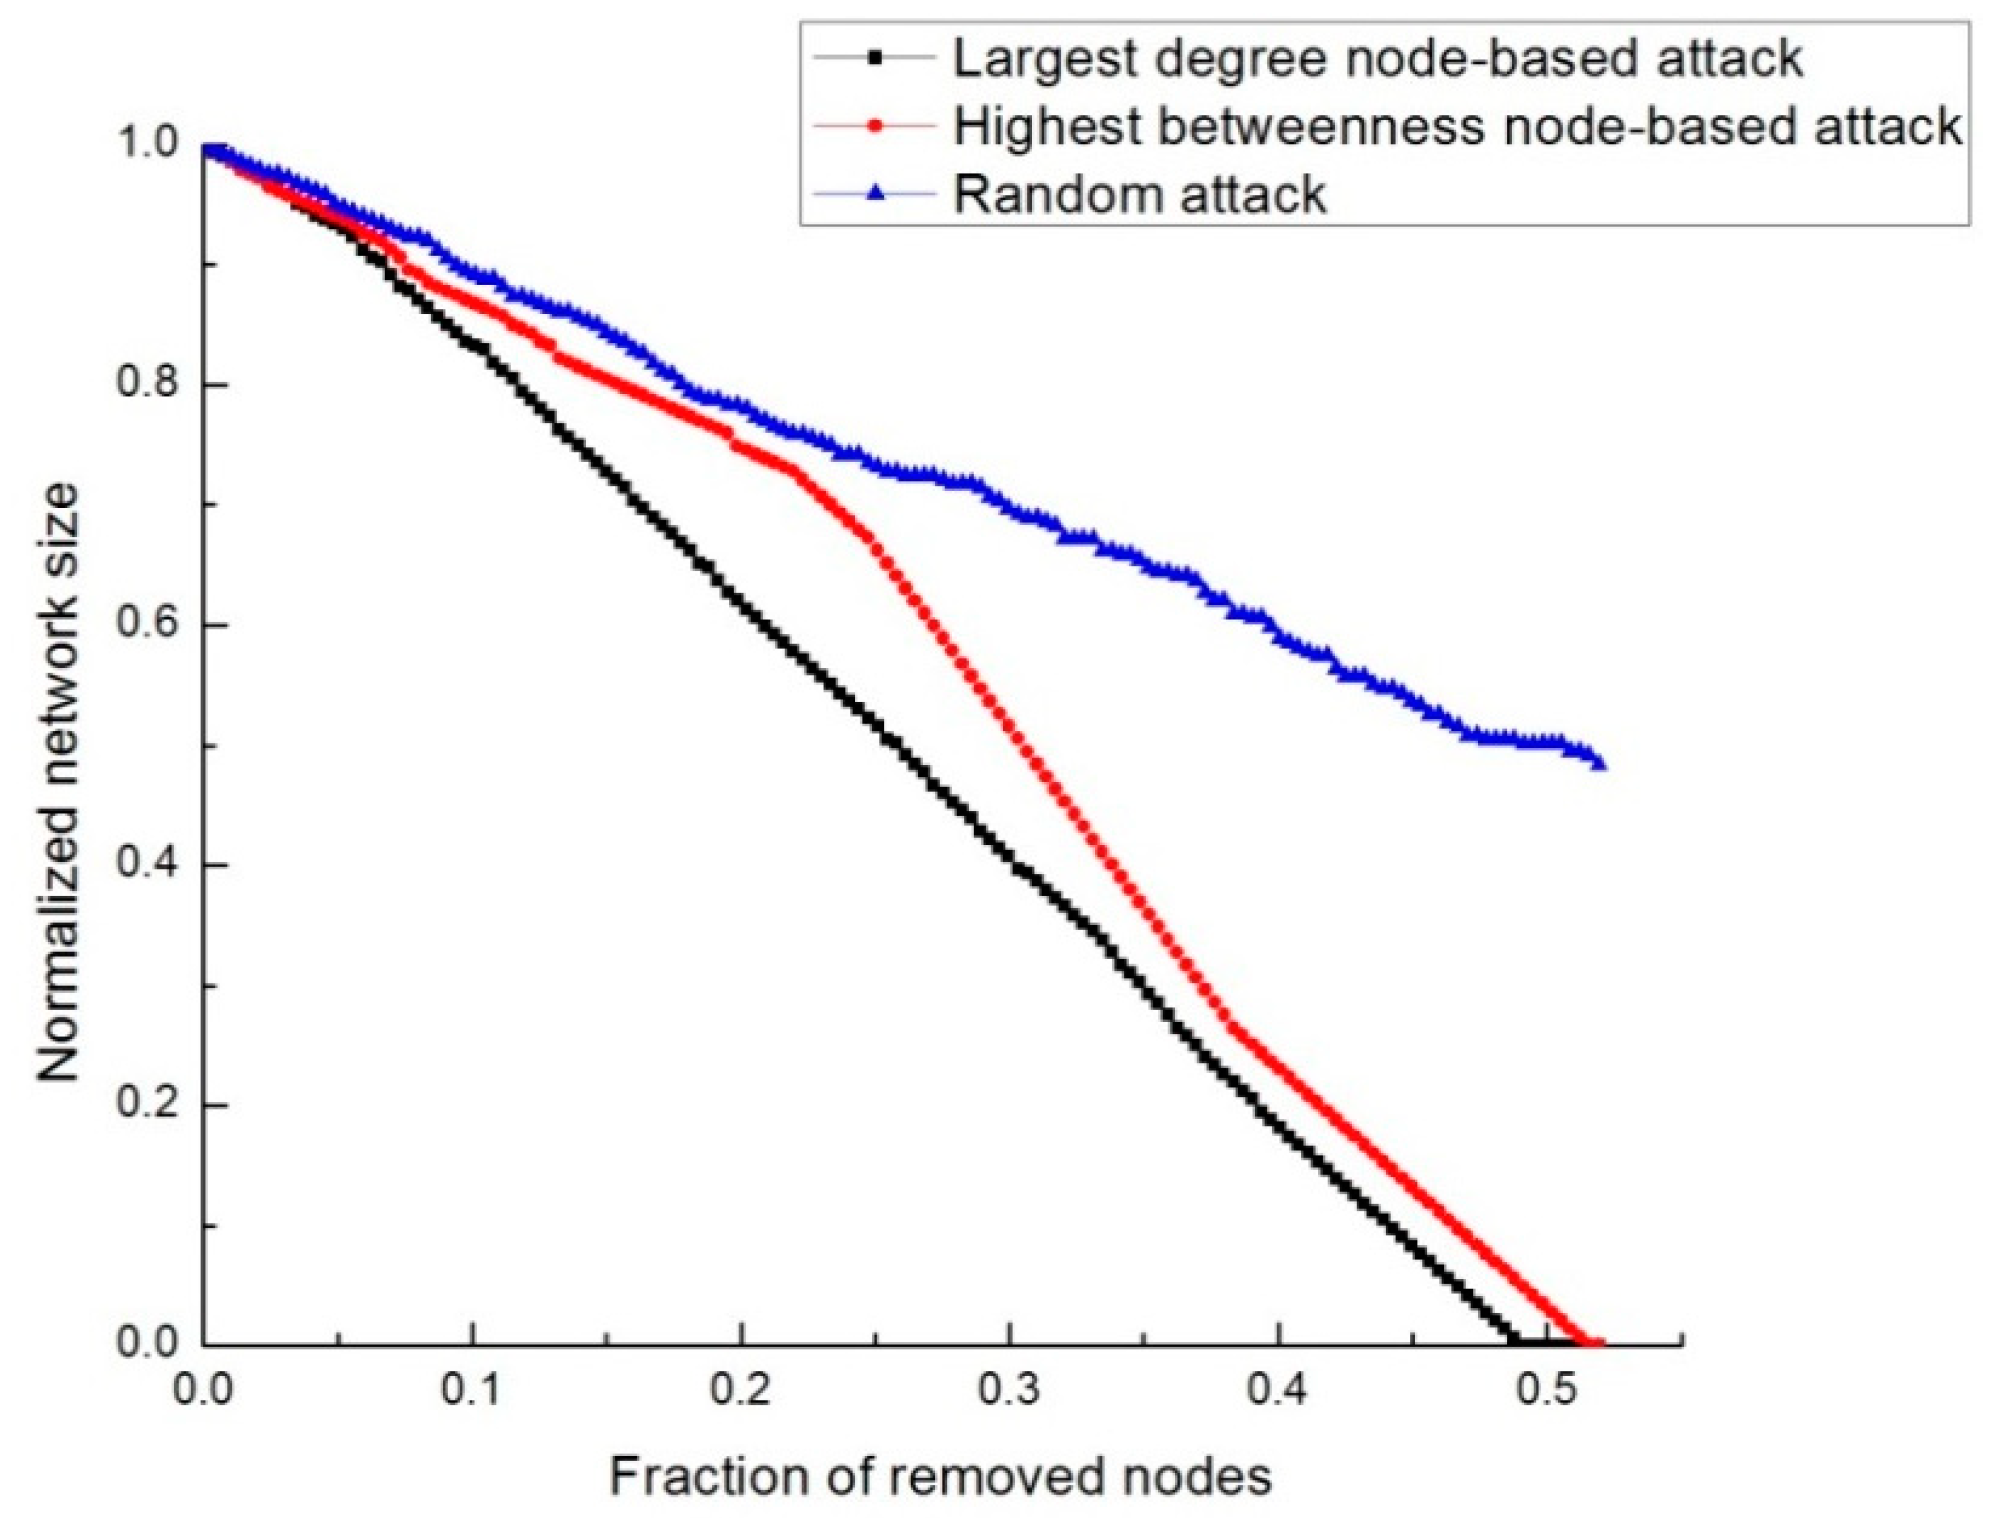
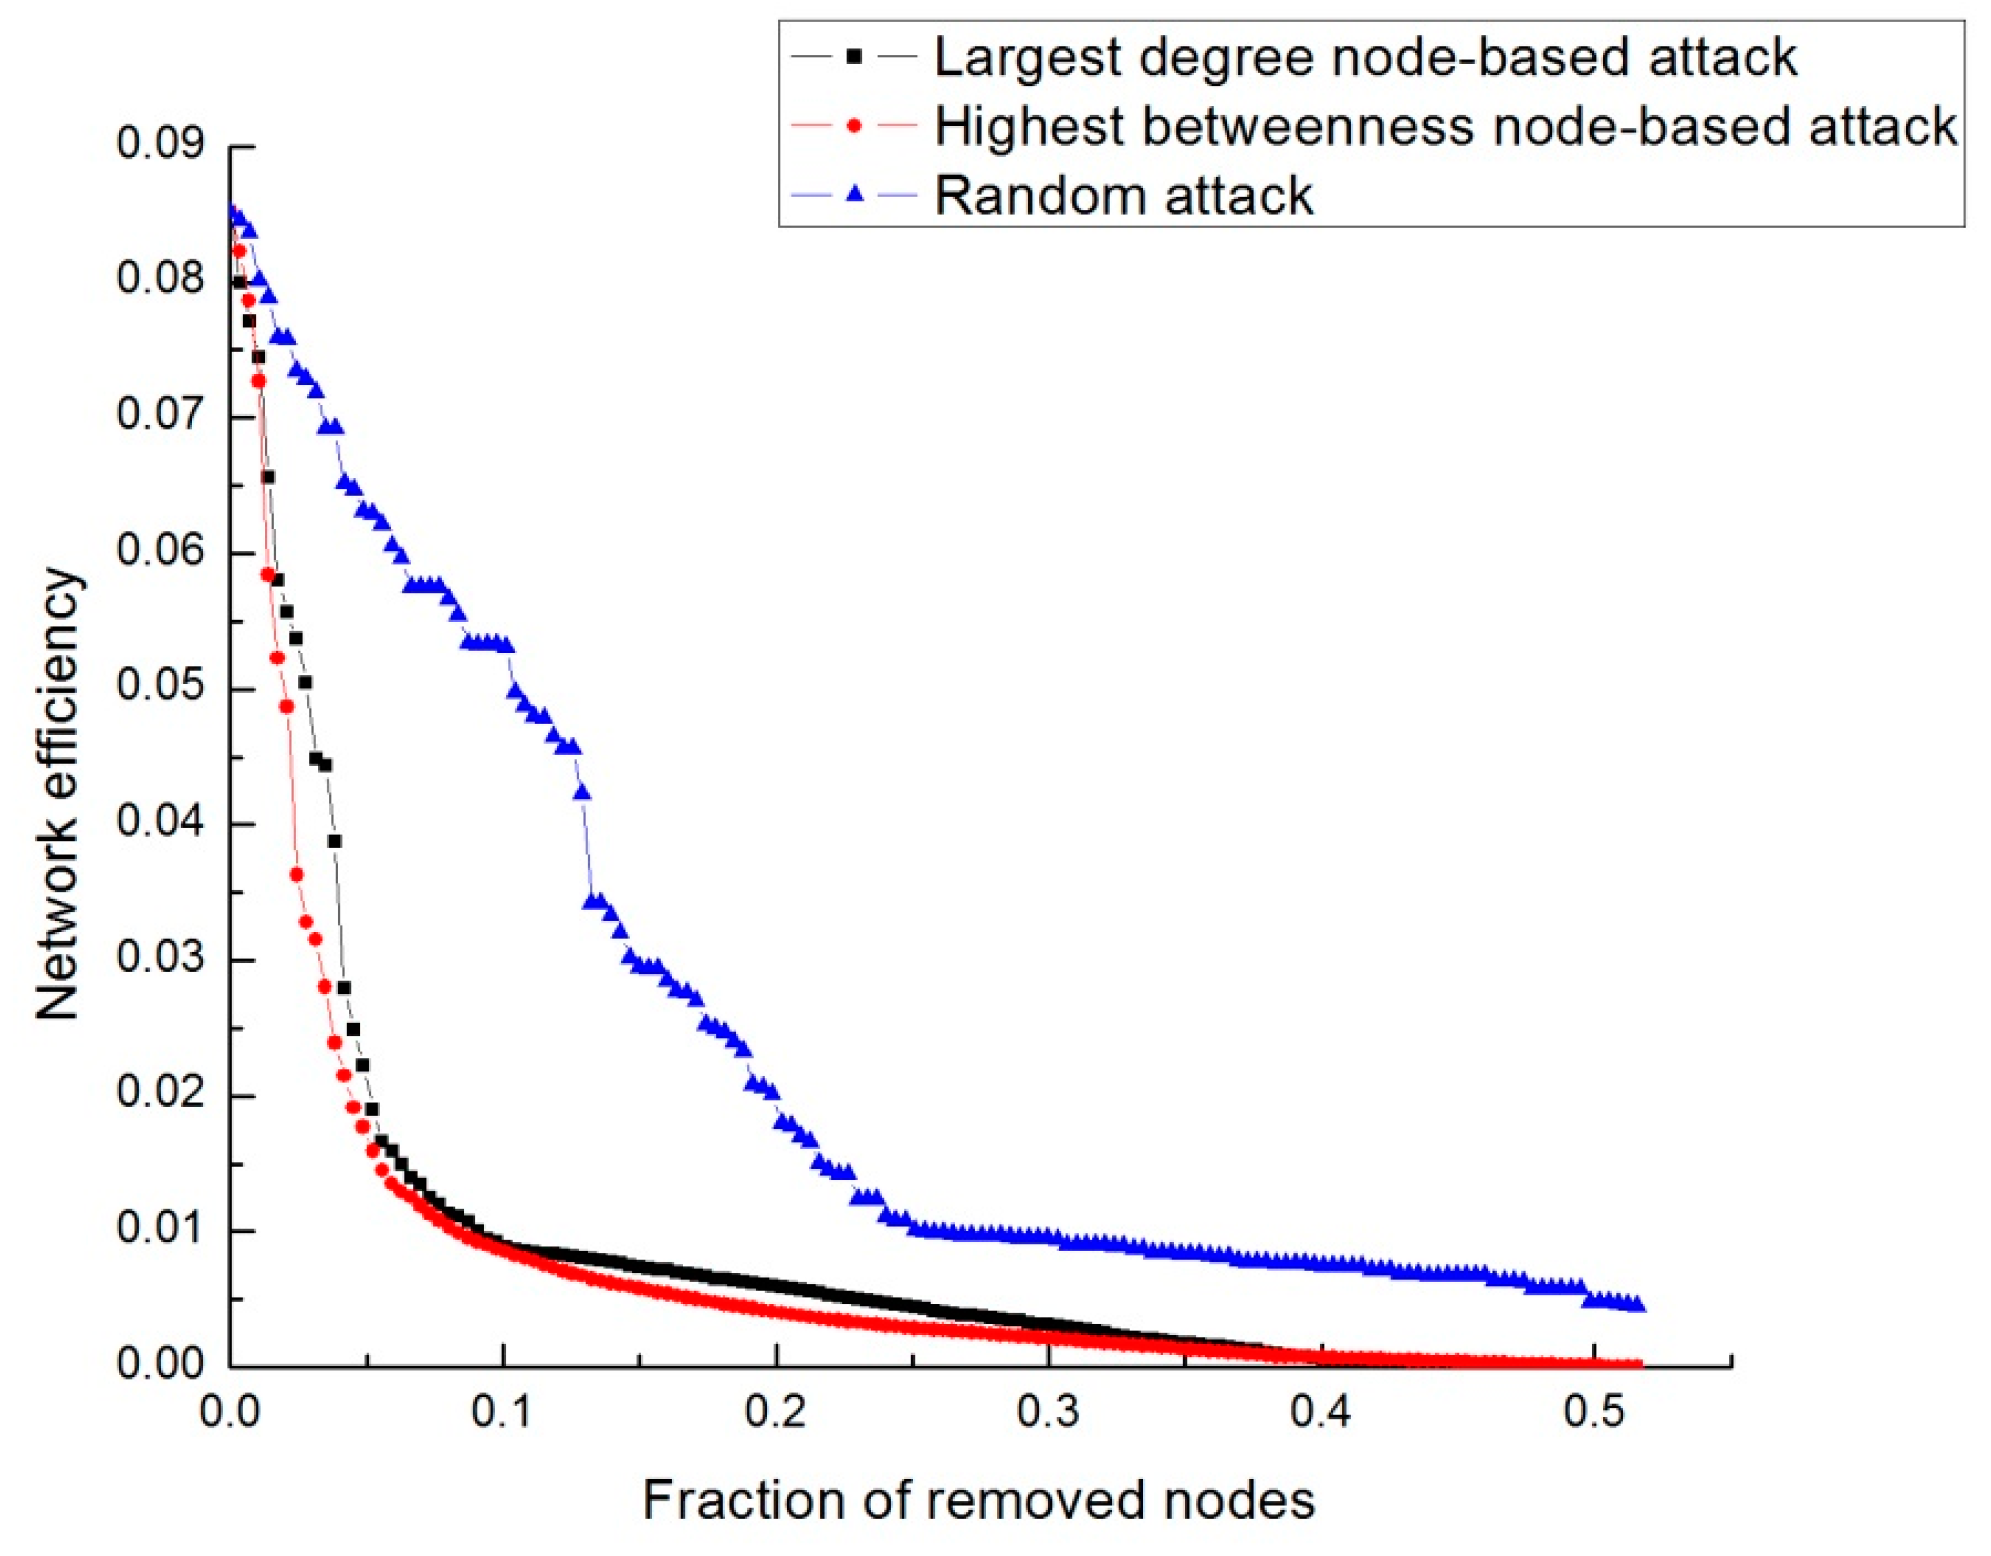
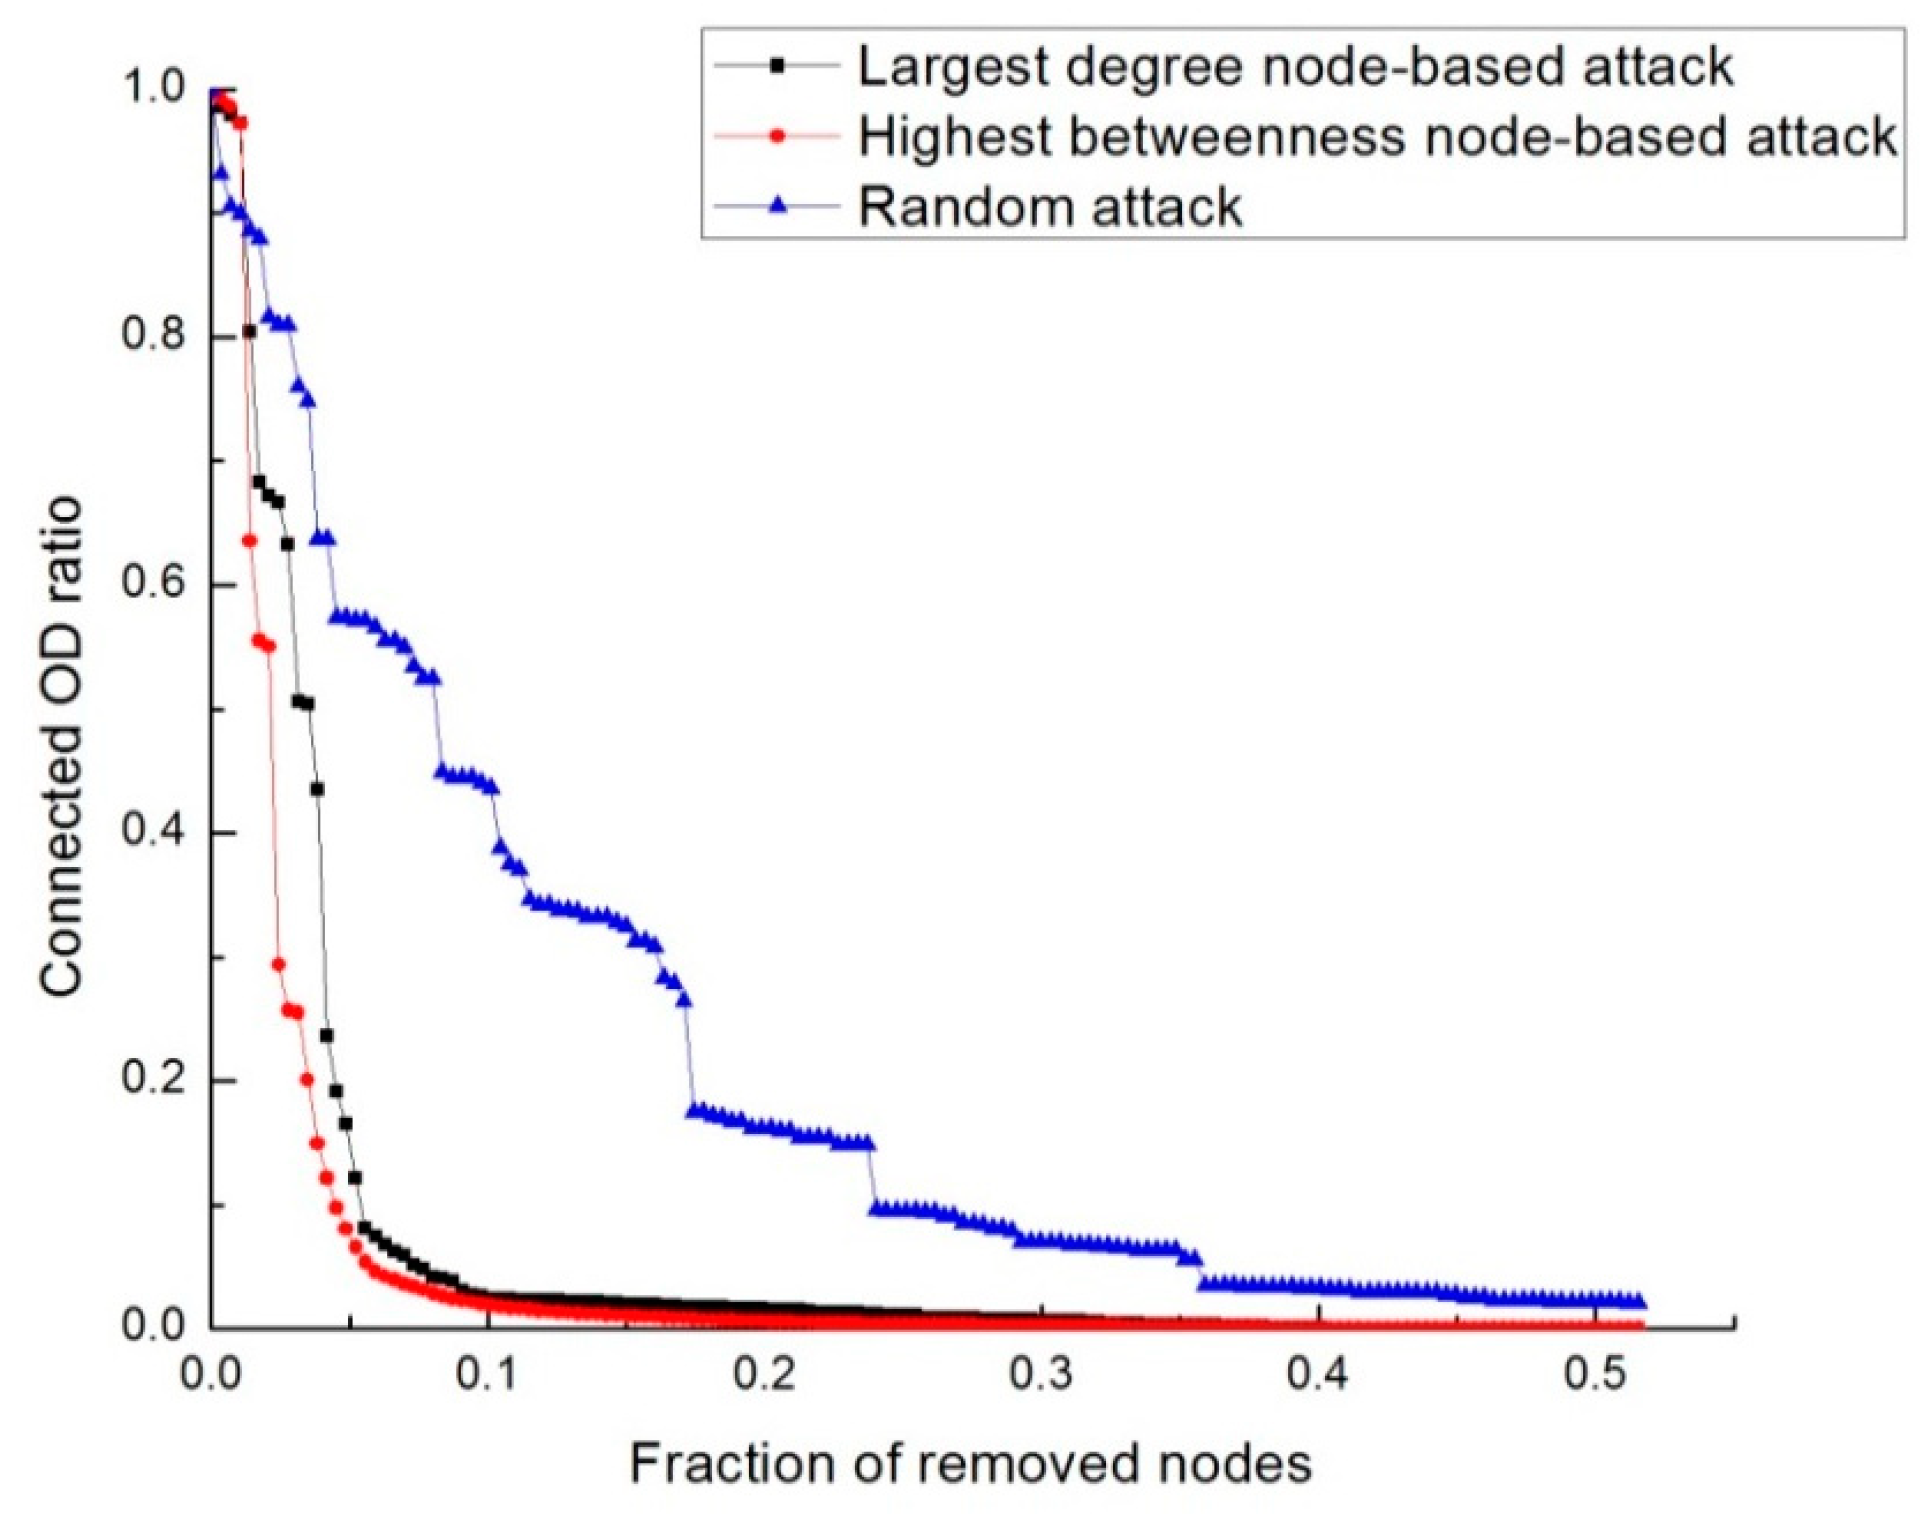
3.2. Topological Vulnerability Analysis
3.3. Functional Vulnerability Analysis

3.4. Station Vulnerability Analysis
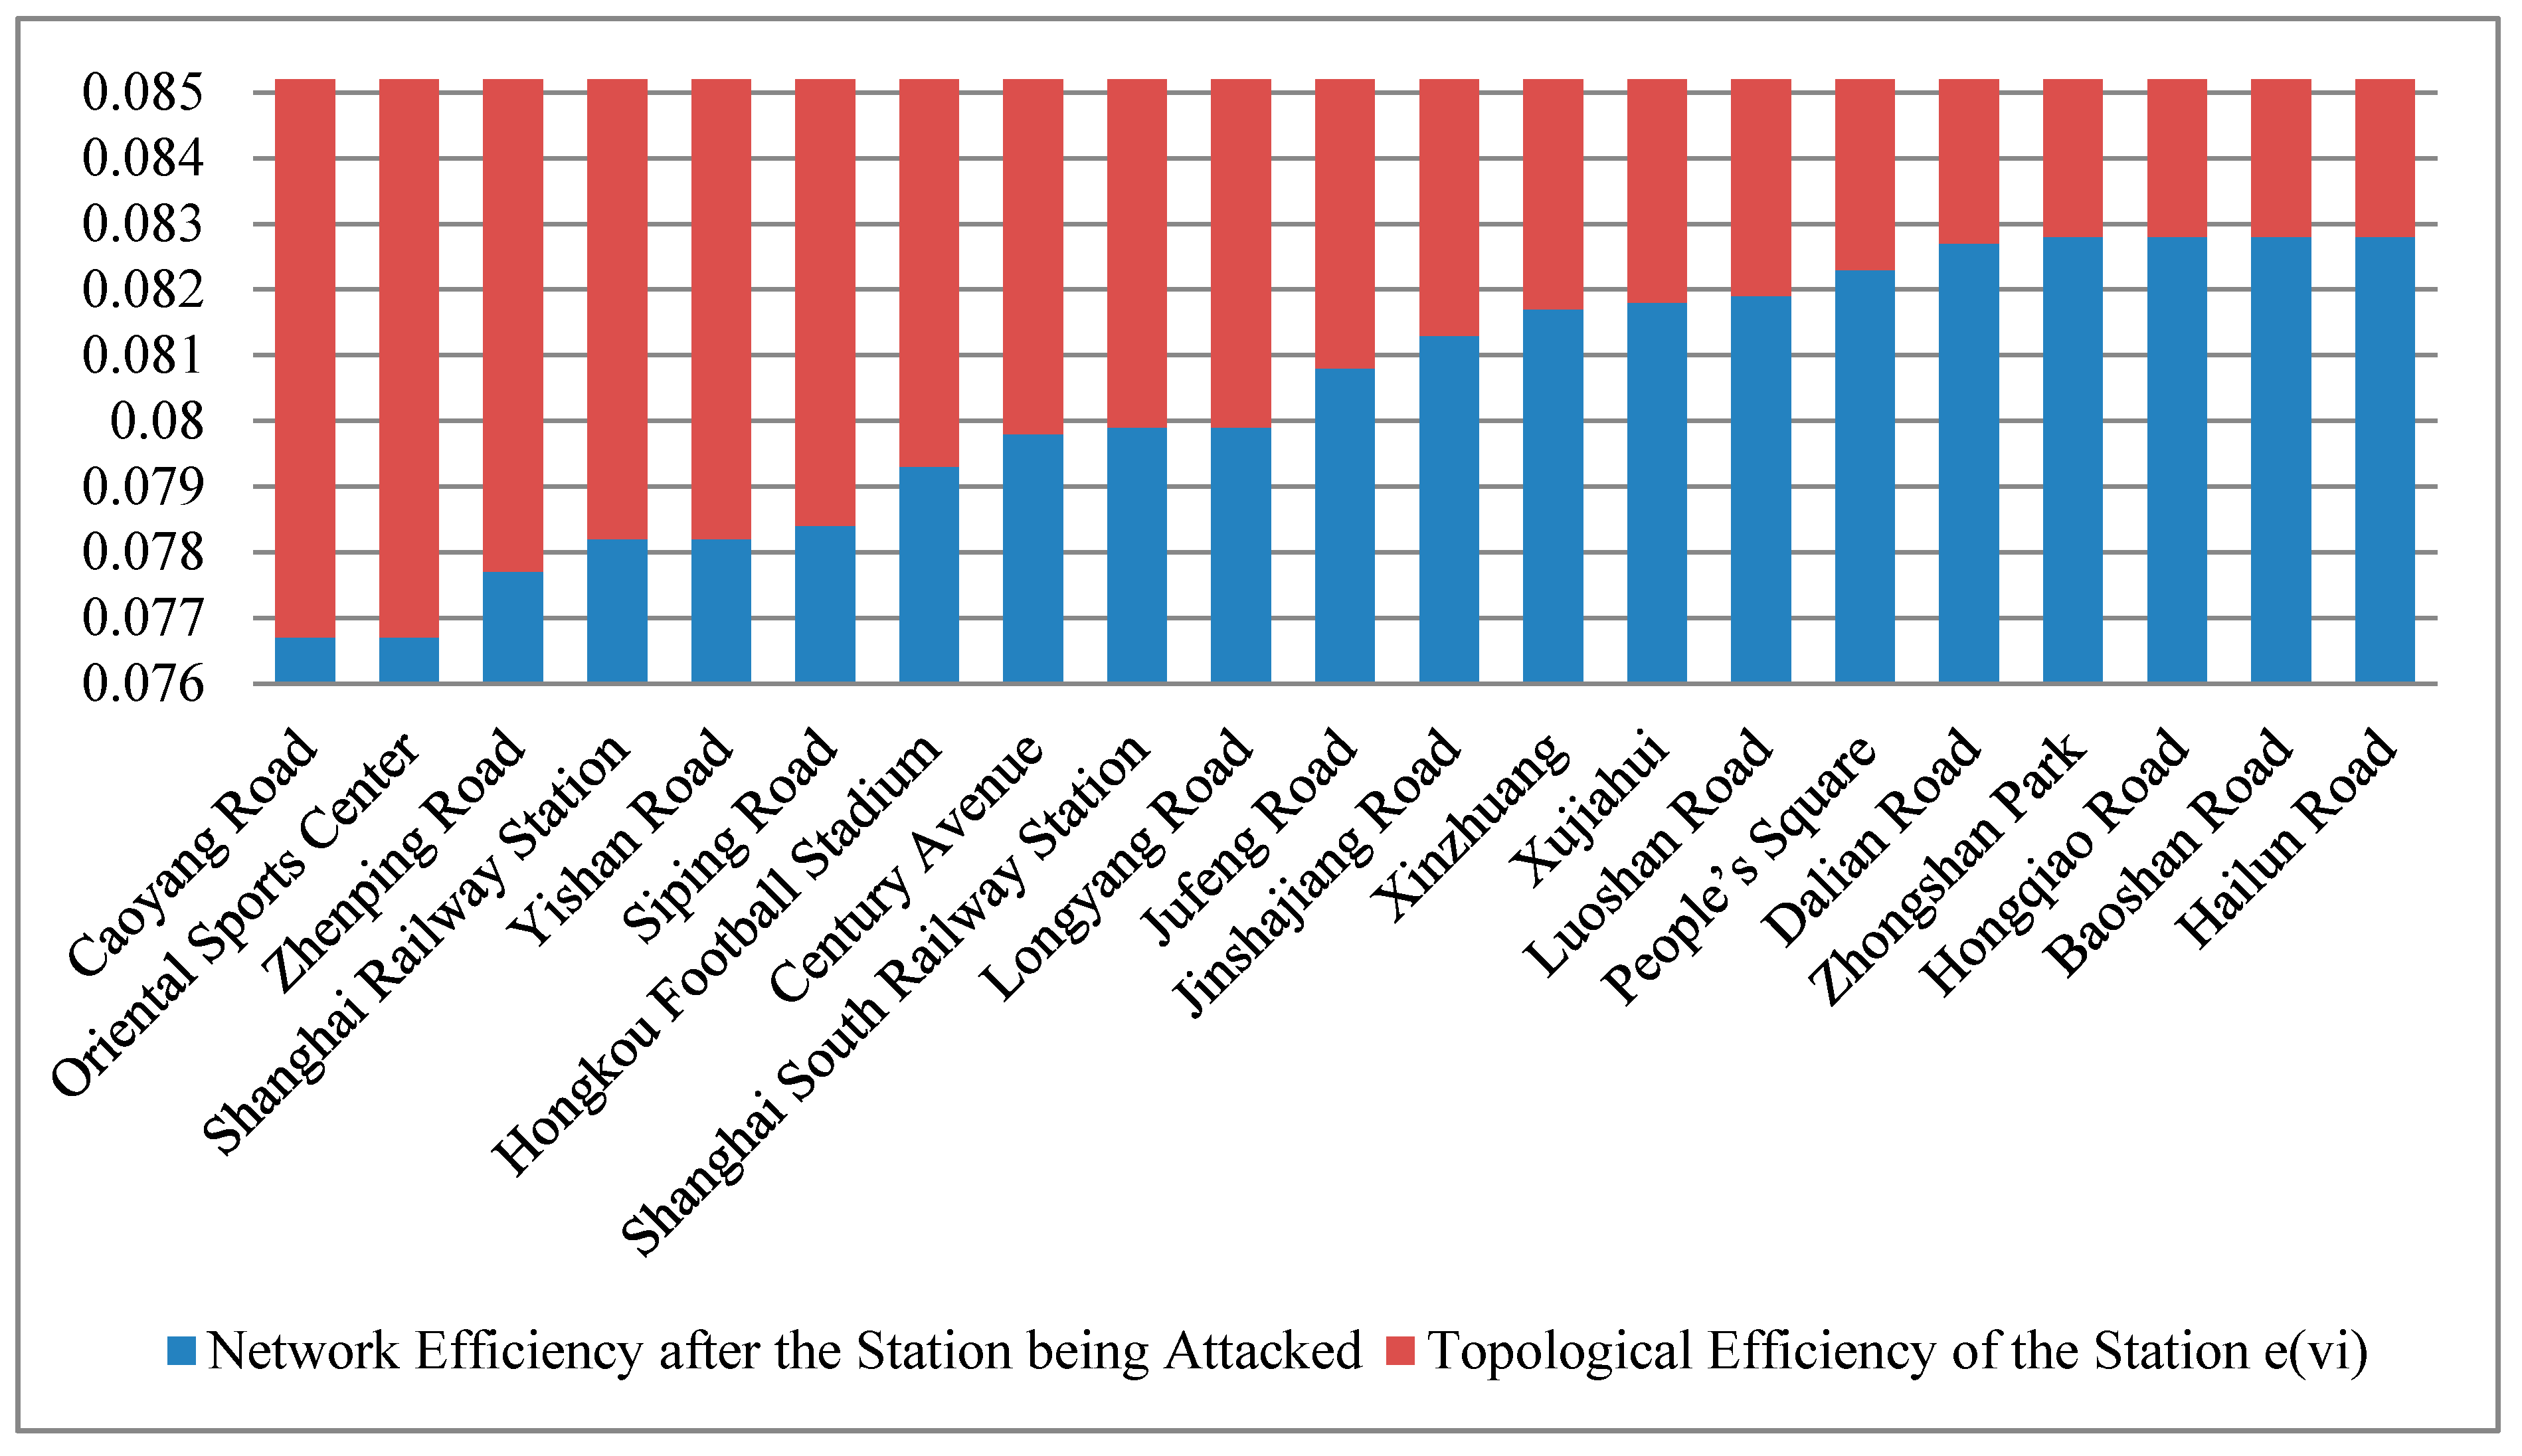
3.4.1. Calculations of Station Topological Efficiency

| No. | OD Pair | Route | Ideal Travel Time (min) | |
|---|---|---|---|---|
| Origin | Destination | |||
| 1 | Dongchuan Road | Lujiazui | Line 5-Line 1-Line 2 | 70 |
| 2 | Zhongtan Road | Dongchang Road | Line 4-Line 1-Line 2 | 31 |
| 3 | Gongkang Road | Shanghai South Railway Station | Line 1 | 51 |
| 4 | Pengpu Xincun | Huamu Road | Line 1-Line 2-Line 7 | 58 |
| 5 | Hongqiao Railway Station | Middle Yanggao Road | Line 2-Line 9 | 50 |
| 6 | Yishan Road | Yuanshen Stadium | Line 9-Line 6 | 35 |
| Route No. | Ideal Travel Time (min) | Travel Time with Station Removed (min) | |||
|---|---|---|---|---|---|
| Xujiahui | People’s Square | Century Avenue | Shanghai Railway Station | ||
| 1 | 70 | 81 | 78 | 70 | 70 |
| 2 | 31 | 31 | 32 | 31 | 37 |
| 3 | 51 | 59 | 59 | 51 | Not Accessible |
| 4 | 58 | 58 | 63 | 73 | Not Accessible |
| 5 | 50 | 50 | 64 | Not Accessible | 50 |
| 6 | 35 | 41 | 35 | 91 | 35 |
| Route No. | Ideal Travel Time (min) | Percentage Change in Travel Time | |||
| Xujiahui | People’s Square | Century Avenue | Shanghai Railway Station | ||
| 1 | 70 | 15.7% | 11.4% | 0.0% | 0.0% |
| 2 | 31 | 0.0% | 3.2% | 0.0% | 19.4% |
| 3 | 51 | 15.7% | 15.7% | 0.0% | N/A |
| 4 | 58 | 0.0% | 8.6% | 25.9% | N/A |
| 5 | 50 | 0.0% | 28.0% | N/A | 0.0% |
| 6 | 35 | 17.1% | 0.0% | 160.0% | 0.0% |
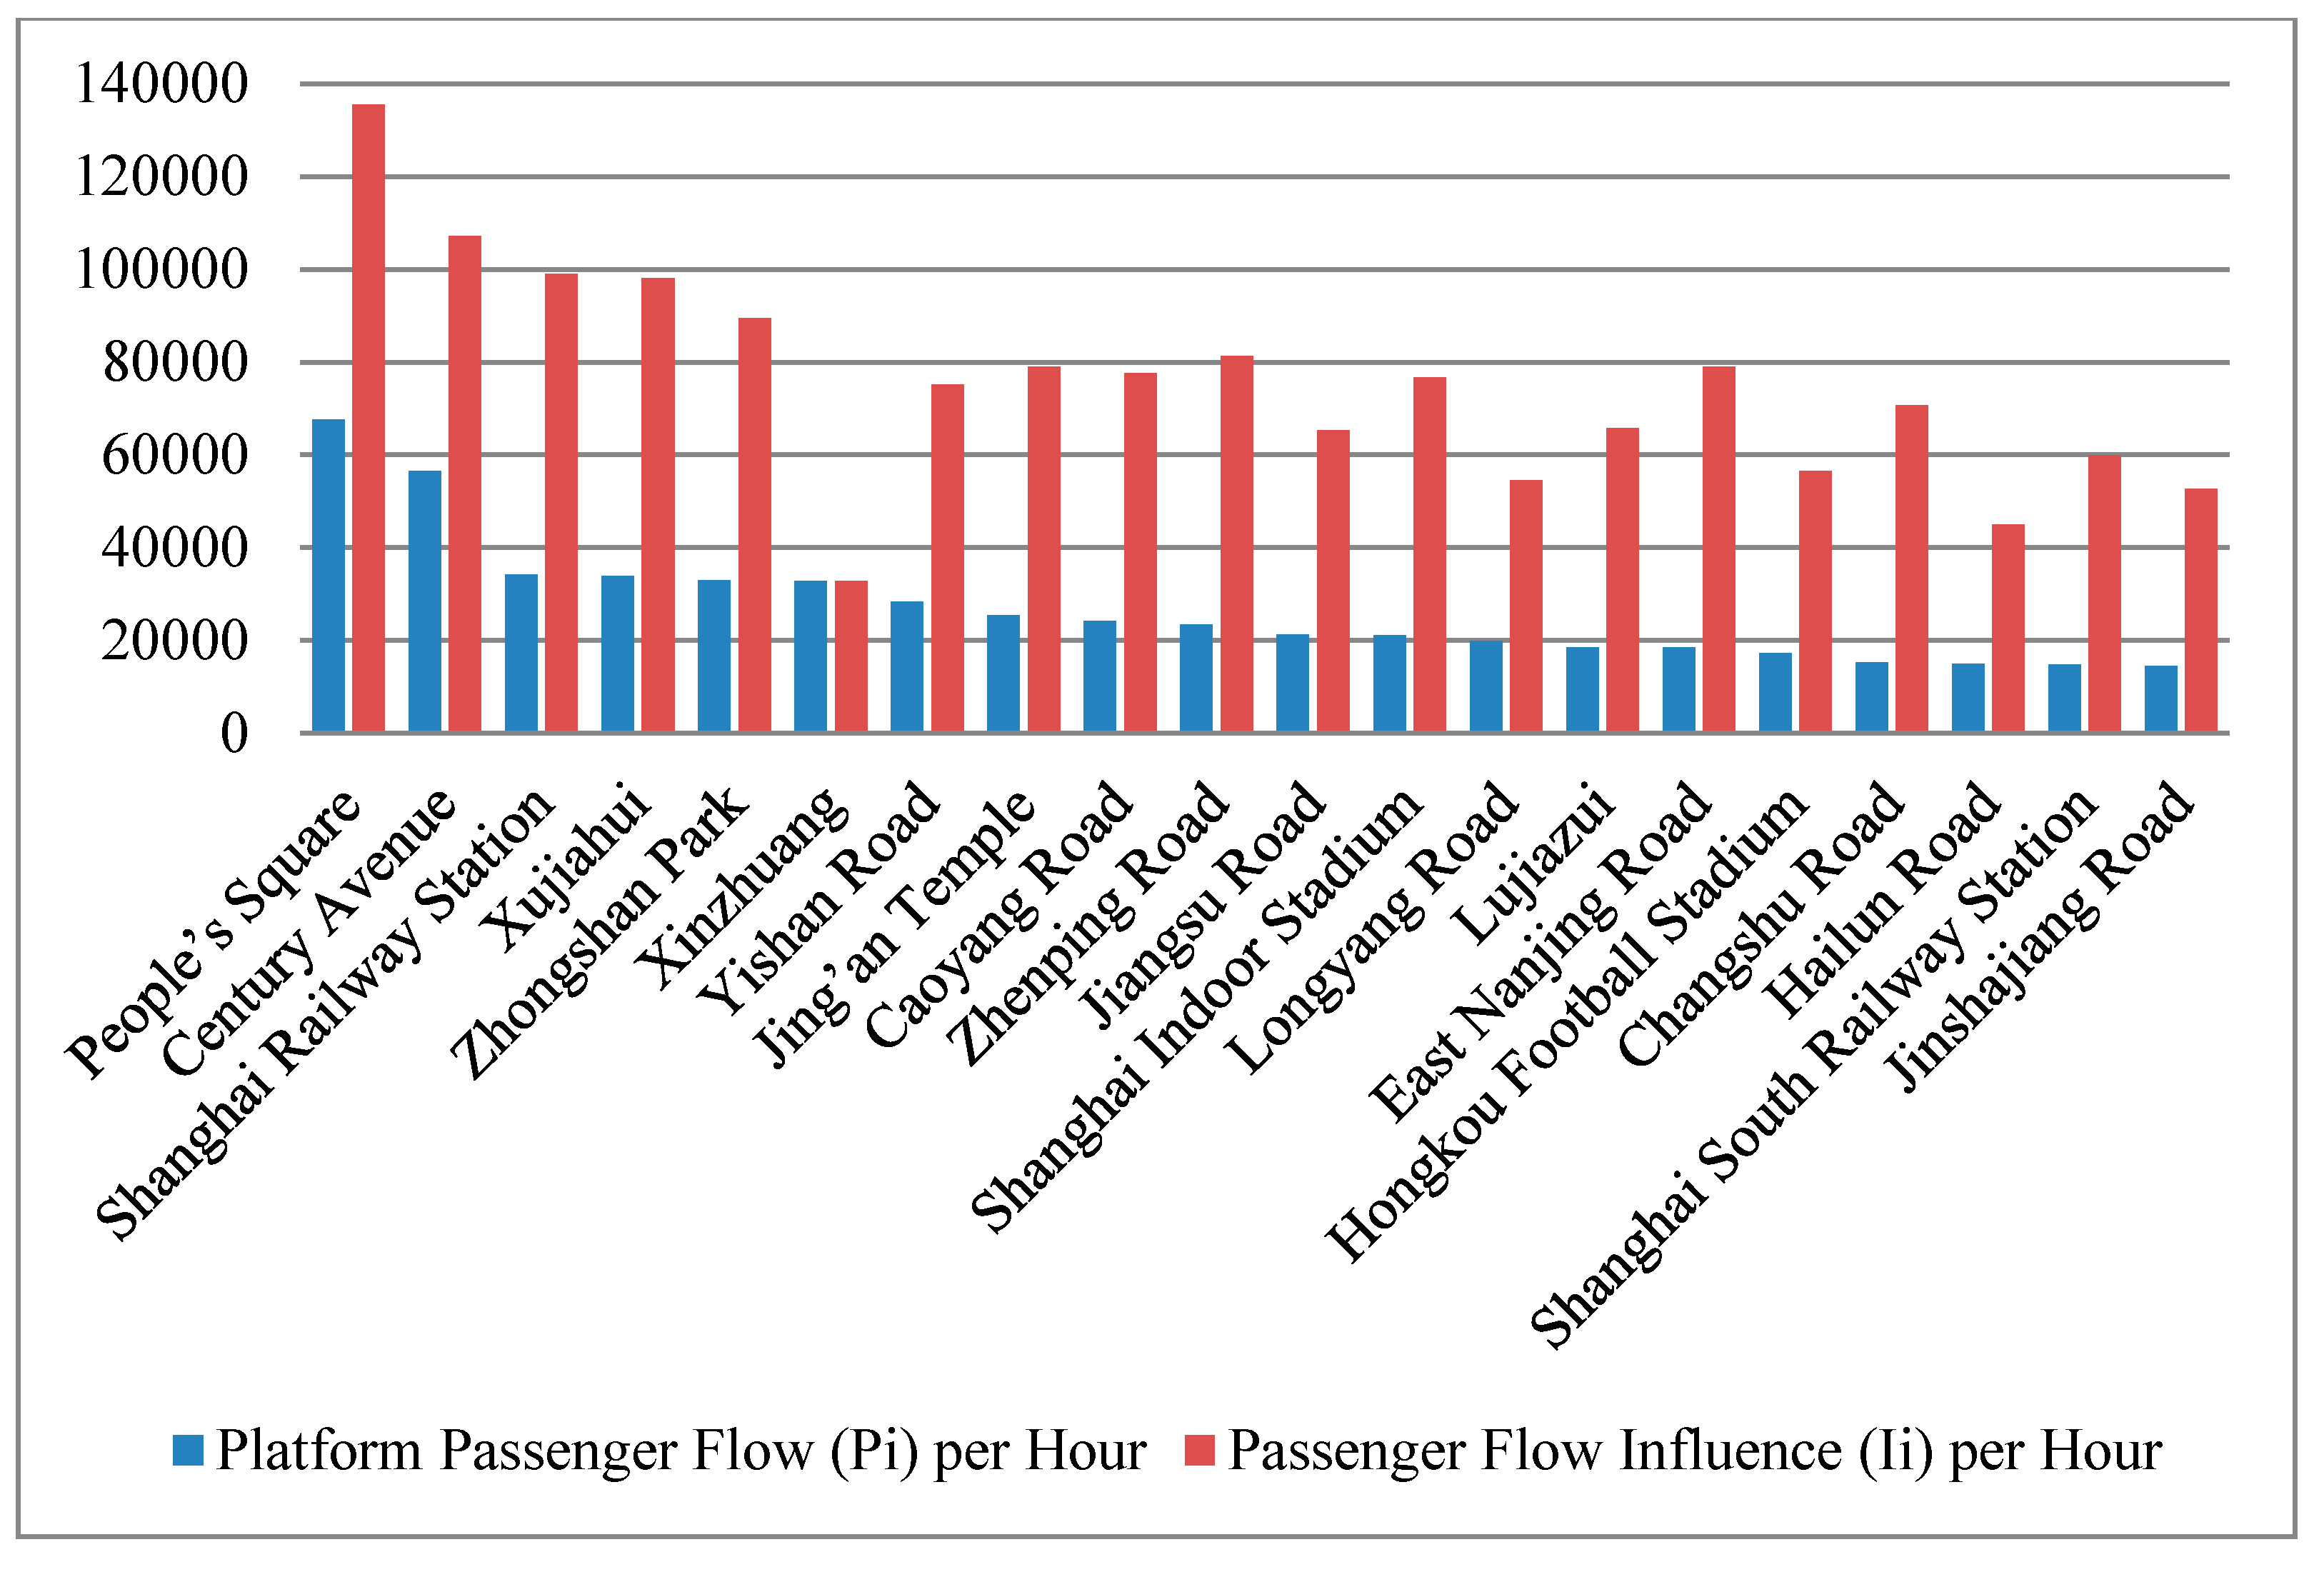
3.4.2. Calculation of Station Passenger Flow
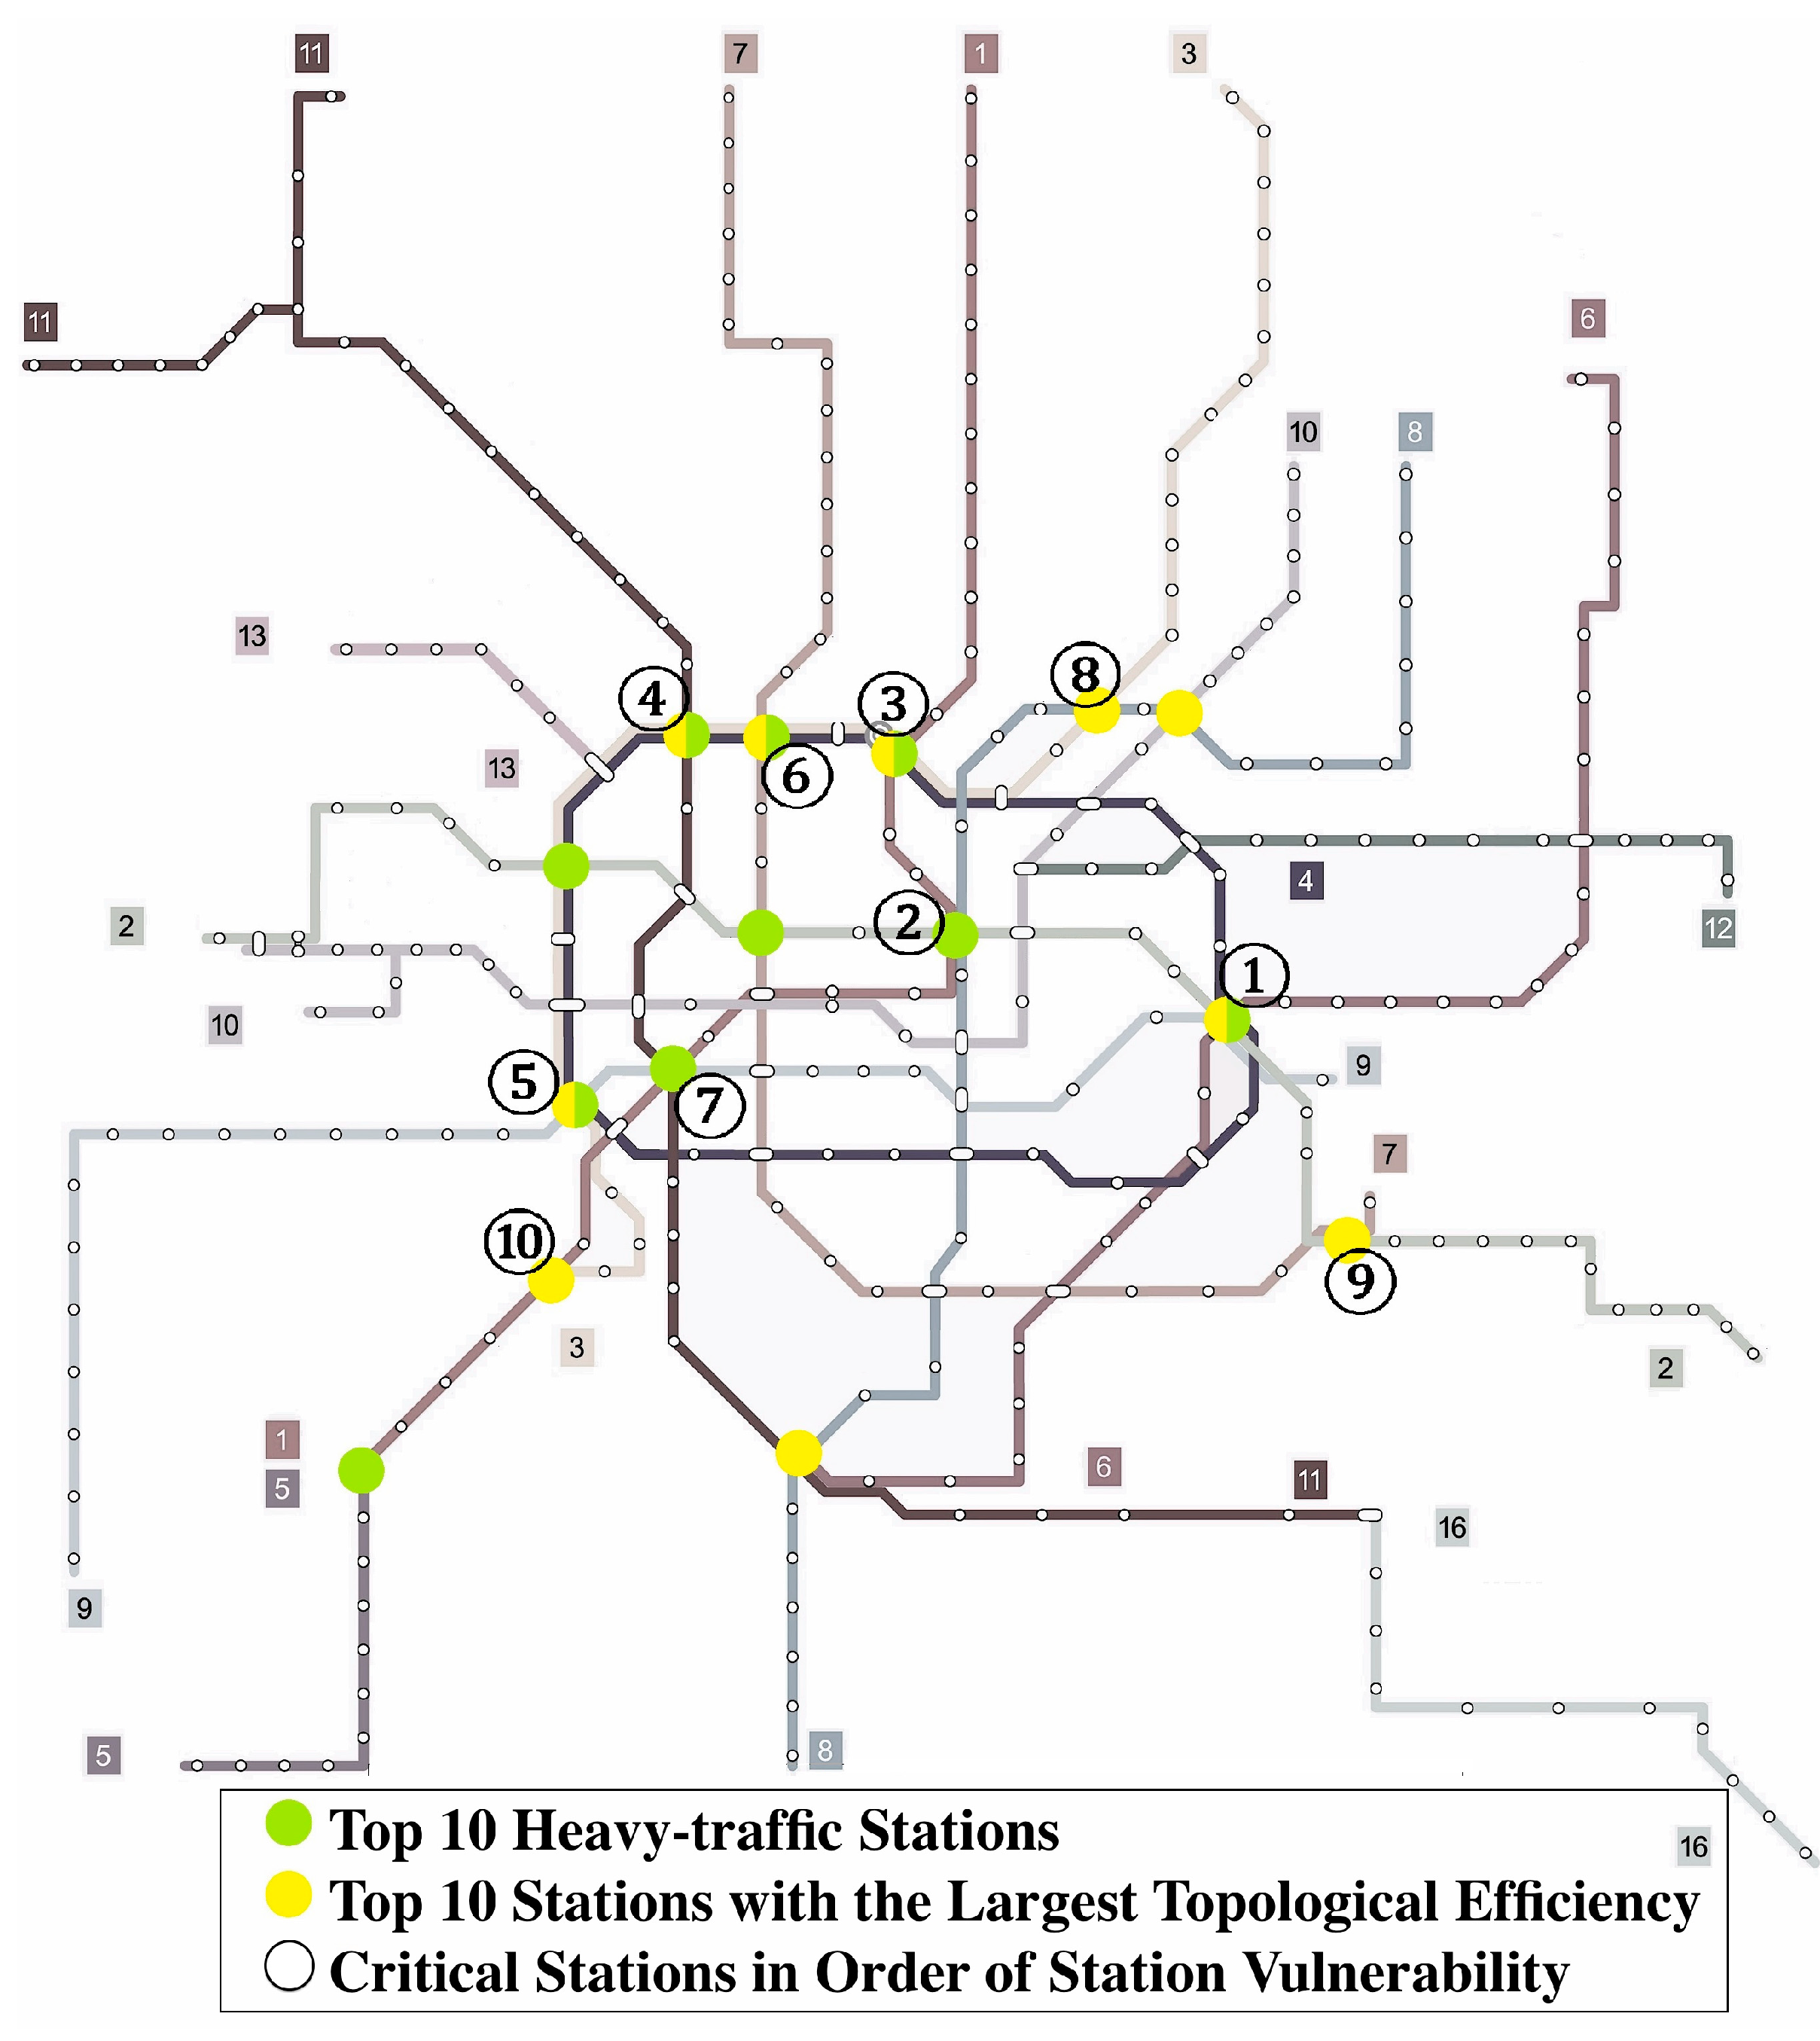
3.4.3. Station Vulnerability Evaluations
| Station Name | Degree (Di) | Topological Efficiency of Station e(vi) | Passenger Flow Influence (Ii) per Hour | Reductions in Network Serviceability R(vi) | |||
|---|---|---|---|---|---|---|---|
| e(vi) | No. | (Ii) | No. | R(vi) | No. | ||
| Shanghai Railway Station | 4 | 0.007 | 4 | 98,963 | 3 | 692.74 | 1 |
| Caoyang Road | 4 | 0.0085 | 1 | 77,687 | 9 | 660.34 | 2 |
| Zhenping Road | 4 | 0.0075 | 3 | 81,264 | 6 | 609.48 | 3 |
| Century Avenue | 8 | 0.0054 | 8 | 107,152 | 2 | 578.62 | 4 |
| Yishan Road | 5 | 0.007 | 4 | 75,087 | 11 | 525.61 | 5 |
| People’s Square | 6 | 0.0029 | 16 | 135,481 | 1 | 392.89 | 6 |
| Hongkou Football Stadium | 4 | 0.0059 | 7 | 56,562 | 16 | 333.72 | 7 |
| Xujiahui | 6 | 0.0034 | 14 | 98,013 | 4 | 333.24 | 8 |
| Shanghai South Railway Station | 3 | 0.0053 | 9 | 59,934 | 14 | 317.65 | 9 |
| Longyang Road | 4 | 0.0053 | 9 | 54,452 | 17 | 288.60 | 10 |
| Siping Road | 4 | 0.0068 | 6 | 37,863 | 27 | 257.47 | 11 |
| Oriental Sports Center | 5 | 0.0085 | 1 | 26,549 | 34 | 225.67 | 12 |
| Zhongshan Park | 4 | 0.0024 | 18 | 89,514 | 5 | 214.83 | 13 |
| Jinshajiang Road | 3 | 0.0039 | 12 | 52,750 | 20 | 205.73 | 14 |
| East Nanjing Road | 4 | 0.0021 | 22 | 78,957 | 8 | 165.81 | 15 |
| Jing’an Temple | 4 | 0.0019 | 26 | 78,968 | 7 | 150.04 | 16 |
| Shanghai Indoor Stadium | 4 | 0.0019 | 26 | 76,716 | 10 | 145.76 | 17 |
| Jiangsu Road | 4 | 0.002 | 24 | 65,339 | 13 | 130.68 | 18 |
| Hongqiao Road | 4 | 0.0024 | 18 | 53,710 | 18 | 128.90 | 19 |
| Baoshan Road | 3 | 0.0024 | 18 | 53,407 | 19 | 128.18 | 20 |
| Xinzhuang | 2 | 0.0035 | 13 | 32,862 | 31 | 115.02 | 21 |
| Zhongtan Road | 2 | 0.0021 | 22 | 51,724 | 21 | 108.62 | 22 |
| Hailun Road | 4 | 0.0024 | 18 | 44,931 | 23 | 107.83 | 23 |
| Changshu Road | 4 | 0.0015 | 34 | 70,721 | 12 | 106.08 | 24 |
| Lujiabang Road | 4 | 0.002 | 24 | 48,090 | 22 | 96.18 | 25 |
| South Shaanxi Road | 4 | 0.0014 | 37 | 59,742 | 15 | 83.64 | 26 |
| Zhaojiabang Road | 4 | 0.0017 | 31 | 44,621 | 24 | 75.86 | 27 |
| South Xizang Road | 4 | 0.0019 | 26 | 39,224 | 26 | 74.53 | 28 |
| Dalian Road | 4 | 0.0025 | 17 | 29,277 | 32 | 73.19 | 29 |
| Yaohua Road | 4 | 0.0019 | 26 | 37,044 | 28 | 70.38 | 30 |
| Dongan Road | 4 | 0.0017 | 31 | 35,465 | 29 | 60.29 | 31 |
| Laoximen | 4 | 0.0017 | 31 | 32,975 | 30 | 56.06 | 32 |
| Jiaotong University | 4 | 0.0018 | 30 | 29,017 | 33 | 52.23 | 33 |
| Jufeng Road | 4 | 0.0044 | 11 | 11,105 | 40 | 48.86 | 34 |
| West Yan’an Road | 2 | 0.0011 | 40 | 41,791 | 25 | 45.97 | 35 |
| Lancun Road | 4 | 0.0013 | 38 | 24,707 | 35 | 32.12 | 36 |
| West Gaoke Road | 4 | 0.0015 | 34 | 21,295 | 36 | 31.94 | 37 |
| Hongqiao Airport T2 | 3 | 0.0015 | 34 | 19,667 | 37 | 29.50 | 38 |
| Tiantong Road | 3 | 0.0012 | 39 | 13,359 | 39 | 16.03 | 39 |
| Hongqiao Railway Station | 2 | 0.0009 | 41 | 15,798 | 38 | 14.22 | 40 |
| Luoshan Road | 2 | 0.0033 | 15 | 619 | 41 | 2.04 | 41 |
| No. | Station Name | Reductions in Network Serviceability R(vi) | Platform Passenger Flow (Pi) per Hour | Estimated Breakdown Probability due to Large Flow p(vi) | Station Vulnerability S(vi) |
|---|---|---|---|---|---|
| 1 | Century Avenue | 578.62 | 56,461 | 5.2% | 30.2 |
| 2 | People’s Square | 392.89 | 67,664 | 6.3% | 24.6 |
| 3 | Shanghai Railway Station | 692.74 | 34,148 | 3.2% | 21.9 |
| 4 | Caoyang Road | 660.34 | 24,170 | 2.2% | 14.8 |
| 5 | Yishan Road | 525.61 | 28,302 | 2.6% | 13.8 |
| 6 | Zhenping Road | 609.48 | 23,354 | 2.2% | 13.2 |
| 7 | Xujiahui | 333.24 | 33,960 | 3.1% | 10.5 |
| 8 | Hongkou Football Stadium | 333.72 | 17,211 | 1.6% | 5.3 |
| 9 | Longyang Road | 288.6 | 19,891 | 1.8% | 5.3 |
| 10 | Shanghai South Railway Station | 317.65 | 14,760 | 1.4% | 4.3 |

4. Conclusions
Acknowledgments
Author Contributions
Conflicts of Interest
References
- Litman, T. Impacts of rail transit on the performance of a transportation system. Transp. Res. Record 2005, 1930, 21–29. [Google Scholar] [CrossRef]
- Nguyen, T.P.K.; Beugin, J.; Marais, J. Method for evaluating an extended Fault Tree to analyze the dependability of complex systems: Application to a satellite-based railway system. Reliab. Eng. Syst. Saf. 2015, 133, 300–313. [Google Scholar] [CrossRef]
- Vuchic, V.R. Urban Transit: Operations, Planning, and Economics; Wiley: Hoboken, NJ, USA, 2005. [Google Scholar]
- Beroggi, G.E. Integrated safety planning for underground systems. J. Hazard. Mater. 2000, 71, 17–34. [Google Scholar] [CrossRef]
- Canós, J.H.; de Zulueta, F. Using hypermedia to improve safety in underground metropolitan transportation. Multimedia Tools Appl. 2004, 22, 75–87. [Google Scholar] [CrossRef]
- Gabay, D. Fire safety: A short history in the Paris subway. Tunnel. Undergr. Space Technol. 2002, 17, 139–143. [Google Scholar] [CrossRef]
- Liao, F.; Arentze, T.; Timmermans, H. Multi-state supernetworks: Recent progress and prospects. J. Traffic Transp. Eng. (Engl. Ed.) 2014, 1, 13–27. [Google Scholar] [CrossRef]
- Del Río, P.M.S.; Hernández, J.A.; Aracil, J.; de Vergara, J.E.L.; Domżał, J.; Wójcik, R.; Duque, R. A reliability analysis of double-ring topologies with dual attachment using p-cycles for optical metro networks. Comput. Netw. 2010, 54, 1328–1341. [Google Scholar] [CrossRef]
- Derrible, S.; Kennedy, C. The complexity and robustness of metro networks. Physica A 2010, 389, 3678–3691. [Google Scholar] [CrossRef]
- De-Los-Santos, A.; Laporte, G.; Mesa, J.A.; Perea, F. Evaluating passenger robustness in a rail transit network. Transp. Res. Part C 2012, 20, 34–46. [Google Scholar] [CrossRef]
- Cadarso, L.; Marín, Á.; Maróti, G. Recovery of disruptions in rapid transit networks. Transp. Res. Part E 2013, 53, 15–33. [Google Scholar] [CrossRef]
- Berdica, K. An introduction to road vulnerability: What has been done, is done and should be done. Transp. Policy 2002, 9, 117–127. [Google Scholar] [CrossRef]
- Jenelius, E.; Petersen, T.; Mattsson, L.G. Importance and exposure in road network vulnerability analysis. Transp. Res. Part A 2006, 40, 537–560. [Google Scholar] [CrossRef]
- Bell, M.G.; Kanturska, U.; Schmöcker, J.D.; Fonzone, A. Attacker-defender models and road network vulnerability. Philos. Trans. R. Soc. A 2008, 366, 1893–1906. [Google Scholar] [CrossRef] [PubMed]
- Taylor, M.A.; Sekhar, S.V.; D’Este, G.M. Application of accessibility based methods for vulnerability analysis of strategic road networks. Netw. Spat. Econ. 2006, 6, 267–291. [Google Scholar] [CrossRef]
- Jenelius, E. Network structure and travel patterns: Explaining the geographical disparities of road network vulnerability. J. Transp. Geogr. 2009, 17, 234–244. [Google Scholar] [CrossRef]
- Gao, J.; Shi, Q. Definition and evaluation modeling of metro network invulnerability. J. China Railw. Soc. 2007, 29, 29–33. (In Chinese) [Google Scholar]
- Wang, Y. Research on Connectivity Reliability of Urban Transit Network Based on Theory of Complex Network. Master’s Thesis, Beijing Jiao Tong University, Beijing, 2008. [Google Scholar]
- Zhang, J.; Xu, X.; Hong, L.; Wang, S.; Fei, Q. Networked analysis of the Shanghai subway network, in China. Physica A 2011, 390, 4562–4570. [Google Scholar] [CrossRef]
- Quan, R.; Liu, M.; Zhang, L. Vulnerability assessment of rainstorm water-logging in subway of Shanghai. Yangtze River 2011, 42, 13–17. [Google Scholar]
- Han, Y.; Cheng, H.; Zhao, X.; Xue, X. Theoretic structure of urban mass transit operation safety based on vulnerability. Urban Mass Transit 2012, 15, 15–19. [Google Scholar]
- Yuan, J.; Li, Q.; Jia, R.; Wang, Z. Analysis of operation vulnerabilities of urban metro network system. China Saf. Sci. J. 2012, 22, 92–98. [Google Scholar]
- Barabási, A.L.; Albert, R. Emergence of scaling in random networks. Science 1999, 286, 509–512. [Google Scholar] [PubMed]
- Angeloudis, P.; Fisk, D. Large subway systems as complex networks. Physica A 2006, 367, 553–558. [Google Scholar] [CrossRef]
- Raveau, S.; Muñoz, J.C.; de Grange, L. A topological route choice model for metro. Transp. Res. Part A 2011, 45, 138–147. [Google Scholar] [CrossRef]
- Floyd, R.W. Algorithm 97: Shortest path. Commun. ACM 1962, 5. [Google Scholar] [CrossRef]
- Zhang, J.; Zhao, M.; Liu, H.; Xu, X. Networked characteristics of the urban rail transit networks. Physica A 2013, 392, 1538–1546. [Google Scholar] [CrossRef]
- Shanghai Metro Group Co., Ltd., Shanghai Metro Network Map. Available online: http://service.shmetro.com/yxxlt/index.htm (accessed on 2 January 2014).
- Sun, D.J.; Zhang, C.; Zhang, L.; Chen, F.; Peng, Z.-R. Urban travel behavior analysis and travel time predicting based on floating car data. Transp. Lett. Int. J. Transp. Res. 2014, 6, 118–125. [Google Scholar] [CrossRef]
- Sun, D.J.; Ni, X.-Y.; Peng, Z.-R. An improved incremental assignment model for parking variable message sign location problem. J. Adv. Transp. 2015. [Google Scholar] [CrossRef]
© 2015 by the authors; licensee MDPI, Basel, Switzerland. This article is an open access article distributed under the terms and conditions of the Creative Commons Attribution license (http://creativecommons.org/licenses/by/4.0/).
Share and Cite
Sun, D.; Zhao, Y.; Lu, Q.-C. Vulnerability Analysis of Urban Rail Transit Networks: A Case Study of Shanghai, China. Sustainability 2015, 7, 6919-6936. https://doi.org/10.3390/su7066919
Sun D, Zhao Y, Lu Q-C. Vulnerability Analysis of Urban Rail Transit Networks: A Case Study of Shanghai, China. Sustainability. 2015; 7(6):6919-6936. https://doi.org/10.3390/su7066919
Chicago/Turabian StyleSun, Daniel (Jian), Yuhan Zhao, and Qing-Chang Lu. 2015. "Vulnerability Analysis of Urban Rail Transit Networks: A Case Study of Shanghai, China" Sustainability 7, no. 6: 6919-6936. https://doi.org/10.3390/su7066919
APA StyleSun, D., Zhao, Y., & Lu, Q.-C. (2015). Vulnerability Analysis of Urban Rail Transit Networks: A Case Study of Shanghai, China. Sustainability, 7(6), 6919-6936. https://doi.org/10.3390/su7066919