1. Introduction
Vietnam recognizes the long-term benefits and short-term need to enhance the country’s overall infrastructure, including ports, roads and energy. To this end, the government is implementing a national infrastructure improvement and expansion plan using a combination of public and private funding (Workshop, 2008) [
1]. Unlike traditional approaches to infrastructure planning, Vietnam is considering both conventional concerns over construction costs, as well as the potential effects of climate change on infrastructure. While the costs of climate change are a concern for most countries, they are of particular concern for developing countries, where the financial resources needed to address climate change are especially limited. The challenge is therefore to identify the impacts of climate change on infrastructure, develop adaptation approaches and incorporate these into medium to long-term development plans and secure the resources needed to finance any additional costs for adaptation.
Previous studies have quantified the impact of climate change on physical assets (Larsen
et al., 2008 [
2]; World Bank, 2009 [
3]). Our study extends earlier work by evaluating the implications of climate change for road infrastructure within developing countries–in this case, Vietnam–across a fuller range of climate change projections. We focus on paved, gravel and unpaved roads because of their socioeconomic importance for Vietnam. We examine the extent to which climate change, as reflected in global and country-specific climate projections, diverts resources away from extending Vietnam’s road infrastructure towards maintaining and adapting existing infrastructure. Our analysis incorporates two kinds of impacts: (i) “climate stressors” (
i.e., precipitation and temperature changes) and (ii) projected sea level rise (SLR) of one meter. Both impacts are important given the significance of Vietnam’s coastal zones.
This study expands upon the methodology presented in Chinowsky
et al. [
4], which introduced an engineering-based stressor response methodology to quantify the impact of climate change on physical assets. The analysis is conducted at multiple scales (e.g., national and provincial) and for the period until 2050. Importantly, the concept of “opportunity cost” is used to identify the benefits of adapting to projected climatic changes. In other words, given the need to extend existing road networks, should Vietnam postpone costly adaptation measures on critical infrastructure? By addressing this question, our study provides context for policy makers to understand climate change’s implications for long-run economic development in Vietnam.
This paper is one of four papers that document the findings from a UNU-WIDER research project: “Development under Climate Change”. As one of the project’s country level case studies, these four papers estimate climate change’s biophysical and economic impacts on Vietnam using an integrated or multi-sector modeling framework. Additional impact channels include water, agriculture and hydropower (Gebretsadik
et al., 2015) [
5] and cyclones and storm surge (Neumann
et al., 2015) [
6]. These sectoral impact channels are combined to provide an economywide assessment of climate change for Vietnam (Arndt
et al., 2015) [
7]. Our paper on road infrastructure introduces this assessment by: (1) introducing an overall methodology for calculating climate change impacts; (2) presenting the overall results for the study at a national level and finally (3) addressing the impacts on a regional level to highlight the differences in the country. A discussion and conclusion provides thoughts on how these results need to be considered by infrastructure planners.
2. Climate Change and Road Infrastructure
The literature related to climate change adaptation in the infrastructure sector is primarily qualitative in nature and provides broad recommendations and warnings, primarily based on general weather studies or qualitative climate change predictions. Research completed by the Transportation Research Board in the USA, the Scottish Executives, and AUSTROADS in Australia are notable efforts in this regard (TRB, 2008 [
8]; Galbraith
et al., 2005 [
9]; AUSTROADS, 2004 [
10]). These studies compare weather-related disasters and their perceived severity with predicted climate change impacts.
Another strand of the literature are studies that determine specific climate impacts on road infrastructure, such as temperature, rain, snow and ice, wind, fog and coastal flooding (see, for example, CCSP 2006) [
11]. Such studies are often undertaken in areas where specific climate change concerns threaten infrastructure that is unique to that locale. For example, Industrial Economics [
12] find that ice and winter roads in Canada are particularly vulnerable to rising temperatures. Similarly, Jackson and Puccinelli (2006) [
13] find that northern climates may experience increased infrastructure degradation due to increased freeze-thaw cycles.
The above studies are mainly motivated by the need to raise awareness and inform public officials about climate change’s implications for infrastructure. A comprehensive study in this regard is Mills and Andrey (2002) [
14], who present a framework for considering climate impacts on transportation. The authors enumerate baseline weather conditions and episodic weather-influenced hazards that comprise the environment in which infrastructure is built, maintained and used. They note that weather patterns will be altered by climate change, affecting the frequency, duration and severity of hazards. These hazards may affect transportation infrastructure itself, its operation, and demand for transportation. The latter can arise from a variety of sources, such as climate’s effect on the location of agricultural production and, therefore, the need and mode for shipping agricultural products.
Specific concerns are raised about rising sea levels and their potentially dramatic effect on economies and populations. Industries operating in low-lying coastal areas, such as tourism, shipping and agriculture, may face significant pressures if sea levels rise (Neumann
et al., 2000) [
15]. Road infrastructure may also be vulnerable to SLR. For low-lying coastal areas, making forward-looking decisions about infrastructure is a key to mitigating potentially costly impacts.
Existing impact studies on infrastructure are limited in that they either focus on a narrow potential impact of climate change, or they do not provide specific estimates of costs or damages that may result under different climate change scenarios. In contrast, Chinowsky
et al., 2011 [
16] estimate the potential cost impacts of climate change on road infrastructure in ten countries that are geographically and economically diverse. The authors illustrate the real costs that countries may incur due to climate change, and the opportunity costs of diverting infrastructure resources to climate change adaptation. Recent studies have extended this stressor response methodology to determine climate change impacts on bridges (Stratus, 2010) [
17] and roads in northern climates (Industrial Economics, 2010) [
12].
3. Stressor Response Methodology
Our stressor response methodology is based on the concept that exogenous factors (stressors) have a direct effect on and subsequent response by focal elements. In the context of climate change and infrastructure, the exogenous factors are the individual results of climate change, including changes in sea levels, precipitation, temperature, storm frequency and wind speeds. The focal elements are the different infrastructure types, such as roads, railroads, water and power distribution facilities, and public buildings. Therefore, a stressor response value is the quantitative impact that a specific stressor has on an infrastructure element. At the core of our analysis is a two-step procedure that first determines the appropriate climate effects on the given infrastructure inventory in selected locations, and then determines the cost impacts on this infrastructure based on a set of stressor response functions. (See Chinowsky
et al. for a recent application of stressor response functions for precipitation, temperature and flooding on road infrastructure in Africa [
16].)
The stressors considered in this study include SLR, precipitation, temperature and flooding, while the infrastructure response elements are paved, gravel and dirt roads. For example, we will estimate how an increase in precipitation affects the lifespan of unpaved roads depending on the magnitude of the increase in precipitation. In this manner, our study diverges from qualitative summaries and emphasizes quantitative damage estimates. Flooding, precipitation and temperature are analyzed on a time-series basis with cost adjustments calculated each year through 2050. Elevation and spatial infrastructure data for Vietnam is limited and so our analysis of sea levels is restricted to a uniform one meter SLR, and projections assume that all road stocks in an inundated area are completely destroyed. Therefore, costing for the impacts of SLR are equal to the replacement cost for inundated road stocks. The data required for our analysis includes future climate projection scenarios from general circulation models (GCMs), stressor response parameters, spatial data on elevation and infrastructure locations, SLR estimates and country-specific infrastructure cost estimates.
3.1. Parameters of Analysis
Several parameters are chosen in order to create an approach that is consistent and comparable when looking at different assets and time periods. First, a consistent and uniform road stock inventory is used for analysis in all time periods. The existing road stock is allocated and utilized for all future analysis (see below). This eliminates uncertainty surrounding planned and actual future construction of new inventory. Second, all cost estimates are shown without discounting and in constant 2010 US$. Third, “adaptation” options are presented in tandem with “no adaptation” options, and refer to policy choices surrounding climate change and infrastructure investments. The adaptation option assumes that the future climate is accurately known and that all new roads being resurfaced are adequately upgraded to the changes in climate projected over these roads’ entire lifespan. The upgraded roads are then considered “climate proof” against the incremental degradation caused by variation in precipitation and temperature resulting from climate change. Normal maintenance schedules are assumed and not counted in the costing since they would have been performed even in the absence of climate change.
In addition to these base parameters, a consistent set of adaptations is used for each road type. For paved roads, the adaptation upgrades include a new binder, which is more resilient to increased pavement temperatures. For gravel roads, adaptation upgrades focus on protection from precipitation and flooding–an upgraded road is resurfaced with crushed gravel mix and a deeper road base is laid. Increased culvert size and capacity is also included in the costing. Finally, for unpaved roads, the adaptation option is to upgrade unpaved (dirt) roads to an adapted gravel road. The upgrading of an unpaved road to a gravel road reduces maintenance costs since the annual maintenance assumed for unpaved roads is no longer needed. Additional benefits to reducing transport time are not included in our costing analysis.
3.2. Road Inventory and Climate Data
Variation in climate change outcomes means that the allocation of the national road inventory across sub-national regions is an important determinant of the costs of climate change. Provincial road inventories were estimated based on population densities (
i.e., the relative population and land area of each province as a percentage of the national total):
where
N is national (country) and A is administrative region (province)
and are national and regional populations (people)
and are total national and regional land areas (km2)
and are total national and regional road stocks (km2)
This allocation is done for each of the nine road types analyzed, i.e., paved, gravel and unpaved and by primary, secondary and tertiary. Due to a lack of spatial data on the exact location of roads within provinces, as well as the course resolution of climate projection data, we assume that road stocks are uniformly distributed within administrative regions. This process may result in some overestimates as impact-prone areas will be avoided over time by infrastructure planners. However, this provides a reasonable baseline from which to undertake this study.
Climate change data was drawn from two sources. For the climate stressor analysis, a selection of GCMs and emissions scenarios was taken from the Intergovernmental Panel on Climate Change’s (IPCC) Fourth Assessment Report (IPCC 2007) [
18]. The GCMs provide climatological data for future climate change scenarios through 2100. The data used in this analysis include the available A2, A1B and B1 emissions scenarios, which reflect different assumptions about future socioeconomic development. To provide a comprehensive analysis of climate change projections, those GCM datasets approved by the IPCC containing complete data projections for climate and flood data for Vietnam were used (
i.e., 25 climate change projections combining GCMs and emissions scenarios). Each GCM produces annual predicted precipitation and maximum temperatures. To obtain a broad assessment of the potential effects of climate change, the range and likelihood of the low-impact, medium-impact, and higher impact scenarios were developed in relation to the other climate scenarios. This is designed to give policy makers and planners a broader understanding of the risk and options presented by different climate change projections.
To analyze the impact of SLR, data was used from the Center for Remote Sensing of Ice Sheets at the University of Kansas. This provided information for a one meter or greater projected SLR, which was used to estimate the share of each Vietnamese grid cell that would be inundated,
i.e., land completely covered by more than 1 meter of SLR. Where inundation was projected, it was assumed that all nine types of road stock located in an inundated area would be destroyed. The impact function methodology is described in
Section 4 below.
To ensure consistent application of the data, both the SLR and provincial mapping of Vietnam were translated into a standard grid system. Climate Research Unit (CRU) grid cells of 0.5 degree latitude by 0.5 degree longitudinal (approximately 250 km
2) provided the basis of this data overlay translation (Climate Research Unit Time Series Version 2.1). Provinces were allocated across grid cells based on the share of their geographic area lying within a CRU grid cell. For example, an administrative area might be allocated across grid cells A and B at 30 and 70 percent, respectively. In this case, the province is recorded as having proportional area allocations in each grid location. In regions where detailed road locations are unknown, the road stock is uniformly distributed between grid cells at the same ratio of 30 and 70 percent, respectively (CIA, 2011 [
19]; General Statistics, 2011 [
20]). The result of this process is that the kilometers of roads in each province are allocated proportionally on a grid cell level.
4. Impact Functions
4.1. Climate Impact Analysis
Utilizing the GCM climate projections described above and a baseline No climate change scenario, it is possible to determine costs and impacts on individual infrastructure elements using the stress response methodology (Chinowsky, 2011 [
4]). As a brief summary for this methodology, the CRU grids are used as a basis for calculations. Specifically, the infrastructure in a specific grid is compared to the climate predictions in the same CRU grid. The damages projected for each grid cell are aggregated on an annual level to provide the basis for the projected total costs as outlined below. As mentioned earlier, the three climate stressors considered for Vietnam include precipitation, temperature and flooding.
The stressor response factors are divided into two general categories: (i) impacts on new construction costs; and (ii) impacts on maintenance costs. New construction cost factors focus on the additional resources required to adapt the design and construction of roads when rehabilitating an asset to changes in climate expected to occur over the asset’s lifespan. Maintenance effects are changes in costs that are anticipated to incur due to climate change. In both categories, the underlying objective is to retain the design lifespan for road infrastructure. This premise is motivated by a preference for maintaining infrastructure rather than rebuilding on a frequent basis.
The derivation of the stressor-response values for new construction costs emphasizes a change in material requirements to meet a new design standard. The methodology determines if new structures, such as paved roads, will be subject to material changes if it is anticipated that a significant climate change stressor will occur during their projected lifespan. The benefit with this approach is that basic maintenance, as well as climate induced maintenance, is eliminated on the road during the design life span of the road. Similarly, the functions for estimating maintenance bases the cost of maintenance on the cost of preventing a reduction in lifespan. The implementation of this approach involves two basic steps: (1) estimating the lifespan decrement that would result from a unit change in climate stress and (2) estimating the costs of avoiding this reduction in lifespan. To estimate the changes in road maintenance costs, the amount of potential lifespan degradation is used as a basis for determining the percentage of maintenance increase required. Specifically, maintenance is increased to cover the potential impact of climate stressors on the infrastructure to ensure that design life is retained for the infrastructure.
4.2. Sea Level Analysis
Climate and SLR impacts are analyzed separately and on different time scales. The climate stressor impacts (i.e., from precipitation and temperature) are estimated on a daily basis and results are aggregated to decadal totals in order to give an overall assessment of climate change over the medium-term. A lack of time-scaled data on SLR projections means that the SLR analysis is done at a single instant in time utilizing one impact scenario, i.e., a uniform one meter SLR.
There are a number of limitations to the robustness of this approach. First, projections on the amount of SLR that will occur in a specific region are uncertain and vary widely. Some recent studies predict a future SLR greater than one meter by 2100 (see Nicholls and Cazenave, 2010 [
21]), while the IPCC’s Fourth Assessment Report predicts an average 0.6 m by 2100 (IPCC, 2007 [
18]). Our analysis of SLR should, therefore, be viewed as one possible climate change outcome that is likely by 2100 but is unlikely to occur before 2050.
Second, our SLR impact methodology makes several assumptions: (i) a uniform distribution of road stock throughout each administrative region; (ii) a uniform one meter SLR estimate applied to land at or below one meter elevation; and (iii) land inundation requires a permanent relocation of road stocks. Costing is applied to the inundated road stock at the amount required to rebuild the existing road stock (see
Table 1). For example, we assume that half of a grid cell’s road stock is destroyed if half of that grid cell is projected to be inundated by SLR. If the grid cell contains road stock from more than one provincial level, then half of that road stock is destroyed in each of the affected provinces. The specific kilometers of road affected correspond to the initial road stock allocation at the national, provincial and grid cell levels. A detailed example of this calculation procedure is provided in the
Appendix.
Table 1.
Costs of rebuilding inundated roads after one-meter sea level rise.
Table 1.
Costs of rebuilding inundated roads after one-meter sea level rise.
| | Costs of New Road (US$ per Kilometer) |
|---|
| | Paved | Gravel | Unpaved |
|---|
| Primary | 500,000 | 226,000 | 128,000 |
| Secondary | 150,000 | 135,000 | 75,000 |
| Tertiary | 70,000 | 75,150 | 41,750 |
After determining the kilometers of roads inundated for each grid cell, the costs of replacing these roads are estimated at the grid cell level and for each road type. In the case of SLR, current costing analysis is done using the cost to build a new kilometer of road of each type. Other adaptation options, such as abandoning damaged roads, are not explored in this analysis.
5. Metrics of Measuring Impacts
Climate change impacts on road infrastructure can be measured in several ways. While Total cost is an important metric for policy makers, an additional concern is the relative effect of reallocating funds towards climate change that might have otherwise been used to fund development in other critical areas, including expanding the existing road inventory. To provide a set of metrics for understanding the broader impact of climate change, we use the following three metrics:
Total cost: The overall estimated costs of climate change impacts on road infrastructure (at 2010 prices and without discounting). This cost is the total cost of retaining the current road inventory in a usable state for the originally design life. This will include adaptation costs where appropriate, or just maintenance costs if no adaptation is implemented.
Opportunity cost: The amount of paved road inventory that could have been built with the funding that is diverted to climate change costs. Opportunity cost is calculated by first estimating the amount of money required to respond to climate change divided by the cost of a kilometer of paved secondary road. This amount is then divided by the existing paved road inventory to give the share of the paved road inventory that could have been extended if funds had not been allocated to responding to climate change.
Adaptive advantage: The benefit of adapting to climate change measured as the percentage cost savings between the “Adapt” and “No adapt” policy options (discussed below).
Using these three metrics, our results are presented for both a pro-active adapt approach and a reactive no adapt approach. For the adaptation approach, we introduce the concept of “maintenance savings”, which indicates the amount of standard maintenance that will be saved if an adaptation approach is adopted. These categories are detailed as follows:
Adapt: The adapt policy approach assumes perfect foresight with respect to climate change impacts and a policy that applies these forward-looking climate projections to upgrade new roads as they are rebuilt and maintained. The adapt scenario incurs up-front costs to adapt a road to mitigate future damages that are projected from increases in precipitation or temperature. For unpaved road infrastructure, roads are upgraded to an adapted gravel road and therefore are less susceptible to increased precipitation impacts. This approach is intended to provide an indication what is possible. Perfect foresight is not realistic, however it provides a broad indication of what scenarios and conditions may exist and, thus, can inform policy decisions.
No adapt: The no adapt policy approach assumes no adaptation options are enacted and roads are rebuilt according to baseline design standards. The costs incurred are from the increased maintenance needed to retain the design life of the original road (i.e., to overcome the degradation in road infrastructure from climate change stressors).
Maintenance savings: Maintenance savings is reported in order to emphasize the costs and benefits associated with adaptation in Vietnam. Maintenance costs are applied to unpaved (dirt) roads. Many of the costs of an unpaved road network arise from precipitation damage or traffic levels. (Traffic levels are approximated by information on population density.) Upgrading dirt roads to gravel surfaces reduces annual maintenance requirements because gravel is more resistant to both precipitation and traffic. Therefore, maintenance savings represent both the savings in traditional maintenance that would have been required for the dirt surfaces, as well as the additional maintenance that would be required due to increased precipitation from climate change.
6. Study Results
6.1. National Climate Change Damages with and Without Adaptation Policy
The estimates presented in this section are for the total cost of new construction, maintenance and repairs for the existing road inventory. The “mean GCM” is the GCM whose total damage cost without adaptation is closest to the average total damage cost of all no adapt scenarios among the 25 GCMs. However, as discussed below, the GCMs are unevenly distributed across the range of damage cost estimates and so, depending on the concern of policy makers, the extremes or quartile numbers may be of more interest to policy makers than the mean. We therefore present the results minimum and maximum damage cost scenarios.
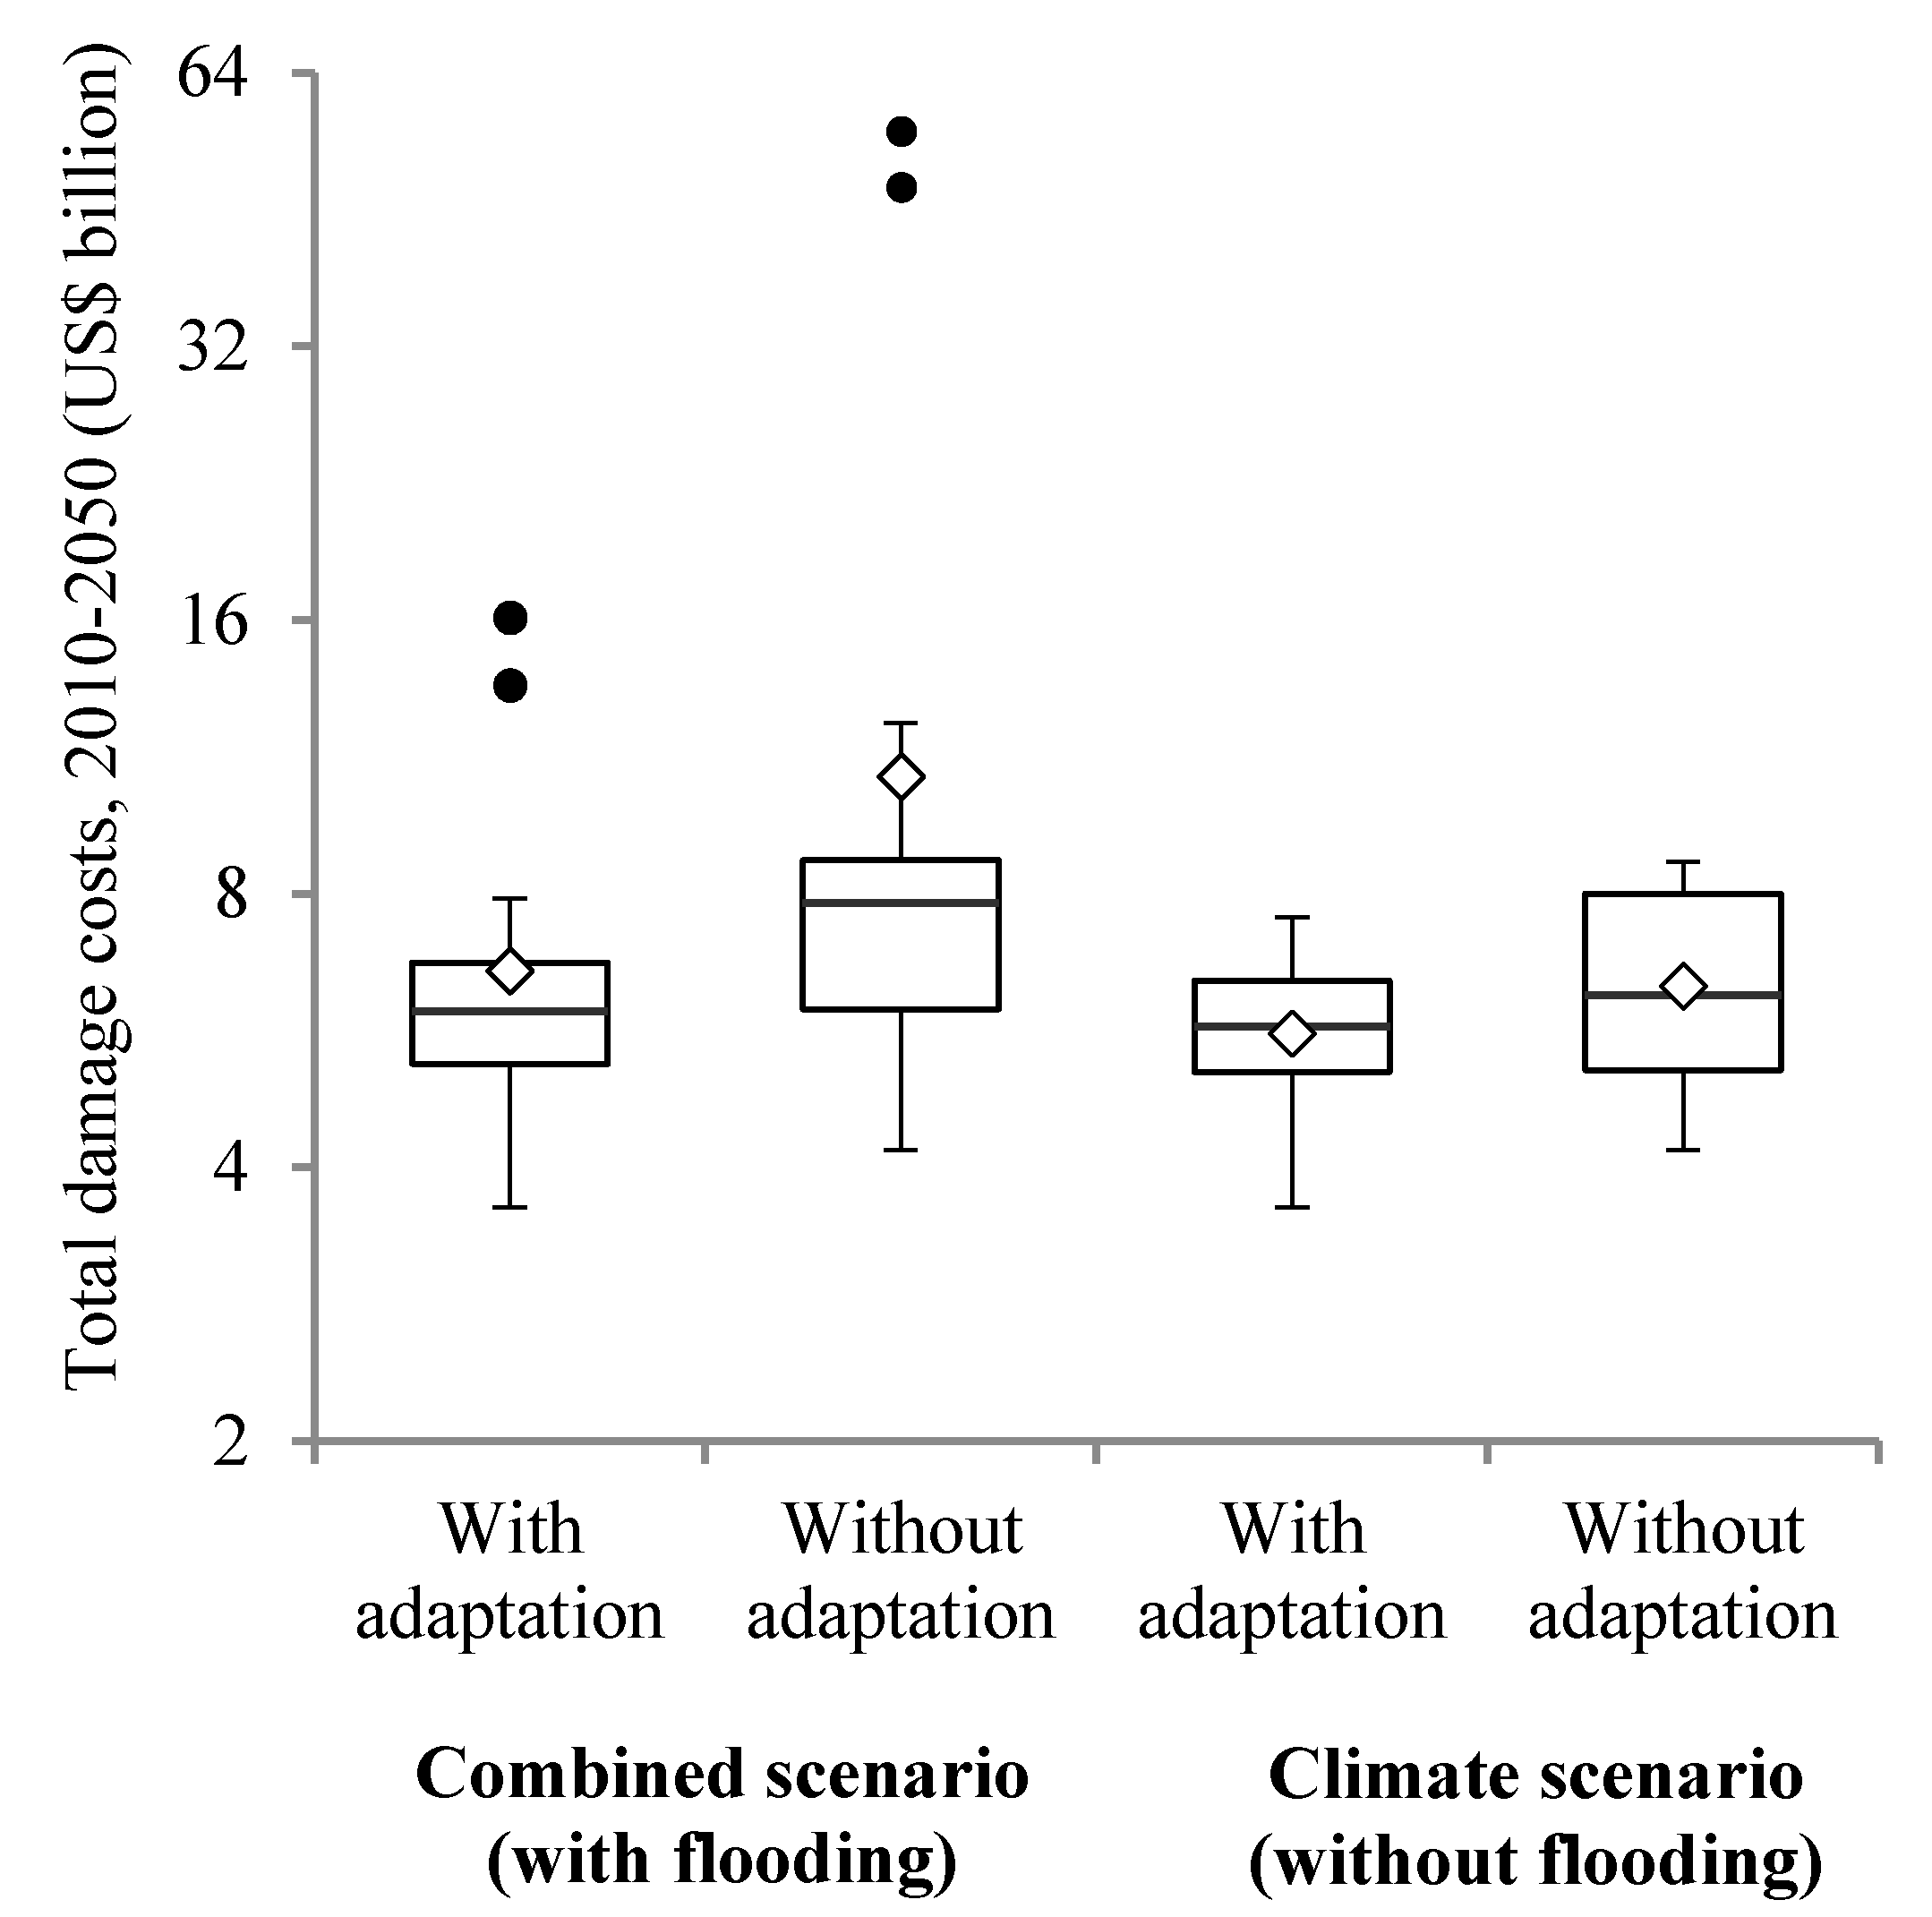
Figure 1 reports the distribution of total damage costs across the 25 GCM projections, both with and without adaptation policy. Combined costs include impacts from flooding, temperature and precipitation. We first consider scenarios that allow for adaptation policies that optimally maintain road stocks. The figure shows that the combined damage cost estimates for a majority of climate projections (88 percent) lie between US$3.6 billion and US$7.2 billion. Only two extreme GCMs lead to total damage costs greater than US$14 billion. However, even the lower projection that generates US$3.6 billion in damages has an opportunity cost of 32 percent, implying that more than 24,000 kilometers of secondary paved road could be built with the money that will need to be diverted to adaptation spending.
Figure 1.
Damage costs for road infrastructure, 2010–2050. The box represents the 25th–75th percentile of results from the scenarios. The median is the line inside the box. The whiskers represent the broader 5th percentile to 95th percentile of results. Results outside the statistical distribution of probability are indicated as points outside the whiskers. Notes: Combined scenario includes damages from temperature, precipitation and flooding. Logarithmic scaled. Dots are outliers and diamonds are means.
As illustrated in
Figure 1, the damage estimates can be decomposed into climate stressor (
i.e., precipitation and temperature) and flooding components. The total damage costs for the scenarios at the lower end of the distribution are almost entirely a result of climate stressors, with very modest (often zero) flooding damages to road stocks. The uneven distribution of the combined damage costs in
Figure 1 is due to the uneven distribution of flooding impacts.
We now consider scenarios without adaptation.
Figure 1 shows that damage cost estimates are significantly higher without adaptation for the same set of GCMs. Again, the damage costs for 22 out of 25 GCMs (88 percent) fall within the lower end of the distribution, with only a few GCMs projecting more extreme climate impacts. The minimum damage cost without adaptation is US$567 million higher than the scenario with adaptation. Both the mean and maximum damage estimates are substantially higher without adaptation; an incremental cost of US$4.7 and US$39 billion, respectively. This “adaptive advantage” suggests that policy makers should consider a pro-active approach to adapting to climate change. For instance, in the maximum damage scenario without adaptation has an opportunity cost of 482 percent. This means that an equivalent of 367,000 kilometers of new secondary paved road could be built with the funds diverted to mitigating climate change damages. Even in the mean damage scenario, the opportunity cost is 92 percent and equivalent to about 70,000 kilometers of new secondary paved road stock. This is significantly higher than the opportunity costs when adaptation of road infrastructure is undertaken,
i.e., 341 and 41 percent for the maximum and mean damage scenarios, respectively.
Maintenance savings measures the savings derived when adaptations are adopted for road infrastructure. This measure is required because the cost incurred in upgrading dirt and gravel roads can be offset by savings in the annual maintenance required by lower quality road infrastructure.
Table 2 and
Table 3 report the maintenance savings, damage costs and adaptive advantages for the minimum, mean and maximum damage scenarios (
i.e., 3 of the 25 GCMs shown in
Figure 1) for both the combined impacts and the impacts without flooding.
Table 2.
National damage costs from combined climate change impacts, 2010–2050.
Table 2.
National damage costs from combined climate change impacts, 2010–2050.
| | GCM Damage Cost Ranking |
|---|
| | Maximum | Mean | Minimum |
|---|
| With adaptation | | | |
| Total cost (US$ mil.) | 16,105 | 5779 | 3613 |
| Opportunity cost (%) | 141 | 51 | 32 |
| Maintenance savings (US$ mil.) | 0 | 4540 | 1730 |
| Without adaptation | | | |
| Total cost (US$ mil.) | 55,149 | 10,560 | 4180 |
| Opportunity cost (%) | 482 | 92 | 37 |
| Adaptive advantage | | | |
| Total cost (US$ mil.) | 39,044 | 4781 | 567 |
| Opportunity cost (%) | 341 | 42 | 5 |
Table 2 highlights the advantage of an adaptation strategy when the combined impacts are considered. As illustrated, the mean damage scenario has an adaptive advantage of US$4.8 billion,
i.e., the difference between the total costs with and without adaptation. When maintenance savings of US$4.5 billion are included, the overall benefit of adaptation almost doubles to US$9.3 billion. This highlights the benefits of pro-active adaptation policy that includes long-term investments in improved road infrastructure. Even in the minimum damage scenario there are clear benefits to adaptation in the form of maintenance savings,
i.e., US$1.7 billion. Maintenance savings lower adaptation costs and raise the adaptive advantage under all GCM scenarios. However, it should be considered that a few GCM scenarios result in little or no difference between the damage costs with and without adaptation. This is because the climate stressor impacts for these scenarios derive from single events where repair costs are equal to or less than the costs of pro-active adaptation. For example, for the GCM “MIROC3_2(medres)_A2”, the cost of adaptation equals the cost of reactive maintenance (see
Appendix Table A1).
Table 3 illustrates a different perspective when the flooding impacts are removed. As illustrated, the variation in the potential impact is reduced when the potential impact of flooding is removed. The adapt maximum impact scenario has a cost of US$7.5 billion with an opportunity cost of 66 percent. The no adapt maximum impact scenario is only slightly higher at US$8.7 billion. Similarly, the Mean results for these scenarios are US$5.8 and US$6.4 billion respectively. This lack of variation in both the range of impacts and the adaptation advantage is reflective of: (1) the similarity in projections of the GCMs in terms of precipitation and temperature trends and (2) the variation in projections for individual precipitation events resulting in flooding occurrences.
Table 3.
National damage costs from climate impacts only, 2010–2050.
Table 3.
National damage costs from climate impacts only, 2010–2050.
| | GCM Damage Cost Ranking |
|---|
| | Maximum | Mean | Minimum |
|---|
| With adaptation | | | |
| Total cost (US$ mil.) | 7543 | 5778 | 3613 |
| Opportunity cost (%) | 66 | 51 | 32 |
| Maintenance savings (US$ mil.) | 0 | 4540 | 1730 |
| Without adaptation | | | |
| Total cost (US$ mil.) | 8668 | 6394 | 4180 |
| Opportunity cost (%) | 76 | 56 | 37 |
| Adaptive advantage | | | |
| Total cost (US$ mil.) | 1125 | 616 | 567 |
| Opportunity cost (%) | 10 | 5 | 5 |
6.2. Damages from Rising Sea Levels
We evaluate the impact of a one-meter rise in sea levels on land inundation and roads damages. Based on the existing road inventories and provincial allocations, one meter SLR would inundate, and hence destroy, 19,000 kilometers of roads in Vietnam, which is equivalent to 12 percent of existing road stocks. As reported in
Table 4, rebuilding these damaged roads would cost approximately US$2.1 billion.
Table 4.
National road damages from one meter sea level rise.
Table 4.
National road damages from one meter sea level rise.
| | Road Damages, 2010–2050 |
|---|
| | Kilometers | US$ mil. |
|---|
| All road types | 19,142 | 2089 |
| Paved primary | 1621 | 810 |
| Paved secondary | 3775 | 566 |
| Paved tertiary | 3719 | 260 |
| Gravel tertiary | 9024 | 377 |
| Unpaved tertiary | 1003 | 75 |
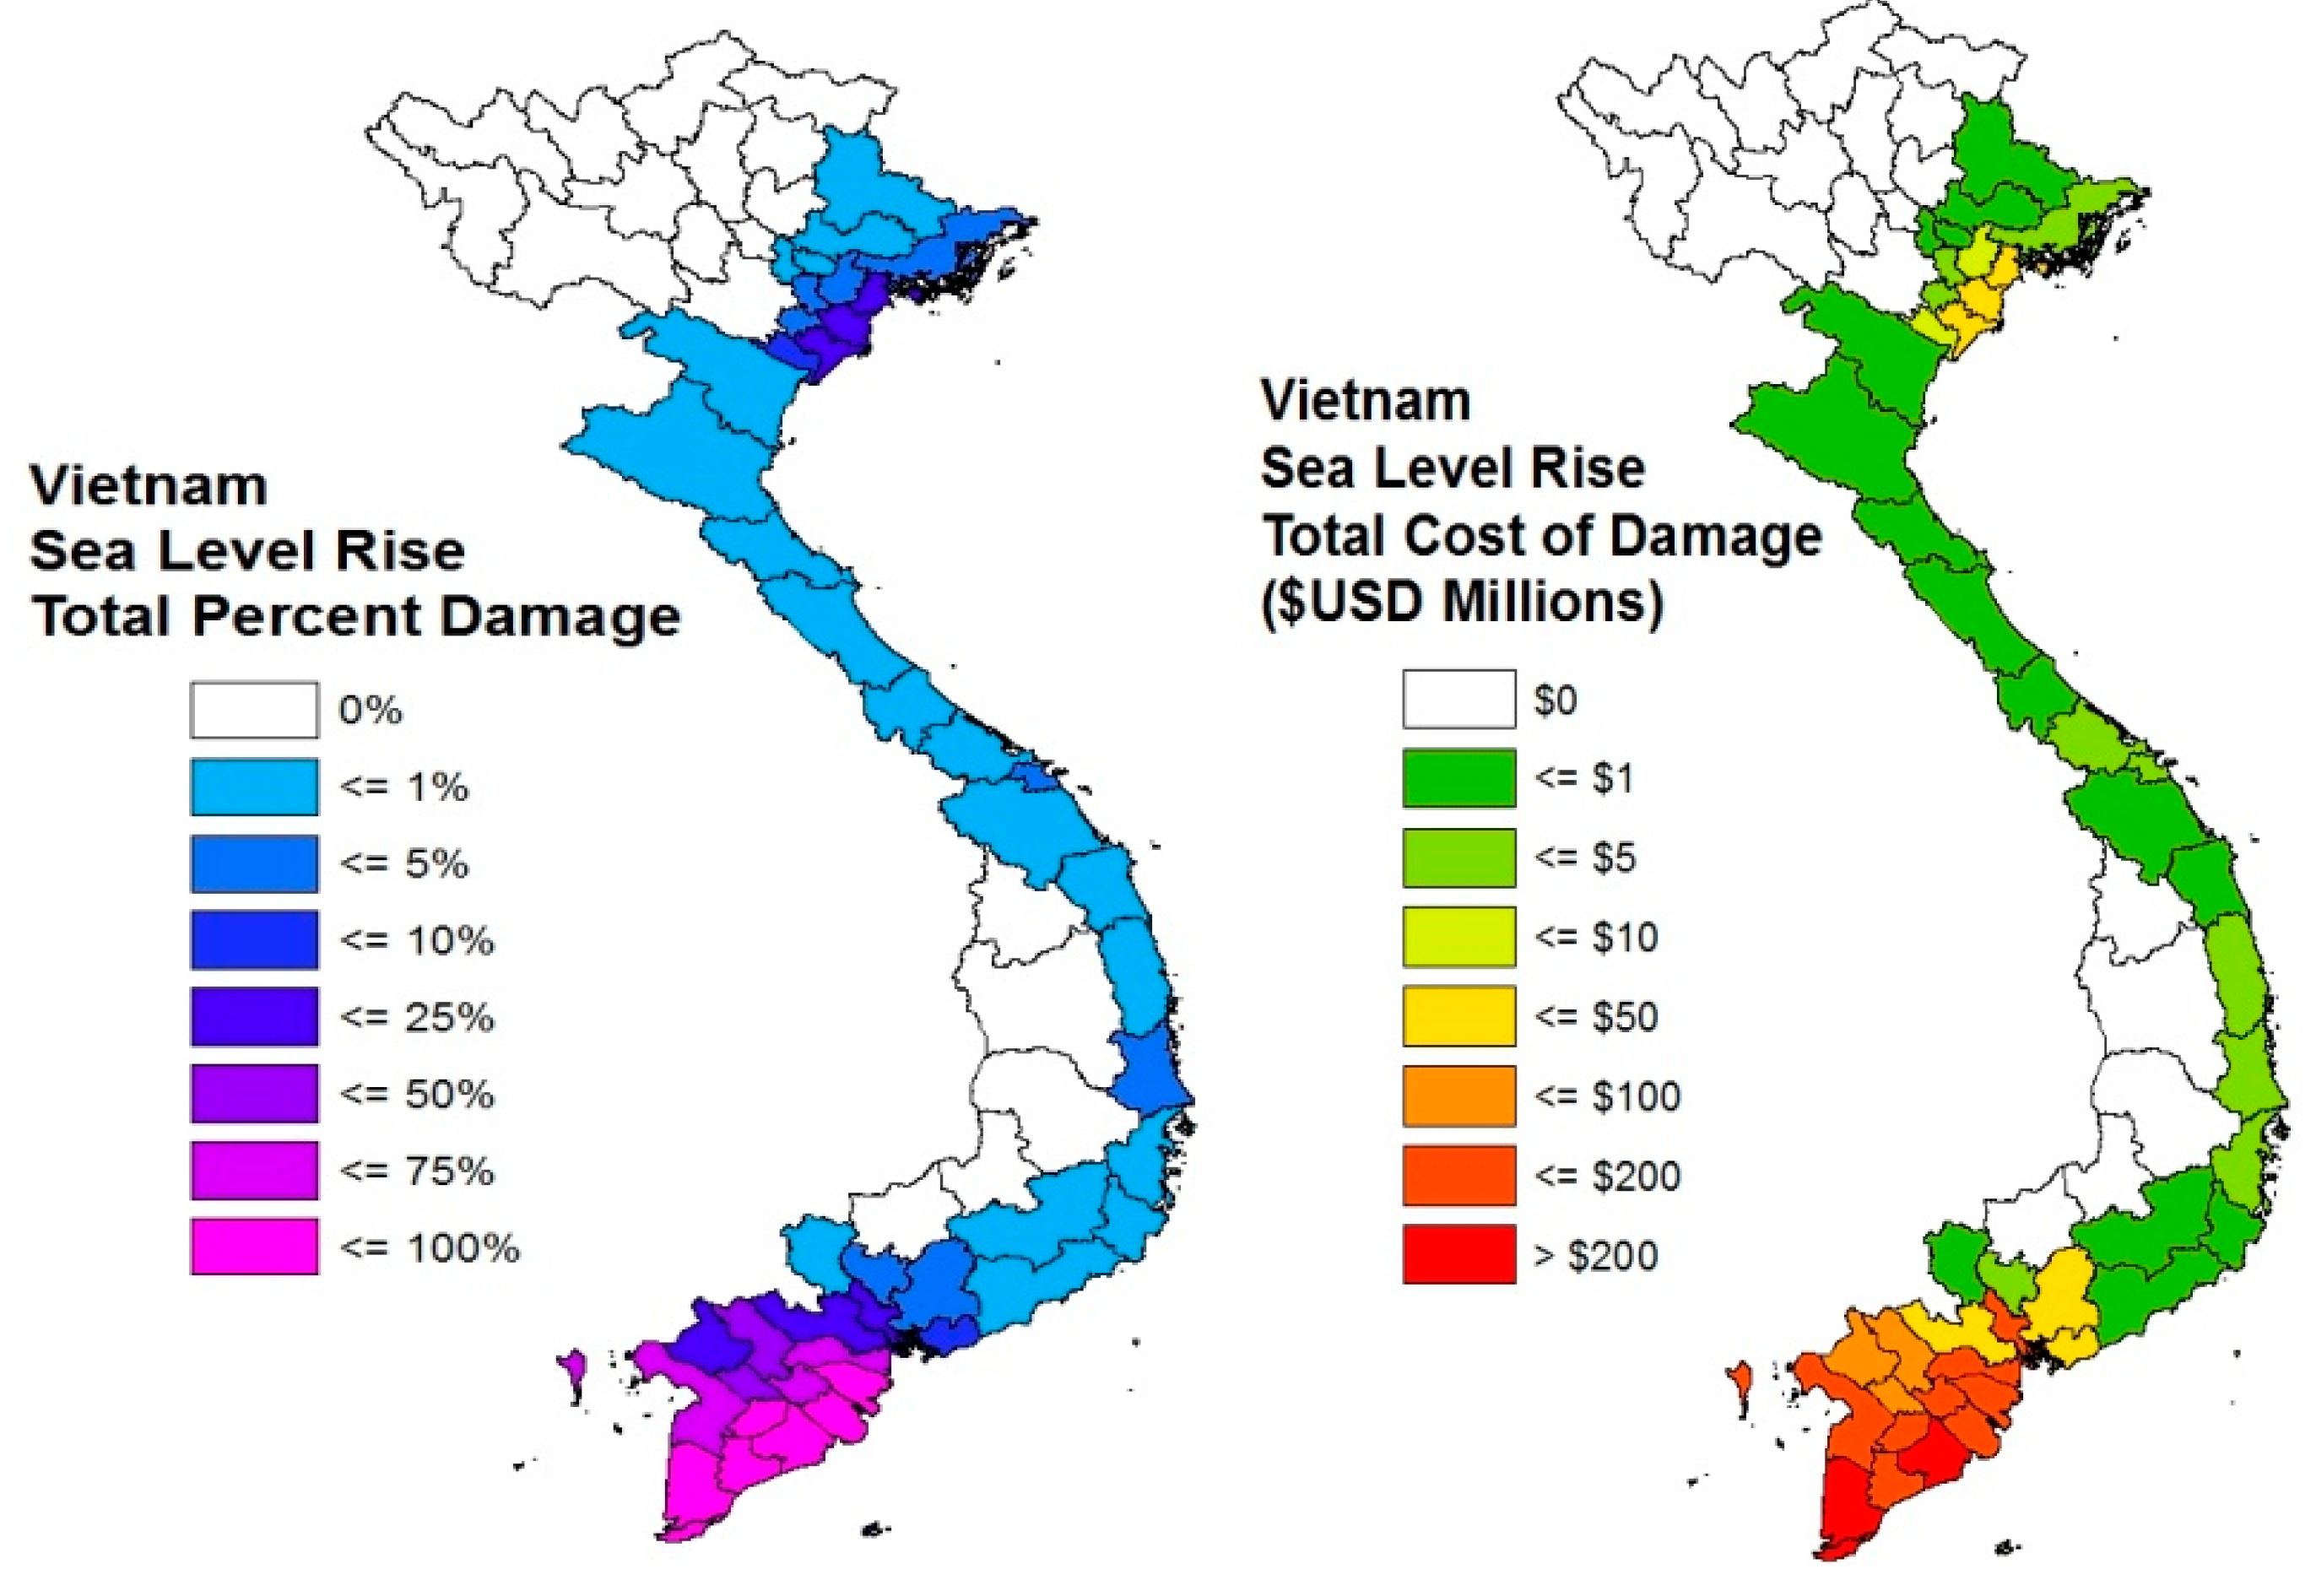
Road damages from SLR are unevenly distributed within the country, with most road losses occurring in the southern coastal regions of the country. There is complete inundation in several provinces, resulting in a total loss of road infrastructure (
i.e., in Bac Lieu, Hau Giang, Soc Trang, Tra Vinh and Ca Mau). As a region, the Mekong River delta is most vulnerable, with ten of the most affected provinces located within the region and where an average of 77 percent of road infrastructure is destroyed (
i.e., nearly 15,200 kilometers).
Figure 2 shows the share of road stocks in each province that would be destroyed by SLR (left-hand side) and the total cost of rebuilding these roads (right-hand side). It should be noted that the coastal plain geography of Vietnam and the river deltas located in the south will result in landlocked regions being affected by sea level rise. However, these results are also a reflection of the coarse granularity of the estimates provided for this study. A more detailed analysis would include a detailed incorporation of local geography.
Figure 2.
Provincial road damages from one meter sea level rise estimated through 2050. Note: Share of roads destroyed (left-hand side) and cost of rebuilding destroyed roads (right-hand side).
Figure 2.
Provincial road damages from one meter sea level rise estimated through 2050. Note: Share of roads destroyed (left-hand side) and cost of rebuilding destroyed roads (right-hand side).
6.3. Regional Level Results
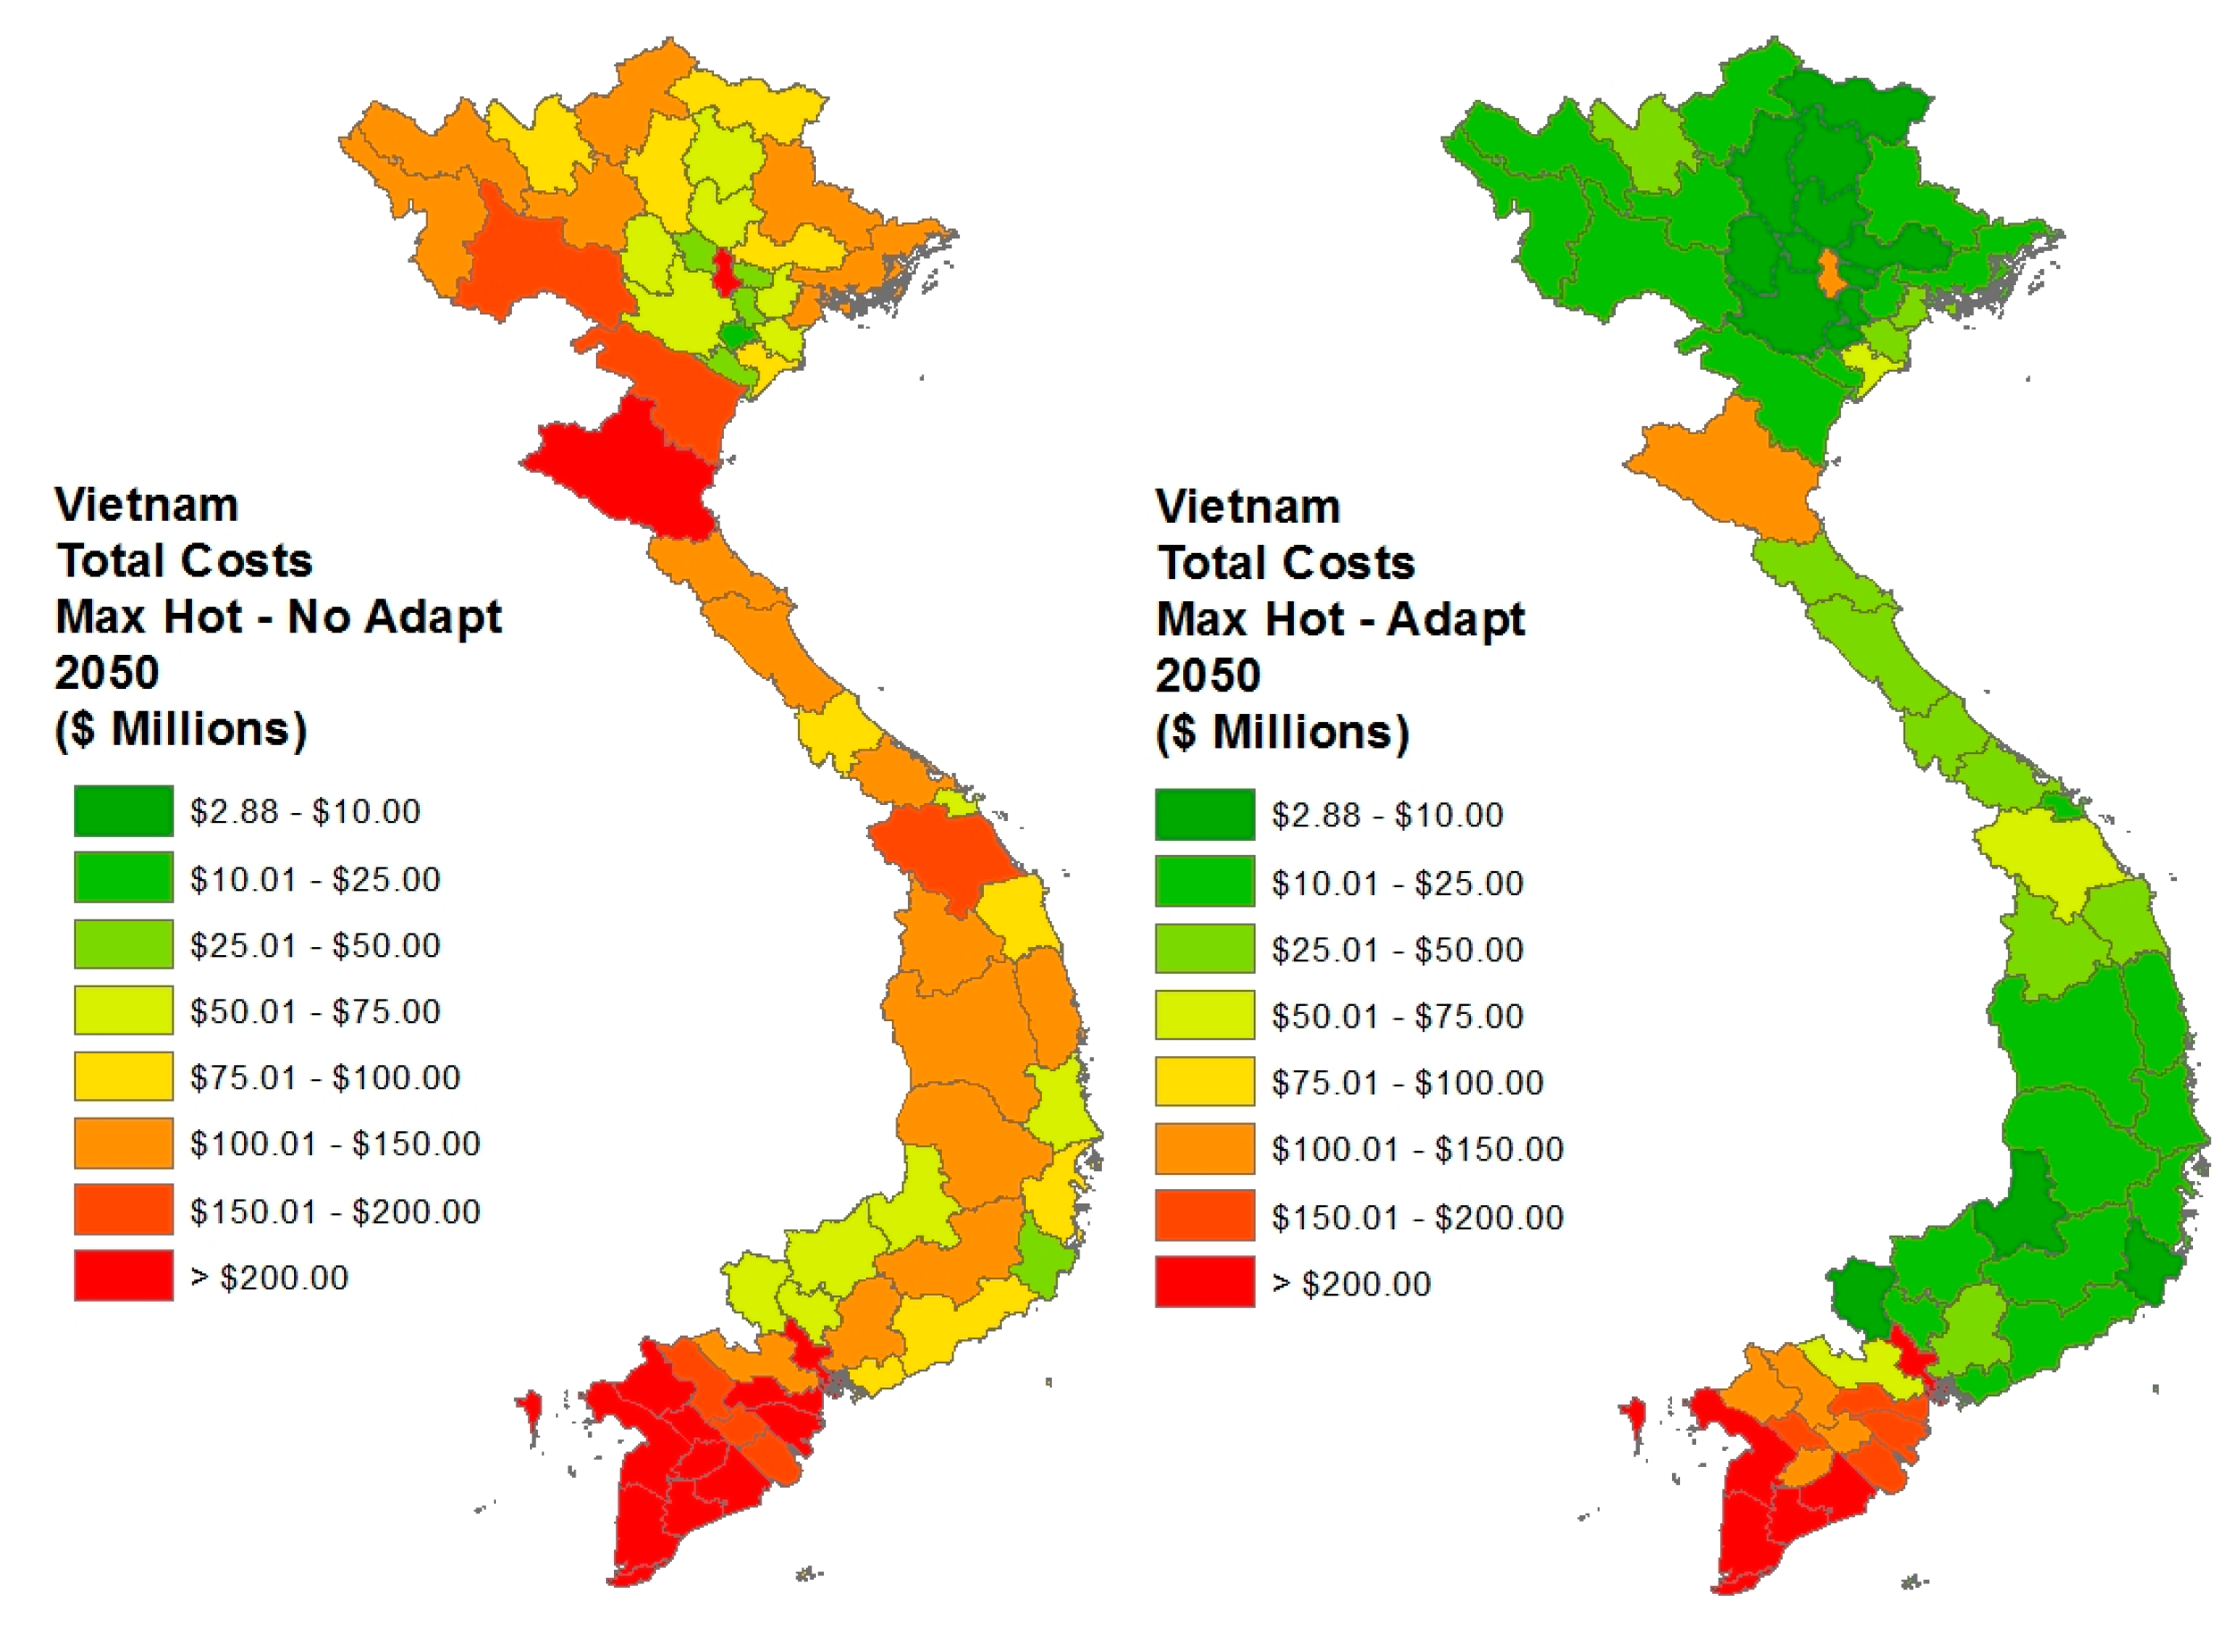
Vietnam has a diverse geography, ranging from coastal lowlands to higher plains and mountainous terrain in the north. Climate change will affect these areas differently, especially the impacts of SLR, and so sub-national analysis is essential. We select two GCMs that represent the 75th and 25th percentiles of climate impact in the adapt scenario for consistency in comparing regional impacts. We discuss the results for each region below. A summary of results is presented in
Table 5 and illustrated in
Figure 3.
Table 5.
Regional damages under the 75th and 25th percentile scenarios, 2010–2050.
Table 5.
Regional damages under the 75th and 25th percentile scenarios, 2010–2050.
| | Damage Costs (US$ mil.) | Opportunity Costs (US$ mil.) |
|---|
| | With Adaptation | Without Adaptation | With Adaptation | Without Adaptation |
|---|
| 75th percentile | | | | |
| Central highlands | 24.5 | 119.2 | 10 | 48 |
| Mekong River delta | 170.7 | 259.6 | 129 | 197 |
| Northern central and central coastal areas | 32.2 | 115.9 | 16 | 57 |
| Northern midlands and mountain areas | 11.7 | 100.1 | 7 | 58 |
| Red River delta | 27.8 | 177.2 | 15 | 69 |
| South East | 55.6 | 177.5 | 17 | 63 |
| 25th percentile | | | | |
| Central highlands | 54.4 | 90.6 | 22 | 36 |
| Mekong River delta | 193.1 | 213.4 | 147 | 164 |
| Northern central and central coastal areas | 48.2 | 67.1 | 25 | 34 |
| Northern midlands and mountain areas | 20.7 | 52.8 | 12 | 31 |
| Red River delta | 37.6 | 92.4 | 18 | 38 |
| South East | 97.7 | 152.5 | 33 | 54 |
Figure 3.
Provincial total damages costs for the maximum hot scenarios, 2010–2050.
Figure 3.
Provincial total damages costs for the maximum hot scenarios, 2010–2050.
Central highlands: This region is the least affected by SLR since none of its provinces have coastal boundaries. Therefore, all damage costs are from climate and flooding stressors. Adaptation policy saves nearly US$100 million in the “maximum hot” scenario, which is the cost difference from expanding existing infrastructure by nearly 50 percent as opposed to a 10 percent opportunity cost for adaptation.
Mekong River delta: This region incurs the largest total and opportunity costs of all regions under the combined climate change scenarios. This can largely be attributed to SLR, given that most of this southernmost region in Vietnam is at an elevation of less than three meters. In the region’s thirteen provinces, coastal inundation destroys between 14 and 99.5 percent of provincial road infrastructure. More than three quarters of the national cost of SLR is borne by this region (i.e., US$1.6 billion).
Northern central and central coast area: Climate change impacts in the selected GCMs show that impacts in this region are quite modest relative to other regions in Vietnam. However, total costs reach as much as US$115.9 million under the maximum hot scenario, with an opportunity cost of 57 percent. Adaptation policy reduces this opportunity cost to 16 percent, which is a savings of US$83.7 million. Even though the median hot scenario has a lower projected impact (25 and 34 percent with and without adaptation, respectively), there is still a significant benefit to adaptation of road infrastructure. Approximately one percent of the region’s road stock is affected by SLR and this exposure is fairly evenly distributed across provinces (ranging from 0.03 to 1.3 percent). The largest damages occur in Da Nang and Phu Yen provinces, with costs of US$1.6 and US$2.4 million, respectively, and with road losses of 44 and 29 kilometers, respectively.
Northern midlands and mountain areas: With adaptation policy this region incurs the lowest total and opportunity costs from climate change. This is partly because of the region’s location away from the coast: the largest SLR impact is in Bac Giang where less than 1 percent of roads are destroyed (i.e., three kilometers of roads at a replacement cost of US$162,000). The climate impacts from temperature, precipitation and flooding could cost as much as US$100 million, but with adaptation this is reduced to US$11 million. Adaptation policy is therefore highly effective in this region.
Red River delta: SLR destroys six percent of this region’s roads, with losses as high as 21 percent in some provinces. Adaptation policy reduces total climate damage costs by nearly US$150 million under the maximum hot scenario. The opportunity cost savings from adaptation are similar across the two GCM scenarios in this region, but vary significantly without adaptation policies. This highlights the effectiveness of adaptation in reducing both the magnitude and variation of potential climate change damages. Avoiding a “worst case” scenario through adaptation policies that limit road infrastructure damages will be crucial in this region’s densely populated urban areas, especially within the capital city, Hanoi.
South East: This small region contains key urban centers, including Ho Chi Minh City. Road losses from SLR vary across provinces from 0 percent–21 percent, with Ho Chi Minh at the upper end of this distribution. With approximately 6800 kilometers of roads, this region incurs a total cost of US$165 million in the maximum hot scenario, and a potential road loss of 1360 kilometers. Adaptation generates savings of US$122 million, which again underscores the need for pro-active infrastructure adaptation policy.
7. Discussion and Conclusions
Vietnam’s policy makers recognize the crucial role that road infrastructure will play in supporting the country’s economic development. However, as with most long-term investments, there is a trade-off between short- and long-run policy objectives. For road investment, the trade-off is most clearly seen in the choice between building a longer network of less expensive roads, or a shorter network of more climate-resilient (paved) roads. Climate change further complicates this tradeoff by introducing greater climate uncertainty into the planning process, and by changing the potential returns to building paved roads (and the costs of maintaining them). It is essential then that policy makers have information that reflects not only the complexities of road investments, but also, given the long life-span of roads, the potential implications of climate change.
In this paper, we have expanded on existing qualitative studies by estimating the damage costs from climate change and quantifying the long-run benefits of adaptation policies. We have used stressor response functions to estimate how temperature, flooding and precipitation projections from climate change models will affect road conditions and maintenance costs. Our model accounts for differences in road surface types, and for specific engineering-based adaptations to make roads more resilient to adverse climate changes. By integrating these stressor response functions with traditional costing methods, our analytical framework can estimate damage costs in detailed sun-national regions. Importantly, using existing expenditures, road inventories and estimated cost impacts, our framework provides an initial estimate of the opportunity costs of adaptation in the road. Unlike many previous studies, we used a number of GCMs and emission scenarios, and therefore provide a more comprehensive assessment of the range of potential climate change damages.
Our findings indicate that predicted changes in temperature, precipitation and flooding present a threat to Vietnam’s road infrastructure. In the worst-case climate scenario, total damage costs at the national level are as high as US$55 billion over the period 2010–2050 (undiscounted and in 2010 prices). However, this is an extreme outcome, with a majority of damage estimates falling between US$4 billion and US$9 billion. Most of this variation in damages across GCMs comes from the effects of flooding. Our analysis indicates high returns to adaptation policies that seal unpaved roads and make them more precipitation and flood-resistant. Moreover, the costs of adaptation are lower when maintenance savings are taken into account. These are the savings that arise from reducing the susceptibility of roads to deterioration from weather. These maintenance savings offset the higher construction costs of roads with improved surfaces.
We also estimated the potential road network damages resulting from rising sea levels, as well as the cost of replacing these roads. Sea levels are a major concern for Vietnam due to its 3400 kilometer coastline and the low elevation of the country’s river deltas. This geography creates a scenario where extensive damage to road infrastructure could occur if sea levels rise by as much as one meter. It should be noted that the one meter rise is not predicted to happen before 2050 (depending on what analysis is chosen). As elevation data is only available at one-meter steps, this level was chosen for the study. Our analysis suggests that based on this anticipated sea level rise, potential damages from inundation could amount to over US$2 billion. This is in addition to the damages from changes in inland temperature, precipitation and flooding.
Our paper provides an initial assessment of climate change’s impact on Vietnam’s road infrastructure. There are, however, at least two key limitations where further work is needed. First, the parameter values of our stressor response functions are drawn from the global engineering literature, and so, while our model uses recognized authorities and studies, our quantitative cost estimates depend on the accuracy of these studies and their transferability to the Vietnamese context. Issues such as specific pavement types, local conditions, and construction and maintenance techniques can influence cost assessments. Second, as emphasized, a lack of high resolution elevation data constrained our SLR assessment to a uniform, one meter analysis. More detailed databases, including on the location of coastal infrastructure, would strengthen our analysis.
The current study provides a starting point for a broader policy discussion. It is intended to start a discussion of what the potential vulnerability of infrastructure is within each region. The study is not a replacement for a detailed engineering analysis. However, the quantitative approach presented here is an advance over existing studies and provides necessary information for evaluating adaptation options for road infrastructure, particularly for Vietnam and other developing countries.


