1. Introduction
In the last few decades, the rapid development of global supply chains brought the food industry to scenarios depicted by energy-intensive production and distribution operations, which supply high-quality and cost-effective products, matching production and demand worldwide. The intensification of food production and distribution is to fulfill the growth of global population, led by new trends in food demand from developed and developing countries [
1,
2]. The food supply chains are organized across the consolidation of raw products, the processing and packaging, the storage, the distribution and the end-of-life (EOL) activities [
3]. Given the importance and the impact of the agro-food industry, the design and planning of effective and sustainable supply chains is mandatory to address global environmental issues.
The actors and the stakeholders (e.g., farmers, packagers, vendors, retailers, carriers), the objectives (e.g., reduction of costs, service level improvements) and the processes involved in the supply pipeline make the food supply chain a challenging context in which to implement environmental care strategies [
4]. Reducing the carbon footprint is one of the key strategies toward more sustainable food supply chains [
5,
6]. Nevertheless, the processing, packaging, storage and distribution of food and beverage products are still deeply fossil fuel dependent and contribute significantly to the global greenhouse gas (GHG) emissions.
Life cycle assessment (LCA) is a renowned methodology to assess the environmental impacts associated with a product or process (
i.e., a system) throughout its life cycle (
i.e., “from cradle to grave”). The LCA methodology studies how the observed system affects the environment and natural resources, thereby supporting system improvements and strengthening more sustainable strategies. Many recent studies apply the LCA approach and provide guidelines to elicit pro-environment actions in the food and beverage industry. Some recent examples include Caputo
et al. [
7], who enquire into strategies to support local food supply scenarios, Markussen
et al. [
8], who evaluate the environmental sustainability of vegetable products supplied by small farmers in the U.K., and Torquati
et al. [
9], who focus on the environmental and economic trade-off in biogas energy production for an Italian dairy farm. Manfredi and Vignali [
10] assess the different life cycle phases of tomato puree packaged in a glass bottle, while Del Borghi
et al. [
11] focus on 13 tomato-based products and perform an LCA identifying potential improvements in the cultivation and the packaging phases toward more environmental care in the supply chains. The LCA for the operations of an Italian winemaker case study is proposed by Arzoumanidis
et al. [
12]. These studies assess the system activities, the system inputs (e.g., fertilizers, packaging materials) and quantify some categories of impact, including global warming potential (GWP) and fossil fuel consumption. Accorsi
et al. [
13] focus on transport operations and illustrate a comparison between different shipping container configurations over the economic, the technical and the environmental perspectives, adopting the LCA methodology. The importance of the packaging decisions to reduce the environmental impacts associated with a given product or supply chain is highlighted by recent studies. Toniolo
et al. [
14] compare the existing with the original plastic packaging for food products, demonstrating the environmental benefits resulting from recycling. Siracusa
et al. [
15] use the LCA methodology to demonstrate that the thinning of the plastic film and the adoption of recycled polyamide in food packaging allow a reduction of 25% and 15% of the associated environmental damages.
In this paper, the LCA methodology is applied to a bottle of EVOO from the processing and bottling phase along the distribution chain. The scope of the analysis is evaluating through the LCA methodology the environmental impacts associated with alternative packaging solutions of an olive oil bottle across a global supply chain. The environmental impacts associated with glass and plastic bottles are quantified and illustrated. The boundaries of the observed system include the consolidation of the oil at the bottling facility, the supply of packaging, the processing and bottling phases, the storage and distribution activities and the EOL treatments of package waste. A case study of an Italian representative edible oil bottling company from the Emilia-Romagna region (Italy) is proposed, and the obtained results are illustrated and discussed. This paper aims to inform the EVOO producers, the packaging suppliers and the consumers about the environmental impacts associated with a bottle of olive oil, providing improving solutions for reducing them. The development of this study enables the bottling firm to measure how their processes and decisions regarding the supply of the package, the processing and the product distribution affect the environmental issues. Given the ability to communicate to the stakeholders the environmental performance of a product, as instantiated through an environmental product declaration (EPD) [
16], this LCA methodology sustains the firm in promoting their operations in response to the increasing environmental attention of the consumers.
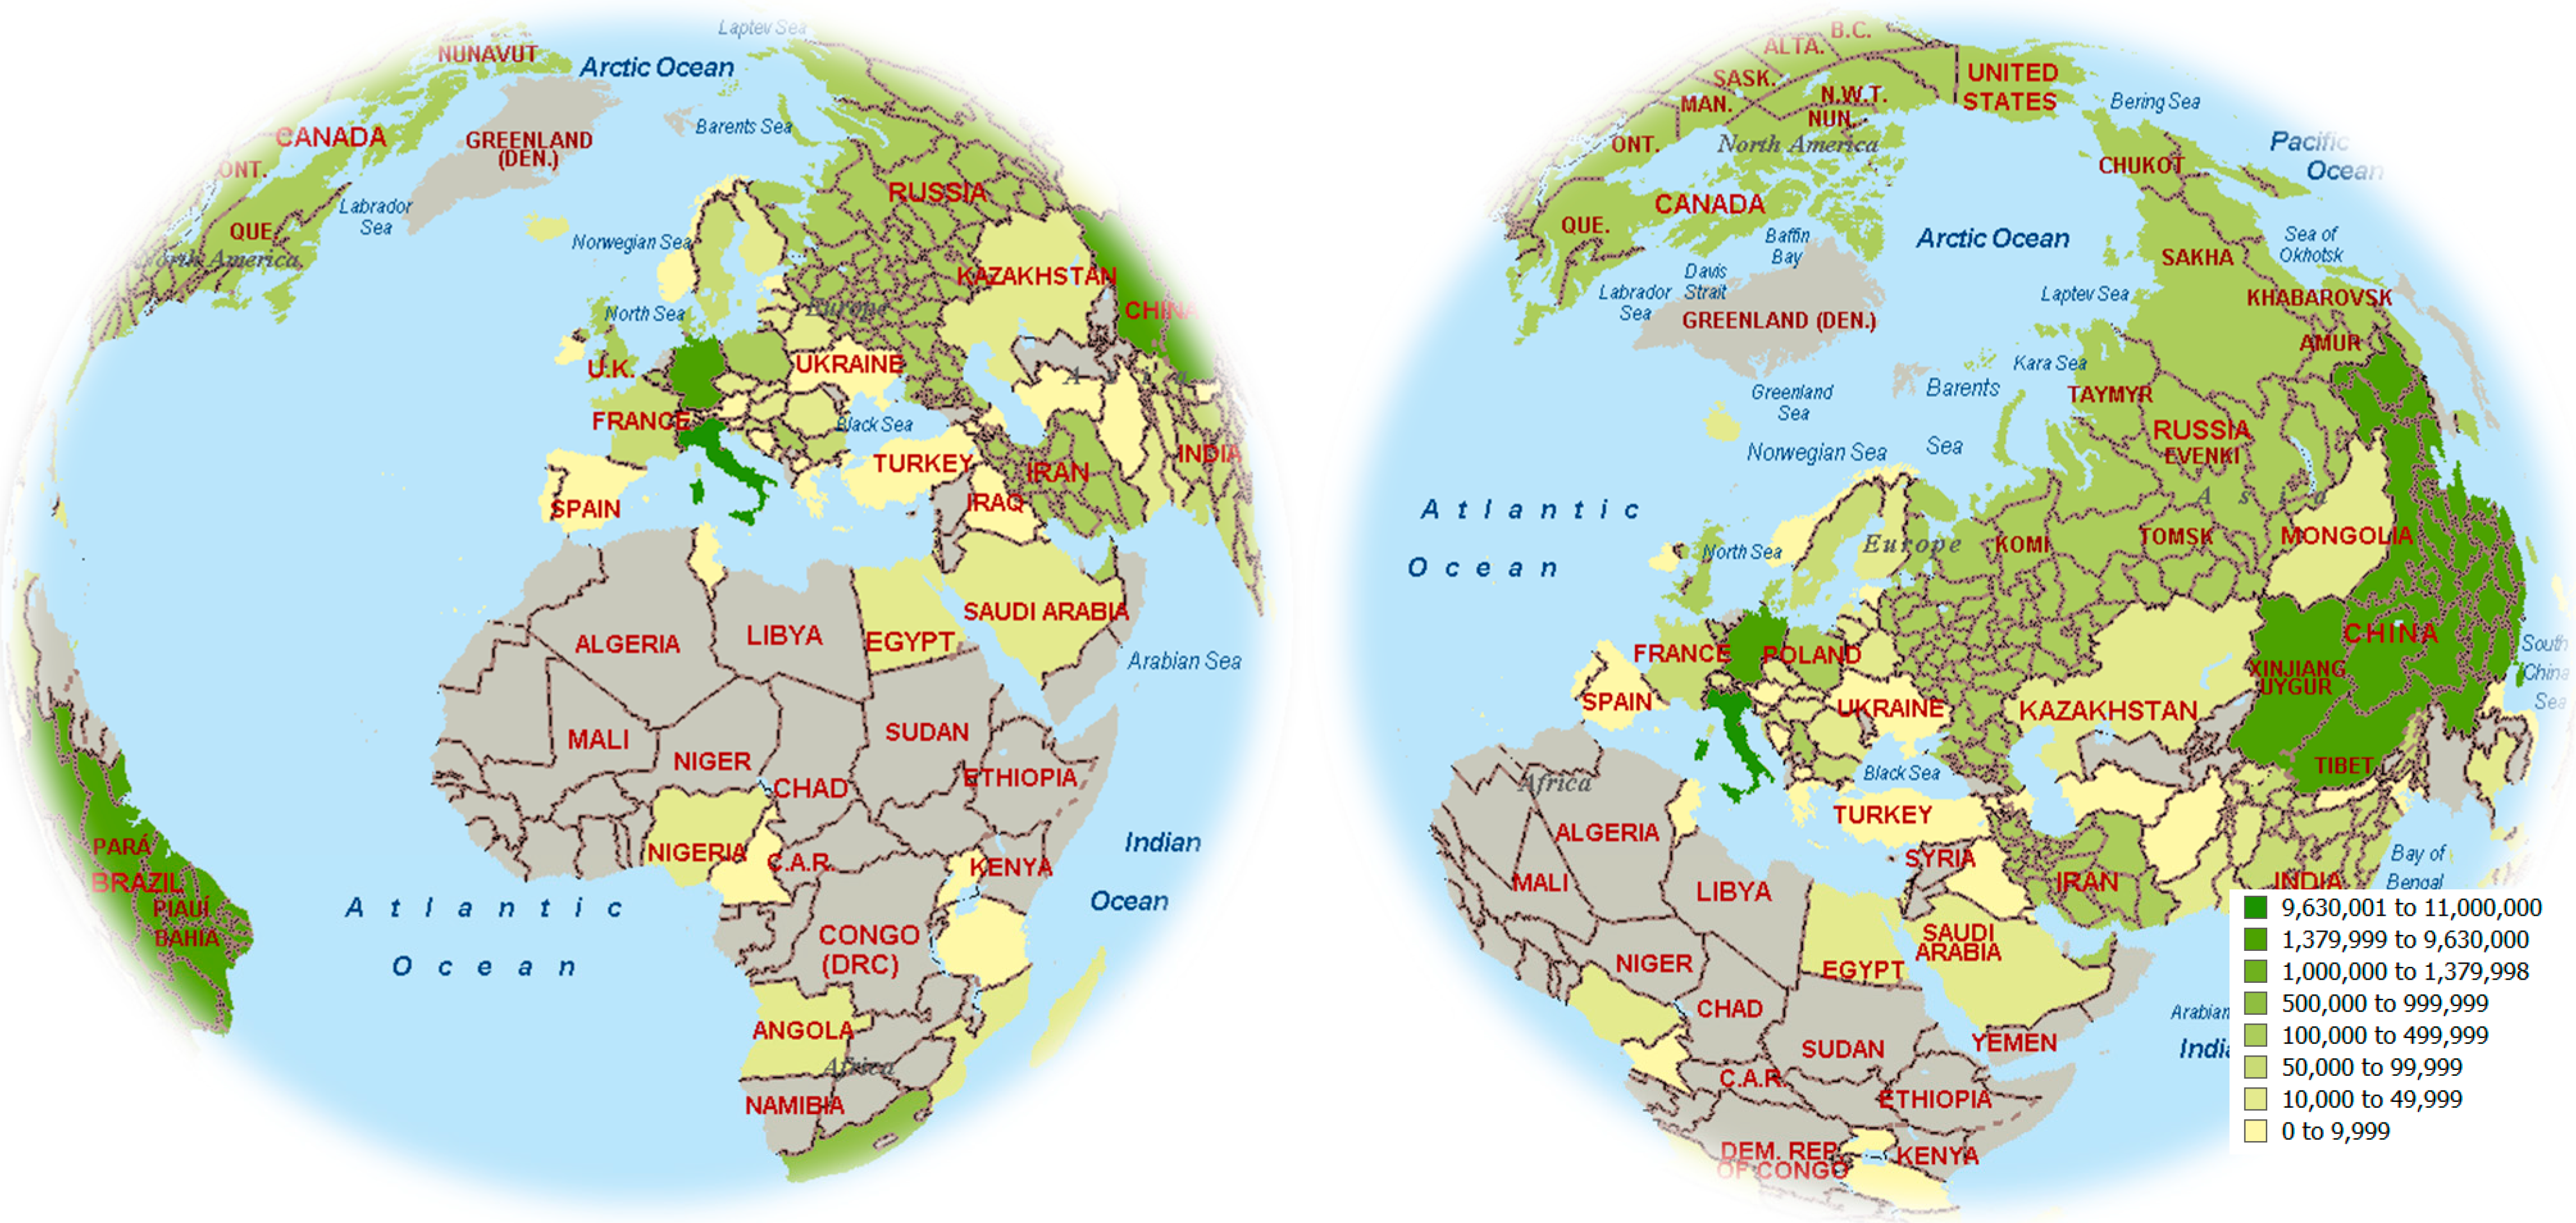
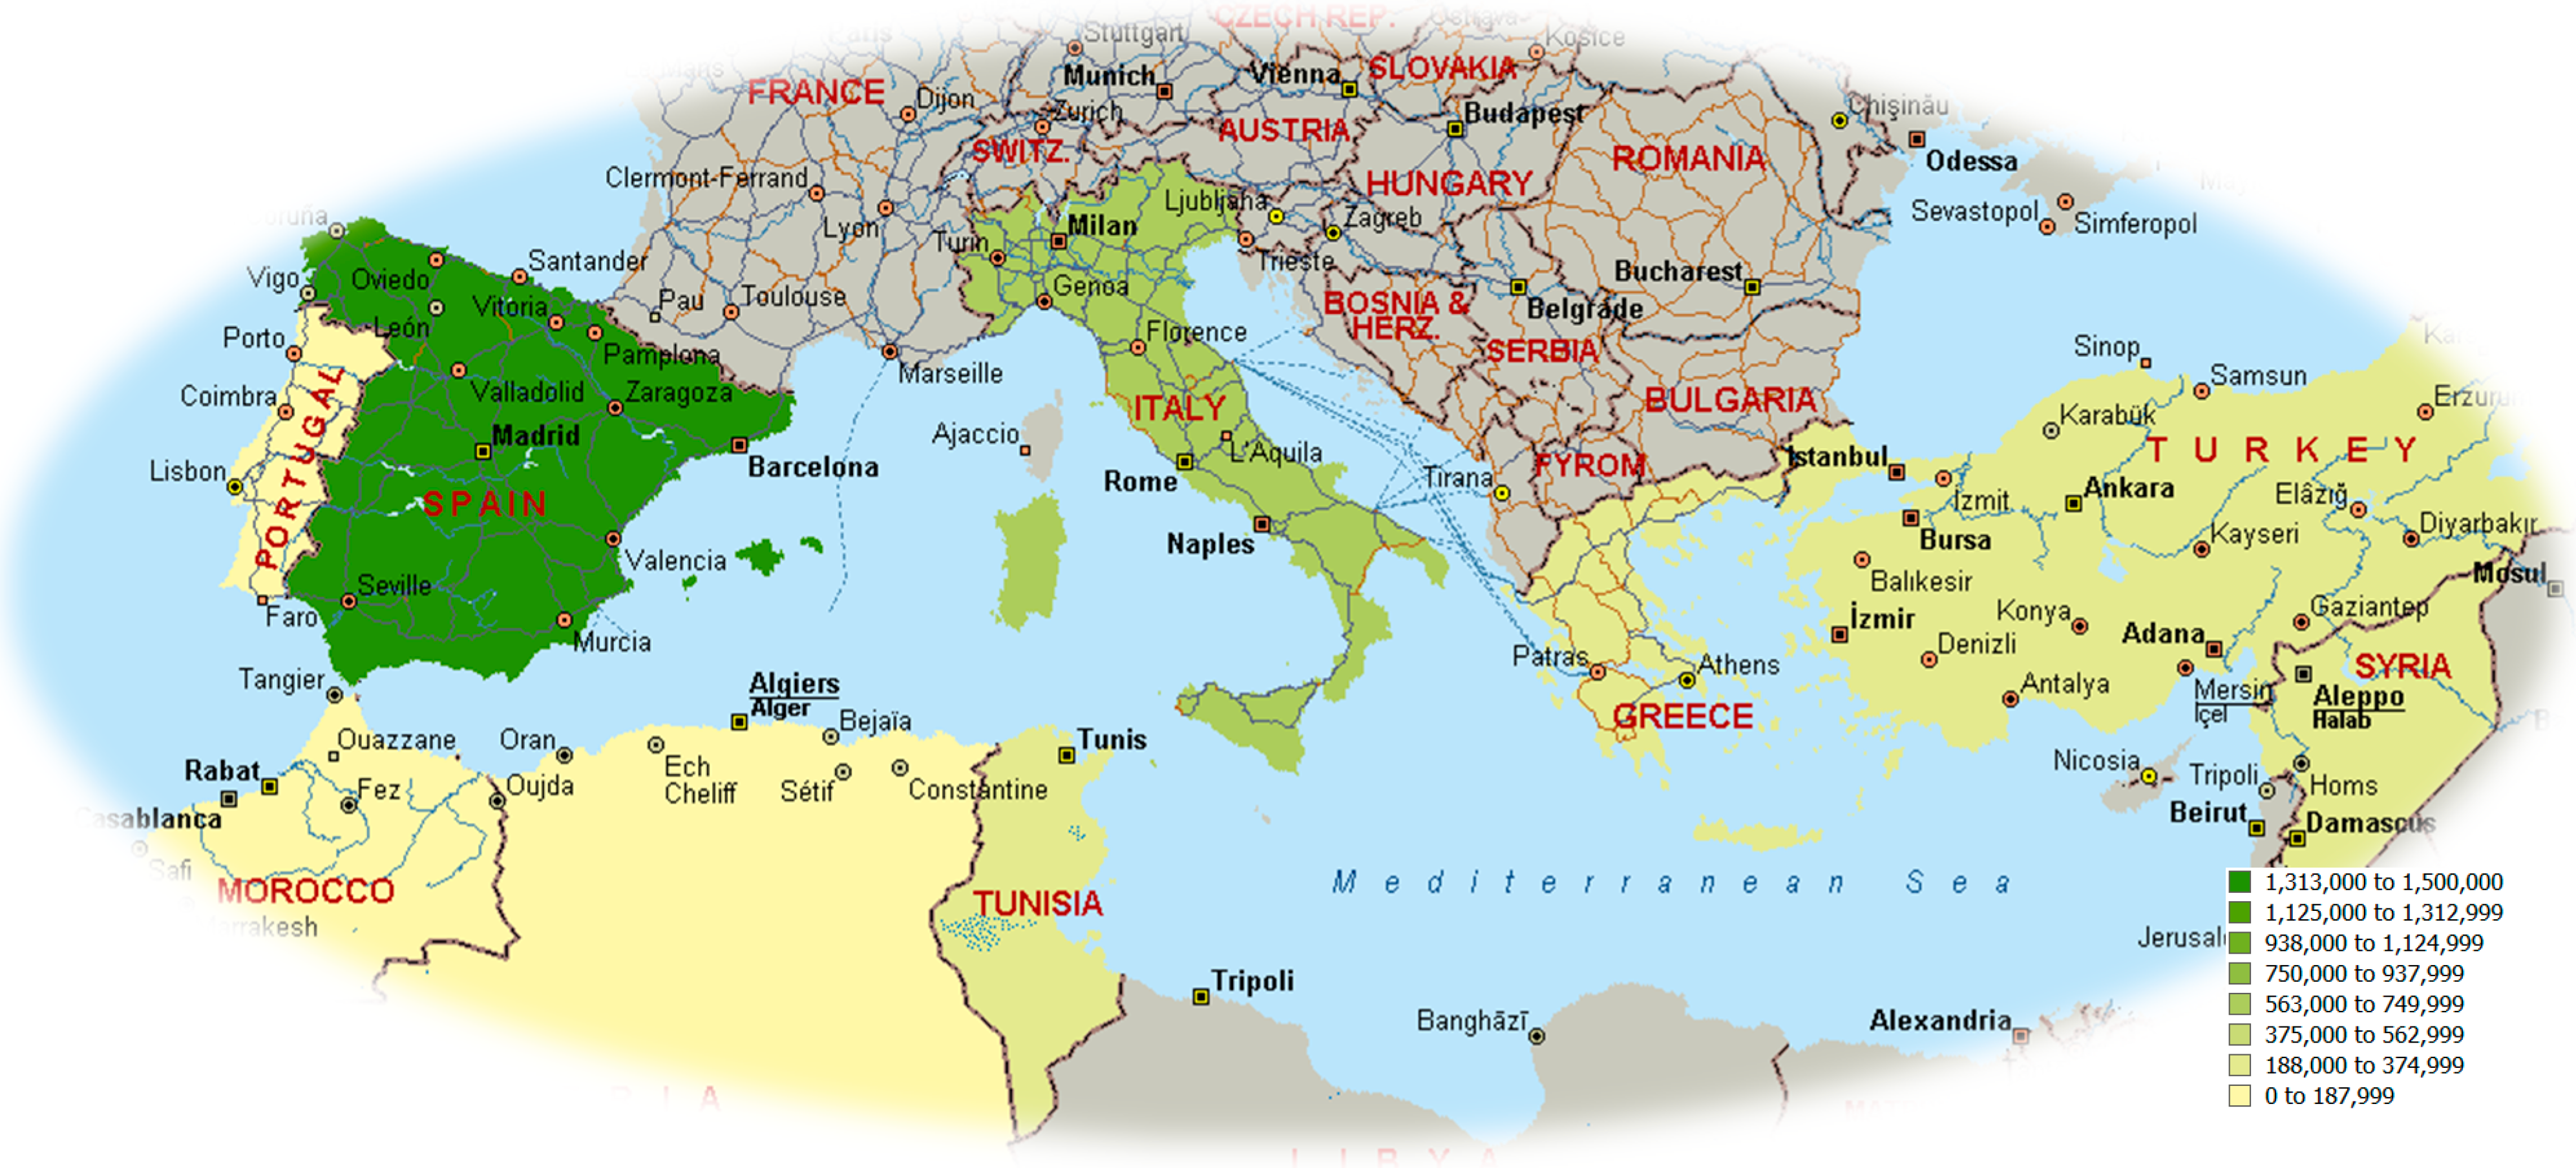
Given the increasing awareness of the benefit of healthier food specialties, food supply chains are expanding to match local production and global demand. EVOO is recognized as one of the healthiest Mediterranean specialties, representing a strategic asset for the countries of the Mediterranean Basin (e.g., Spain, Italy, Greece, Tunisia, Turkey, Morocco, Algeria, Syria, Portugal). Of the approximately 750 million olive trees worldwide, the Mediterranean Basin contains about 95% of the world production of olive oil [
17], with an increasing export demand expected to accelerate further. The annual production per country is reported in
Figure 1 for the main Mediterranean EVOO producers, which overall account for about 3160 kilotons per year [
18]. Given the expected increasing demand of EVOO worldwide, considerations of the resulting impacts of the distribution and the supply chain operations on both the quality [
19] and environmental issues [
20] are necessary to embrace consumers’ needs.
Figure 1.
Distribution of extra-virgin olive oil (EVOO) production across Mediterranean countries [
18].
Figure 1.
Distribution of extra-virgin olive oil (EVOO) production across Mediterranean countries [
18].
Recent contributions from the literature assess the environmental impacts of EVOO supply chains as a whole. Avraamides and Fatta [
21] calculate the consumption of natural resources and the GHG emissions associated with the production of EVOO in Cyprus at the crop level. They measure the impact of fertilization, pruning and soil management, respectively, as 26.7%, 23.3% and 20.6% of the CO
2 emissions released by the production system, with an absolute value of 3.9 kg of CO
2 per liter of olive oil.
Salomone and Ioppolo [
22] analyze the EVOO production system in Sicily (Italy), focusing on the regional growing, milling and bottling processes. They illustrate and compare multiple scenarios for different impact categories, including the land use, fossil fuel consumption, acidification, eutrophication and the impact on climate change and on human health. More recently, Rajaeifar
et al. [
23] assessed the Iranian EVOO production system over the economic, energetic and environmental perspectives and proposed an econometric model to identify the leverage of the olive crop yield (
i.e., between human labor and electricity) and the leverage of the GHG emissions (
i.e., between electricity and fertilizers). Rinaldi
et al. [
24] extend the system boundaries of the LCA methodology and analyze an Italian EVOO supply chain, including the crop, oil processing and bottling phases, the distribution and the EOL activities by reporting the associated carbon footprint and energy footprint.
This paper builds upon the existing research by quantifying the environmental impacts of alternative packaging in a global EVOO supply chain. In this study, the glass bottle and the plastic bottle are considered as alternative primary package solutions, and the resulting scenarios are studied through the LCA methodology from the EVOO and package supply to the EOL of the package waste.
The remainder of this manuscript is organized as follows.
Section 2 illustrates the main steps of the LCA methodology through the definition of the scope of the analysis, the functional unit (FU) and the system boundaries, discussing the methodological choices and the assumptions undertaken.
Section 3 organizes and presents the results of the LCA, focusing on the categories of impact with respect to different packaging scenarios.
Section 3 also presents the discussion of the obtained results and their comparison with the findings from the literature state-of-the-art.
Section 4 concludes the paper, presenting some tips for further research.
2. Methodology
The LCA is a methodology for the holistic assessment of the environmental impacts associated with a given product or process throughout its life cycle [
25]. This analysis complies with the ISO standards 14040:2006 and 14044:2006 [
26,
27], which regulate the definition of the goal and scope of the analysis, the function unit (FU), the system boundaries, the collection of the overall input and output flows of the system, the data analysis, the quantification of the resulting environmental impacts and the interpretation of the results. The analysis is conducted in accordance with product category rules (PCR) [
28], which provide the detailed specifications about what is included in the system boundaries, which FU to choose and which data to collect, in order to guarantee the comparability and replicability of the results.
Dealing with life cycle impact assessment (LCIA), the method Environmental Design of Industrial Products (EDIP) 2003 [
29] is selected for the assessment, and the following impact categories were calculated: global warming, ozone depletion, photochemical ozone formation, acidification, eutrophication and non-renewable energy consumption.
The life cycle inventory (LCI) quantifies the use of resources and materials and the consumption of energy associated with the life cycle phases, including the consolidation of EVOO and packaging, the processing and bottling, the storage and all of the required transport operations. The processes representing the inputs of energy, resources and materials accounting for the EVOO bottle life cycle are extrapolated from Ecoinvent v2.2 [
30] within the Software, SimaPro v7.1.8, recognized as a reliable source of secondary data. The supporting firm provided the necessary primary data and information regarding the inputs and output flows across the whole supply chain, with particular focus on the processing/bottling lines.
Table 1 lists the observed flows and specifies the adopted source of primary and secondary data. The following sections overview the steps of the LCA methodology, describing the choices and assumptions undertaken.
2.1. Goal and Scope
The goal of this study is to apply the LCA methodology for analyzing the environmental impacts associated with the bottled EVOO life cycle along a global supply chain. Furthermore, this study compares the environmental impacts with respect to alternative bottling and packaging solutions for the EVOO bottle throughout its life cycle phases. The analysis is based on applying the LCA methodology to different packaging configurations, resulting in different and distinct FUs according to the attributional approach.
The development of this study allows the supporting firm to overview its supply, production and distribution processes from an environmental perspective and measures the influence of the packaging choice over the total impacts associated with the product life cycle. This study intends to communicate also to the stakeholders and to the EVOO consumers the environmental impacts of the life cycle operations associated with the product from cradle to grave, embracing the increasing sensibility of consumers to environmental issues. At last, the scope of the analysis also demonstrates how much the EOL decisions and strategies affect the environmental impacts associated with a product, through a multi-scenario LCA assessment conducted in accordance with the consequential approach.
2.2. Functional Unit
To provide comparable results of the analysis carried out, the functional unit (FU) is chosen in accordance with the PCR [
28] for virgin olive oil and its fractions. The identified FU is a 1-L bottle of EVOO (
i.e., equal to 0.916 kg·per·L), including the EVOO content, its primary, secondary and tertiary packaging. The LCA methodology is applied to EVOO supplied to the Italian olive oil firm, bottled in its facility and distributed worldwide to fulfill the annual demand. The importance of extending this analysis to a global supply chain is the nature of EVOO, which is mostly produced in the Mediterranean Basin [
18], but which is consumed worldwide, with a trend expected to accelerate in the future.
The supply chain processes involved include: (1) the supply of EVOO from the production area to the bottling facility; (2) the supply of packaging from the producers to the bottling facility; (3) the EVOO consolidation and processing; (4) the bottling and packaging; (5) the storage and the distribution to the customers; and (6) the EOL treatments of the packaging waste.
Table 1.
Life cycle inventory: primary and secondary data source per each function unit (FU) scenario. EOL, end-of-life; PP, polypropylene; tkm, ton·km; ARPA, Regional agency for prevention and environment (Emilia-Romagna).
Table 1.
Life cycle inventory: primary and secondary data source per each function unit (FU) scenario. EOL, end-of-life; PP, polypropylene; tkm, ton·km; ARPA, Regional agency for prevention and environment (Emilia-Romagna).
| Process | Processes/Materials | Unit | Amount | Data Sources | Scenarios (FUs) |
|---|
| Scenario 1 | Scenario 2 | Scenario 3 | Scenario 4 |
|---|
| EVOO Supply | Transport | tkm | 1.43 | Ecoinvent database | • | • | • | • |
| Consolidation | Energy | kWh/FU | 0.006 | On-field monitoring | • | • | • | • |
| Brightening | Energy | kWh/FU | 0.00719 | On-field monitoring | • | • | • | • |
| Filtering | Cellulose fossil flour | g./FU | 2 | On-field monitoring, Interview | • | • | • | • |
| | Cellulose assembled filter | g./FU | 0.0050325 | On-field monitoring, Interview | • | • | • | • |
| PET bottling line | PET bottle | g./FU | 36 | Ecoinvent database | | | • | • |
| | PET cap | g./FU | 3.8 | Ecoinvent database | | | • | • |
| | PET sleever | g./FU | 5 | On-field monitoring | | | • | • |
| | Wood pallet | g./FU | 25.8 | Ecoinvent database | | | • | • |
| | PE film | g./FU | 0.72 | Ecoinvent database | | | • | • |
| | Energy | kWh/FU | 0.0338 | On-field monitoring | | | • | • |
| PET-wrap line | Cardboard wrap | g./FU | 20.1 | On-field monitoring | | | • | |
| PET-strapping line | PP stripe | g./FU | 0.75 | Ecoinvent database | | | | • |
| Glass bottling line | Glass bottle | g./FU | 460 | Ecoinvent database | • | • | | |
| | Aluminum cap | g./FU | 3 | Ecoinvent database | • | • | | |
| | PE pourer | g./FU | 2 | On-field monitoring | • | • | | |
| | Labels | g./FU | 4 | On-field monitoring | • | • | | |
| | Wood pallet | g./FU | 41.3 | Ecoinvent database | • | • | | |
| | PE film | g./FU | 0.65 | Ecoinvent database | • | • | | |
| | Energy | kWh/FU | 0.0107 | On-field monitoring | • | • | | |
| Glass-wrap line | Cardboard wrap | g./FU | 20.4 | On-field monitoring | | • | | |
| Glass-thermopack line | Cardboard tote, PET film | g./FU | 9.33 | On-field monitoring | • | | | |
| Product distribution | Transport | tkm | variable | Ecoinvent database, On-field monitoring | • | • | • | • |
| Waste collection | Transport | tkm | variable | Ecoinvent database | • | • | • | • |
| EOL treatments | Transport, Energy | tkm-kWh/FU | variable | Ecoinvent database, ARPA, Eurostat | • | • | • | • |
The EVOO is supplied to the firm facility in accordance with a blend or recipe devoted to a given class of customer. The analyzed EVOO blend is made from 70% Greek oil and 30% Spanish oil, while the supply operations are realized through multimodal transportation (
i.e., via truck and via vessel), as reported in
Table 2.
Table 2.
EVOO blend.
| Oil Blend | Route | Transport Mode | From | To | From | To | Oil Weight (kg) | % Oil Recipe | km | tkm |
|---|
70% Greek
30% Spain | 1 | Tank truck | Calamata | Patrasso | Oil mill | Port | | | 300 | 0.193 |
| Bulk vessel | Patrasso | Ancona | Port | Port | 0.643 | 70% | 1000 | 0.643 |
| Tank truck | Ancona | Forlì | Port | Bottling facility | | | 180 | 0.116 |
| 2 | Tank truck | Yaen | Valencia | Oil mill | Port | | | | 0.138 |
| Bulk vessel | Valencia | Livorno | Port | Port | 0.275 | 30% | | 0.275 |
| Tank truck | Livorno | Forlì | Port | Bottling facility | | | | 0.069 |
The primary packaging is the glass and the PET bottles with two labels, respectively, on the front and the back of the bottle. The cork is aluminum with a PET pourer in the glass bottle, while in the PET bottle, both the cork and the heat shrink sleeve are PET. There are three secondary packaging configurations: the corrugated carton (
i.e., wrap package); a carton tote with a polyethylene (PE) film (
i.e., thermo-package); and the polypropylene (PP) stripes (
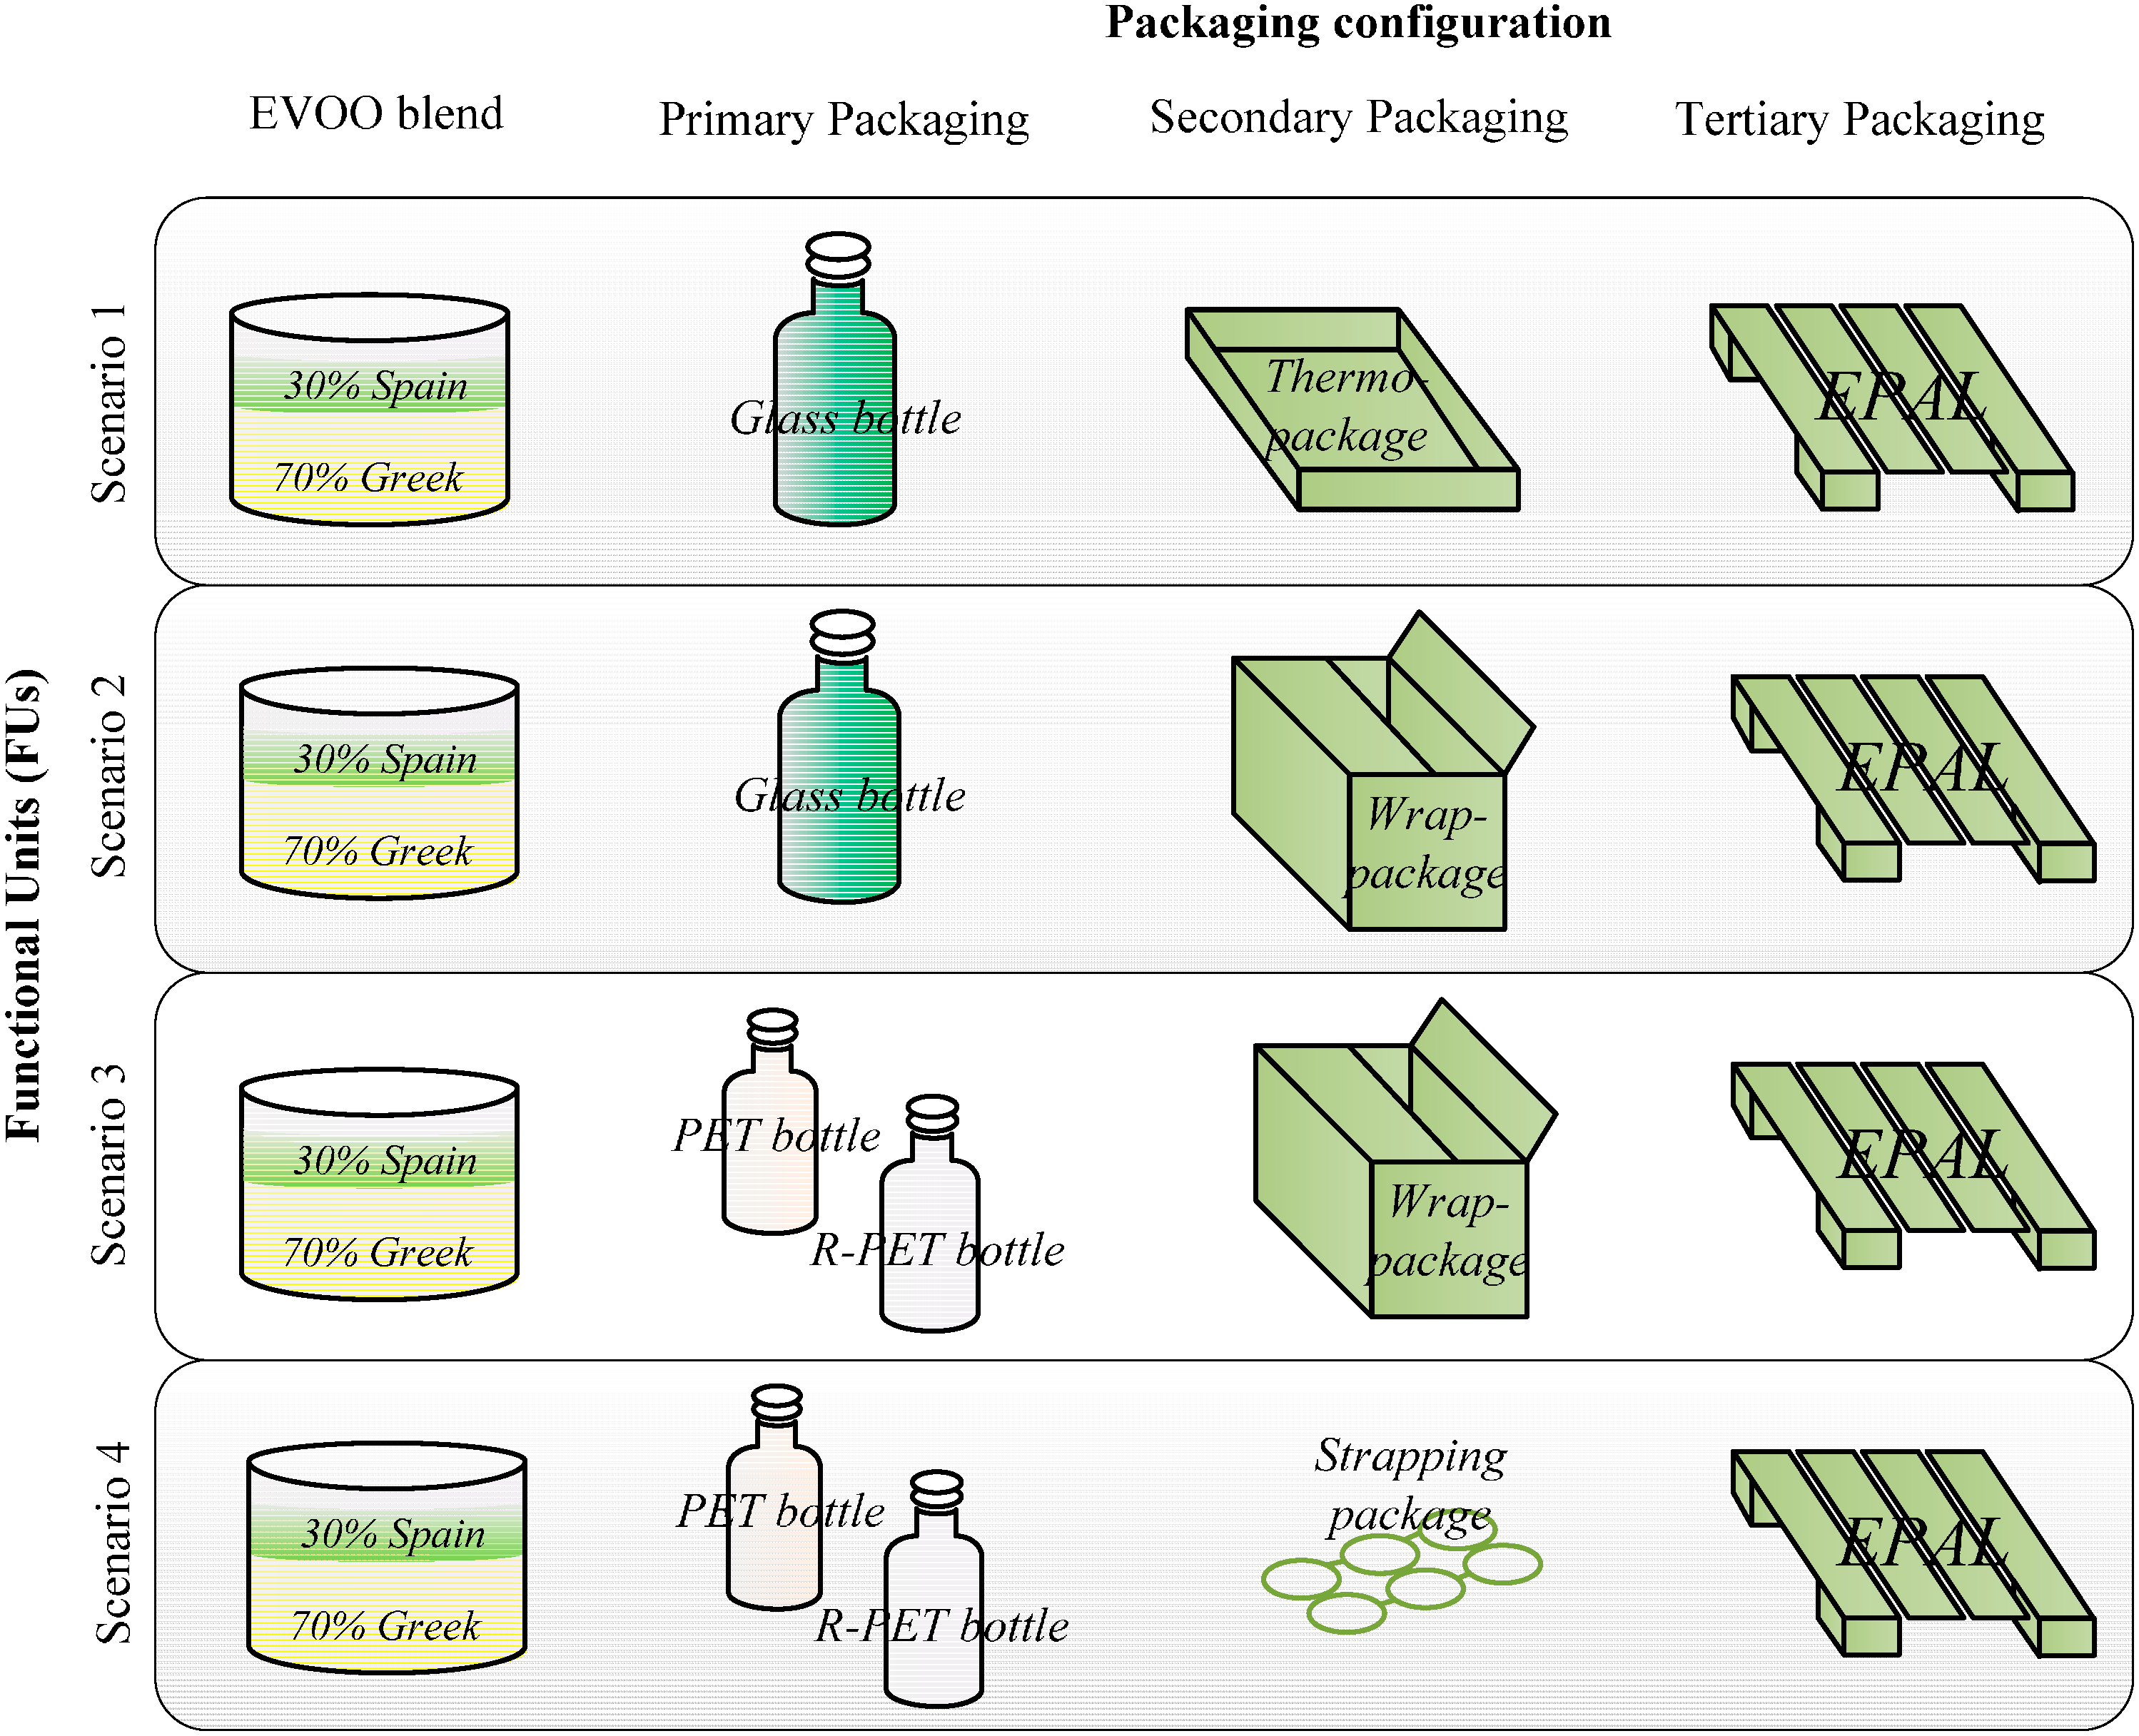
i.e., strapping package). The euro pallet ISO 1 and the polyethylene (PE) film comprise the tertiary packaging. Given the combination of the EVOO blend, the primary, secondary and tertiary packaging configurations, four alternative packaging scenarios and the resulting FUs are identified, as illustrated in
Figure 2.
Figure 2.
The functional units (FUs) considered as four alternative scenarios. R-PET, recycled PET. EPAL, Euro Pallet.
Figure 2.
The functional units (FUs) considered as four alternative scenarios. R-PET, recycled PET. EPAL, Euro Pallet.
Therefore, four attributional LCAs are carried out to calculate and measure the environmental impacts directly associated with each FU scenario within the system boundaries. The inputs, the processes and the material flows involved within each scenario enable the assessment of the environmental impacts with respect to the single packaging configurations from cradle to grave. The difference between the PET and recycled PET (R-PET) bottle are evident only when considering the EOL strategies, while the environmental impacts associated with the other life cycle phases are assumed to be equal.
2.3. System Boundaries
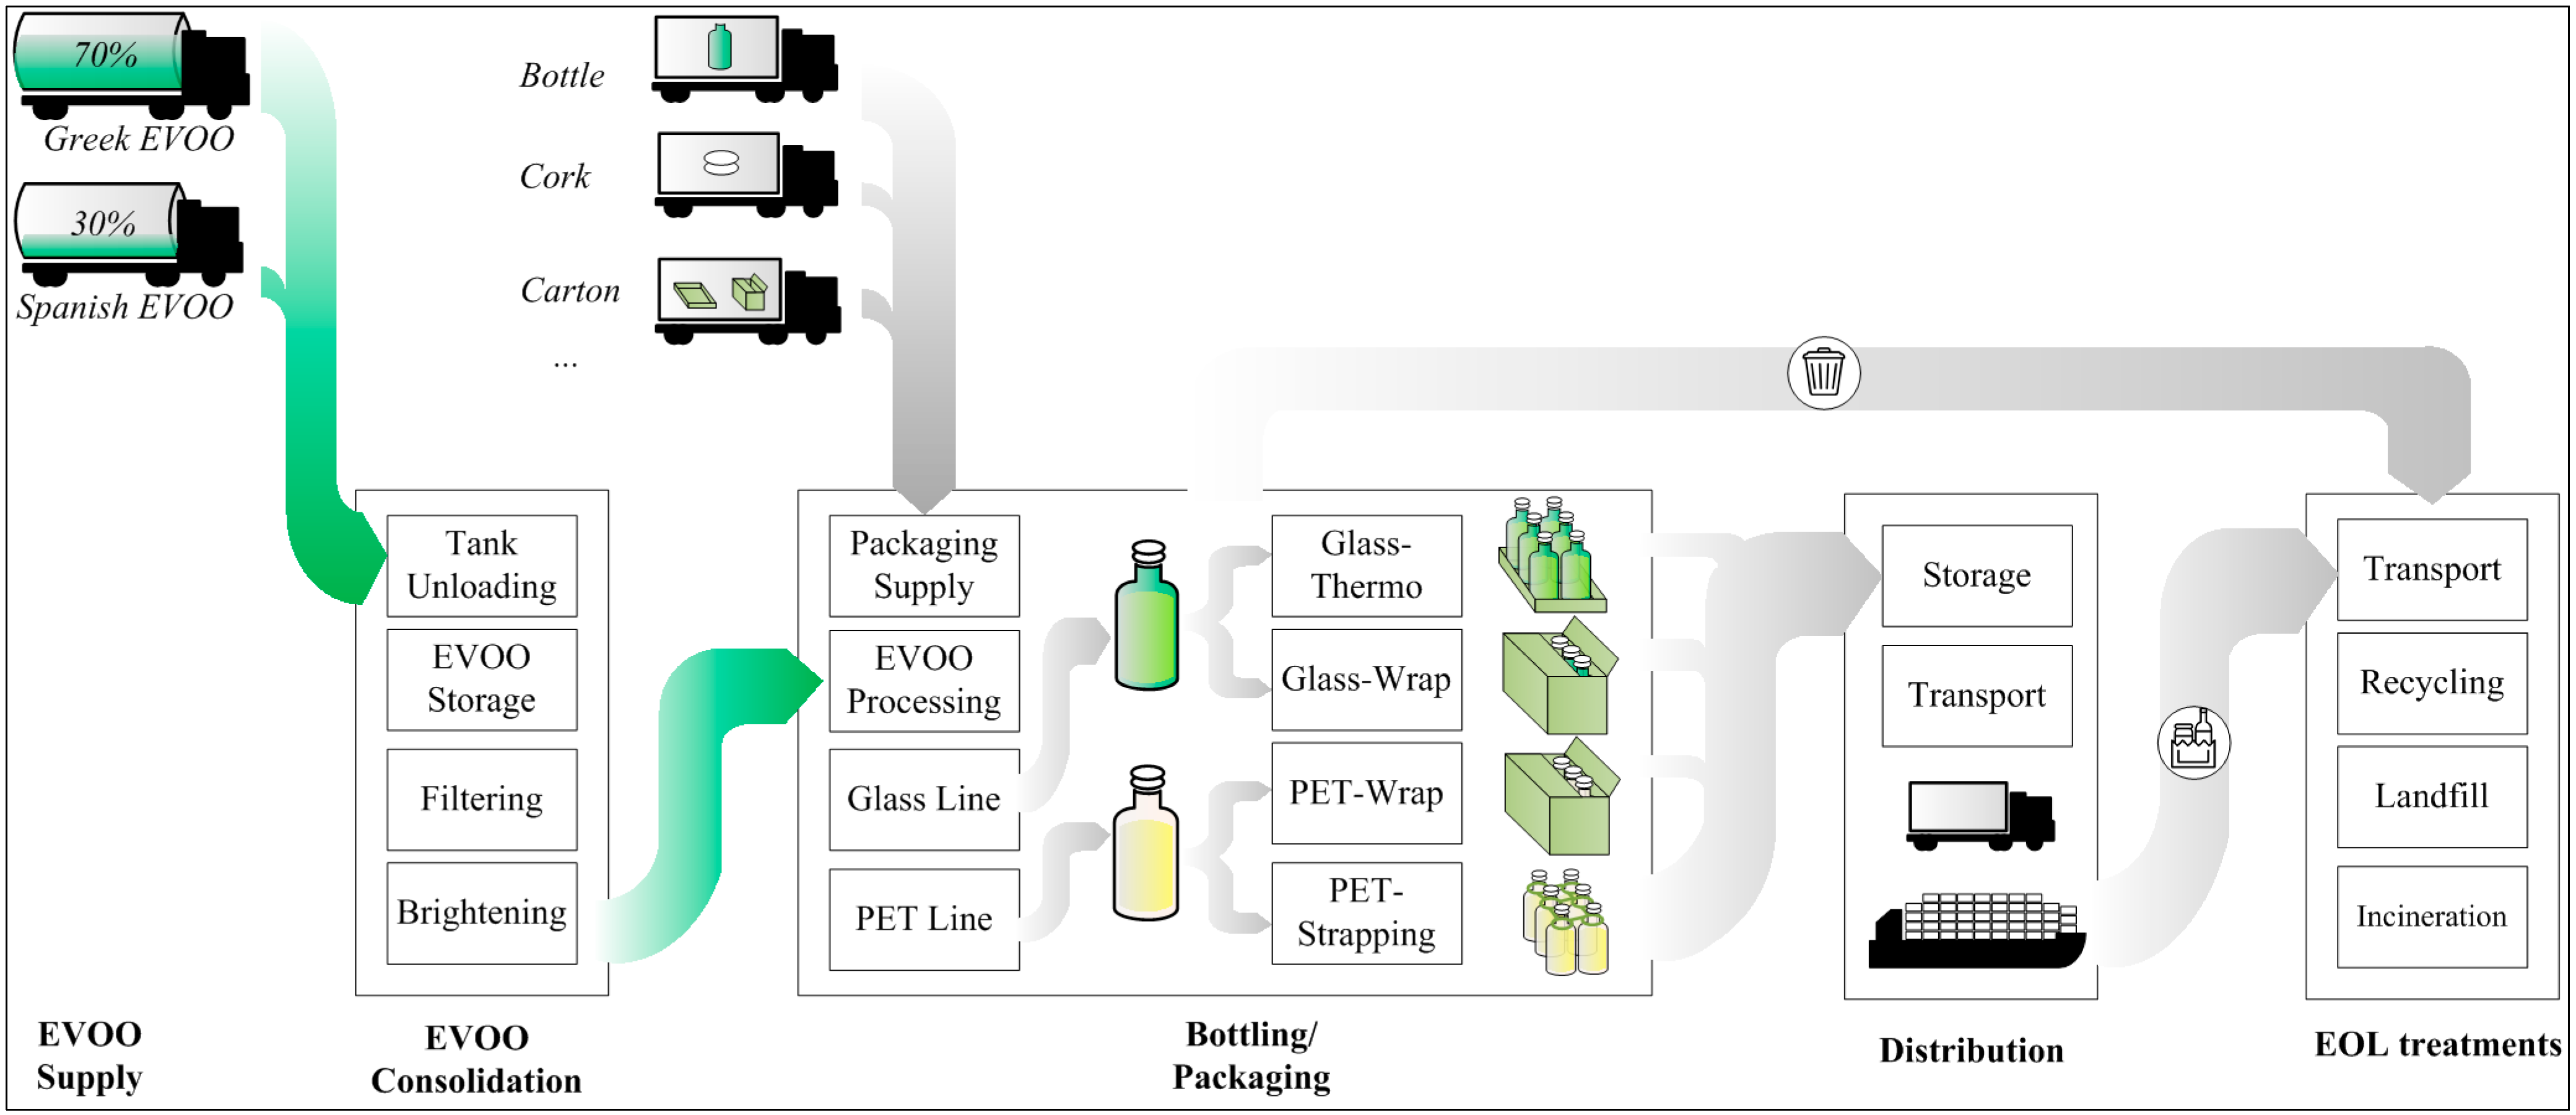
To analyze the life cycle phases of the four FUs according to the attributional approach, the system boundaries include: (1) the supply of EVOO from the production areas; (2) the consolidation of EVOO at the bottling facility; (3) the supply of packaging and auxiliary material; (4) the bottling and processing phase; (5) the storage and distribution processes; and, finally, (6) the EOL treatments; regarding both the consumer waste and the waste generated at the production facility. As far as the crop stage is recognized as one of the most critical processes of the EVOO life cycle, the system boundaries do not take into account the cultivation phase: firstly, because the exponential number of input and output flows to be involved are extremely affected by the production areas (Spain and Greece) and the cropping systems and equipment undertaken; secondly, in coherence with the scope of the analysis, the focus highlights the environmental impacts associated with alternative packaging configurations in the EVOO global supply chain. This assumption results in the system boundaries illustrated in
Figure 3.
Figure 3 shows the flows of both the EVOO and the packaging materials along the observed life cycle phases. The EVOO is supplied from Greek and Spanish producers in accordance with the fractions reported in
Table 1. The bottling facility receives the EVOO in tanks that are transported via vessel and via truck from the mill facility to the Italian bottling plant.
Figure 3.
Attributional LCA system boundaries.
Figure 3.
Attributional LCA system boundaries.
During the consolidation phase, the EVOO is pumped out from the tank into climate-controlled reservoirs that hold the oil before filtering, brightening and bottling. The storage of EVOO, crucial to guaranteeing the quality of the oil and the efficiency of the pre-processing, is particularly energy-intensive, and the energy inputs to power such a process are quantified in
Section 2.3.2.
Once transported to the Italian bottling facility from the national suppliers (via truck), the packaging (e.g., bottle, cork, carton) enter the process as an input material. In coherence with the aforementioned scenarios, the EVOO is bottled in the PET and in the glass bottling lines, packaged with the secondary and tertiary packaging and then stored in the facility warehouse. The bottling lines are extremely different and account for different inputs and energy consumption, as reported in
Table 3 and
Table 4.
The distribution phase includes the transport from the firm warehouse to the customers. Given the complexity of the distribution network and the wide number of customers fulfilled by the firm worldwide, a set of assumptions undertaken to calculate the impacts associated with the global distribution of the bottled EVOO are considered and explained in
Section 2.3.4.
The EOL treatments regard both the flows of the production scraps and the flows of package waste after EVOO consumption, as schematized in
Figure 3. The uncertainty in evaluating EOL strategies and the associated input/output flows in different countries are handled by a consequential LCA that compares the impacts associated with the evaluated scenarios in response to purchasing, policy or technological decisions.
Table 3.
PET bottling line.
Table 3.
PET bottling line.
| Line Station | Station Description | Power (kW) | kWh/Bottle | Photovoltaic kWh | Grid kWh | PET Line Layout |
|---|
| 1 | Compressor 1 | 43.11 | 0.004311 | 0.0004311 | 0.0038799 | ![]() |
| 2 | Compressor 2 | 117.02 | 0.011702 | 0.0011702 | 0.0105318 |
| 3 | Chilling Aspirator | 1.42 | 0.000142 | 0.0000142 | 0.0001278 |
| 4 | Extractor Fan | 2.09 | 0.000209 | 0.0000209 | 0.0001881 |
| 5 | Chiller | 21.56 | 0.002156 | 0.0002156 | 0.0019404 |
| 6 | Robot 1 | 1.85 | 0.000185 | 0.0000185 | 0.0001665 |
| 7 | Blower | 92.38 | 0.009238 | 0.0009238 | 0.0083142 |
| 8 | Air piping | 8.62 | 0.000862 | 0.0000862 | 0.0007758 |
| 9 | Conveyor | 7.39 | 0.000739 | 0.0000739 | 0.0006651 |
| 10 | Oil Pump | 1.66 | 0.000166 | 0.0000166 | 0.0001494 |
| 11 | Filler | 2.4 | 0.00024 | 0.000024 | 0.000216 |
| 12 | Labeller | 3.57 | 0.000357 | 0.0000357 | 0.0003213 |
| 13 | Cutter | 4.31 | 0.000431 | 0.0000431 | 0.0003879 |
| 14 | Carton Maker | 3.39 | 0.000339 | 0.0000339 | 0.0003051 |
| 15 | Strapping-maker | 8,00 | 0.0008 | 0.00008 | 0.00072 |
| 16 | Outbound Robot | 5.78 | 0.000578 | 0.0000578 | 0.0005202 |
| 17 | Pallet Filmer 1 | 2.59 | 0.000259 | 0.0000259 | 0.0002331 |
| 18 | Pallet Filmer 2 | 2.16 | 0.000216 | 0.0000216 | 0.0001944 |
| 19 | External Labeller | 1.23 | 0.000123 | 0.0000123 | 0.0001107 |
| 20 | Nitrogen Machine | 0.31 | 0.000031 | 0.0000031 | 0.0000279 |
| | PET-Wrap Line | 8,00 | 0,0000 | 0,0000 | 0,0000 |
| | PET-Strapping Line | 8,00 | 0,0000 | 0,0000 | 0,0000 |
Table 4.
Glass bottling line.
Table 4.
Glass bottling line.
| Line Station | Station Description | Power (kW) | kWh/Bottle | Photovoltaic kWh | Grid kWh | Glass Line Layout |
|---|
| 1 | Inbound Robot | 7.39 | 0.00105 | 0.000105 | 0.00095 | ![]() |
| 2 | Conveyor | 3.51 | 0.00050 | 0.000050 | 0.00045 |
| 3 | Conveyor engines | 0 | 0 | 0 | 0 |
| 4 | Filler | 1.54 | 0.00022 | 0.000022 | 0.000198 |
| 5 | Oil Pump | 1.66 | 0.00023 | 0.000023 | 0.000213 |
| 6 | Labeller | 1.79 | 0.00025 | 0.000025 | 0.00023 |
| 7 | Sealer | 21.25 | 0.0030 | 0.000303 | 0.00273 |
| 8 | Cutter | 9.12 | 0.00130 | 0.000130 | 0.00117 |
| 9 | Carton Maker | 4 | 0.00057 | 0.000057 | 0.00051 |
| 10 | Thermo-wrapper | 1.35 | 0.00019 | 0.000019 | 0.000173 |
| 11 | Outbound Robot | 3.88 | 0.00055 | 0.000055 | 0.000498 |
| 12 | Pallet Filmer | 1.85 | 0.00026 | 0.000026 | 0.000237 |
| | | 102.34 | 0.01462 | 0.001462 | 0.013158 | |
Table 1 summarizes the source of primary and secondary data considered in the LCI. The column named “process/materials” indicates the inputs per each step of the supply chain in terms of materials (e.g., PET) or energy or activity (e.g., transport). The column named “data sources” reports the source considered for data collection, while a flag in the “scenarios” column indicates which process is accounted for by a given scenario.
2.3.1. EVOO Supply
The EVOO supply is generally crafted by multi-modal transportation from the oil production areas [
18] to the bottling facility of the Italian firm. The EVOO recipe depends on the annual seasonality of cultivation, the costs of purchasing and transport, the expected quality of the final product and, mostly, the market price on the destination market, which directly affect the firm margins and leads decisions on the optimal recipe. In this paper, a blend of Greek and Spanish EVOO mostly devoted to the export markets is considered. A part of the most valuable EVOO specialties produced from selected national or regional raw oils is the current practice of the most important EVOO firms of mixing raw oils from multiple origins. Thus, the environmental impacts of the supply flows are still far from being clearly assessed and calculated along these global supply chains. The proposed LCA focuses on EVOO global supply chains, because across local or regional networks, the packaging and transport operations are negligible compared with the cultivation phase.
2.3.2. EVOO Consolidation
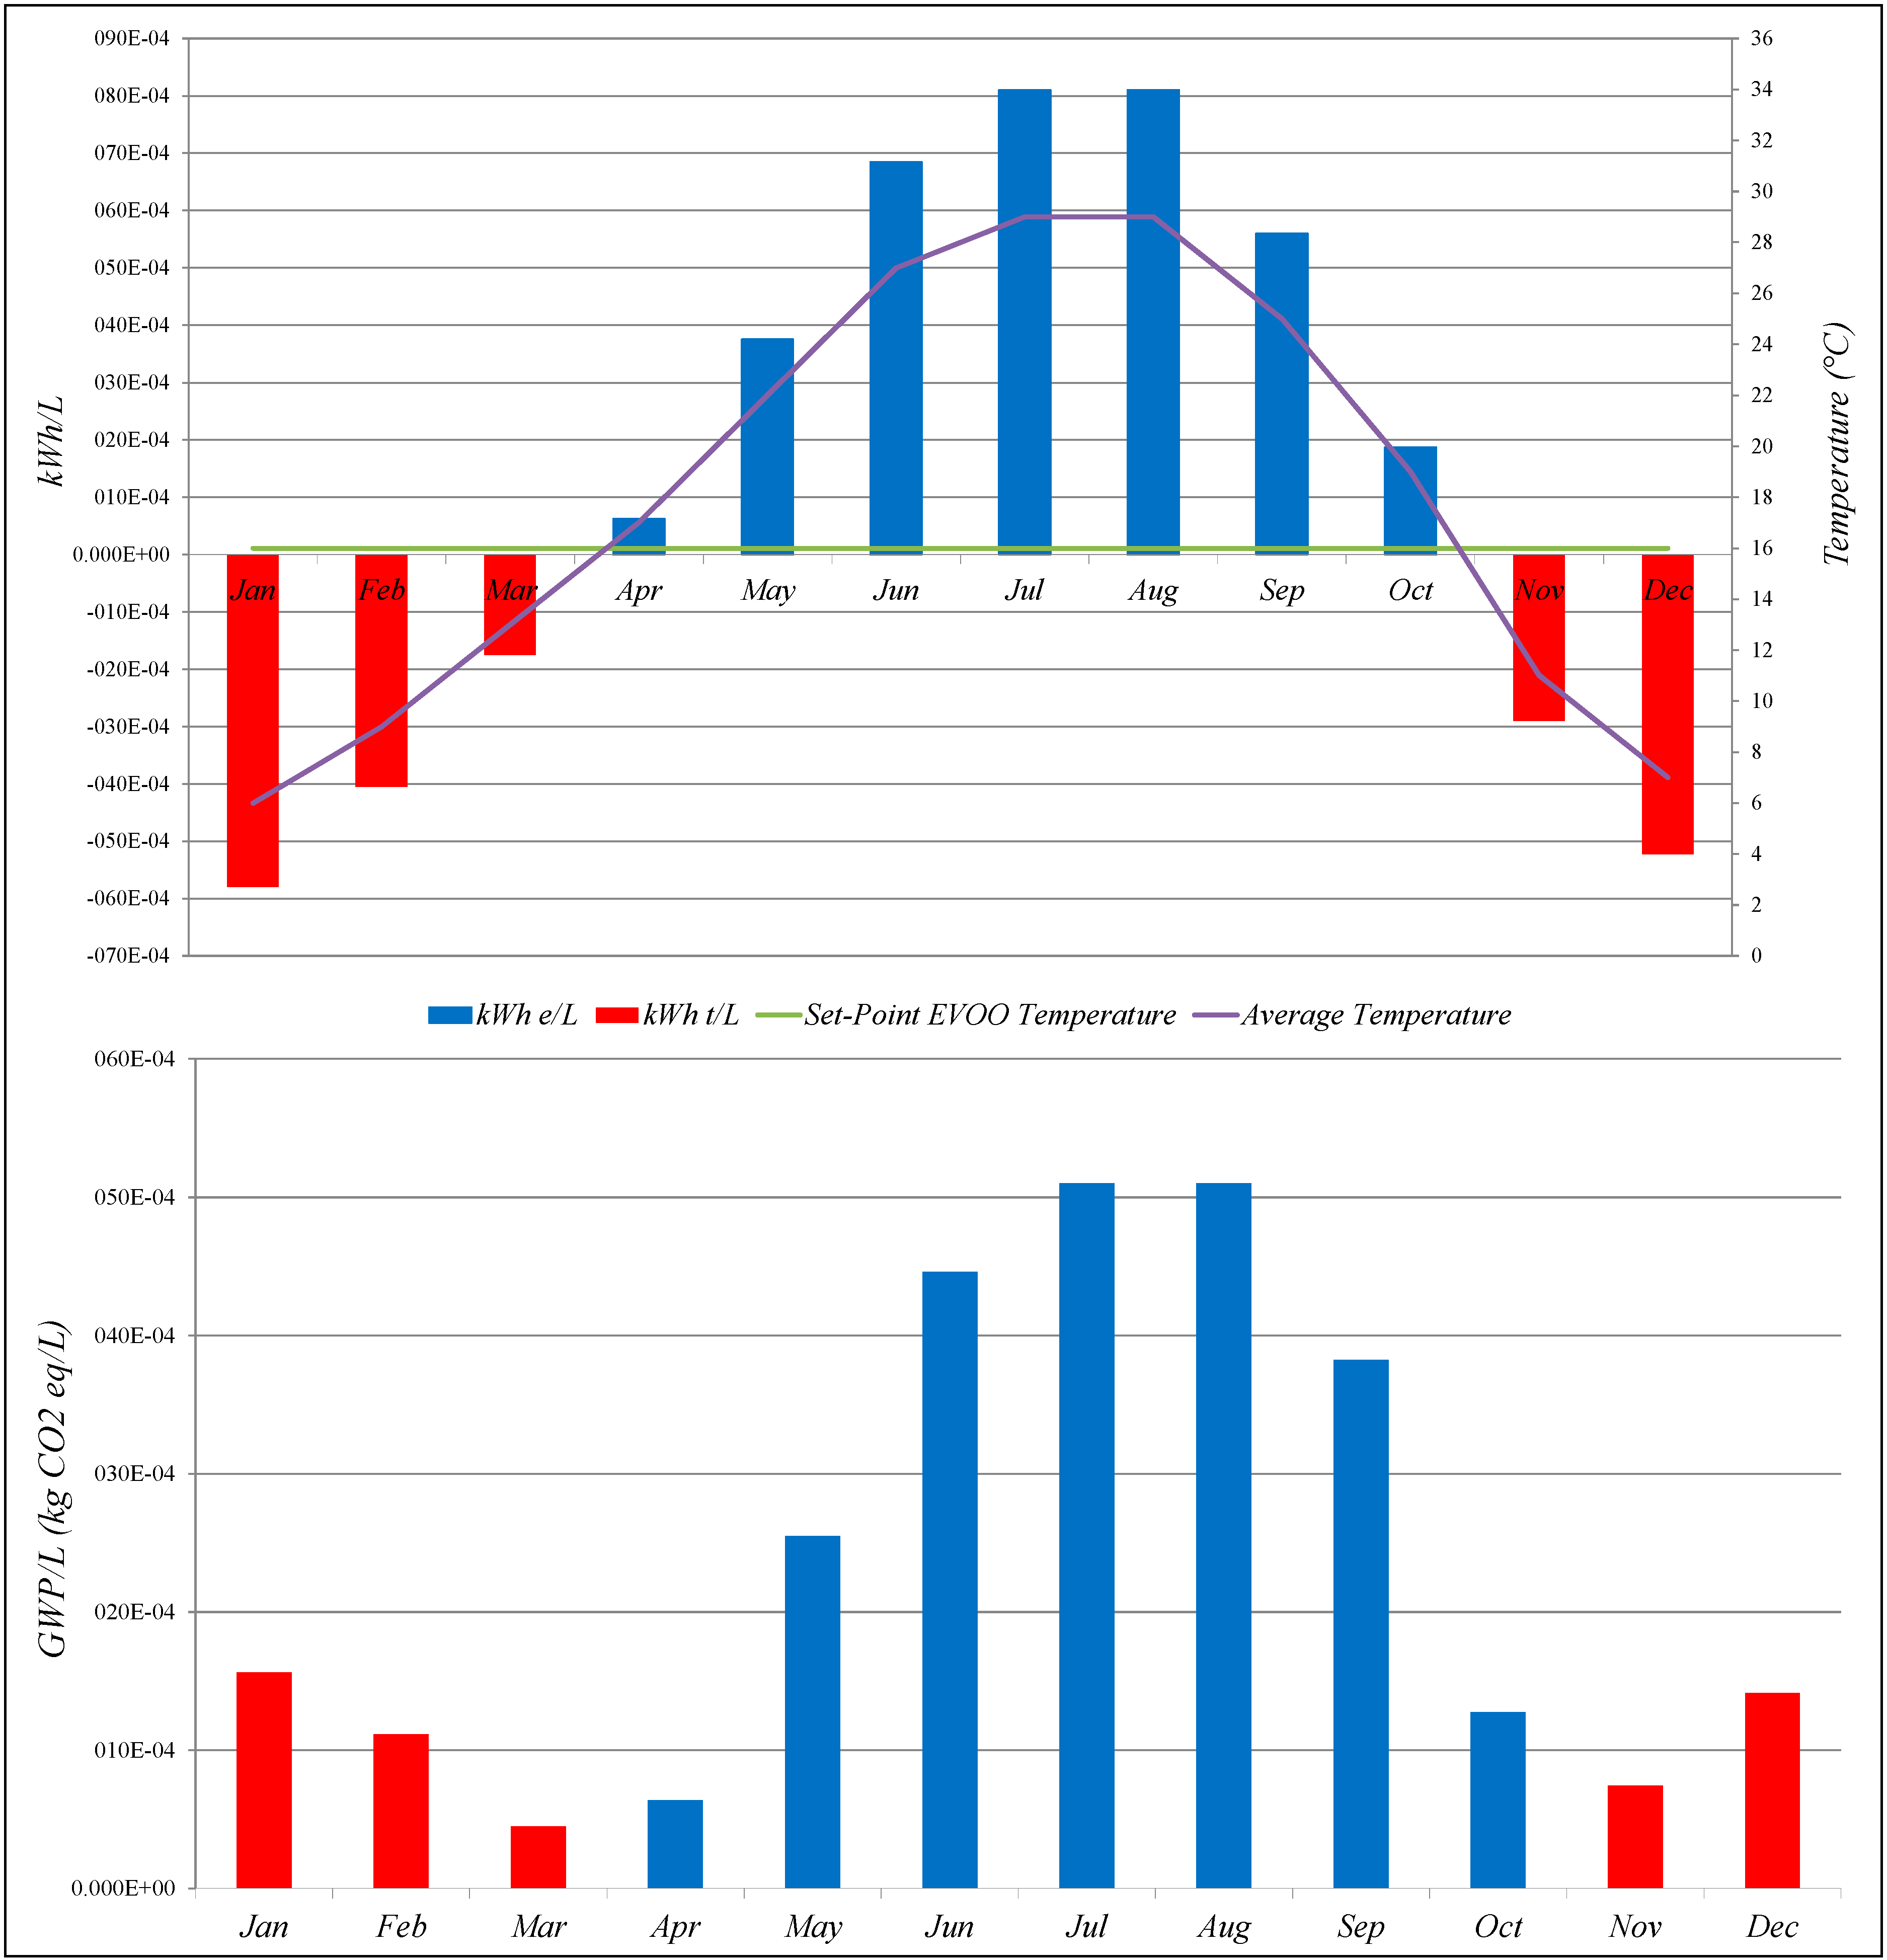
When unloaded to the firm’s bottling facility, the raw EVOO is pumped from the truck into climate-controlled tanks that hold the oil at the optimal storage temperature of 16 °C, to guarantee the preservation of the chemical and organoleptic properties and to prepare the oil for the processing phase. The transport phase is probably the greatest stressor of the EVOO quality [
19,
20], since no restrictions, standards or rules are imposed on the temperature monitoring along the distribution and logistics operations. Thus, the EVOO tends to achieve the external environmental temperature during the transport. Given the location of the bottling facility (
i.e., Italy, Emilia-Romagna, Forli), to achieve the optimal storage temperature once unloaded from the trucks, the EVOO requires being cooled in the summer season and heated in the winter season.
Figure 4 reports, at the top, the average external temperature per month measured outside the bottling facility and the energy consumption (
i.e., kWh/L) associated with the cooling (in blue) or the heating (in red) processes. Furthermore,
Figure 4 indicates, at the bottom, the resulting global warming impact associated with each month for cooling or heating at the EVOO consolidation phase. The graphs highlight a peak of energy consumption between July and August, given the highest difference between the external temperature and the optimal storage set-point (
i.e., on average, 16 °C).
The EVOO blend is then filtered through a set of fossil flour membranes, which enter into the process as input materials, and remove impurities and solid remains. The filtered EVOO is brightened and held within pre-bottling reservoirs.
Figure 4.
Energy consumption for EVOO temperature mitigation.
Figure 4.
Energy consumption for EVOO temperature mitigation.
2.3.3. Bottling and Packaging
The bottling lines are completely automated with a throughput of 7000 glass bottles and 10,000 PET bottles per hour. Both automated lines are powered by a combination of energy supplied by the public grid and by the photovoltaic plant installed on the roof of the bottling facility. This renewable energy source supplies about 10% of the annual facility requirements.
Table 3 and
Table 4 show the plant layouts and indicate the primary data resulting from the on-field monitoring of the bottling and packaging phases. The energy consumptions are reported per each working station of both the glass and the PET lines.
The bottling and the packaging phase are the most interesting in the proposed study, since the combination of the alternative packaging configurations generates the four alternative FUs assessed in the attributional LCA. These packaging configurations are illustrated in
Figure 2. The glass bottle is combined with a wrap and a thermo-package, while the PET bottle is combined with a wrap and strapping packaging. The weight and material adopted as secondary packaging differently contribute to the FU, which varies from 1.445 kg (
i.e., wrap-package) to 1.440 kg (thermos-package) for the glass bottle, and from 1.009 kg (
i.e., wrap-package) to 0.990 kg (strapping-package) for the PET bottle.
The supply of the primary and the secondary packaging is included in the system boundaries, as well as the EOL treatments of the production scraps. The material inputs to each FU scenario (See
Table 1) determine the output flows in terms of production scraps and package waste after consumption. Primary data about the material characteristics are collected from the suppliers when not available in the Ecoinvent v2.2 database [
30] or are modified accordingly. A green glass bottle with 100% virgin glass is assumed as the primary packaging for Scenarios 1 and 2.
2.3.4. Distribution
Given the complexity of the firm distribution flows and the wide number of customers fulfilled per year worldwide, the assessment of the environmental impacts associated with distribution for the four FU scenarios is difficult. Data regarding the annual EVOO demand per customer are provided by the supporting Italian firm and illustrated, cumulating in the demand per country in
Figure 5.
Figure 5.
Distribution of the annual EVOO customer demand fc (kg/year) by the supporting firm.
Figure 5.
Distribution of the annual EVOO customer demand fc (kg/year) by the supporting firm.
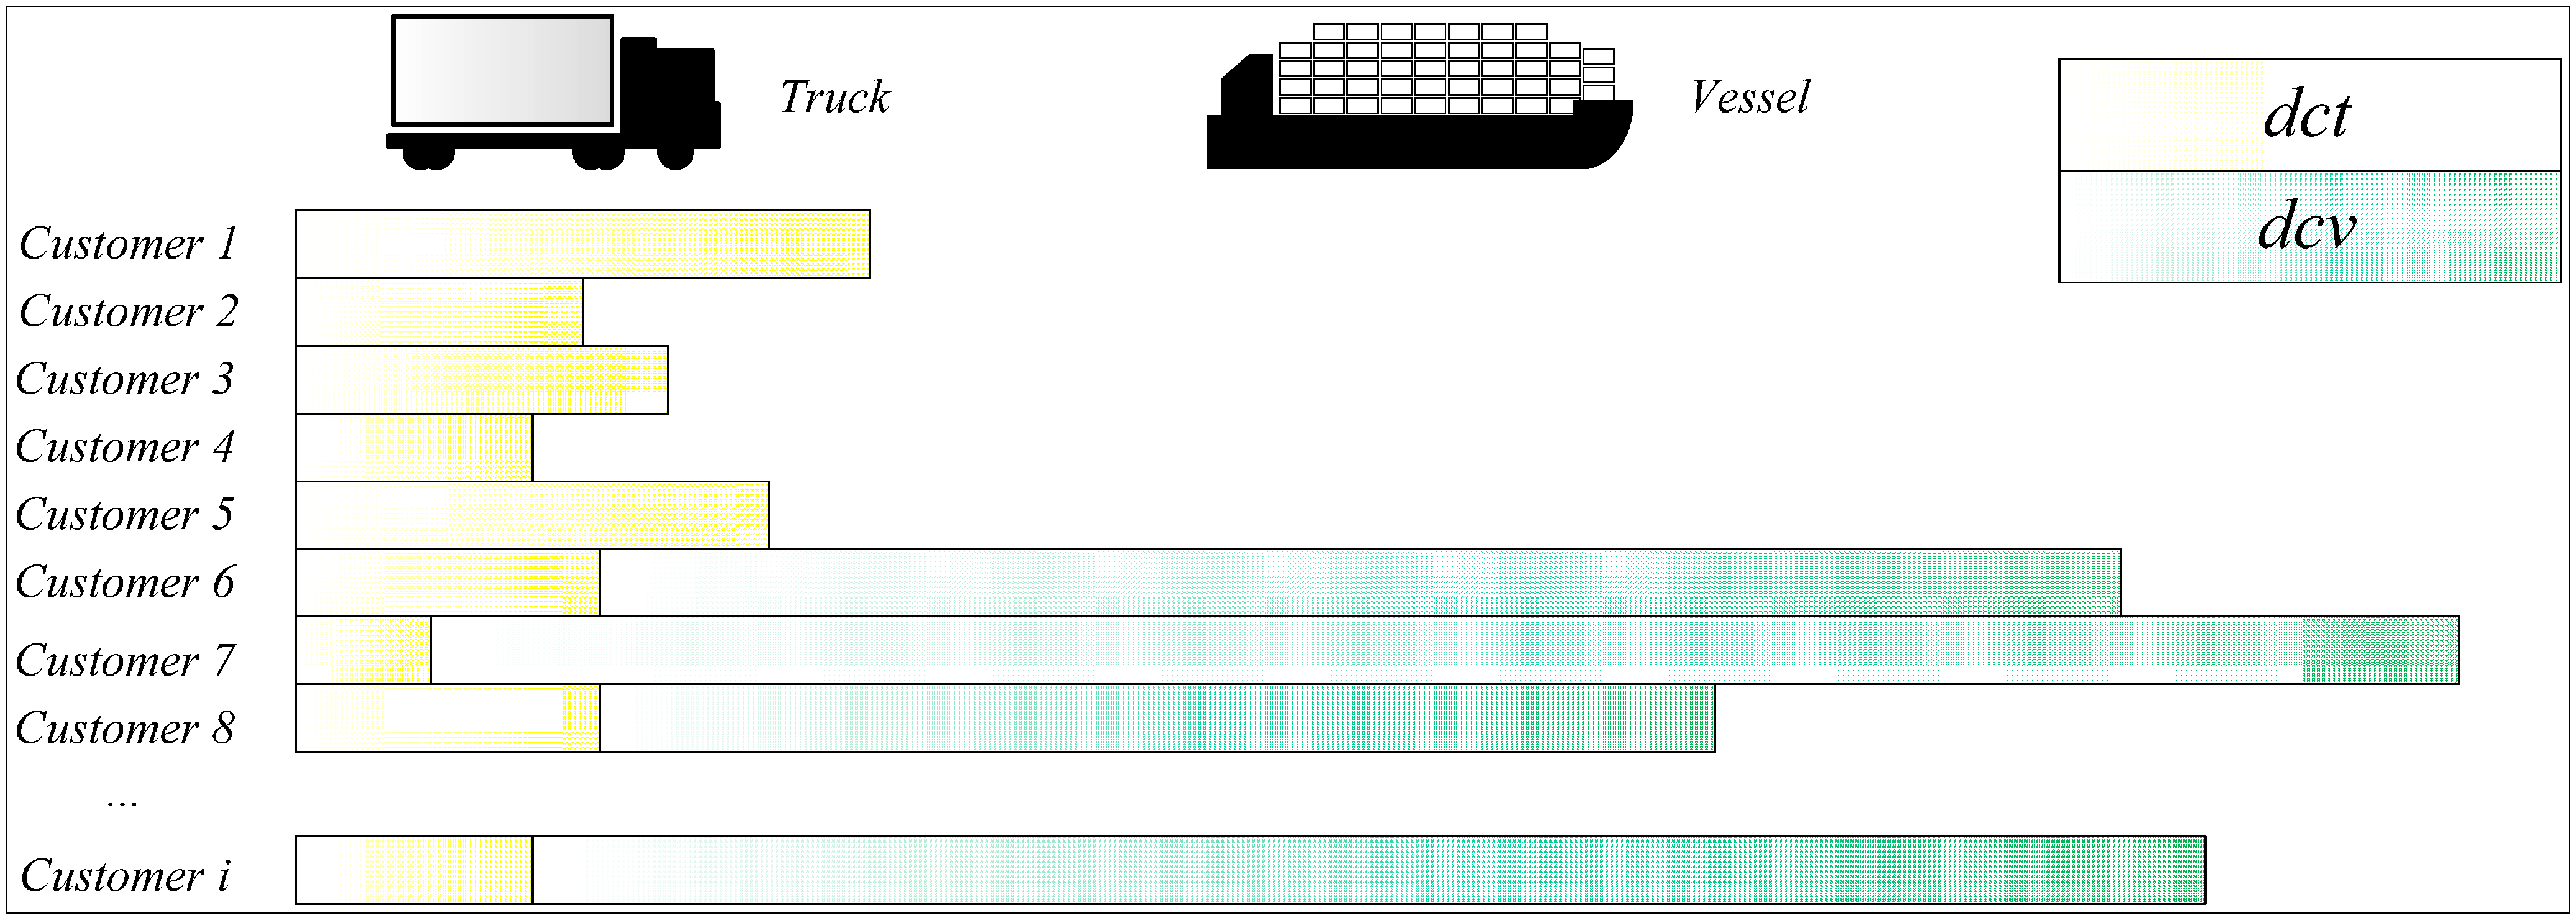
The environmental impacts resulting from the transport operations are naturally determined by the route distance (km), the shipped flows (kg) and the adopted transport mode (i.e., truck, vessel or both). In order to quantify the impact of annual worldwide distribution in terms of the aforementioned FUs, the route distance (km) travelled via truck and via vessel (when necessary) from the bottling facility to the delivery point (e.g., retailers or distributors for Italy, importers for the other countries) of every customer (about 800) is weighted by the annual demanded flow (kg).
The resulting average weighted distribution distance is assumed as the multi-modal route travelled from the firm facility to the average customer to fulfill the average annual EVOO demand as illustrated in
Figure 6. Such a distance (
i.e.,
dw) results by applying Equations (1) and (2) to the primary demand data represented in
Figure 5 and is about 2925 km. The transport operations are carried out by 28-ton trucks (
i.e., on average, 10% of the route) coupled with freight vessels (
i.e., for the remaining 90% of the route) via multi-modal transportation. Backhaul routes are not included in the system boundaries and are accounted for by other systems.
Figure 6.
Distribution of road and maritime route to achieve the firm customers.
Figure 6.
Distribution of road and maritime route to achieve the firm customers.
dcm: distance from facility to the demand country c (km) travelled by the transport mode m (t: truck; v: vessel);
fc: annual demand flow per customer c (kg/year);
dw: average weighted distribution distance (km).
The calculated average distance weighted by the annual EVOO demand is used to assess the environmental performance associated with the distribution of the alternative FU scenarios. The punctual evaluation of each route, as well as the comprehension of the effect that alternative routes have on the environmental impact of the EVOO distribution will be the focus of further studies.
2.3.5. EOL Treatment
The EOL scenarios are particularly critical in the LCA analysis, since they are characterized by uncertainty and require a lot of binding assumptions. Per every output flow of material produced along the life cycle phases, the fractions devoted to recycling, incineration or landfill are affected by the national, sometimes regional or even local, practices and policies that vary at least by country to country. Therefore, given the high number of customer areas and countries involved in the observed EVOO global supply chain, the assessment of the impact associated with the EOL phase of the four FUs risks being tremendously affected by those choices arbitrarily undertaken at the LCI step.
In order to conclude the attributional LCA of the four alternative FUs, we quantify the output flows of material devoted to the different EOL strategies in accordance with the Institute of the Environment Protection and Research (ISPRA) report [
31], which provides the average European fractions of urban waste devoted to recycling, incineration and landfill, as illustrated in
Table 5. For those flows not recognized by the materials listed in
Table 5, primary data are collected through interviews with the material suppliers. The Ecoinvent v2.2 database [
30], properly modified with primary data, is used to analyze recycling and landfill processes.
It is considered that the landfill and the recycling facility are located 100 km away from the places where the EVOO is consumed.
Table 5.
ISPRA statistics [
32] on the EOL fraction generated by urban waste.
Table 5.
ISPRA statistics [32] on the EOL fraction generated by urban waste.
| Material (Ton) | Waste Flow | Recycled Flow | % Recycling | % Landfill (54%) | % Incinerator (46%) |
|---|
| Glass | 15,979,785 | 11,064,167 | 69.20% | 16.63% | 14.17% |
| Plastic | 14,847,035 | 4,940,714 | 33.30% | 36.02% | 30.68% |
| Paper | 31,054,823 | 25,920,383 | 83.50% | 8.91% | 7.59% |
| Metal | 4,539,581 | 3,247,789 | 71.50% | 15.39% | 13.11% |
| Wood | 12,010,350 | 4,509,405 | 38.10% | 33.43% | 28.47% |
| Other | 240,849 | 16,619 | 6.90% | 50.27% | 42.83% |
3. Results and Discussion
The environmental impact categories are quantified for the four proposed FU scenarios along the life cycle phases in accordance with an attributional approach. The EVOO supply phase results from the combination of two production areas and the resulting intermodal routes from the supplier plant to the Italian bottling facility. The total global warming (GWP) impact accounted for by the EVOO supply is quantified as 0.063 kg CO2eq/FU and, given the chosen system boundaries, is equal for the four FUs. The main contribution to GWP impact accounted for by the supply phase is given by the Greek EVOO (i.e., 52% from truck transport and 9% from vessel transport), which represents in volume 70% of the blend.
The bottling and packaging phase includes the impacts associated with the input flows of materials and the energy necessary to produce the FU in accordance with the scenario of
Figure 2. The resulting environmental impacts are determined by the transport route from the facilities of the packaging suppliers (
i.e., about 45 spread throughout Italy) to the bottling plant, the weight of the material flows (
i.e., kg/year) and from the energy consumption associated with the two bottling lines (see
Table 3 and
Table 4).
Figure 7 quantifies the value of the environmental categories of impact accounted for by the bottling lines.
The PET bottling line is made of many automated working stations (e.g., blowing machine, air piping, chilling aspirator) and is more energy consuming than the glass bottling line, as shown by the comparison between Scenarios 1 and 2 and Scenarios 3 and 4 of
Figure 7. Conversely, dealing with the input material flows, the supply of PET packaging is more efficient than for glass bottles, since the former is provided as a small mold that is blown in the line to obtain the final bottle. While 1 kg of glass enables the production of two final bottles (
i.e., 0.460 kg each), 1 kg of PET generates about 28 bottles of PET (
i.e., 0.036 kg each). Improving the power of the existing photovoltaic system is a good strategy to reduce the environmental impacts associated with the bottling phase, particularly for the PET-based scenarios.
Figure 7.
Global warming impact associated to the bottling and packaging phase.
Figure 7.
Global warming impact associated to the bottling and packaging phase.
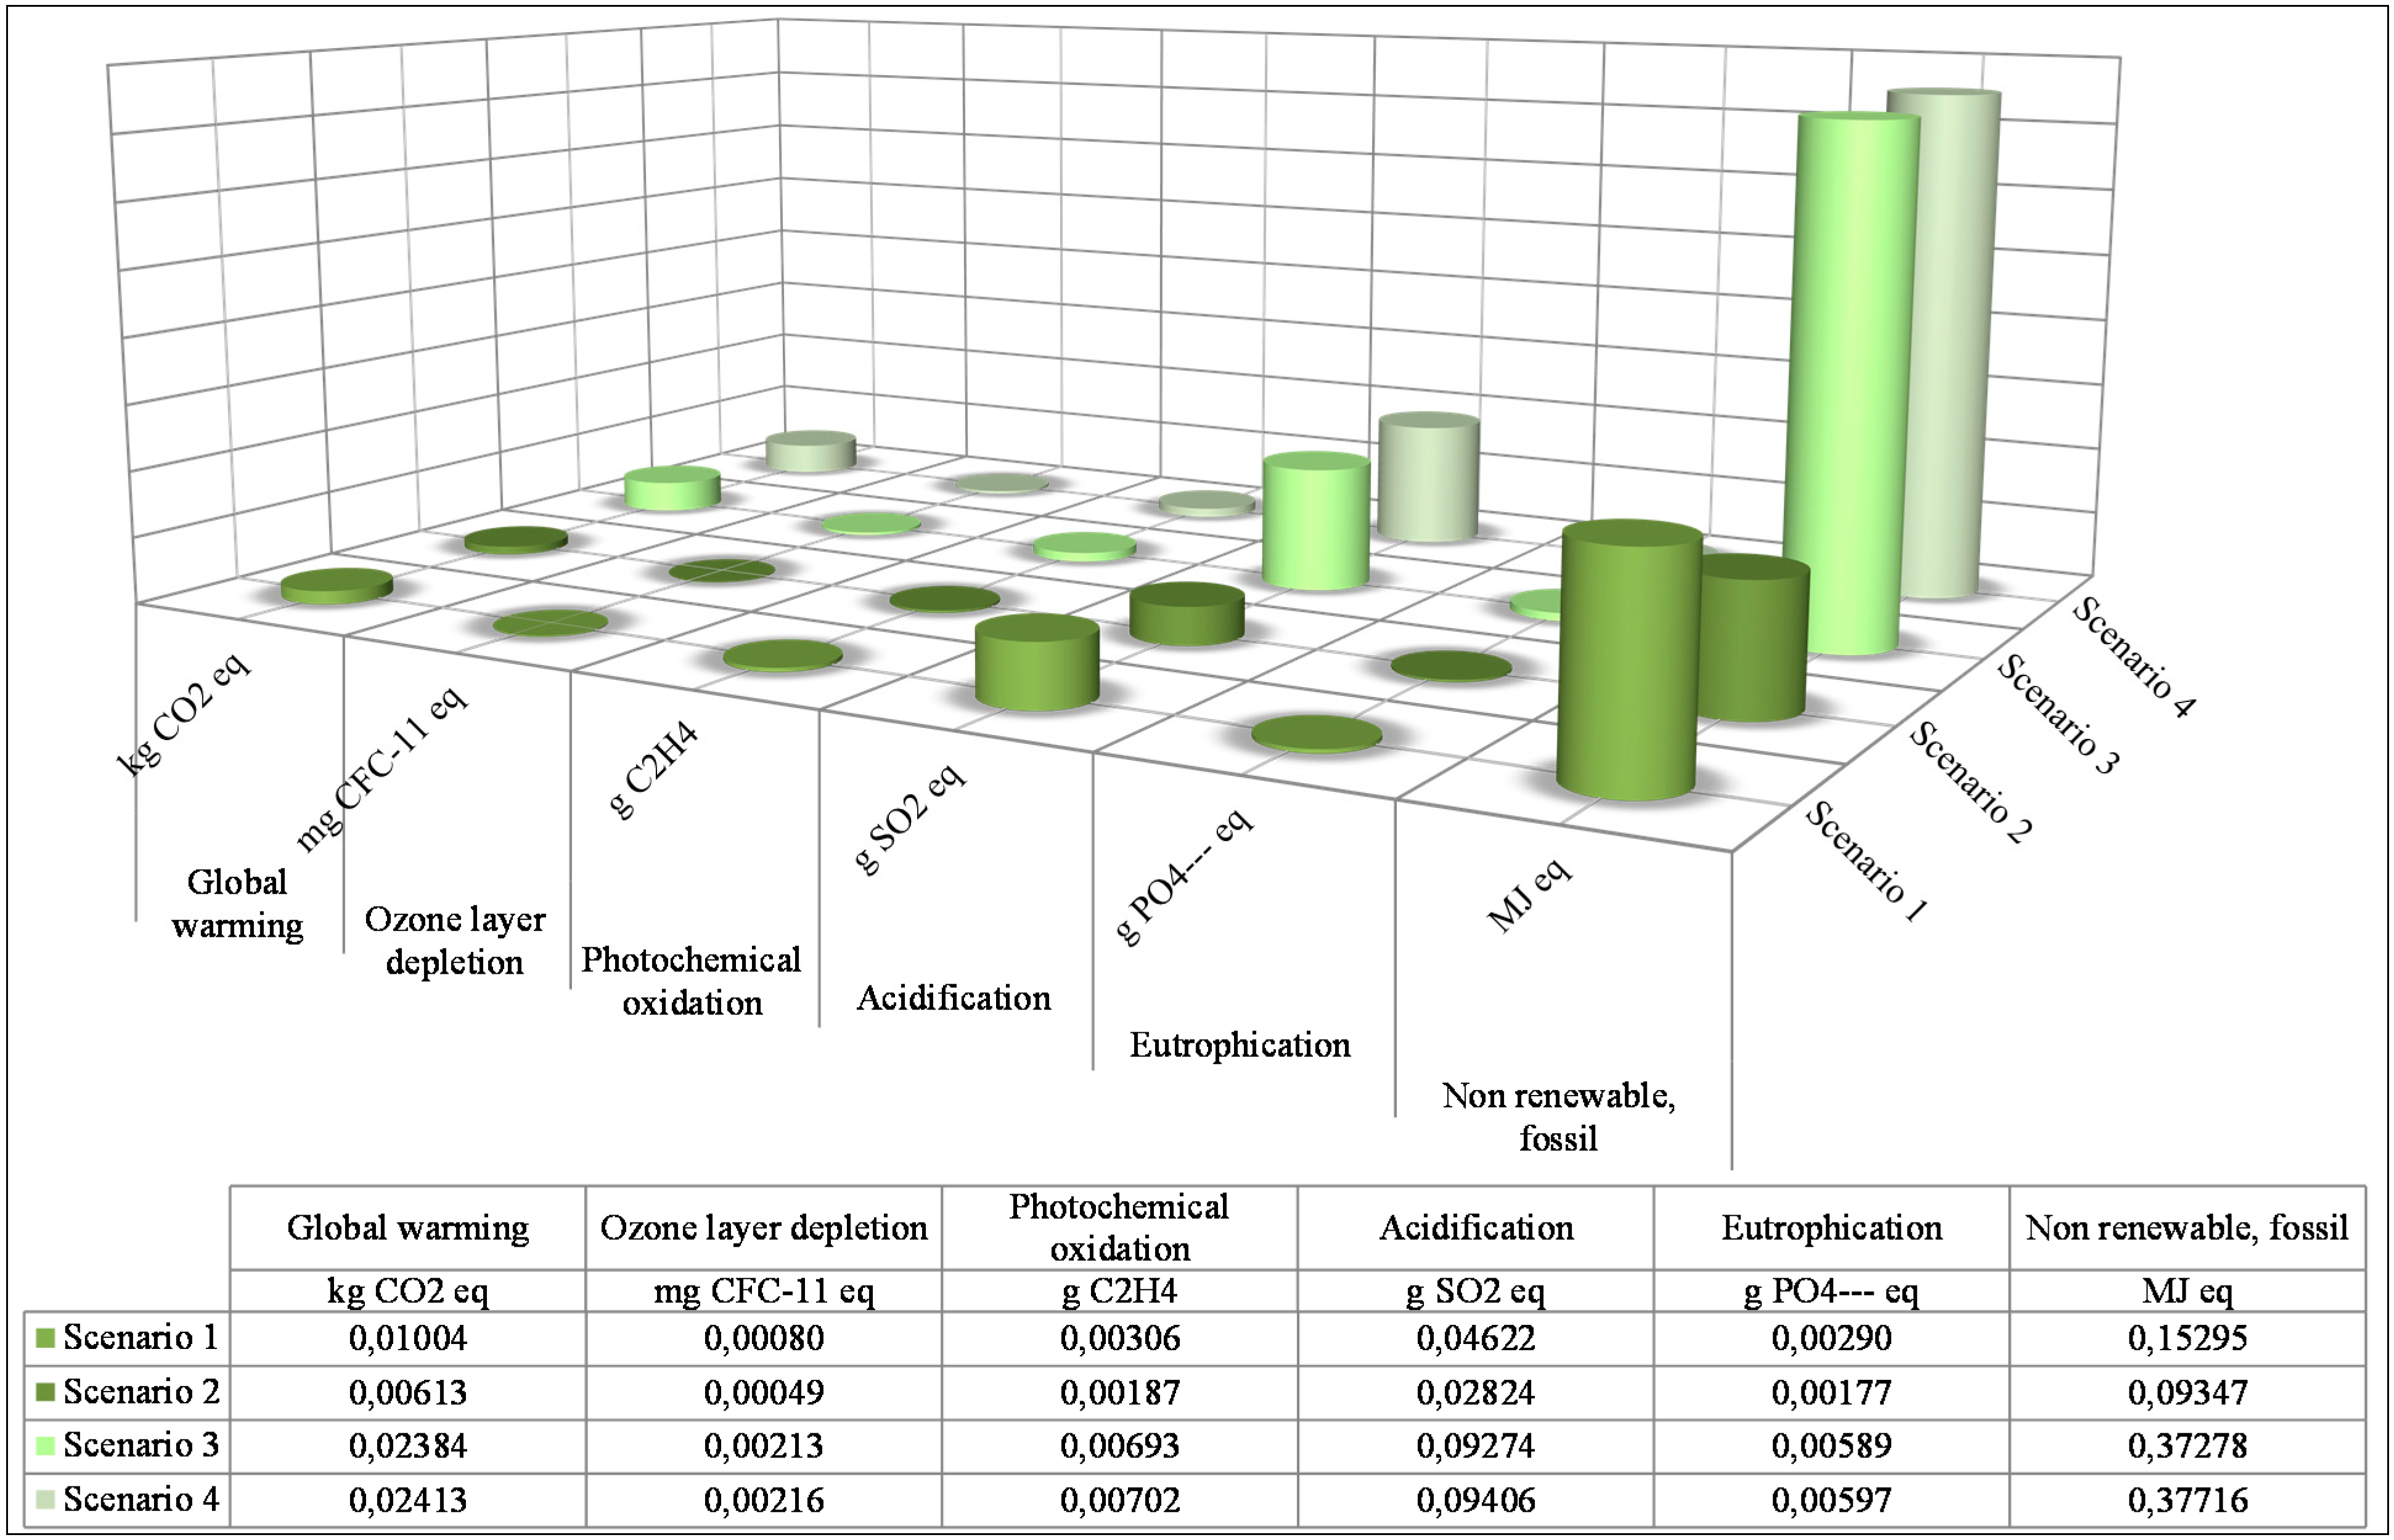
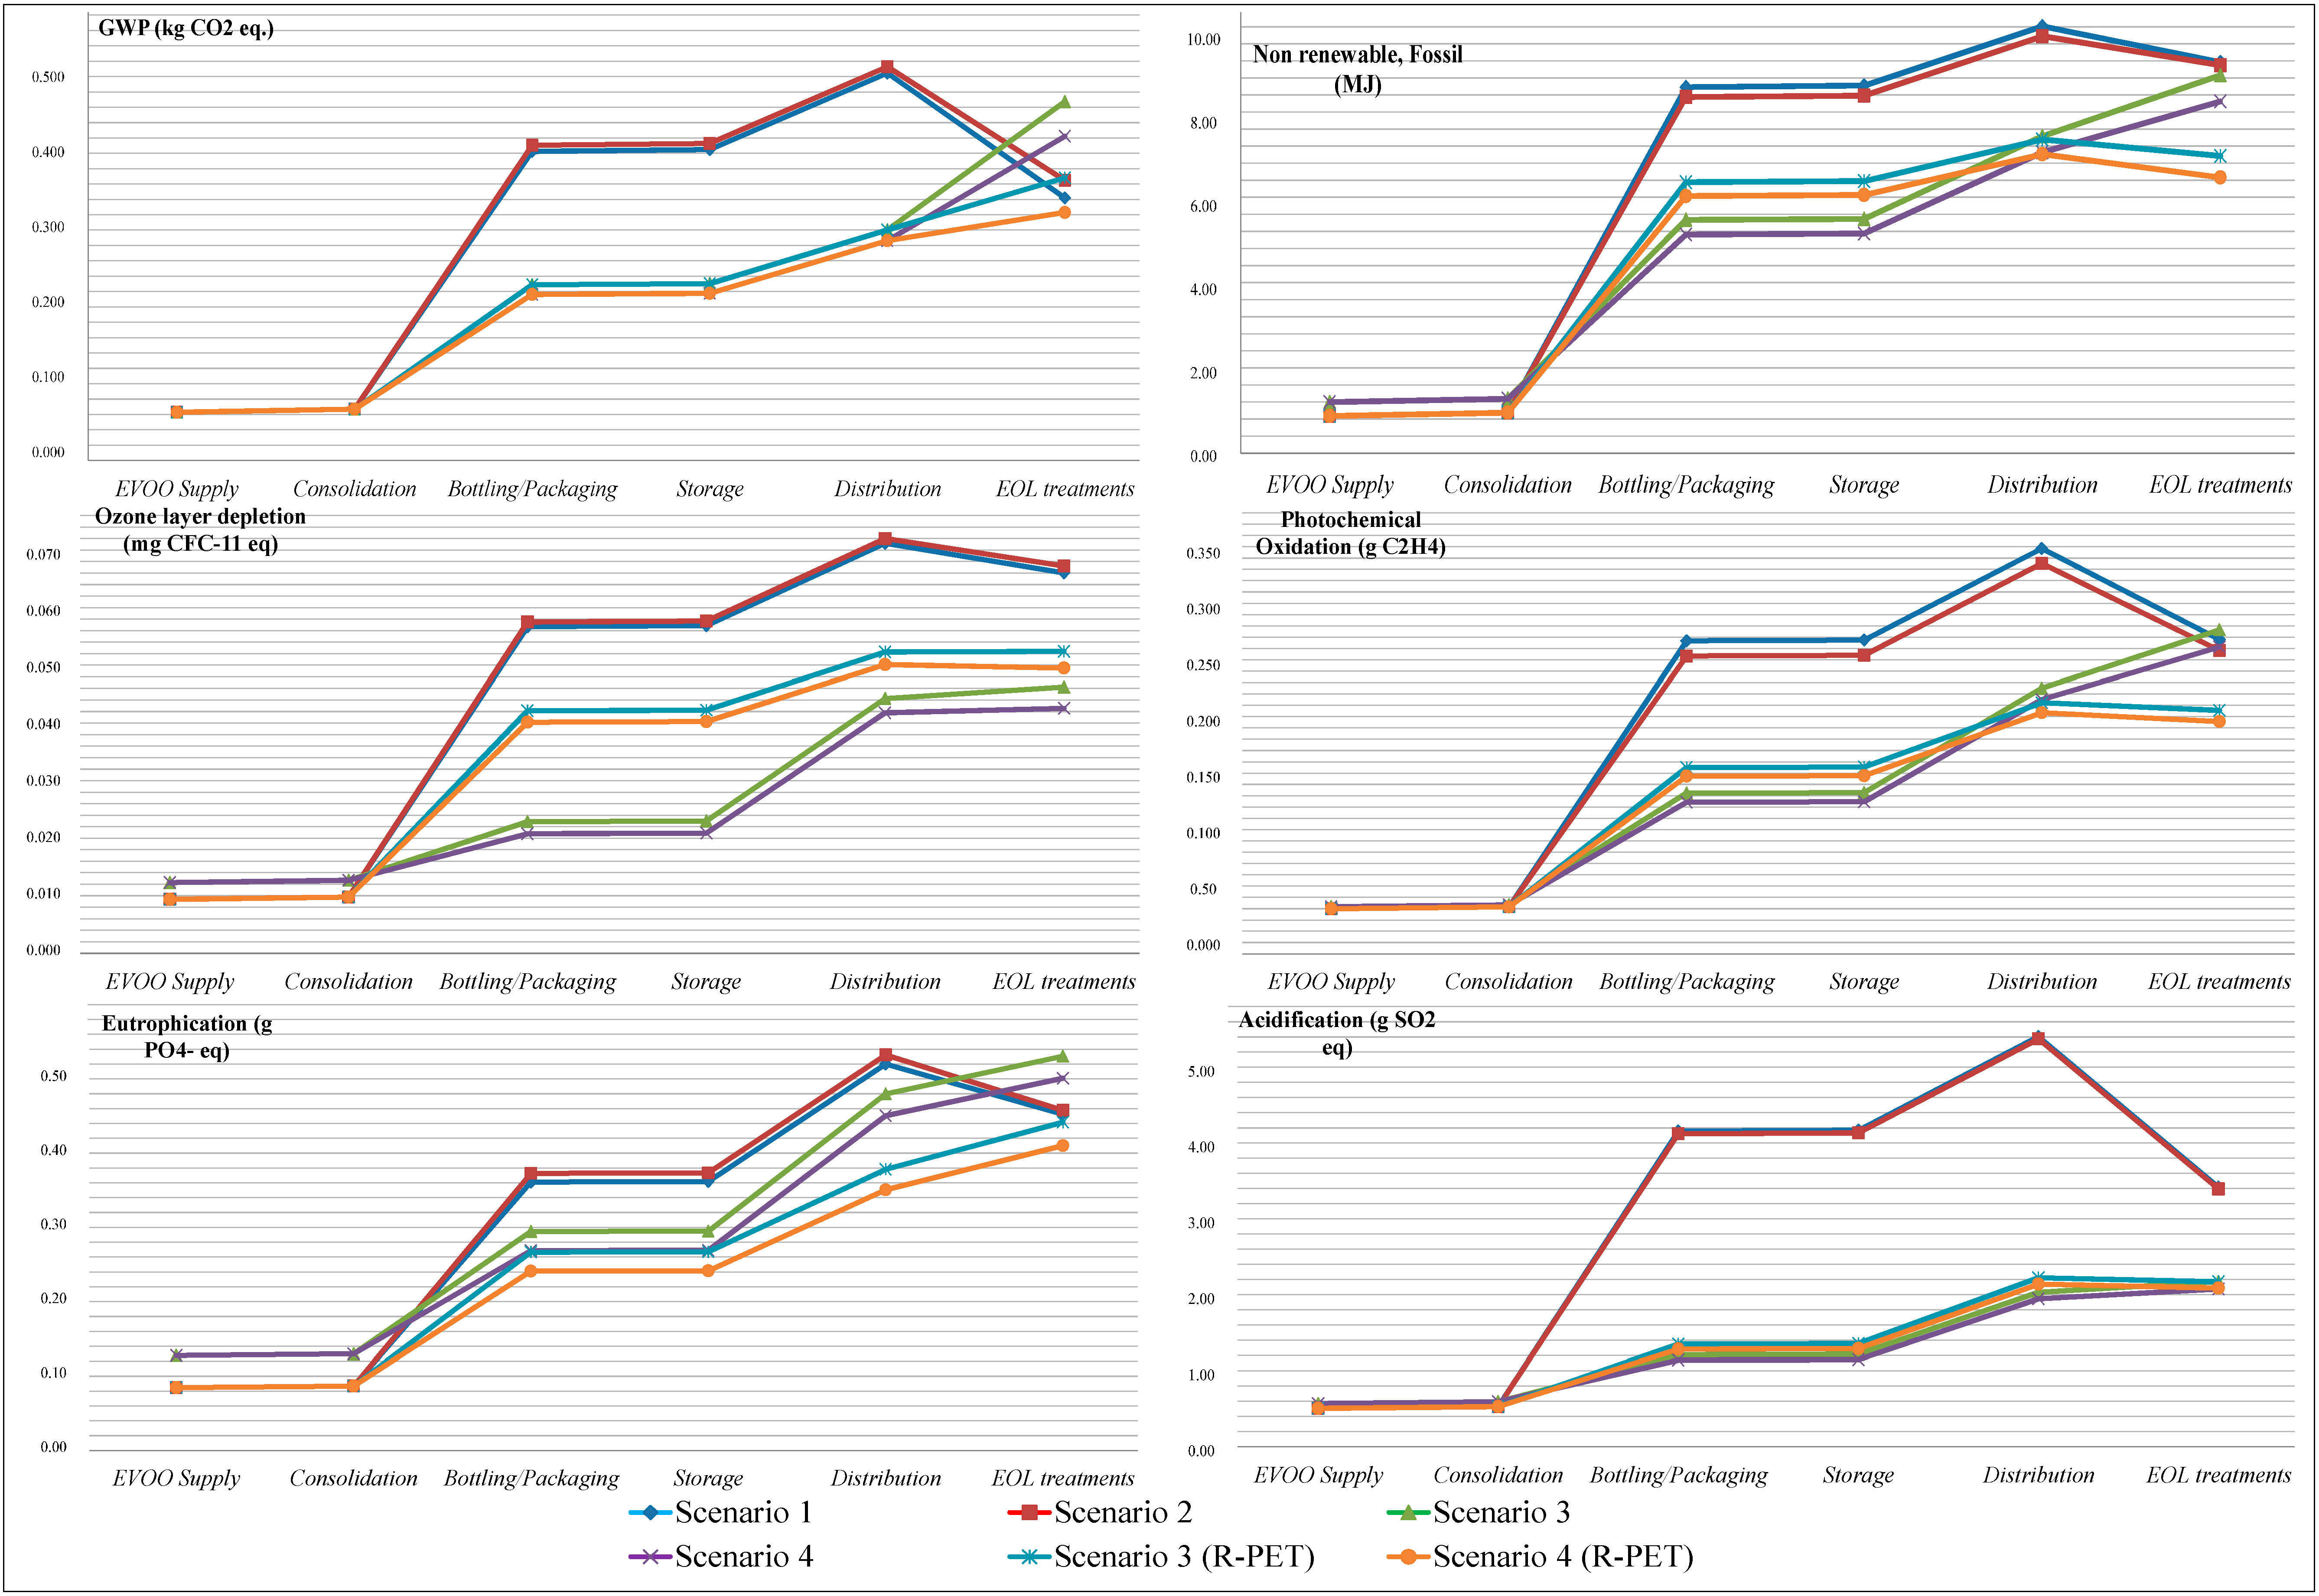
The assessment of the environmental impacts associated with the alternative FU scenarios is carried out throughout all of the life cycle phases included in the system boundaries.
Figure 8 quantifies the observed impact categories for the alternative FUs per each life cycle phase.
Figure 8 illustrates the contribution of each phase to the total impact associated with the observed FU.
Figure 8 also allows considering the comparison between the alternative scenarios (
i.e., FUs) depending on the policy issues and the technological choices of the bottling firm, in accordance with a consequential LCA approach.
Within the consequential LCA, another two FU scenarios are assessed and compared with the others. Scenario 3 (R-PET) and Scenario 4 (R-PET) are respectively similar to the previously introduced Scenario 3 and Scenario 4, but with different EOL strategies. When considering the EOL phase, adequately understanding the benefits in terms of savings of raw material, resulting from the adoption of recycling or re-manufacturing processes, is necessary. The green glass bottle is 100% recyclable and avoids the extraction of the corresponding input material flows (
i.e., sand, soda, dolomite, limestone, feldspar), as well as the energy consumptions necessary for extraction and processing. Conversely, the rule [
32] limits to 50% of the total package weight the recycled PET to produce PET packaging for food and beverage. To comply with this rule, alternative FU and associated EOL scenarios are considered according to a consequential approach. Scenario 3 and Scenario 4 devote the recycled PET to manufacturing woven fiber, and the resulting environmental benefits are not accounted for within the system boundaries. Scenario 3 and Scenario 4 (R-PET) use 50% of the FU to manufacture new recycled bottles, thereby including the environmental savings of raw material extraction within the system boundaries.
Ninety-five percent of the weight of the FU is composed of the primary and secondary packaging, so that the environmental impacts accounted for by the tertiary packaging are negligible.
Figure 8.
Results from the life cycle impact assessment (LCIA) for the alternative FU scenarios.
Figure 8.
Results from the life cycle impact assessment (LCIA) for the alternative FU scenarios.
Based on the LCIA results illustrated in
Figure 7, the EVOO bottled in glass accounts for a higher impact on global warming than when bottled in PET before the EOL phase, which is considerably affected by the high recyclability of glass in comparison with PET. The lowest impact on global warming is quantified for Scenario 4 (R-PET), which couples the efficient supply of the package with the efficient distribution of the bottled EVOO with the recyclability of the package waste. Given the output flows devoted to the EOL phase in accordance with the European practices (See
Table 5), Scenario 2 meets Scenario 3 R-PET around 0.36 kg CO2eq per bottle, resulting in equivalent global warming associated with both EVOO bottled in glass and PET. The bottling and packaging phase and the distribution phase significantly impact the global warming associated with the bottled EVOO, particularly for Scenarios 1 and 2.
Dealing with the impact of non-renewable energy consumption, the EVOO bottled in glass has less impact than PET for all of the alternative packaging configurations. This result is due to more energy-intensive recycling processes for glass waste than for PET waste and to the assumption that the recycling facilities are powered by non-renewable energy sources in both cases.
The ozone layer depletion (OLD) impact is significantly affected by transportation, as well as by those manufacturing/processing operations adopting hydrocarbons (HCs) as a combustible fuel source. Thus, the variance in OLD between the EVOO bottled with the alternative packaging configurations is significant at the supply, bottling, packaging and distribution life cycle phases. The acidification and the photochemical oxidation impacts are mostly affected by the bottling process at the facility and confirm the results illustrated in
Figure 7.
There are few LCA studies reported in the literature examining the global warming impact associated with the EVOO supply chain [
21,
22,
23,
24]. Even though the selection of the FU and the application of the LCA methodology is coherent with the standards [
26,
27,
28], none of these studies is similar in considering the system boundaries or the assumptions undertaken to quantify the input and the output material flows. Therefore, it is not possible to make a meaningful comparison with earlier studies in terms of the overall global warming or the other environmental impact categories. Nevertheless, the results obtained by the proposed study are coherent with those resulting from the EPDs provided by the most renowned firms of the EVOO sector.
When examining the findings from
Figure 8, the EOL phase is crucial in determining which is the scenario with the highest impact on the environment. Dealing with the global warming impact, the EOL phase would suggest bottling EVOO in glass bottles, for the higher recyclability of glass in comparison with PET. Nevertheless, the output flows of the package waste devoted to recycling, incineration or landfill are affected by technological aspects, but mostly by policy issues and diffused practices. Given the uncertainty in determining these material flows in the EOL phase, a multi-scenario analysis is carried out to demonstrate how EOL practices and rules influence the environmental impacts associated with the EVOO supply chain.
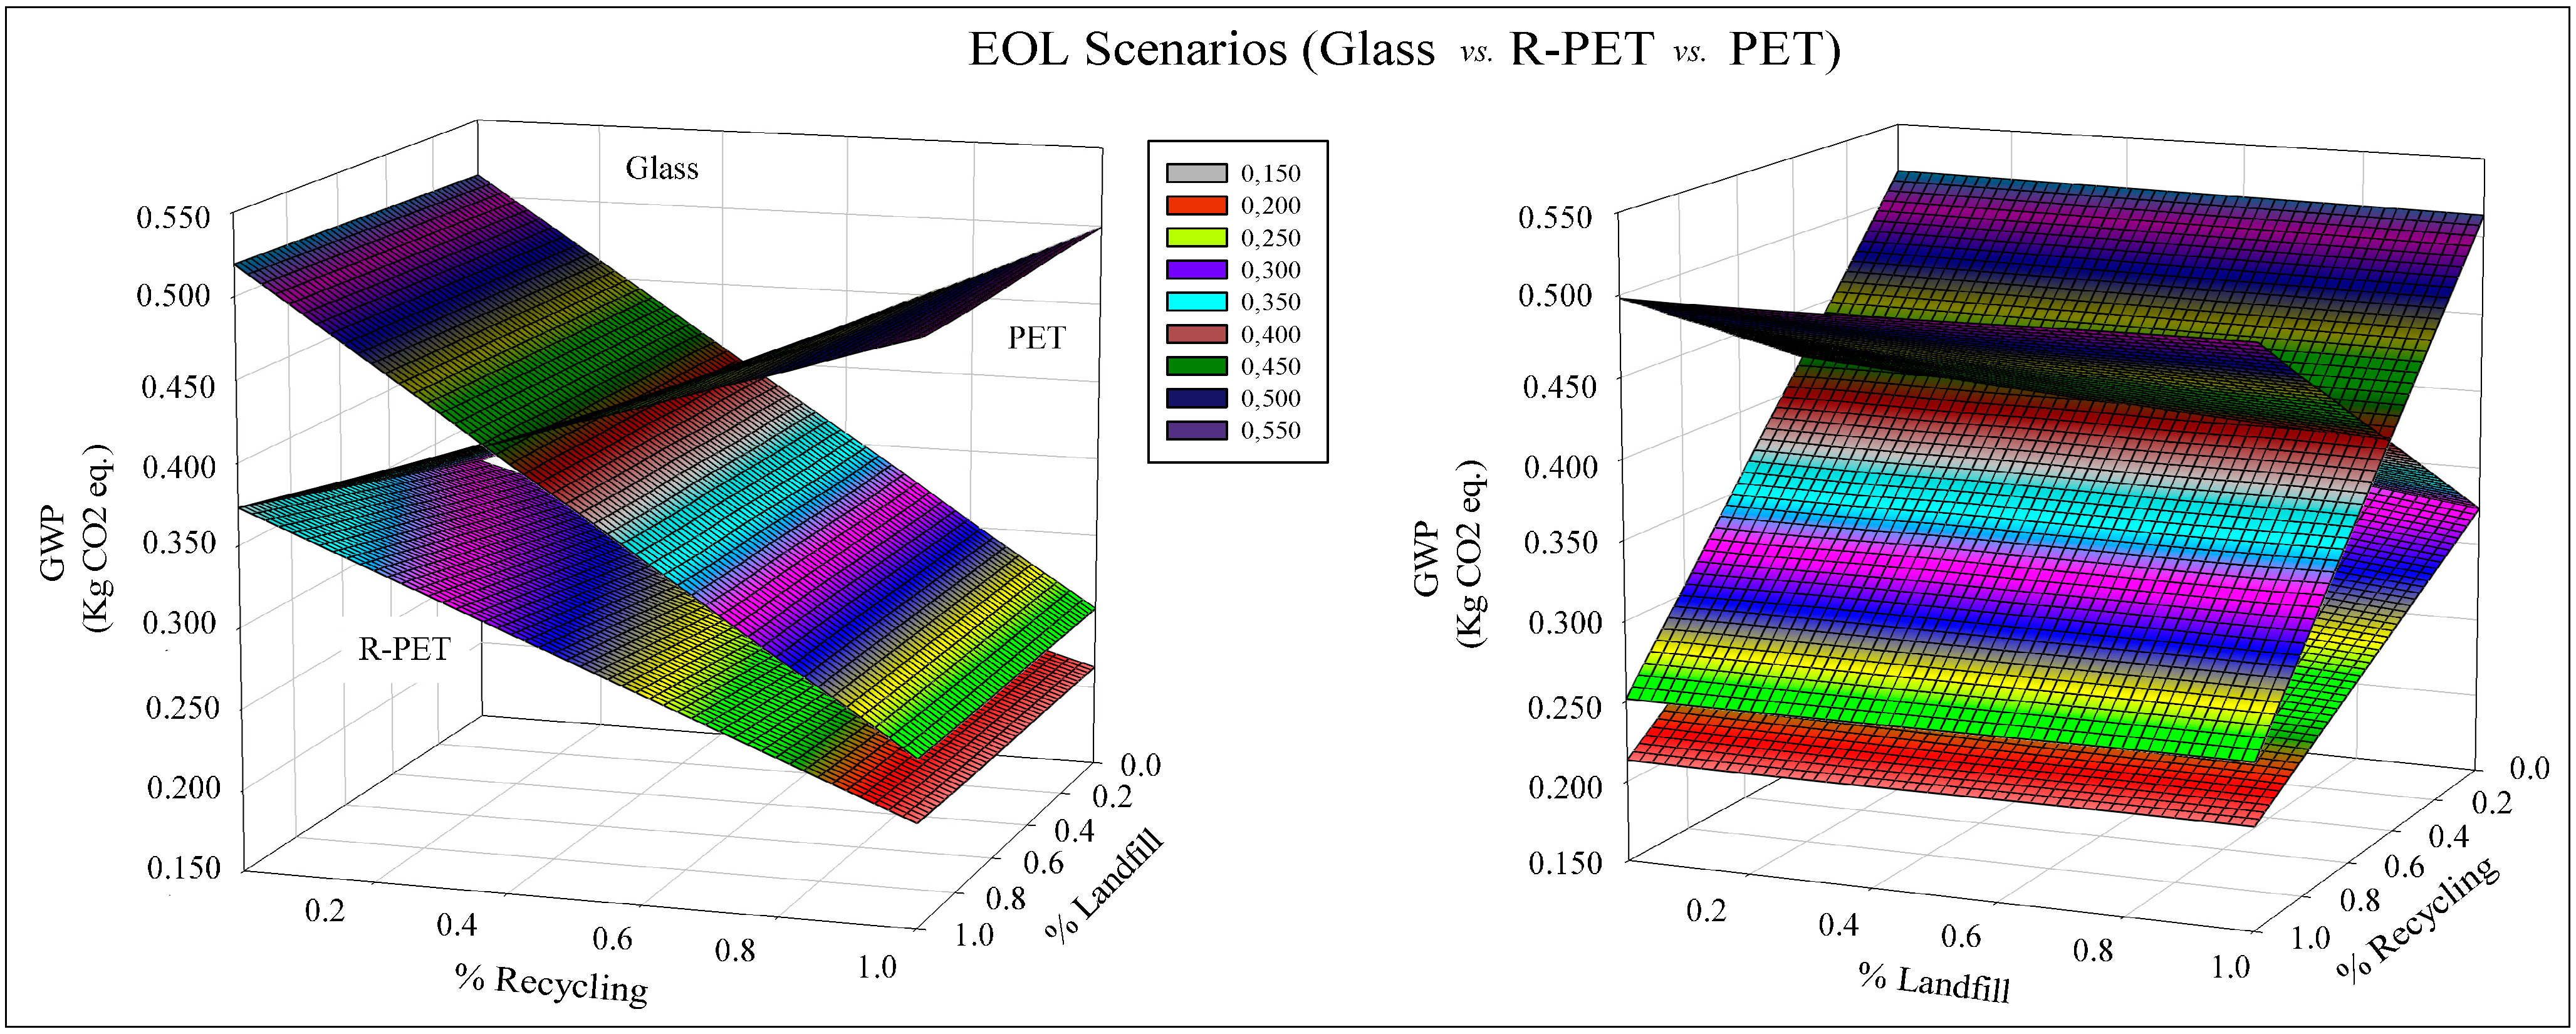
To better understand the role of the EOL phase and decisions on the assessed life cycle impacts,
Figure 9 illustrates a multi-scenario analysis of the global warming impact quantified for varying EOL strategies according to the consequential approach. The fraction of waste devoted to recycling is complementary to those devoted to landfill and to energy evaluation according to Equation (3). The front (on the left) and the side (on the right) views of the graph are illustrated to highlight the trend of each plane, representing a particular packaging material adopted for EVOO bottling.
Figure 9.
Multi-scenario analysis of the EOL phase according to a consequential approach. GWP, global warming potential.
Figure 9.
Multi-scenario analysis of the EOL phase according to a consequential approach. GWP, global warming potential.
To make the obtained results comparable, the secondary wrap packaging is selected and coupled with all three alternative primary packaging. For Scenario 2 and Scenario 3 (R-PET), the graph cumulates the global warming impact accounted for by the bottled EVOO from supply to distribution (see
Figure 8) with the varying contribution resulting from different EOL scenarios. High fractions of package waste devoted to recycling (over 40%) make the EVOO bottled in glass less impactful than in PET, especially when landfill is the favorite destination of the remaining flows. Scenario 3 (R-PET) has the lowest impact on global warming given all of the potential EOL strategies (see the plane below in
Figure 9). This finding is surprising and demonstrates that the technological advances allowing the exploitation of more and more recyclable materials for packaging (e.g., R-PET) still aspire to couple with adequate policy-making on waste management and more responsible social behaviors, practices and habits. Indeed, national policies and rules (e.g., [
32], in Italy) tend to limit the fraction of recycled PET in new bottles, and the scenarios for recycling over 50% are not currently realistic. Therefore, although the current waste management practices (see
Table 5) tend to sustain the bottling of EVOO in glass with respect to PET, there is still great room for environmental improvements of the EVOO supply chain based on package dematerialization and reusable and recyclable PET bottles.
The findings from the proposed multi-scenario consequential LCA can be used to inform consumers and policy-makers about the change in the environmental impacts associated with the EVOO life cycle from policy (
i.e., regulation) and purchasing decisions. The policy issues notwithstanding, the packaging choice of the firm is mostly influenced by the purchasing preferences of the consumer, which are mostly oriented toward glass bottles, considered as the best performing to protect the quality of EVOO. Since the environmental impacts resulting from the consumer behavior are currently neglected [
33] in the literature, a triangular assessment of the economic, environmental and quality impacts of the packaging decisions in the global EVOO supply chains is a hotspot for further studies.
4. Conclusions
This paper applies the LCA methodology to a global EVOO supply chain to identify the role of the packaging choice across the EVOO life cycle. The environmental categories of impact of global warming, ozone layer depletion, photochemical oxidation, acidification, eutrophication and non-renewable energy consumption are quantified for different FU scenarios according to an attributional approach. In all of the scenarios, the environmental impact is associated with the life cycle of one liter of EVOO bottled with alternative packaging configurations. The system boundaries include the supply of EVOO, the EVOO consolidation at the bottling facility, the bottling and packaging phase, the storage and distribution operations and the EOL scenarios. The bottling and the distribution phases impact significantly across the EVOO life cycle.
A consequential LCA is carried out to quantify the impact of policy-technological decisions and consumer practices on the global warming impact associated with the EVOO bottled with the glass bottle, the PET bottle and the recyclable PET bottle. The findings of this analysis demonstrates that high fractions of package waste devoted to recycling (over 40%) make the EVOO bottled in glass less impactful than in PET, especially when landfill is the favorite destination of the remaining flows. Scenario 3 (R-PET) has the lowest impact on global warming given all of the potential EOL strategies, because the efficient supply of packaging couples with a good response to recycling. Even knowing the performances and practices of current waste management chains tends to support the adoption of glass bottles, there is still great room for advances and improvements in PET recycling processes, regulations and EVOO stakeholders’ practices.
Further research is expected through the application of multi-scenario analysis to study the impact of EVOO blend and the demand countries on the environmental performances of the supply chain, by focusing on transport activities from the production areas to the consumers.


