
Assessment of Eco-Environmental Stress in the Western Taiwan Straits Economic Zone

Abstract
:1. Introduction
2. Methods and Data
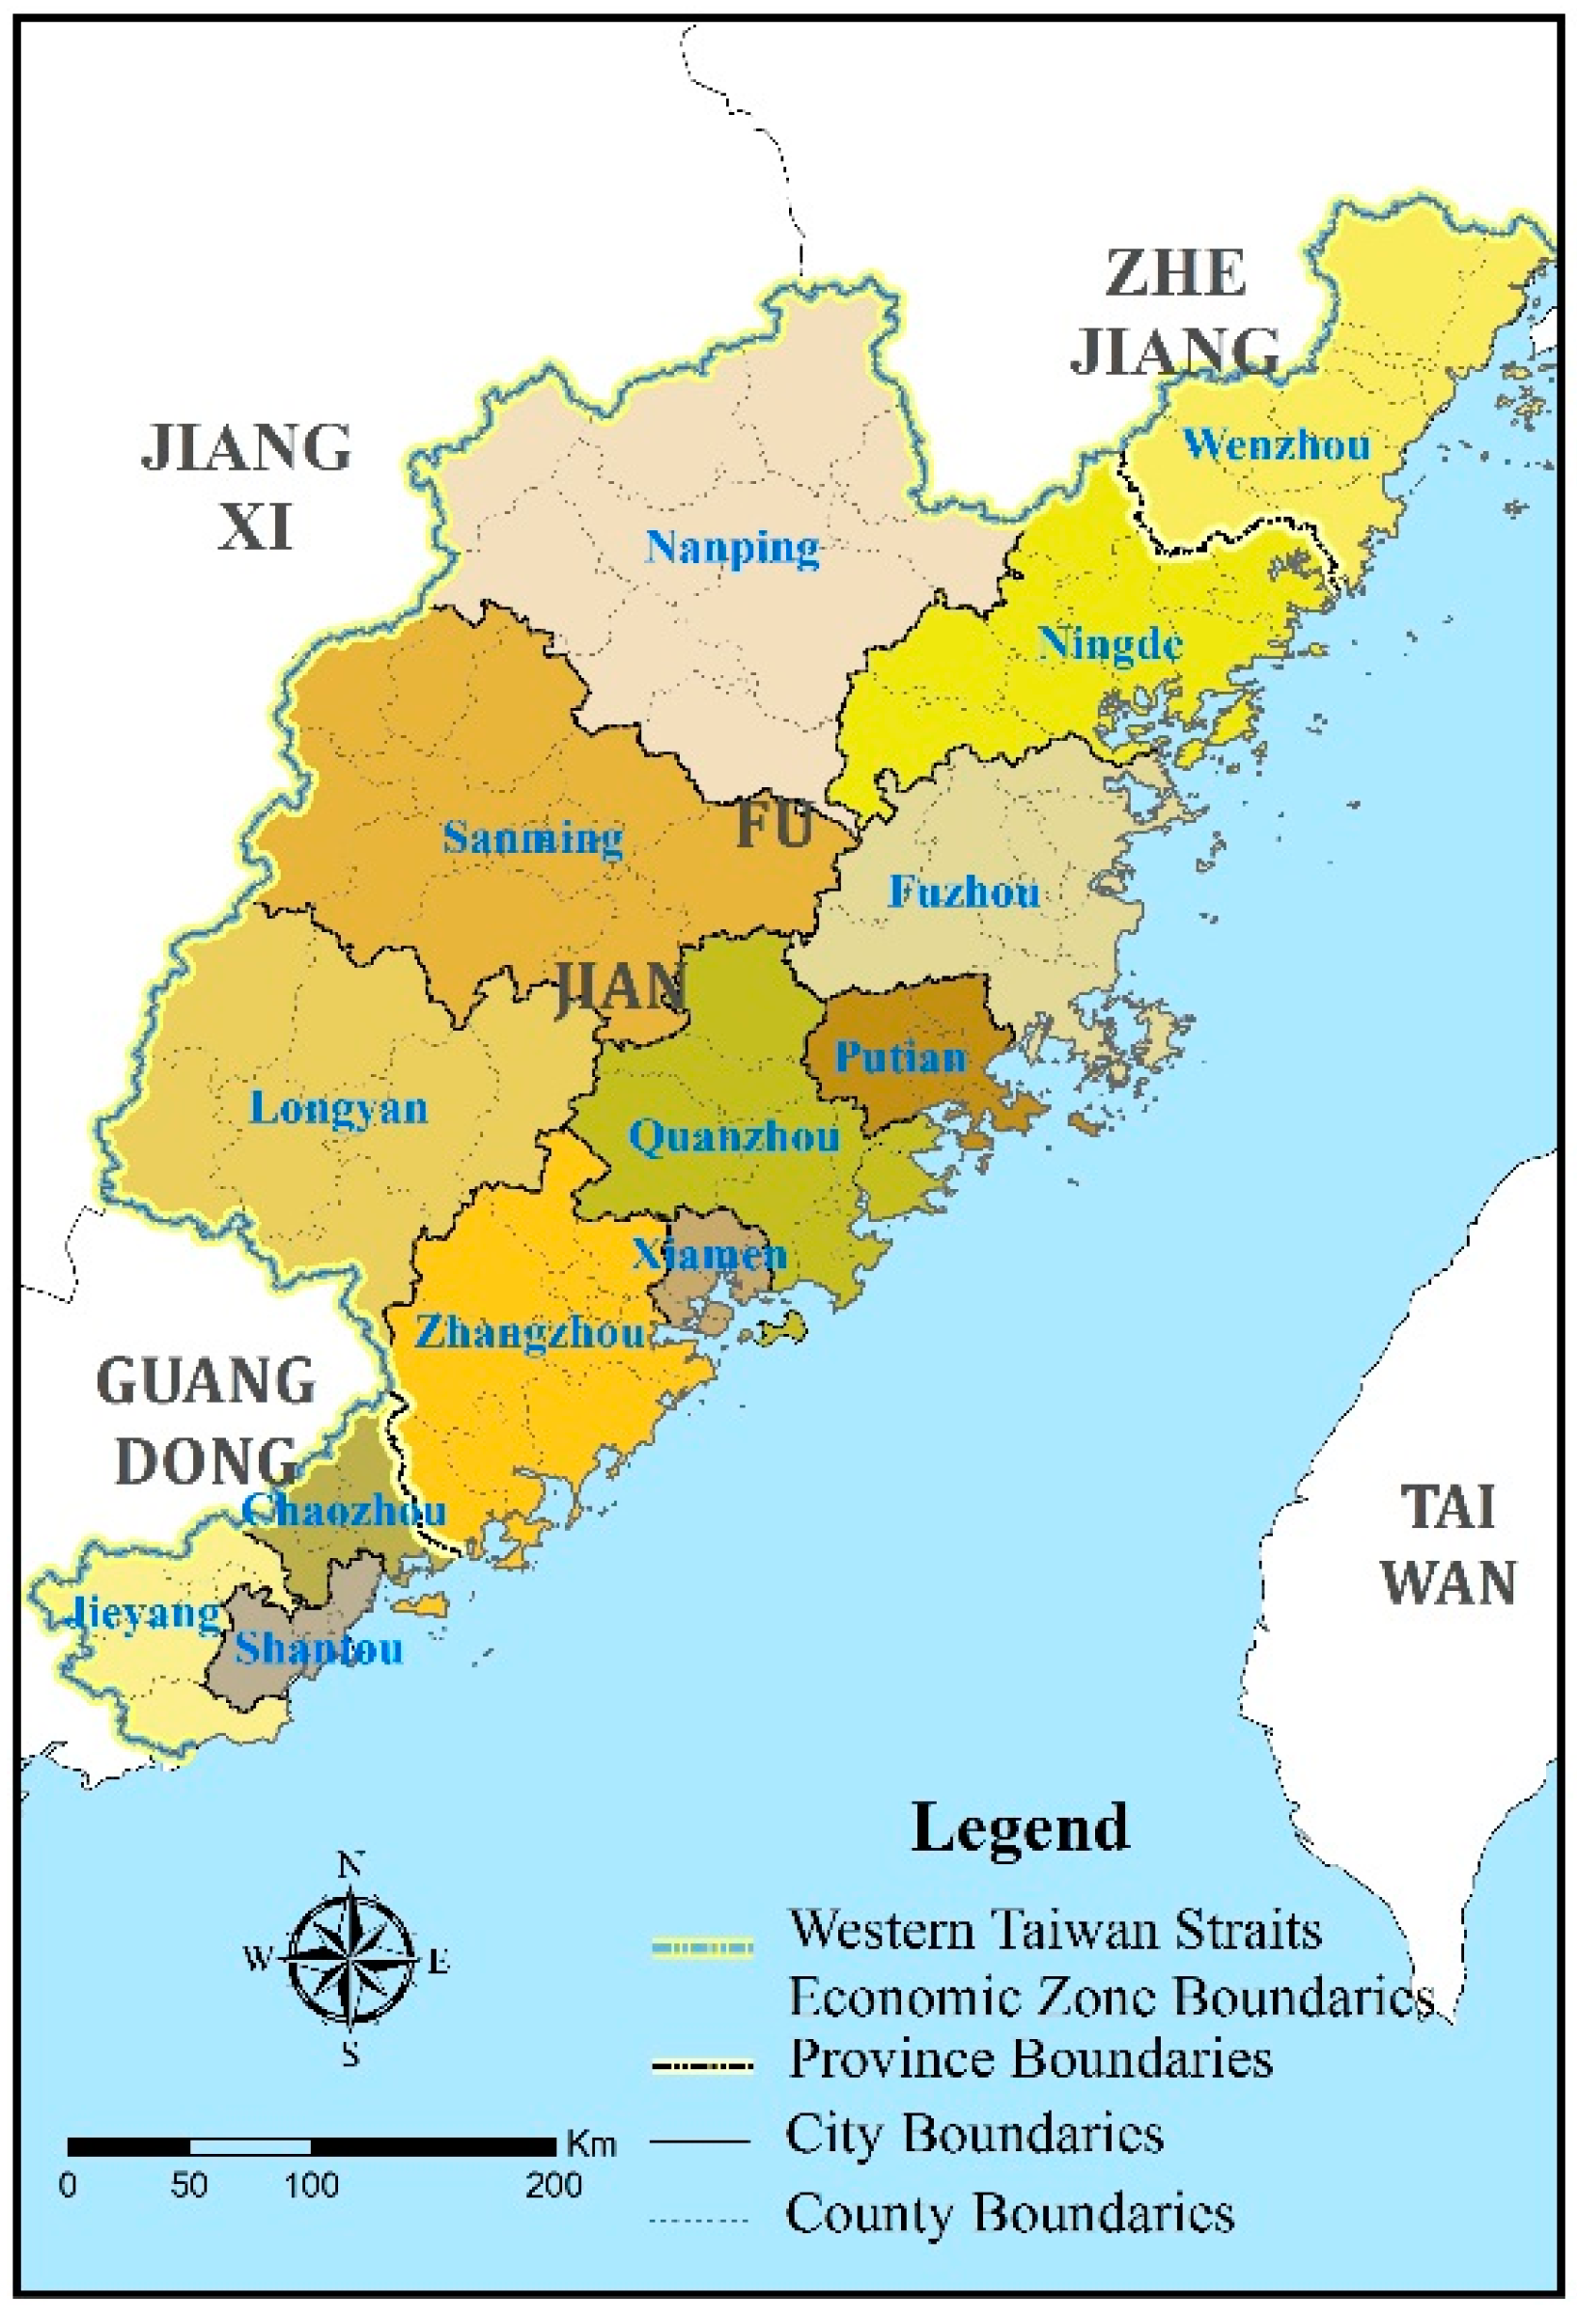
2.1. Research Area
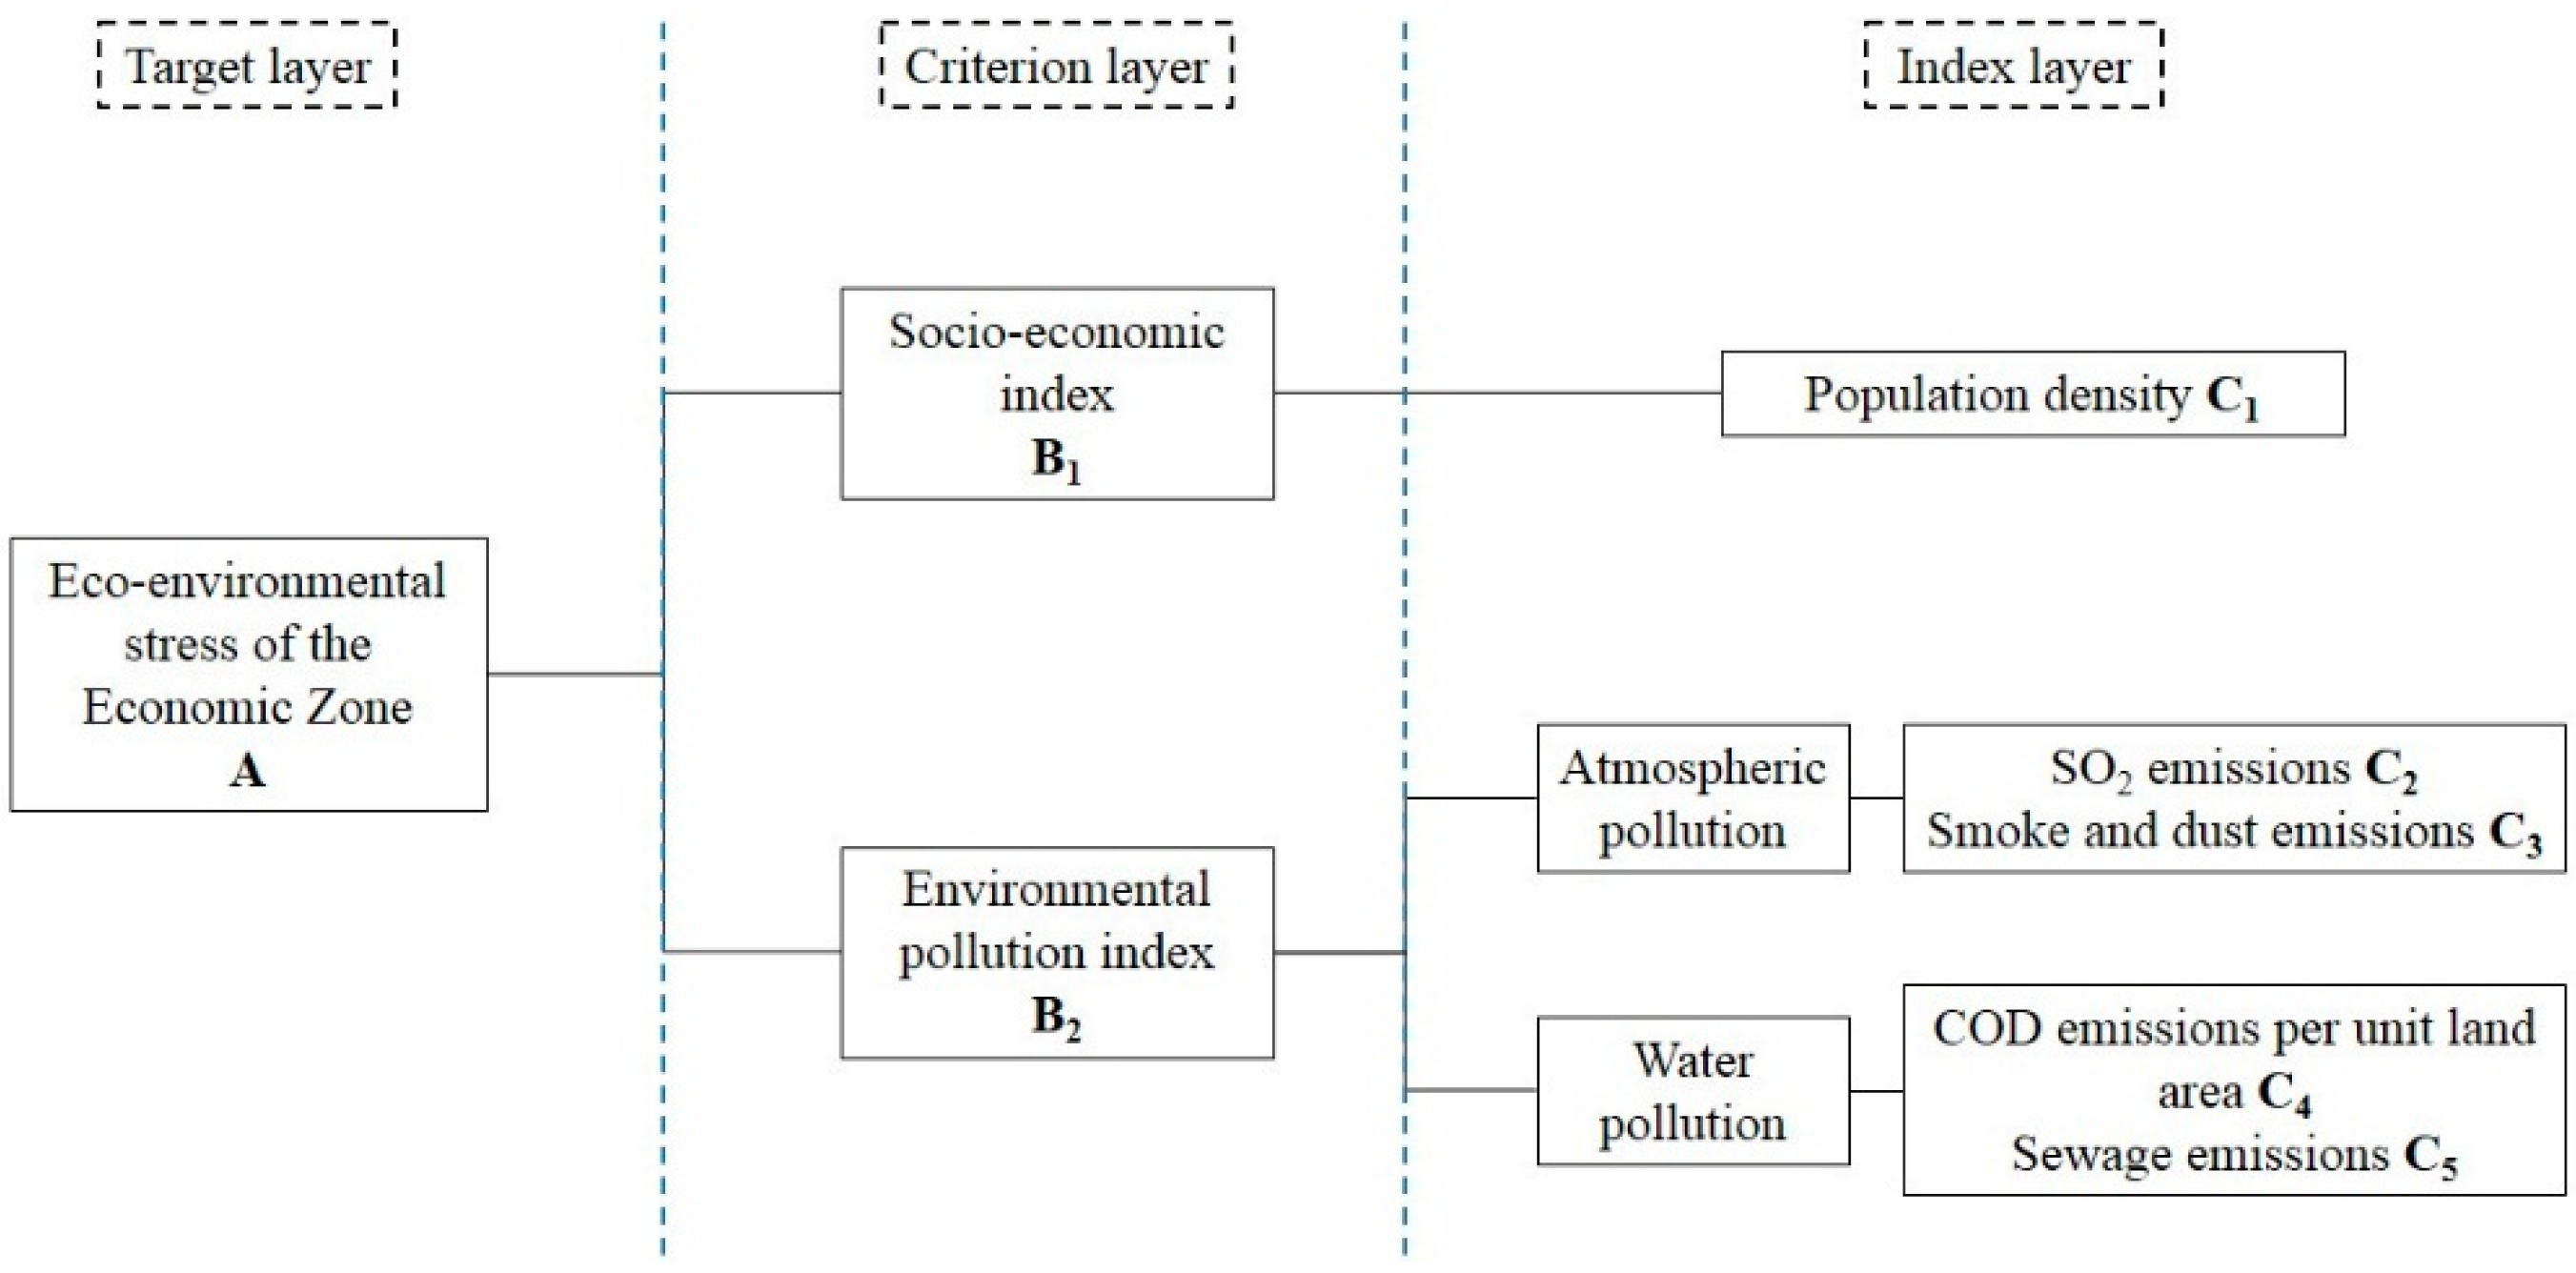
2.2. Index System
2.3. ESI Methods
- ESIi is the eco-environmental stress index of the ith region
- ESwj is the relative weight of each eco-environmental stress
- ESrij is the standardized value of each index in the ith region
- j is the given stress factor.
- Xi is the original value of the index
- Yi is the normalized value of the extreme of Xi
- Xmax and Xmin are the maximum and the minimum of each index in the research area.
- ESI indicates the eco-environmental stress index
- RECI indicates resources energy consumption index
- EPI indicates environmental performance index
- W1 and W2 are the weights of these two sub-indices
- RECIi is the value of the i-th RECI
- Pi is the weight of the i-th RECI
- EPIj is the value of the j-th EPI
- Pj is the weight of the j-th EPI
- RECi and EPj are the actual values of the i-th RECI and the j-th EPI, respectively.
- Max(RECi) and Max(EPj) are the maximum values of all RECIs and EPIs.
3. Research Results
3.1. Result Analysis of Each Index of ESI
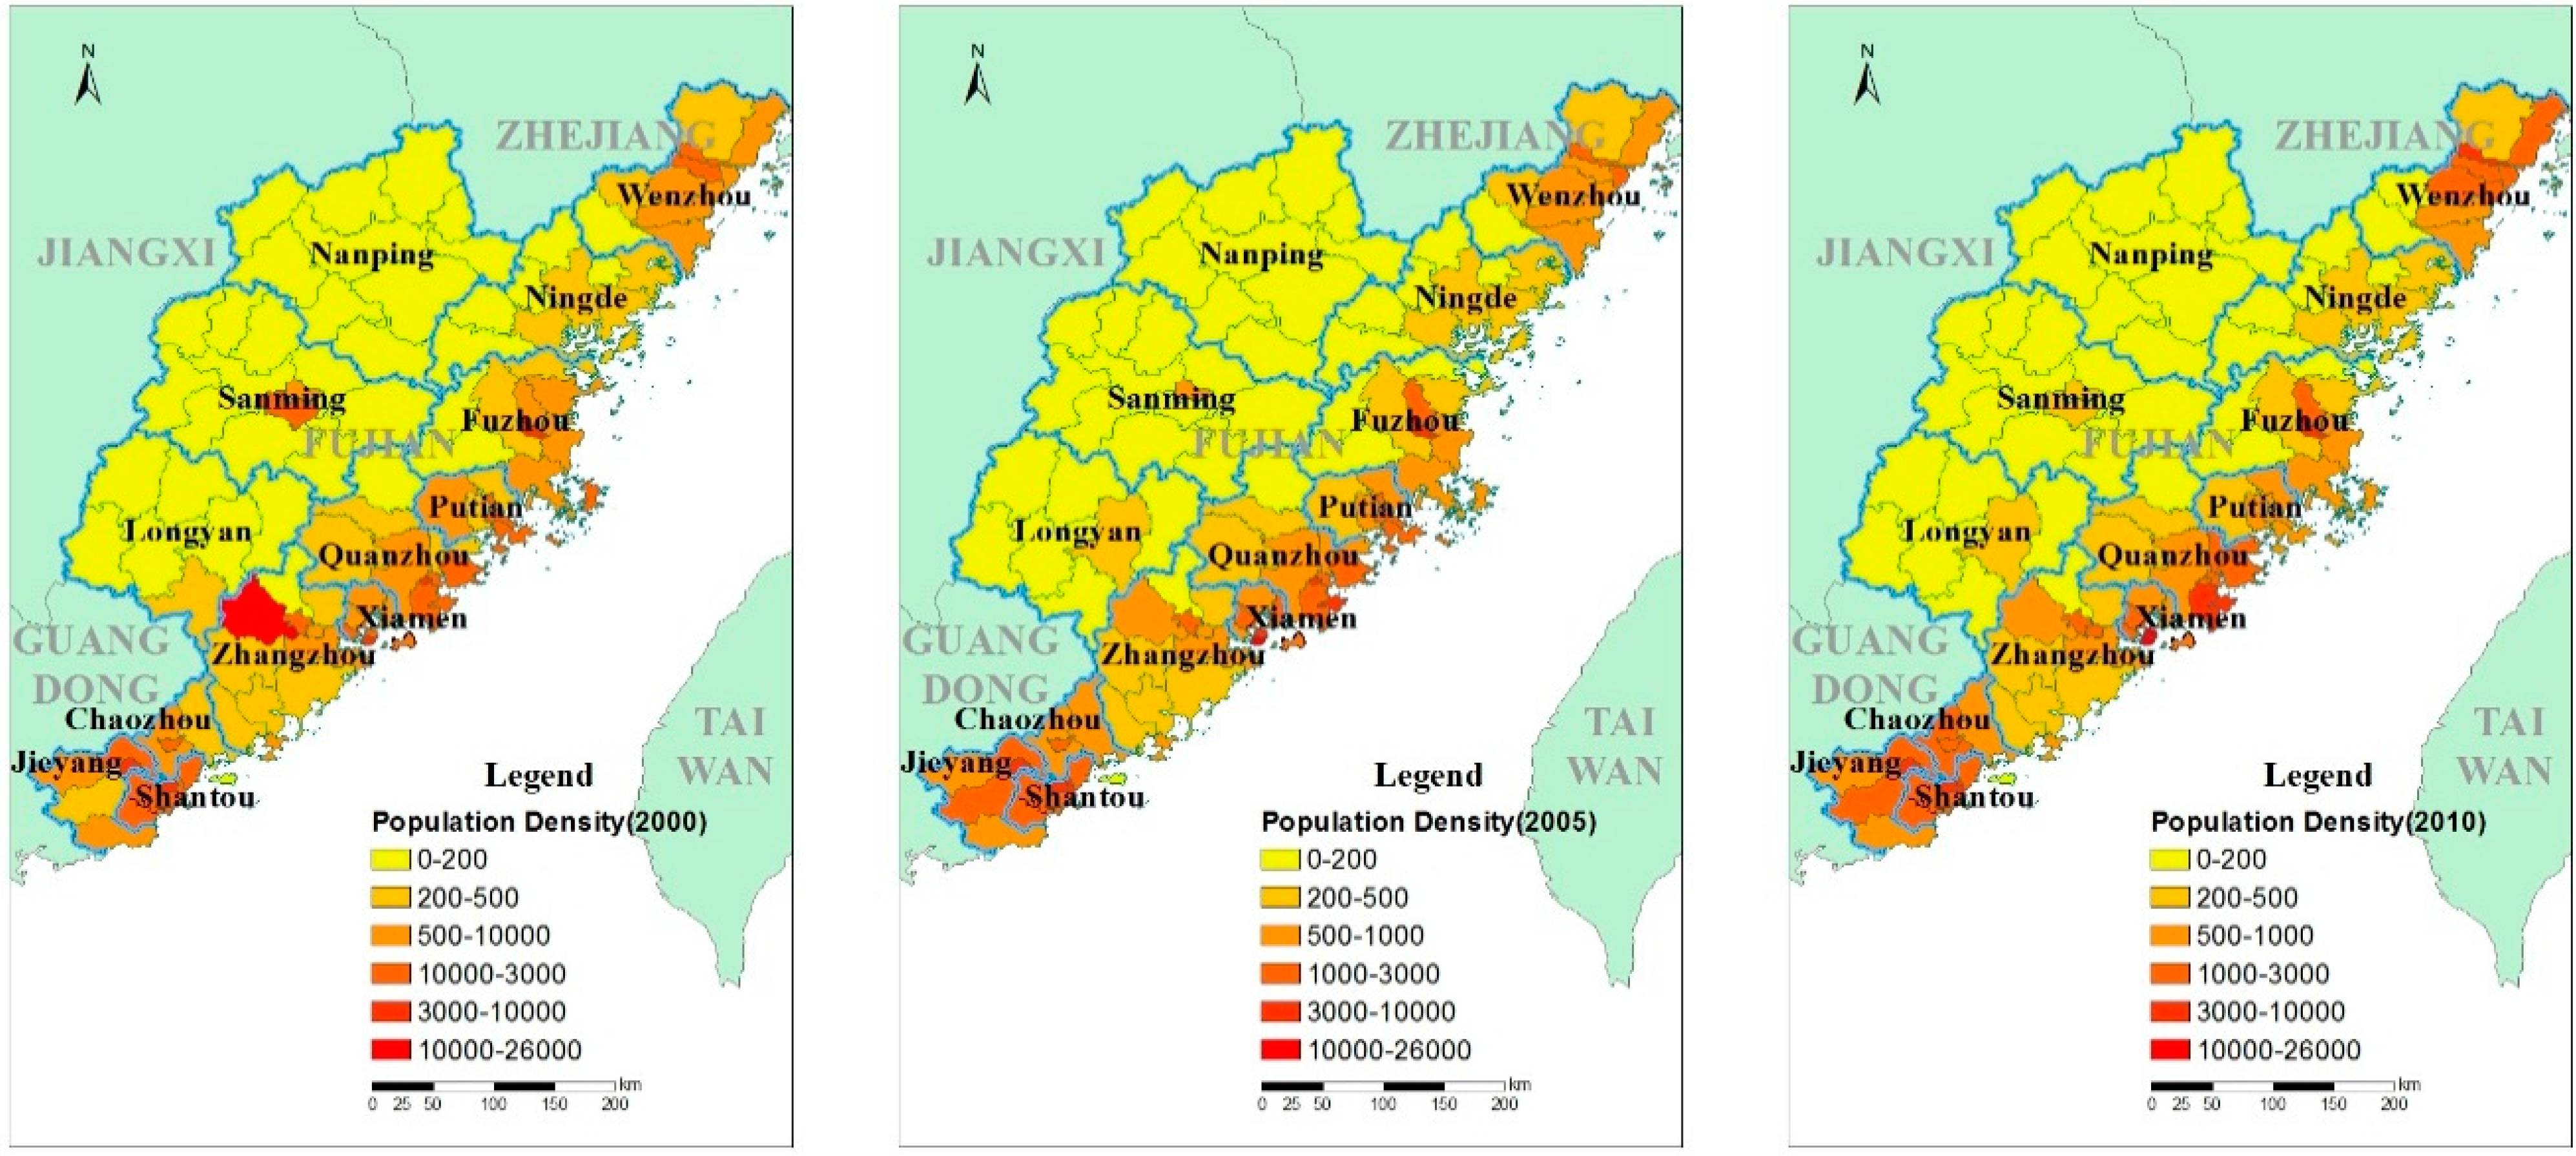
3.1.1. Population Density
3.1.2. Atmospheric Pollution
3.1.2.1. Industrial SO2 Emissions

| City | Industrial SO2 Emissions in Western Taiwan Straits Economic Zone (ton/km2) | ||
|---|---|---|---|
| 2000 | 2005 | 2010 | |
| Fuzhou | 3.7 | 8.7 | 6.9 |
| Xiamen | 25.4 | 43.1 | 31.3 |
| Putian | 1.4 | 8.0 | 7.9 |
| Sanming | 1.7 | 3.6 | 3.0 |
| Quanzhou | 1.7 | 5.4 | 4.2 |
| Zhangzhou | 0.5 | 1.1 | 3.6 |
| Nanping | 0.6 | 1.4 | 1.2 |
| Longyan | 1.6 | 3.2 | 2.8 |
| Ningde | 0.5 | 0.4 | 0.9 |
| Shantou | 13.7 | 13.1 | 30.5 |
| Chaozhou | 0.8 | 1.3 | 4.9 |
| Jieyang | 1.7 | 0.4 | 5.8 |
| Wenzhou | 3.8 | 6.8 | 5.3 |
| Mean Value | 1.99 | 3.96 | 4.10 |
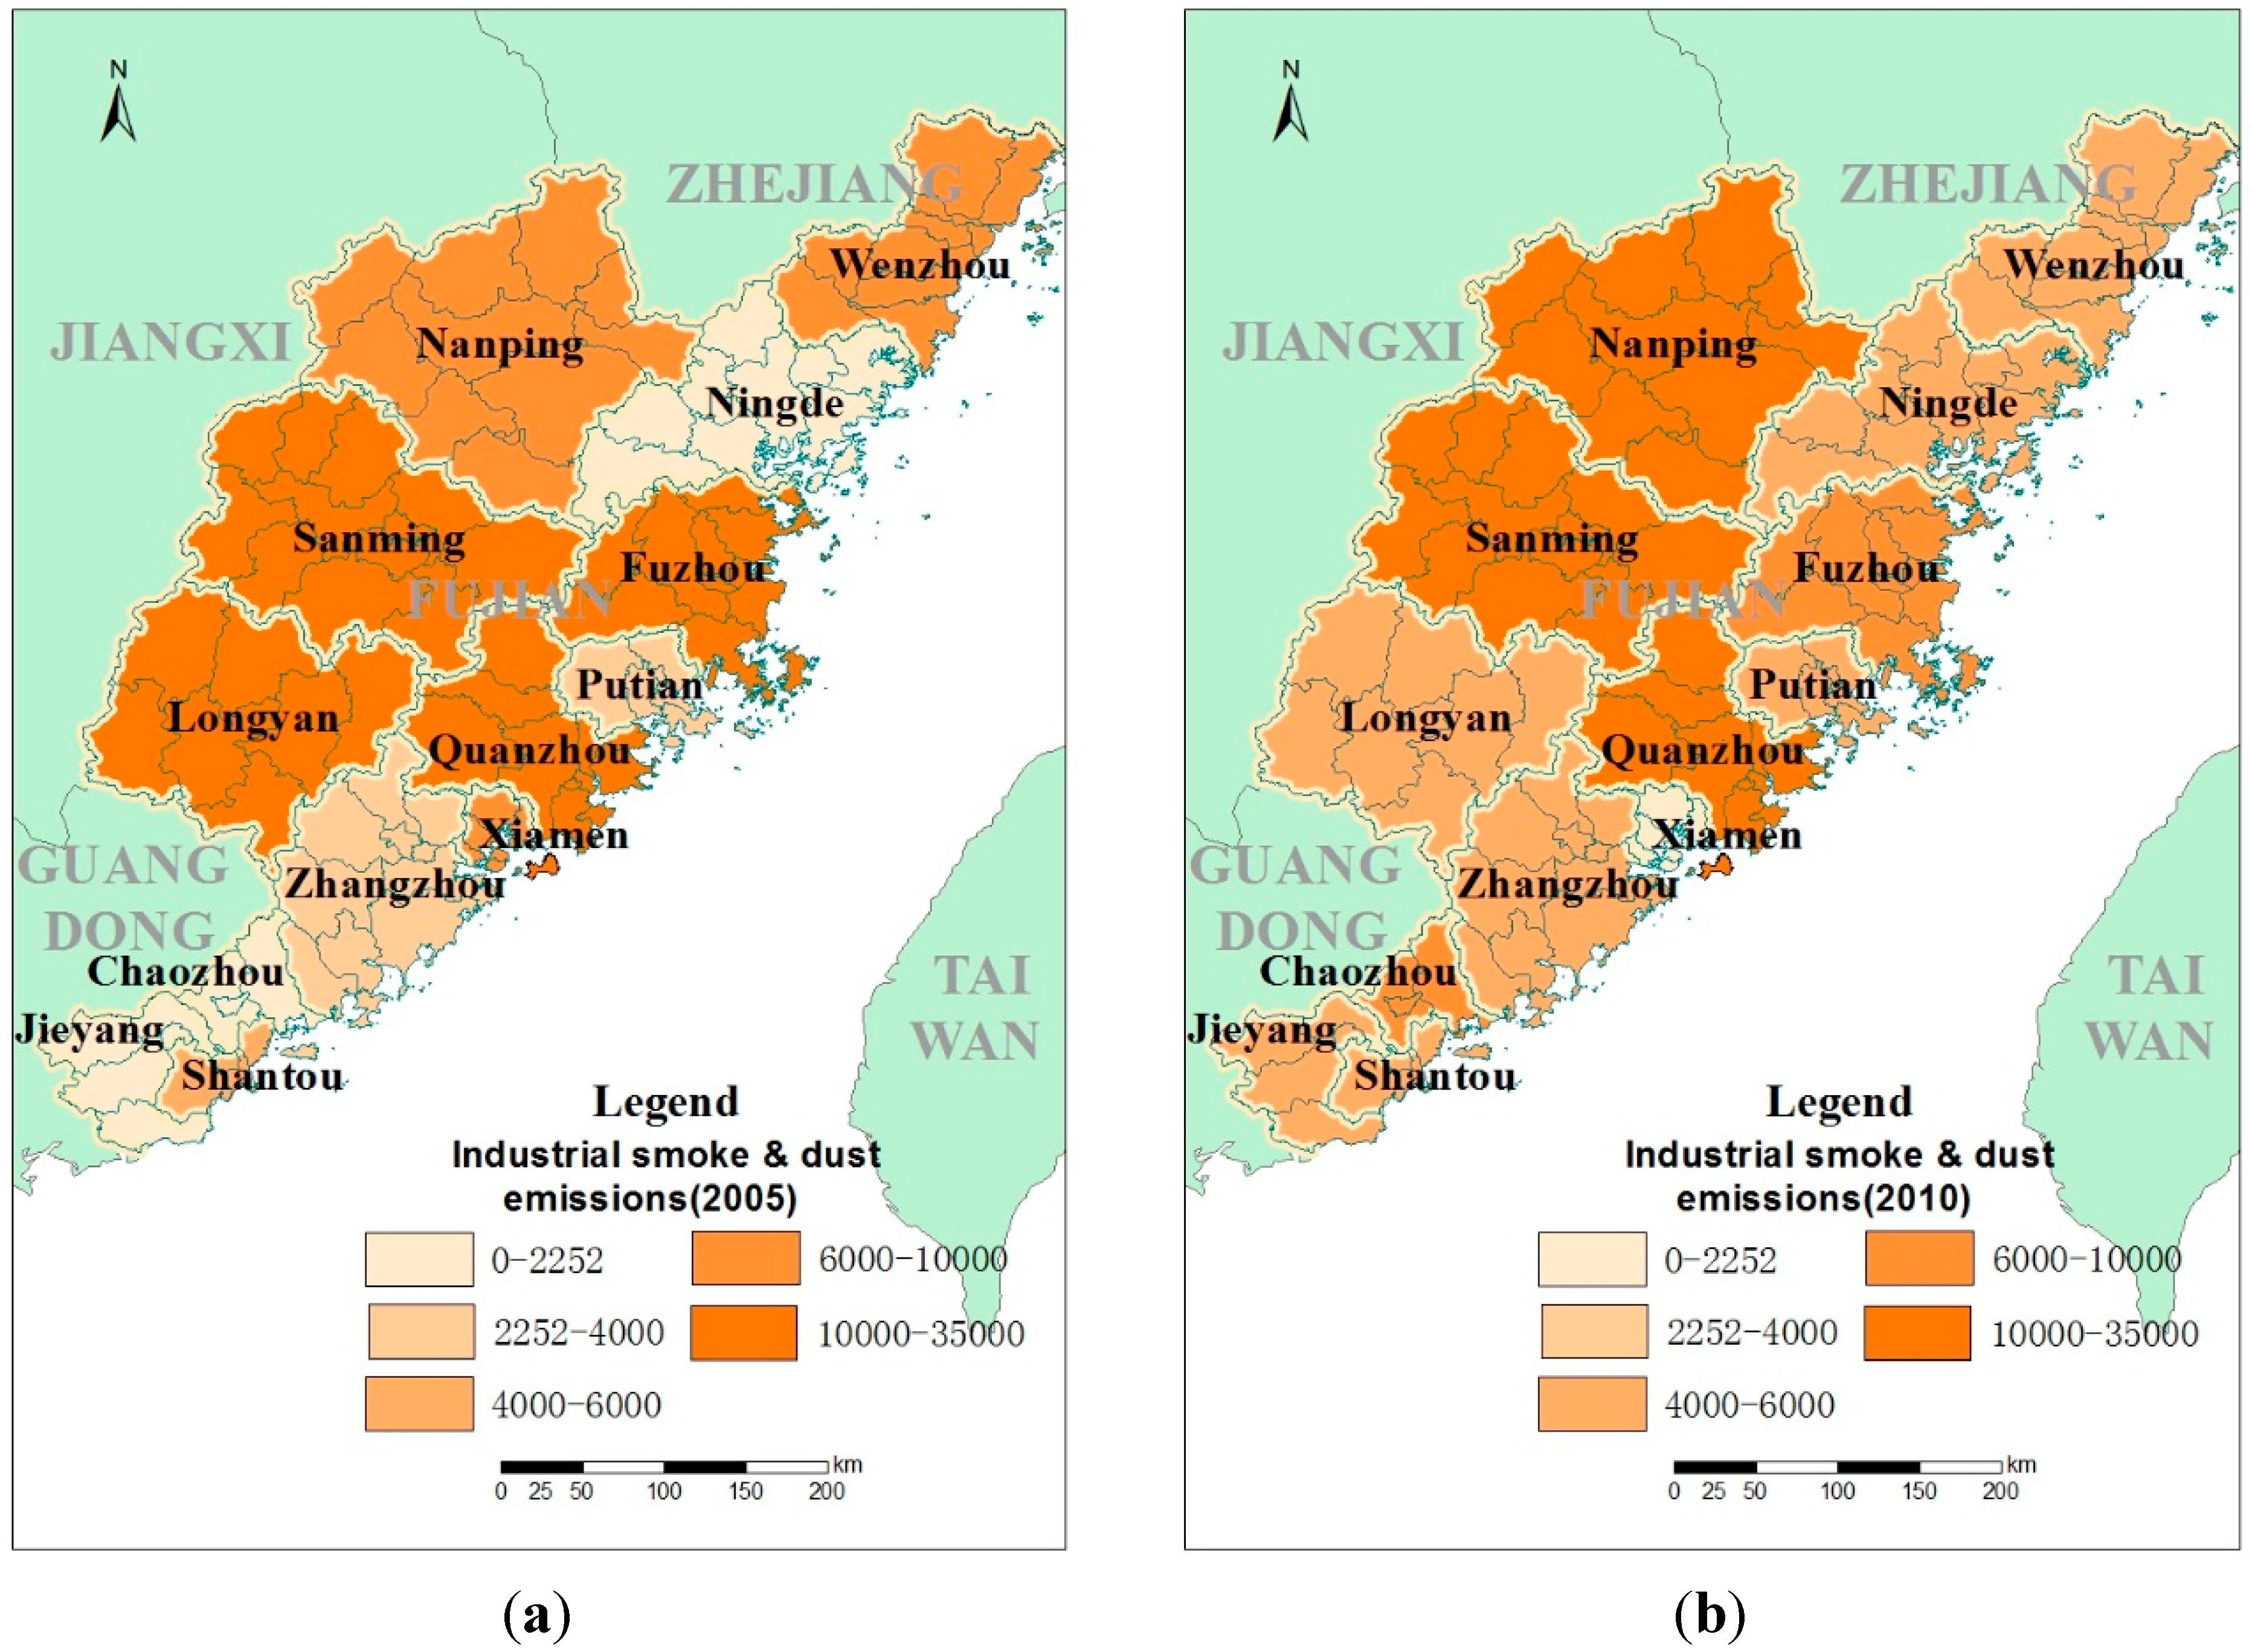
3.1.2.2. Industrial Smoke and Dust Emissions
3.1.3. Water Pollution
3.1.3.1. COD Emissions Per Unit Land Area
| City | Industrial COD Emissions Industrial SO2 Emissions in Western Taiwan Straits Economic Zone (ton/km2) | ||
|---|---|---|---|
| 2000 | 2005 | 2010 | |
| Fuzhou | 4.8 | 4.4 | 4.2 |
| Xiamen | 14.4 | 35.4 | 31.4 |
| Putian | 2.7 | 4.7 | 4.5 |
| Sanming | 2.3 | 2.0 | 2.0 |
| Quanzhou | 5.6 | 7.7 | 7.2 |
| Zhangzhou | 2.3 | 2.2 | 2.1 |
| Nanping | 1.7 | 1.7 | 1.7 |
| Longyan | 1.3 | 1.5 | 1.5 |
| Ningde | 1.4 | 2.5 | 2.4 |
| Shantou | 3.3 | 17.7 | 37.1 |
| Chaozhou | 0.0 | 0.0 | 6.9 |
| Jieyang | 5.1 | 8.0 | 7.1 |
| Wenzhou | 12.7 | 10.7 | 4.4 |
| Mean Value | 3.47 | 4.12 | 3.86 |
3.1.3.2. Sewage Emissions
3.2. Overall Analysis of the Eco-Environmental Stress Index Assessment
| Index | 2000 | 2005 | 2010 | |
|---|---|---|---|---|
| Year | ||||
| Density of population | 0.31 | 0.30 | 0.33 | |
| Atmospheric pollution | 0.37 | 0.34 | 0.33 | |
| Water pollution | 0.32 | 0.36 | 0.34 | |
| City | Index of Eco-Environmental Stress | ||
|---|---|---|---|
| 2000 | 2005 | 2010 | |
| Fuzhou | 0.22 | 0.17 | 0.15 |
| Xiamen | 1.00 | 1.00 | 0.91 |
| Putian | 0.15 | 0.18 | 0.18 |
| Sanming | 0.04 | 0.03 | 0.02 |
| Quanzhou | 0.23 | 0.20 | 0.17 |
| Zhangzhou | 0.06 | 0.04 | 0.07 |
| Nanping | 0.00 | 0.00 | 0.00 |
| Longyan | 0.02 | 0.02 | 0.02 |
| Ningde | 0.01 | 0.02 | 0.02 |
| Shantou | 0.68 | 0.64 | 1.00 |
| Chaozhou | 0.08 | 0.08 | 0.19 |
| Jieyang | 0.28 | 0.21 | 0.24 |
| Wenzhou | 0.44 | 0.24 | 0.16 |

4. Conclusions and Recommendations
Acknowledgments
Author Contributions
Conflicts of Interest
References
- Sun, G.; Zhou, D.W. Progress in stress ecology. Rural Eco-Environ. 1999, 15, 42–46. (In Chinese) [Google Scholar]
- Tang, J.; Si, A.; Li, H.Y.; Wang, X.G. Application of fractal theory to research on eco-environmental stress in west Songnen Plain. J. Ecol. Rural Environ. 2007, 23, 9–15. (In Chinese) [Google Scholar]
- Miao, H.; Wang, X.K.; Ou Yang, Z.Y. Study on regionalization of eco-environmental stress process in China. Acta Ecol. Sin. 2001, 21, 7–13. [Google Scholar]
- Gao, J. Study on Ecological Environmental Impact Integration Assessment Method; Jilin University: Jilin, China, 2007. (In Chinese) [Google Scholar]
- Borics, G.; Várbíró, G.; Padisák, J. Disturbance and stress: Different meanings in ecological dynamics? Hydrobiologia 2013, 711, 1–7. [Google Scholar] [CrossRef]
- Inhaber, H. Environmental quality: Outline for a national index for Canada. Science 1974, 186, 798–805. [Google Scholar] [CrossRef] [PubMed]
- Hope, C.; Parker, J.; Peake, S. A pilot environmental index for the United Kingdom in the 1980s. Energy Policy 1992, 20, 335–343. [Google Scholar] [CrossRef]
- Adriaanse, A. Environmental Policy Performance Indicators: A Study of the Development of Indicators for Environmental Policy in The Netherlands; Uitgeverij: The Hague, Netherlands, 1993. [Google Scholar]
- Erechtchoukova, M.G.; Khaiter, P.A.; Golinska, P. Sustainability Appraisal: Quantitative Methods and Mathematical Techniques for Environmental Performance Evaluation; Springer: New York, NY, USA, 2013. [Google Scholar]
- Giannetti, B.F.; Bonilla, S.H.; Silva, C.C.; Almeida, C.M. The reliability of experts’ opinions in constructing a composite environmental index: The case of ESI 2005. J. Environ. Manag. 2009, 90, 2448–2459. [Google Scholar] [CrossRef]
- Cengiz, T. A methodology to analyze the relations of ecological footprint corresponding with human. Int. J. Sustain. Dev. World Ecol. 2013, 20, 9–19. [Google Scholar] [CrossRef]
- Kamal-Eldin, A.; Andersson, R. A multivariate study of the correlation between tocopherol content and fatty acid composition in vegetable oils. J. Am. Oil Chem. Soc. 1997, 74, 375–380. [Google Scholar] [CrossRef]
© 2015 by the authors; licensee MDPI, Basel, Switzerland. This article is an open access article distributed under the terms and conditions of the Creative Commons Attribution license (http://creativecommons.org/licenses/by/4.0/).
Share and Cite
Shi, L.; Yang, S. Assessment of Eco-Environmental Stress in the Western Taiwan Straits Economic Zone. Sustainability 2015, 7, 2716-2729. https://doi.org/10.3390/su7032716
Shi L, Yang S. Assessment of Eco-Environmental Stress in the Western Taiwan Straits Economic Zone. Sustainability. 2015; 7(3):2716-2729. https://doi.org/10.3390/su7032716
Chicago/Turabian StyleShi, Longyu, and Shuncheng Yang. 2015. "Assessment of Eco-Environmental Stress in the Western Taiwan Straits Economic Zone" Sustainability 7, no. 3: 2716-2729. https://doi.org/10.3390/su7032716
APA StyleShi, L., & Yang, S. (2015). Assessment of Eco-Environmental Stress in the Western Taiwan Straits Economic Zone. Sustainability, 7(3), 2716-2729. https://doi.org/10.3390/su7032716