Article

Dynamic Changes of Water Conservation Service of Typical Ecosystems in China within a Year Based on Data from CERN

1
Beijing Municipal Research Institute of Environmental Protection, Beijing 100037, China
2
Institute of Geographic Sciences and Natural Resources Research, Chinese Academy of Sciences, Beijing 100101, China
3
Qingdao Agriculture University, Qingdao 266109, China
*
Author to whom correspondence should be addressed.
Sustainability 2015, 7(12), 16513-16531; https://doi.org/10.3390/su71215827
Submission received: 26 August 2015 / Revised: 7 December 2015 / Accepted: 9 December 2015 / Published: 15 December 2015
(This article belongs to the Section Environmental Sustainability and Applications)

Abstract

:
In this study, we compared and analyzed the dynamic changes of water conservation and its value of some typical forests, grasslands, and farmlands in China within a year based on the dataset of the Chinese Ecosystem Research Net (CERN). Results showed that forest, grassland, and farmland provide different kinds of water conservation services which vary in size and dynamic processes within a year. Water conservation of forest consisted of water regulation service, here referred to as water retaining service, and water supply service, while water conservation of grassland and farmland was mainly water regulation service. Different types of forests/grasslands/farmlands can serve different water conservation services in both size and change patterns. In general, the water conservation service and value of forests is the largest (Xishuangbanna forest being $712·hm−2·year−1, Dingshu Mountains forest being $823·hm−2·year−1, and Changbai Mountains forest being $366·hm−2·year−1), and then is the farmlands (Yucheng farmland being $147·hm−2·year−1, Changshu farmland being $92·hm−2·year−1, Qianyanzhou farmland being $247 hm−2·year−1), and that of the grasslands is the least (Haibei alpine meadow being $75·hm−2·year−1, Mongolia grassland being $30·hm−2·year−1). The monthly water conservation and its value of each ecosystem had its own changing pattern throughout the year.

1. Introduction

Ecosystems provide important hydrological services which are referred to a series of services related to water [1]. These services include regulation of ground and surface water, increase in minimum flow during dry season (base flow), reduction of floods, and increased water quality [2,3], which comprehensively are considered water flow regulation, and secure the water supply for human habitation [4,5]. Ecosystem services, including water conservation, are not only related to human gains but also important to sustain biodiversity. Concurrently, the water crisis is becoming more serious. Concern by scholars, governmental agencies, and community groups have devoted themselves to water conservation services in regard to ecosystems and to the protection and maintainability of these ecosystems [6]. Some concerned the change and protective measures of water-related ecosystem service [7,8,9], some concerned the amount and value of water service supplied by ecosystems [10]. The assessment of water service by ecosystems is a base to make scientific protective policies through linking nature and human society.
Until now, there are two kinds of methods to assess the ecosystem service value. One is the evaluation method, based on a per unit area, which was produced by Costanza et al., when they assessed the world ecosystem service value in 1997 [4]. This method has attracted attention of Chinese ecological researchers over the years. Xie et al. used this method to assess the ecosystem service value of Tibet in 2003 [11] and of China in 2008 [12] based on the local factors obtained through expert knowledge, and improved the method in 2015 [13]. The other method is the evaluation method, based on a per unit ecosystem function. In this method, the ecosystem function and per unit value of each kind multiplies to get the ecosystem service value. Many studies have used this method to get the ecosystem service value on the national, provisional, and local scales. To be compared, the former is easier and more suitable to the large scale, which needs a value transfer method, while the latter is more complex, which needs more local eco-factors. Actually, the results obtained through the latter one on the small scale is the base to obtain more accurate parameters in the former method.
Chan et al. (2006) suggested that governments cannot construct a systematic method to better manage and plan ecosystem services because of a lack of knowledge about dynamic changes in ecosystem services, both locally and regionally [14]. It was acknowledged that the land use change was a major cause of ecosystem service change [15]. There were many studies which focused on the ecosystem service change based on the land use change data and ecosystem service value per unit area [16,17]. In these studies, the ecosystem structures, functions, and processes were ignored when the ecosystem service change was analyzed, and the results were macroscopic. There were also relating studies about the comprehensive economic assessment of afforestation. Investigations [18,19,20,21,22] showed the dynamic changes of ecosystem services of forests over their lifecycle. Li et al., (2010) studied the dynamic processes of ecosystem service and value of the Qianyanzhou planted forest in China over a year-long period [23]. However, very few attempts have been made to compare the dynamic changes of a special ecosystem service and its value among different ecosystems, except when analyzing the differentiation of the carbon fixation value dynamic processes between different kinds of forests, grasslands, and farmlands in China in a year [24]. There is still a lack of comparison of other types of ecosystem services, including water conservation services, among different ecosystems according to the ecosystem structures and processes.
Mainstreaming the ecosystem services concept in policy-making has come along with great expectations from practitioners, policy-makers, and scientists to improve environmental policy and halt the loss of biodiversity [7]. Most environmental policies incorporate ecosystem-service-related governance tools, but only a few policies refer to ecosystem service explicitly both in the EU and China. The ecosystem-degrading question emerged earlier in the EU; thus, the request of ecosystem protection and legislation were proposed earlier compared with China. During the 1960s to 1990s, the legislation relating environment and ecology in EU countries developed fast, and most of the laws are aimed at a single protection subject, such as “Water Law”, “Forest Law”, “Soil Protection Law”, “Costal Protection Law” etc. The comprehensive laws mainly are “Environmental Protection Law” and “Nature Conservation Law”. Until now, the strict legislation for ecosystem protection has had a good effect on ecology in the EU. With the emergence of serious eco-environmental problems in China, the request of ecology protection and restoration has become stronger and stronger by scholars, governmental officers, and the public since the 1980s. There are also laws aimed at single ecosystem types in China, such as “Water Law”, “Forest Law”, “Grassland Law”, “Wildlife Conservation Law”, etc. In 2015, China amended the “Environment Protection Law” and stressed to protect natural ecosystems in it. Moreover, China wrote an ecology protection red line in the “Environment Protection Law” for the first time. Now, China is carrying on boundary determination of ecology protection red lines all over the country. Both in the EU and China, there is no ecology legislation directly relating to ecosystem service.
The aim of this paper is to illustrate and compare the dynamic change processes of water conservation service and its value of different typical ecosystems based on the model of water conservation service by ecosystems, to aid in our knowledge of ecosystem services evolution and the efficient management of ecosystems. The assessment and valuation of ecosystem services demand researchers not only to consider the situation and formation of ecosystems, but should also take into account the internal mechanism and evolution of ecosystem function [25]. Different ecosystems provide different water conservation services because of different vegetation formation and structure. Chinese Ecosystem Research Net (CERN), established in 1988, investigates typical ecosystems in China [26]. Data has been accumulated which involves ecosystem structures, functions, processes, and patterns, to thereby study the dynamic change of ecosystem service and its value.

2. Material and Methods
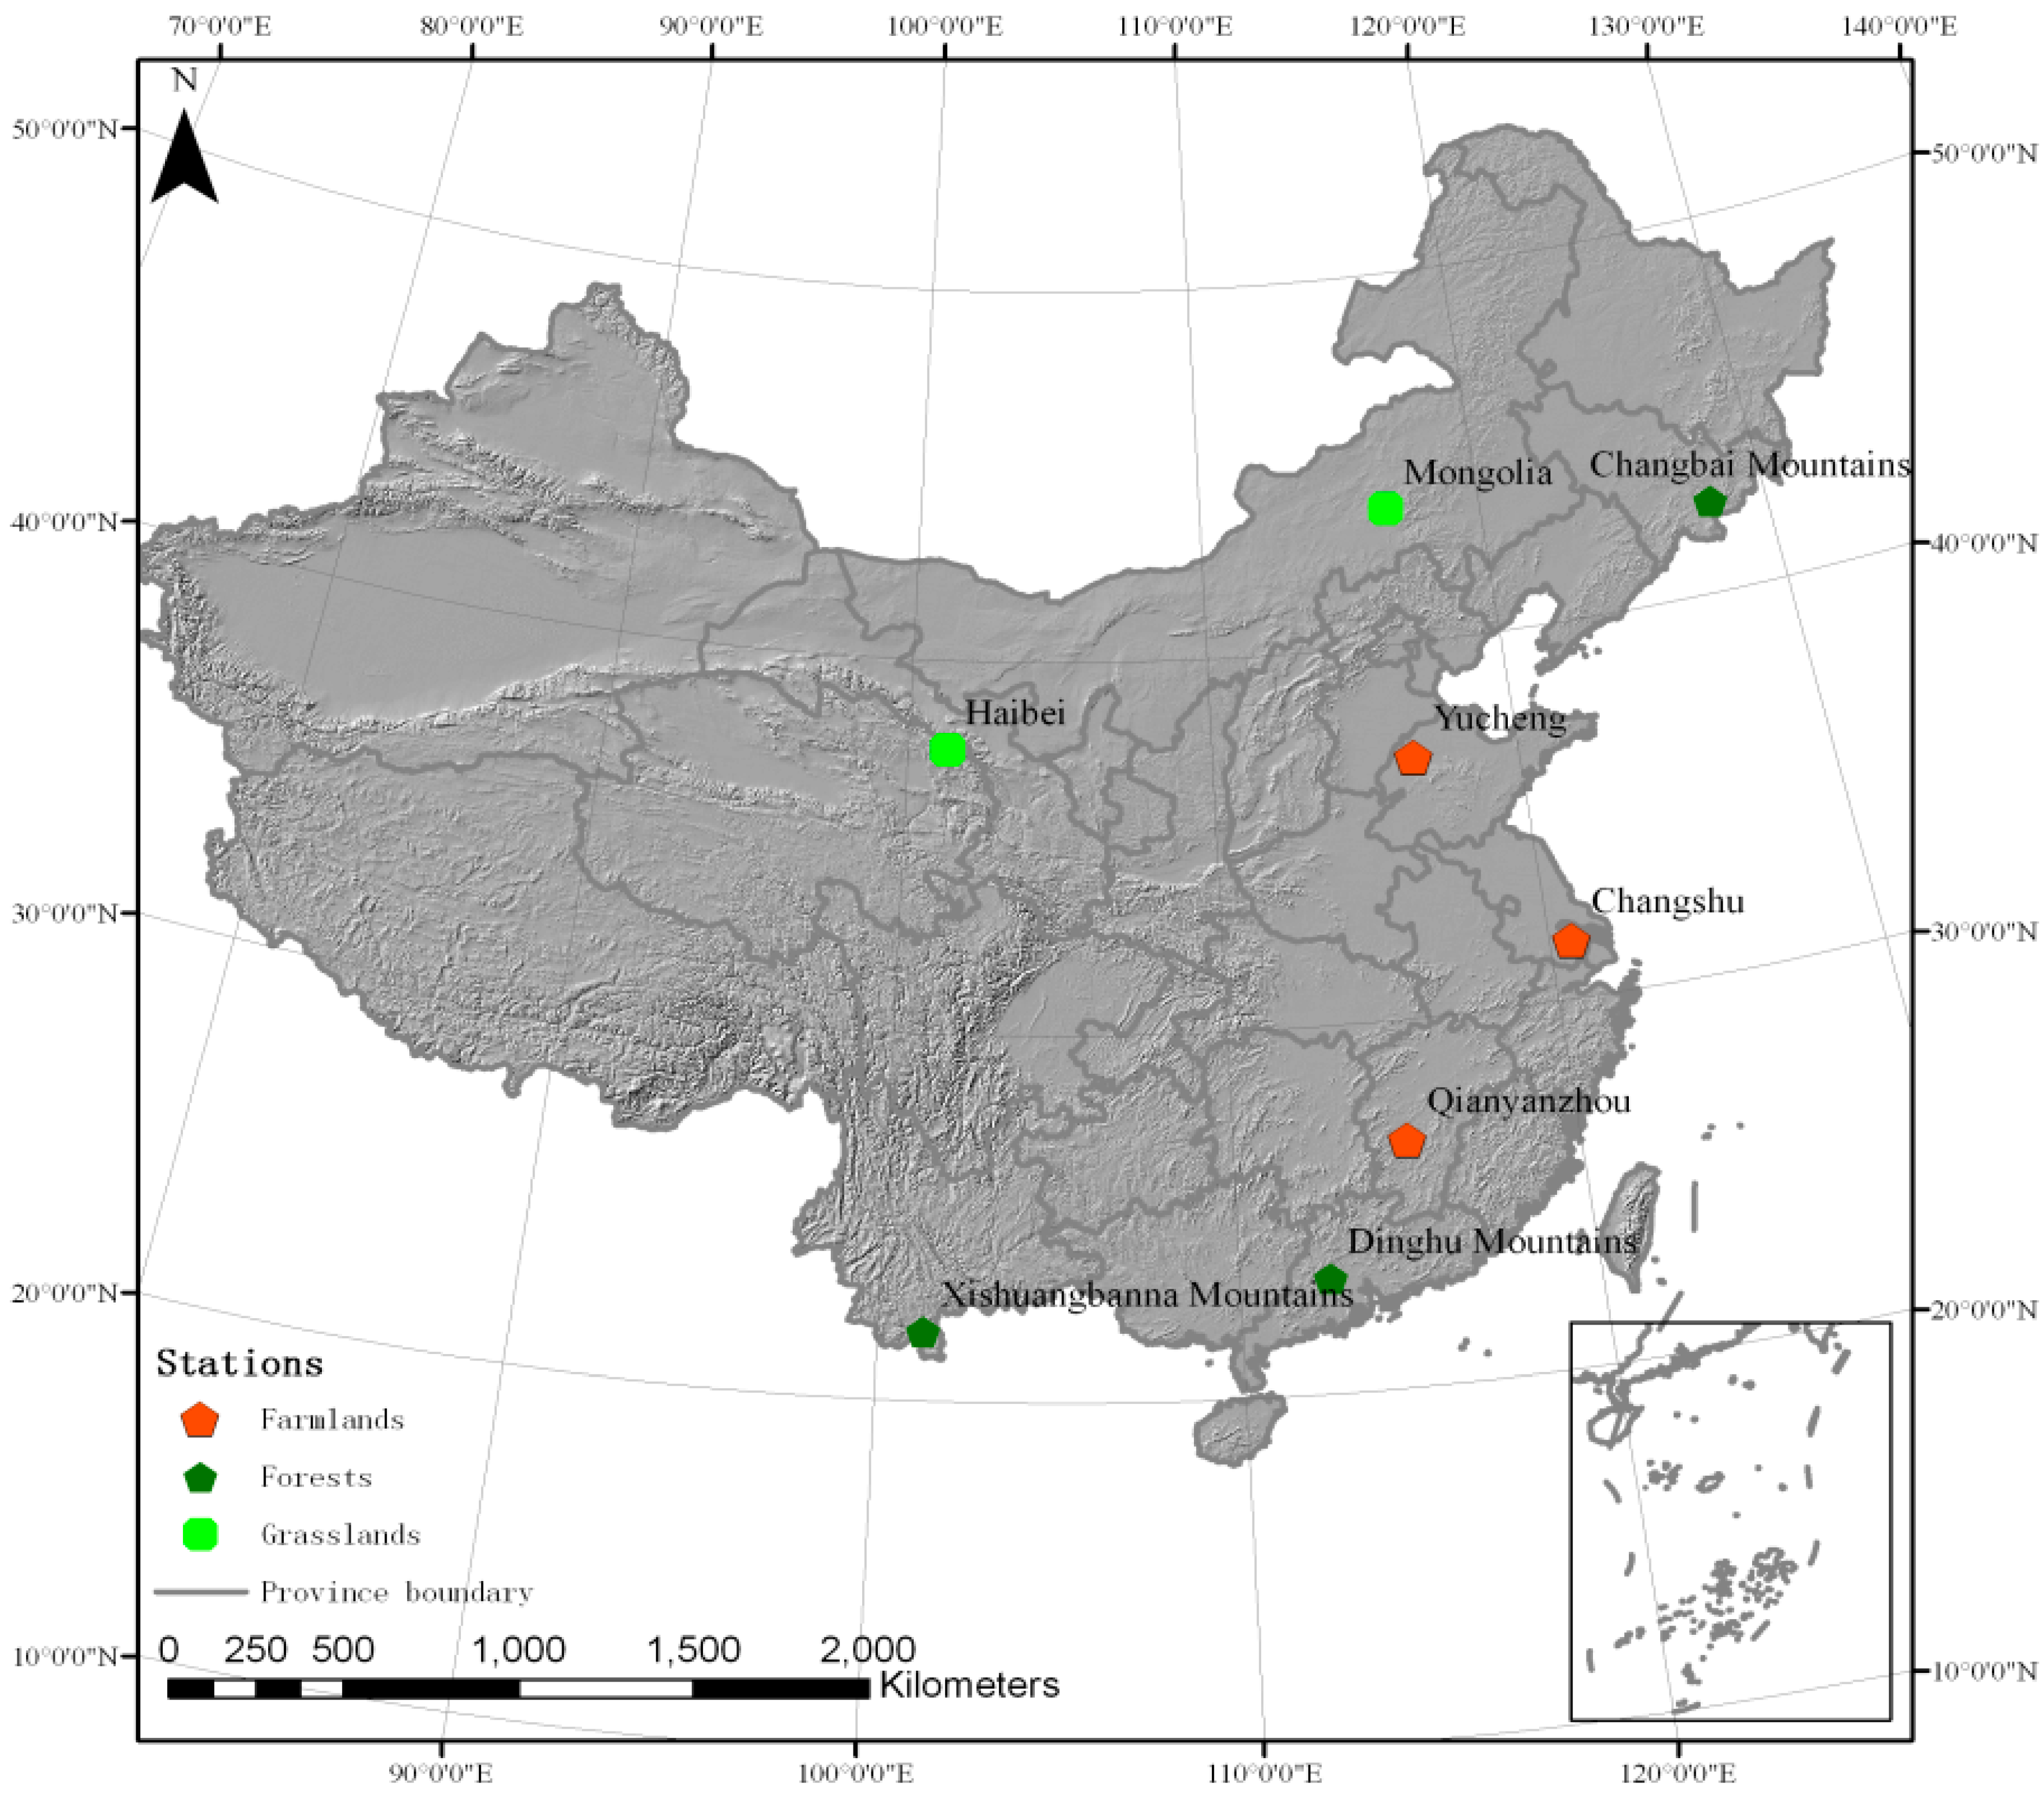
2.1. Study Areas

We chose the representative plant communities in some typical ecosystems in China, such as forests, grasslands, and farmlands. The forests were temperate broad-leaved Korean pine forest in the Changbai Mountains (Liaoning Province), subtropical monsoon evergreen broad-leaved forest in the Dinghu Mountains (Guangdong Province), tropical monsoon forest in Xishuangbanna (Yunnan Province). The grasslands are temperate grasslands in Mongolia and alpine meadows in Haibei (Qinghai Province) from east to south. The farmlands are warm, temperate winter wheat and summer maize fields in Yucheng (Shandong Province), subtropical winter wheat and rice fields in Changshu (Jiangsu Province), and subtropical early rice and second rice fields in Qianyanzhou (Jiangxi Province). The locations of representative plant communities can be seen in Figure 1. And the environmental characteristics of the study subjects are summarized in Table 1 [27].
Figure 1. Locations of study subjects.
Sustainability 07 15827 g001
Table 1. Characteristics of each study subject.
NameLocationVegetation LayersAnnual TemperatureAnnual PrecipitationSlopeSoil
Temperate broad-leaved Korean pine forest128°05′41″ E~128°05′46″ E, 42°24′10″ N~40°24′12″ N; in Changbai Mountains, in Liaoning ProvinceTree layer, shrub layer and herb layer3.5 °C700~800 mmGrade: 2°; direction: northBrown coniferous forest soils
Subtropical monsoon evergreen broad-leaved forest112°30′39″ E~112°33′41″ E, 23°09′21″ N~23°11′30″ N; in Dinghu Mountains, in Guangdong ProvinceTree layer, shrub layer and herb layer21 °C1956 mmGrade: 25°~35°; direction: northeastLateritic red soil
Tropical monsoon forest101°12′1″ E, 21°57′40″ N; in Xishuangbanna in Yunnan ProvinceTree layer, shrub layer, herb layer and inter-layer vegetation21.5 °C1557 mmGrade: 12°~18°; direction: northLatosol
Temperate grassland116°42′ E, 43°38′ N; in Xinlinhot in MongoliaHerb layer0.96 °C333.5 mmIn a gentle broad valley in a hillDark chestnut soil
Alpine meadow101°18′37″ E~101°18′51″ E, 37°36′31″ N~37°37′8″ N; in Haibei in Qinghai ProvinceHerb layer−1.7 °C426~860 mmGrade < 5°Cold frozen clay
Warm temperate winter wheat and summer maize farmland116°34′9″ E~116°34′16″ E, 36°49′39″ N~36°49′47″ N; in Yucheng in Shandong ProvinceCrop layer13.2 °C530 mmIn a alluvial plainAlluvial soil
Subtropical winter wheat and rice farmland120°41′52″ E~120°41′53″ E, 31°32′55″ N~31°32′56″ N; in Changshu in Jiangsu ProvinceCrop layer15.4 °C1054 mmThe terrain is flat.Paddy soil
Subtropical early rice and second rice farmland115°04′13″ E, 26°44′48″ N; in Qianyanzhou in Jiangxi ProvinceCrop layer17.8 °C1461 mmThe terrain is flat.Paddy soil

2.2. Methods

In this study, water conservation is defined as a comprehensive regulation on water resource and water supply to humans through a series of hydrological processes of ecosystems, including vegetation interception, surface litter water storage, soil water storage, and runoff. Water regulation is completed through various water interception methods and storage of different layers of ecosystems. Thus, taking into account the water conservation processes and benefits that humankind derive from hydrological processes, water conserved by ecosystems include not only water retained by ecosystems, which takes part in runoff regulation and maintains the life of ecosystem, but also water supplied to humans which is the part that humans can use for livelihood and production. Thus, water conservation service value is the sum of water retaining service value and water provision service value of ecosystems.

2.2.1. Methods of Physical Quantity of Water Conservation Service

(1) Forest ecosystems

Rainwater onto forests is divided into three parts; one is water retained by the forest, one is water evaporated by the forests, and the last one is runoff. Water conserved by forests consists of retained water and water supplied by forests. Thus, the evaporation is out of consideration in the water conservation. The forest retains water through the forest canopy, surface litter, and soil. The forest has high canopy interception as a result of its complex structure, with seasonal changes varying with the distribution pattern of precipitation. The litter and soil of the forest has a high capacity for water storage. Water supplied to humankind is water used for livelihood and production, and is the runoff of the forest, including surface runoff and underground runoff. According to the hydrological processes of the forest, and the existing methods of accounting the canopy interception [28], the water storage of litter and soil [29] and the total water hydrological function of forest [30], we established the following equations to assess water conservation of the ecosystem.
Water retained by forest can be calculated by Equation (1);
V f s = V f s 1 + V f s 2 + V f s 3
where V f s is the total water retained by forest, V f s 1 is water intercepted by forest canopy, V f s 2 is water contained by surface litter, V f s 3 is water contained in soil.
Water interception by forest can be calculated through Equation (2);
V f s 1 = R f F f b R f t
where R f is total precipitation, F f b is stem-flow, R f t is through-fall.
Water supply can be calculated through Equation (3);
V f p = F f = F f   a b o v e + F f b e l o w
where V f p is water supply by forest, F f is runoff of the forest, F f   a b o v e is the surface runoff, F f b e l o w is the underground runoff.
The total water conserved by forest is the sum of retained water and water supply, being expressed in Equation (4);
V f = V f s + V f p
where V f is the total water conserved by forest.

(2) Grassland ecosystems

Grasslands researched in this study conserve water mainly through retaining water in itself because the runoff is small. Moreover, most of water retained in grasslands is retained by soil because of the small retaining capacity of grass canopy and surface litter. Therefore, water conserved by grasslands can be expressed by water contained in soil, being expressed in Equation (5):
V g = V g s 1
where V g is water conserved by grassland, V g s 1 is water contained in soil.

(3) Farmland ecosystems

Water conservation in farmlands is to secure the amount of water needed by crops to grow naturally. In addition to the little capability of water retained by crop, therefore, water conserved by farmland is also the water in the soil, being expressed in Equation (6):
V a = V a s
where V a is water conserved by farmland, V a s is water contained in soil.

2.2.2. Methods of Economic Value of Water Conservation Service

(1) Value of water retention

An ecosystem can be seen as a reservoir because both have the function of storing water and regulating water. The construction and maintenance of artificial reservoirs and depreciation were used in the assessment of the monetary value of water storage by forests in the study by Mateusz Grygoruk et al. [31]. Here, we can use the cost of reservoir construction per unit capacity as a substitution price to calculate the total water retaining value of ecosystem. In light of ecosystem service being a “flow” concept, here we chose the current deposit interest 3.5% to calculate the annuity according Equation (7), and then obtained the monthly cost by dividing the annuity by 12.
A V = P V ( 1 + r ) n r ( 1 + r ) n 1
where A V is the annuity, P V is the total cost of reservoir construction, r is the discount rate, 3.5%. At present, the average cost of reservoir construction is 6.11 yuan·m−3 in China [32]. Irrigation is a big source for water in farmland besides precipitation. Therefore, we deducted the irrigation cost when calculating the water retaining service value through the method of water content in soil. Here, we chose the average irrigation cost in China $0.009·m−3 to calculate cost. In calculating water supply service value [33], the water resource fee in China $0.079·m−3 was used [34].

2.3. Data Sources

Most data generated in the paper originated from CERN, and the other existing references. Thus, the precipitation, stem-flow, through-fall, water content of surface litter, amount of surface litter, soil water content, and runoff of the Xishuangbanna tropical monsoon forest were from the monitoring database from 2002–2006 of Xishuangbanna Station in CERN. The precipitation, interception by forest canopy and runoff of the Dinghu Mountains subtropical monsoon evergreen broad-leaved forest were reference data [35], and the soil water content, water content of surface litter, and the amount of surface litter were from monitoring database from 1993–1999 of Dinghu Mountains Station in CERN. The precipitation, stem-flow, through-fall, water content of surface litter, amount of surface litter, soil water content and runoff of the Changbai Mountains temperate broad-leaved Korean pine forest were from monitoring data base from 2005–2007 of Changbai Mountains Station of CERN. The precipitation and soil water content of the Haibei temperate grassland, Mongolia alpine meadow, Yucheng warm temperate winter wheat and summer maize farmland, Changshu subtropical wheat and rice farmland, and Qianyanzhou subtropical early rice and late rice farmland were, respectively, from monitoring databases of Haibei Station from 2001–2003, Mongolia Station from 2005–2007, Yucheng Station from 2006–2007, Changshu Station from 2006–2007, and Qianyanzhou Station from 2006–2007 in CERN. The irrigation record data of farmlands was also from the stations of CERN. All the data used to analyze the dynamic changes within a year was the average data of the monitored years. Due to the monitoring months in Changbai Mountains Station, Haibei Station, and Mongolia Station, we only analyzed the dynamic change of water conservation service, and its value of temperate broad-leaved Korean pine forest from May to September, alpine meadow from April to October, and temperate grassland from May to October. The software used for analysis and drawing maps is Origin 8.5.

3. Results

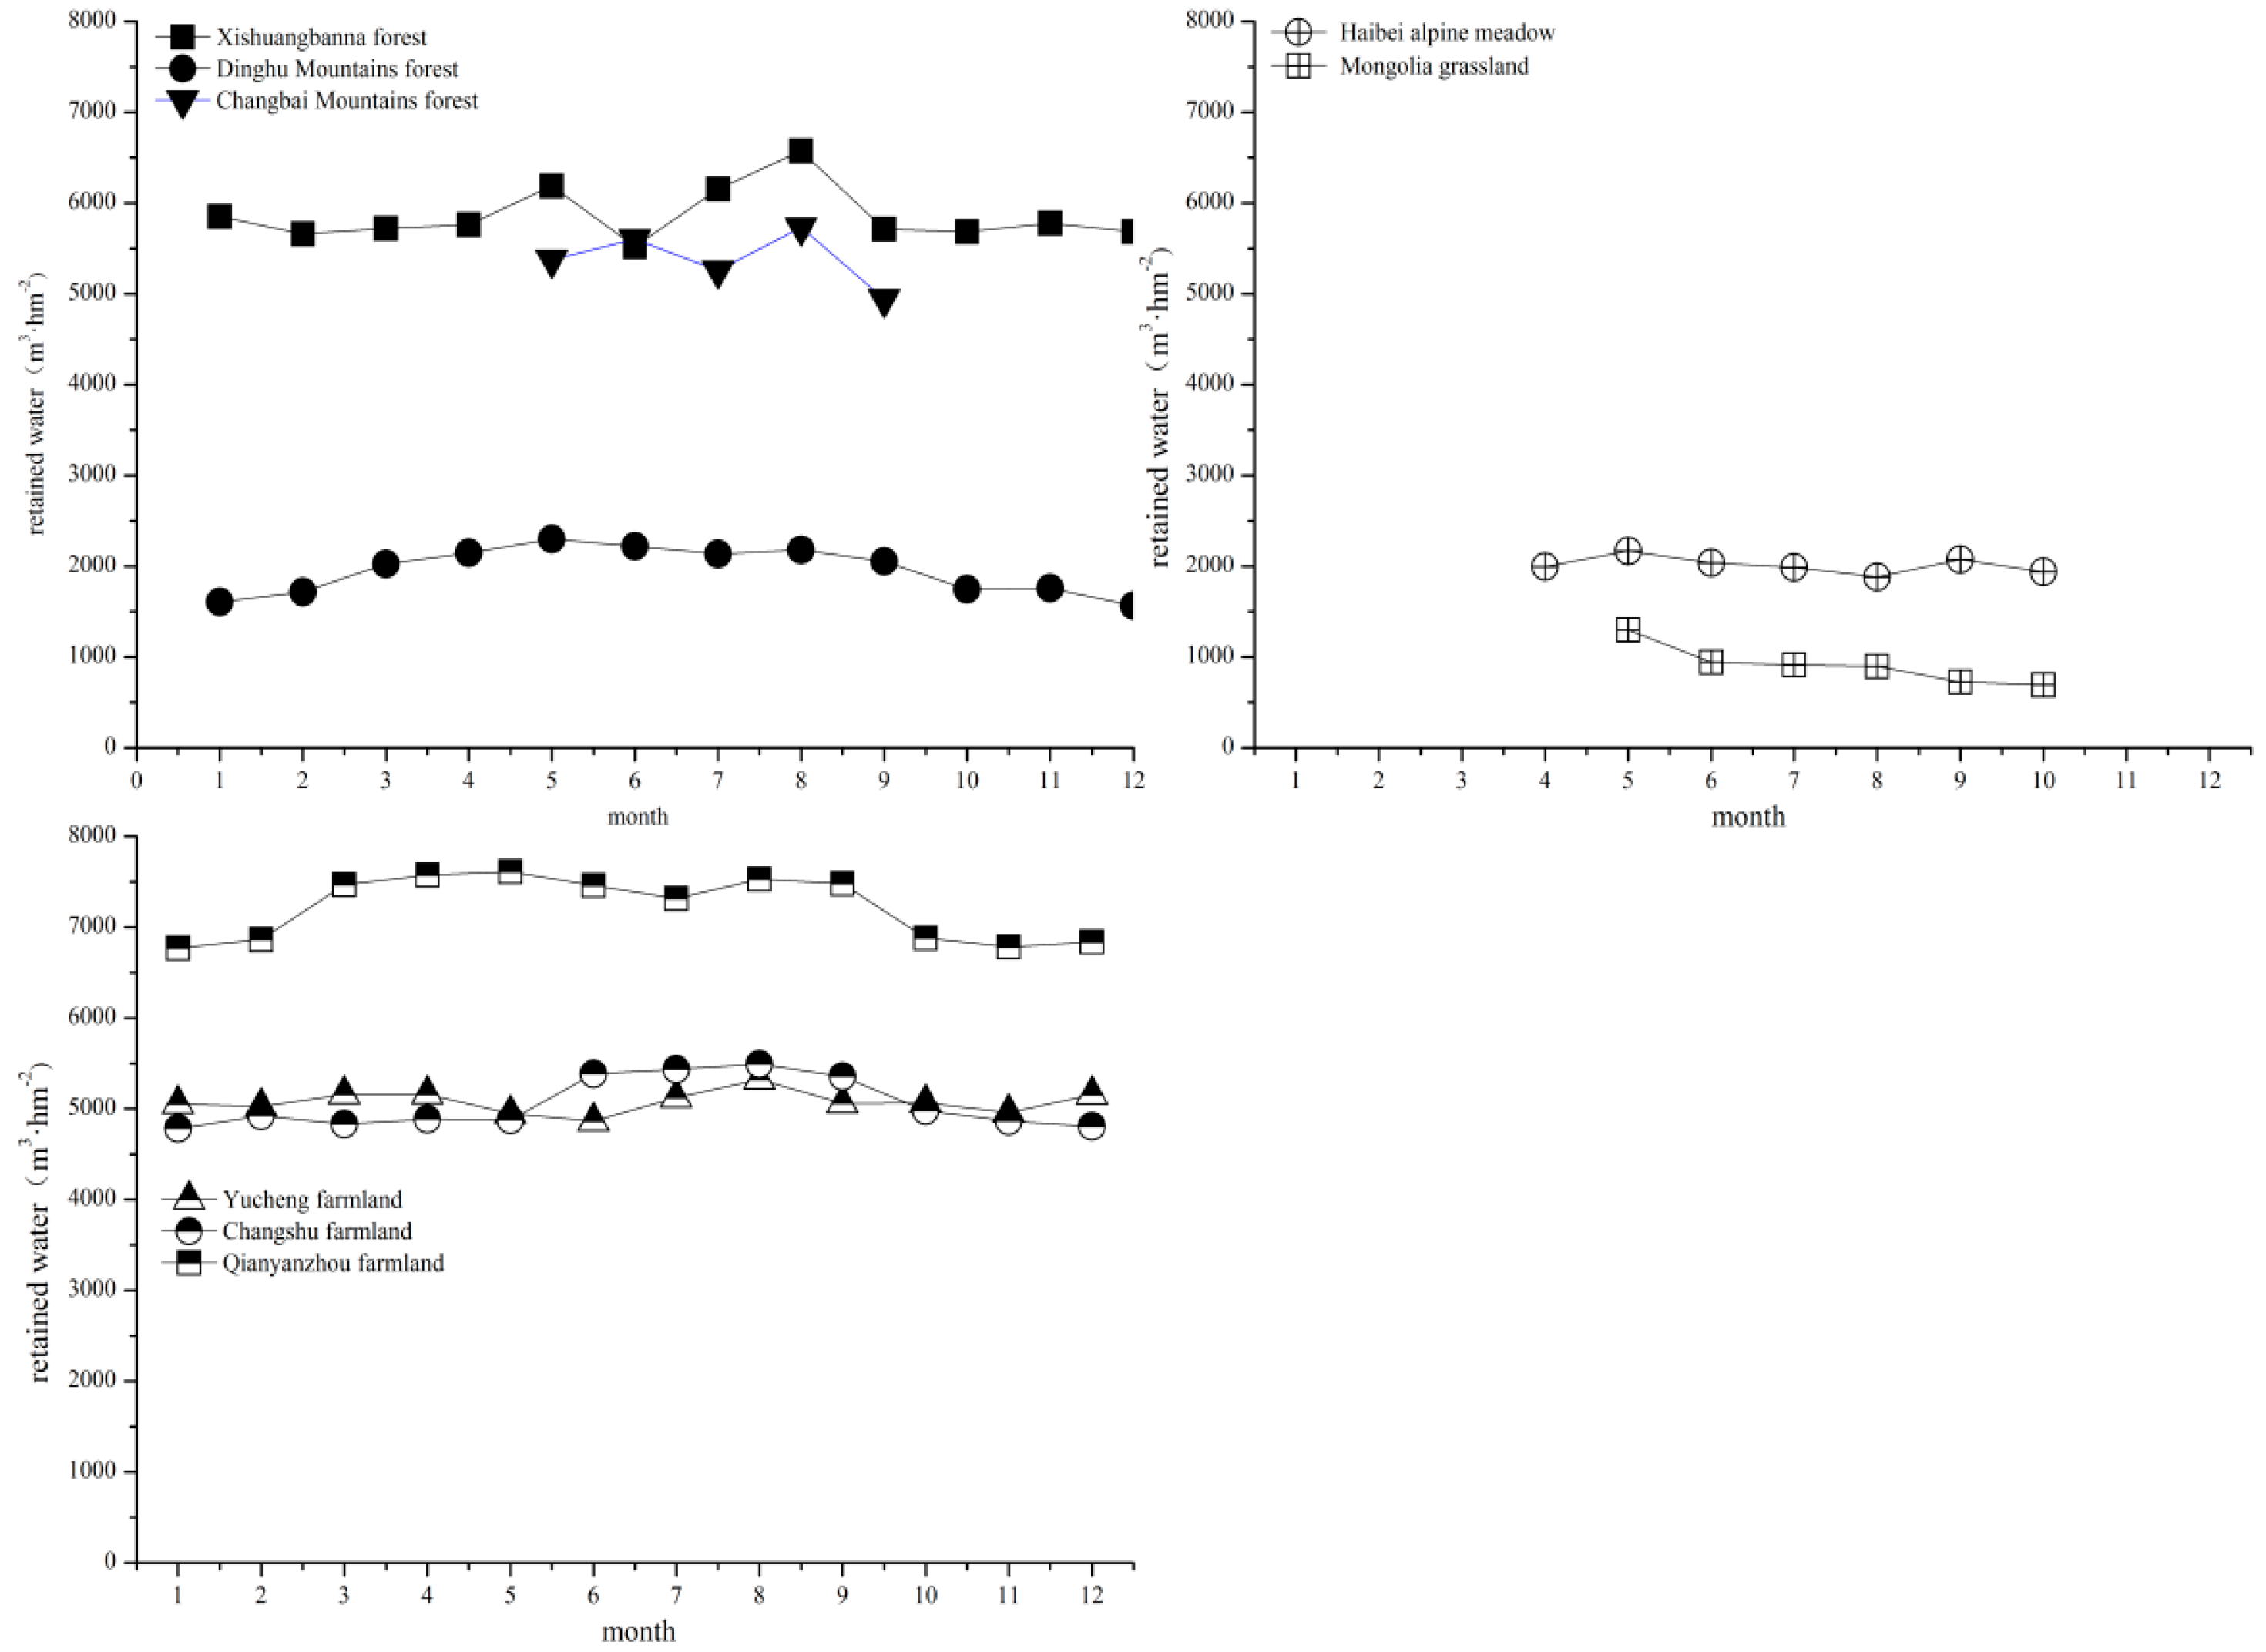
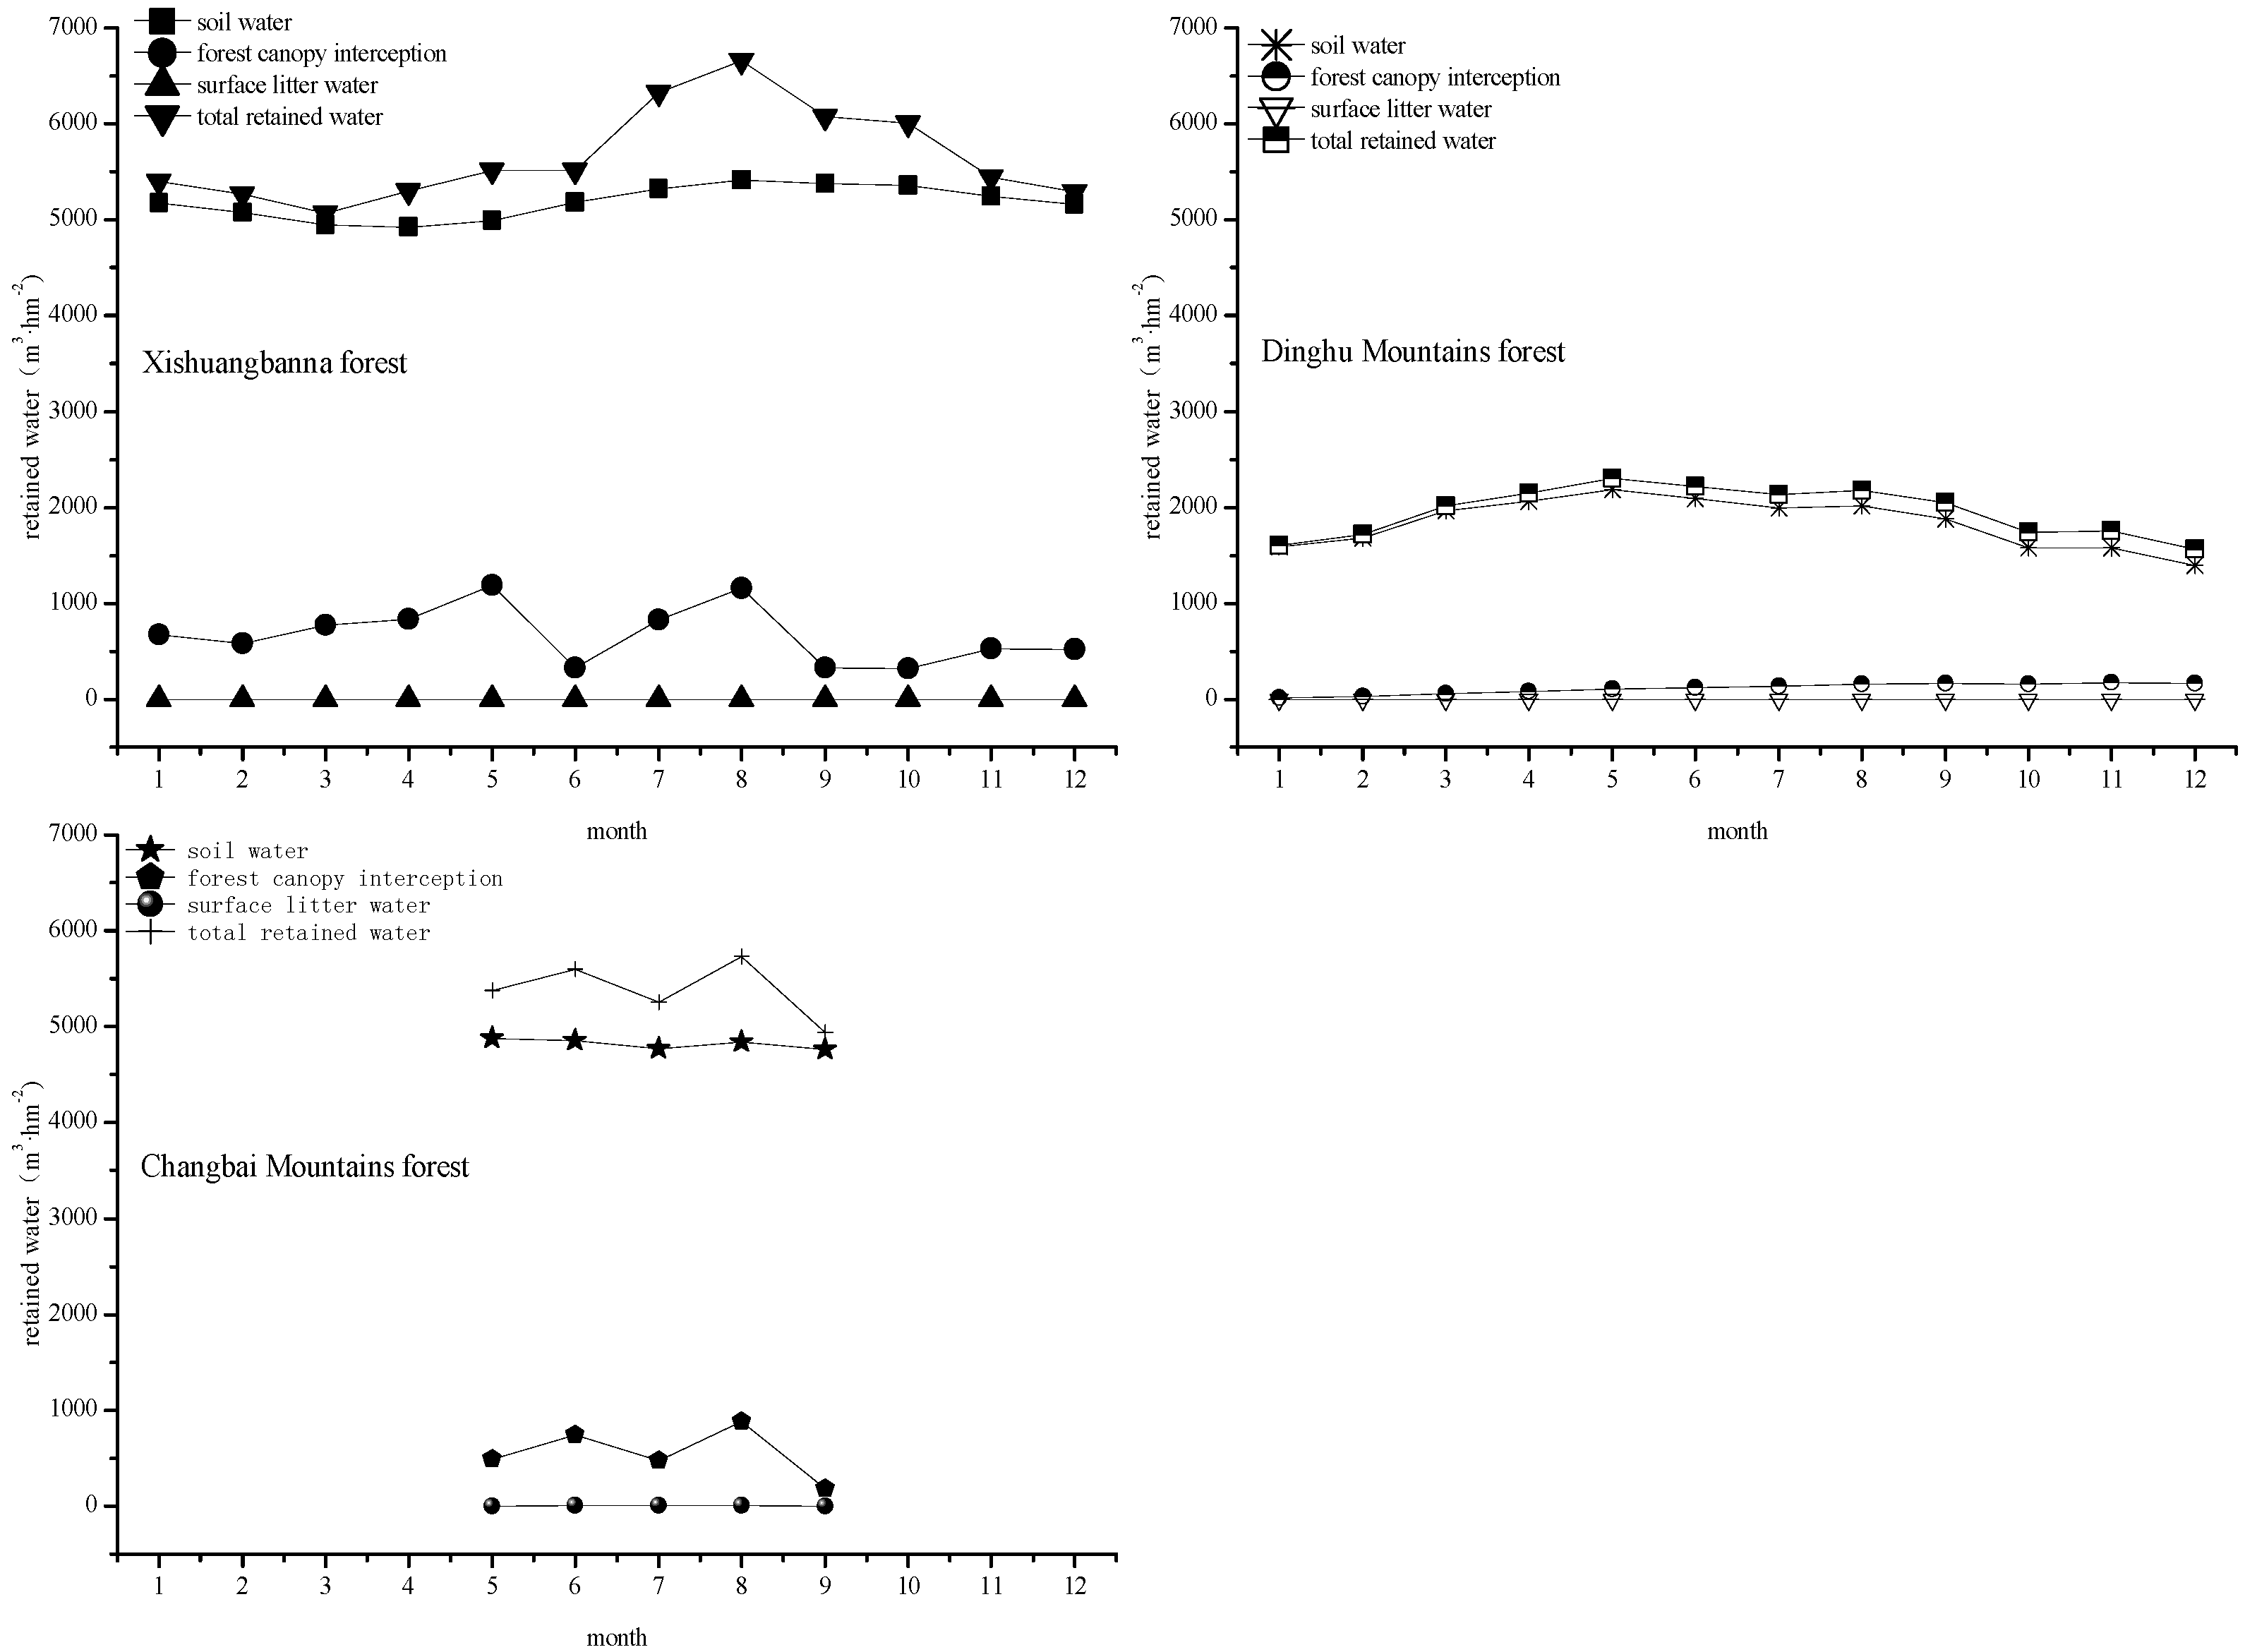
3.1. Water Retained by Ecosystems

Different precipitation and the condition of the ecosystem in each season within the year together result into the dynamic change process of monthly water retained in ecosystem. The results showed that the total water retained in different ecosystems and the dynamic processes differ (Figure 2). The sequence of the studied ecosystems ranked by average monthly retained water from large to small is: Qianyanzhou subtropical early rice and late rice farmland > Xishuangbanna tropical monsoon forest > Changbai Mountains temperate broad-leaved Korean pine forest > Yucheng warm temperate winter wheat and summer maize farmland ≈ Changshu subtropical wheat and rice farmland > Dinghu Mountains subtropical monsoon evergreen broad-leaved forest ≈ Haibei alpine meadow > Mongolia temperate grassland. The three farmlands retained considerable water because of the irrigation effect. Both the grasslands retained less water than the other ecosystems. The Mongolia temperate grassland retained the least because of its location in the arid region where evaporation was much higher than precipitation. In the three forests, Xishuangbanna tropical monsoon forest in the south retained more or less water as Changbai Mountains temperate broad-leaved Korean pine forest in the north. However, Dinghu Mountains retained considerably less water, and the amount was almost the same with that of Haibei alpine meadow. The average monthly soil water of Dinghu Moutains subtropical monsoon forest in the study was close to the results from 1999–2002 obtained by Yin et al. (2003) [36], the former being 177 mm and the latter 184 mm.
Figure 2. Dynamic processes of water retained by typical forests, grasslands and farmlands within a year.
Sustainability 07 15827 g002
As showed in Figure 2, the curve of monthly water retained by Xishuangbanna tropical monsoon forest had a large peak and a small peak. The small peak was in May and the large peak was in August. The curve of Dinghu Mountains subtropical monsoon forest presented an inverse-U shape, and the largest value was in May. The monthly water retained by Changbai Mountains changed less regularly, and it increased from May to June, decreased in July, increased again in August and reached the maximal value and then decreased again in September. The monthly water retained by Haibei alpine meadow increased from April to May, decreased continually in June, July and August, increased in September and decreased in October. The largest value was in May. The monthly water retained by Mongolia temperate grassland decreased continually from May to October. The curve of monthly water retained by Yucheng warm temperate winter wheat and summer maize farmland had a small peak and a large peak. The small peak was in March and April and the big peak was in August. The monthly water retained by Changshu subtropical wheat and rice farmland from January to April changed little, and the curve presented an inverse-U shape from May to December. The largest water retained by Changshu farmland was in August. The curve of monthly water retained by Qianyanzhou subtropical early rice and later rice farmland had two peaks, and one was in May and the other was in August. We can observe three forests which retained the least water—Dinghu Mountains subtropical monsoon evergreen broad-leaved forest, Haibei alpine meadow, and Mongolia temperate grassland retained the most water in May within a year (being 2301 m3·hm−2·month−1, 2167 m3·hm−2·month−1, and 1300 m3·hm−2·month−1, respectively), and the other ecosystems retained the most water in August (Xishuangbanna forest being 6575 m3·hm−2·month−1, Changbai Mountains forest being 5731 m3·hm−2·month−1, Yucheng farmland being 5322 m3·hm−2·month−1, Changshu farmland being 5491 m3·hm−2·month−1, and Qianyanzhou farmland being 7530 m3·hm−2·month−1, respectively).
The variation of monthly water retained by ecosystems was different while all the variation coefficients were less than 25%. The sequence of the ecosystems ranked by variation coefficients of monthly retained water from large to small was Mongolia temperate grassland (23.68%) > Dinghu Mountains subtropical monsoon evergreen broad-leaved forest (13.27%) > Changbai Mountains temperate broad-leaved Korean pine forest (5.72%) > Changshu subtropical wheat and rice farmland (5.45%) > Xishuangbanna tropical monsoon forest (5.10%) > Qianyanzhou subtropical early rice and late rice farmland (4.86%) > Haibei alpine meadow (4.65%) > Yucheng temperate winter wheat and summer maize farmland (2.40%).
Water in the soil was found most in the water retained by forests, followed by water in surface litter, and water intercepted by forest canopies was the least, which could be ignored (Figure 3). Water in soil of the Xishuangbanna tropical monsoon forest accounted for 89% in the total retained water, Dinghu Mountains subtropical monsoon broad-leaved forest accounted for 94%, and the Changbai Mountains temperate broad leaved Korean pine forest, 90%. Water interception of the Xishuangbanna tropical monsoon forest canopy and Changbai Moutains temperate broad-leaved Korean pine forest canopy changed significantly with time during the year while water in the soil of the two forests changed little; therefore, the water-retaining processes of the two forests had the same shape with the processes of water interception of forest canopies. Water interception of the Dinghu Mountains subtropical monsoon broad-leaved forest changed little with time within the year compared to soil water; thus, the water retaining-process of the forest had somewhat the same shape with the soil water change process.
Figure 3. Component and dynamic changes of water retaining of typical forests.
Sustainability 07 15827 g003

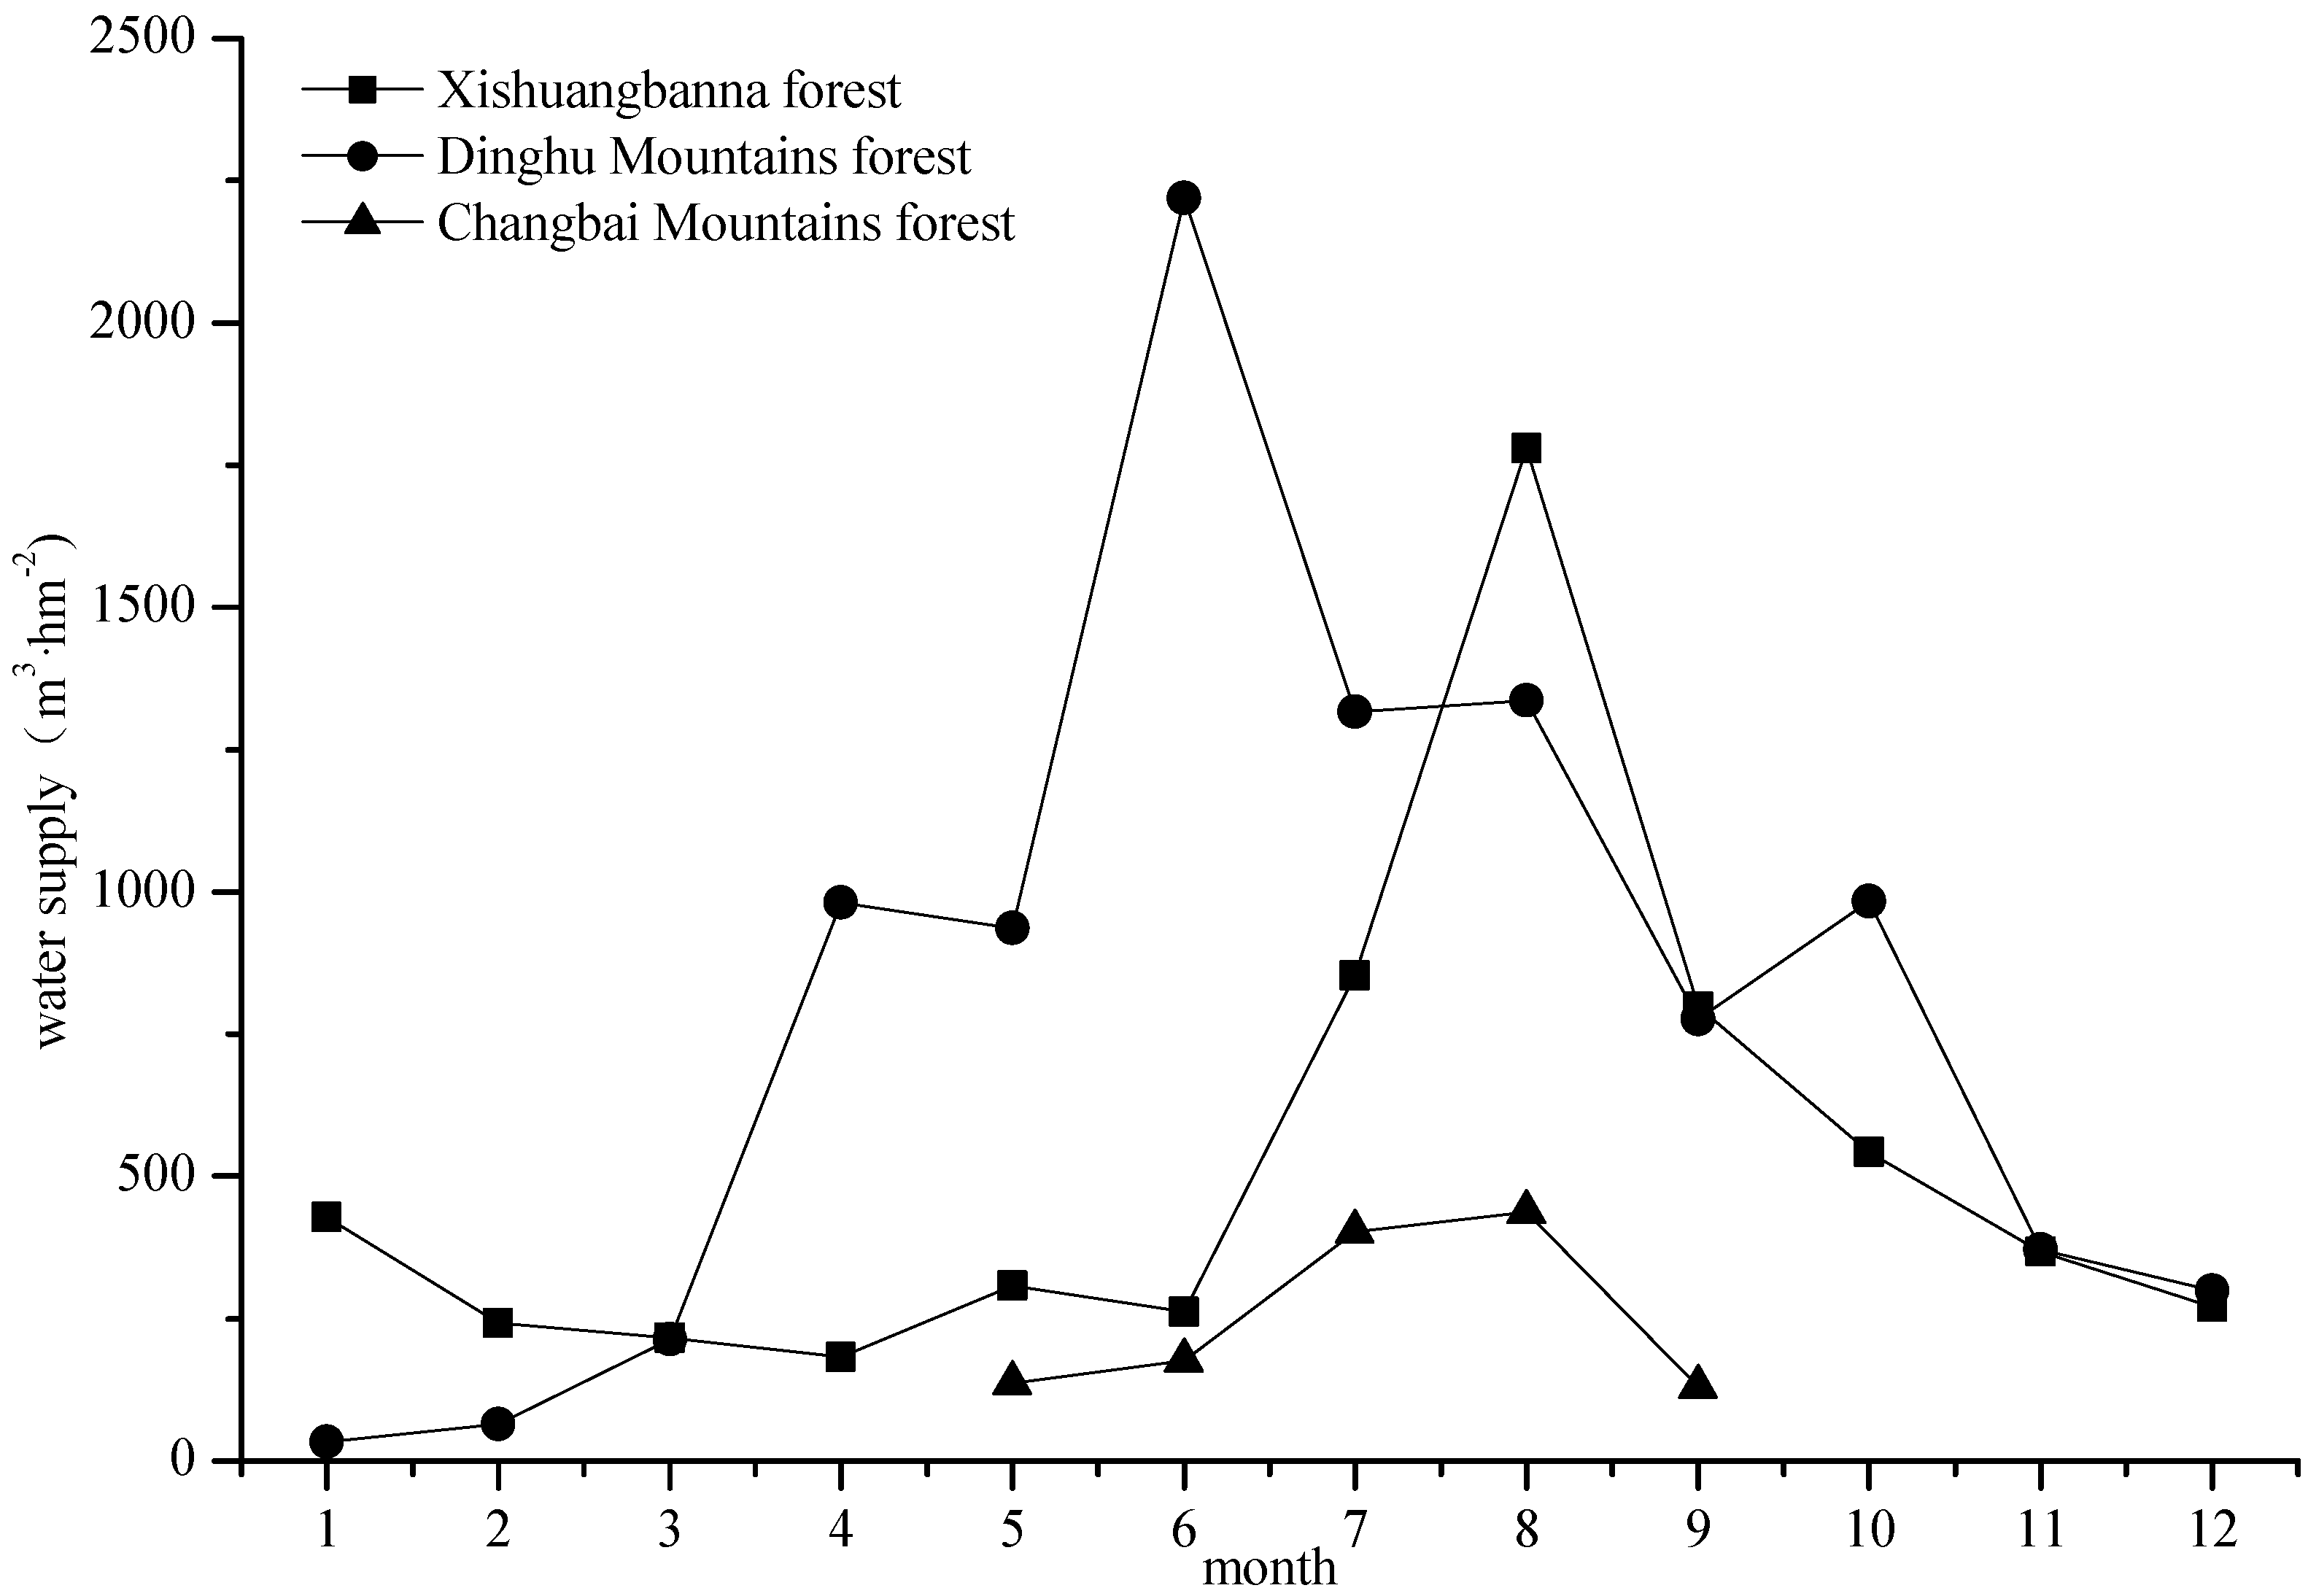
3.2. Water Supply to Humans

The annul runoffs of the Xishuangbanna tropical monsoon forest, Dinghu Mountains monsoon evergreen broad-leaved forest, and Changbai Mountains temperate broad-leaved Korean pine forest were different and the dynamic change processes of monthly runoffs presented different characteristics. The annual water supply of the Xishuangbanna tropical forest was 6250 m3·hm2, and that of Dinghu Mountains subtropical monsoon forest was 9530 m3·hm2. According to the record data, the total water supply of Changbai Mountains forest from May to September was 1283 m3·hm2. The surface runoff of Changbai Mountains forest in the non-growing seasons was small; thus, the total runoff was mostly referred to underground runoff in that period. Supposing that the runoff underground changed little with these months [37], the annual water supply of Changbai Mountains forest was 2192 m3·hm2. Thus, it seemed that Dinghu Mountains forest had the largest water supply capacity, followed by Xishuangbanna forest and Changbai Moutains forest. Precipitation was one of the factors influencing ecosystem runoff. Precipitation of the Dinghu Mountains subtropical monsoon evergreen forest was the largest, next was Xishuangbanna tropical monsoon forest and Changbai Mountain temperate broad-leaved Korean pine forest was the smallest, which accounted for 40% of that of Dinghu Mountains forest.
The monthly water supply of the three forests changed regularly within a year. Since the runoff of Changbai Mountains temperate broad-leaved Korean pine forest from October to April in the next year was primarly from underground runoff and it was stable, the monthly water supply of Changbai Mountains forest was seen as stable in that period and it was smaller than the monthly water supply in growing seasons. Thus, the curves of the monthly water supply of the three forests presented one-peak shape (Figure 4) and the peak showed in summer. The biggest monthly water supply of Dinghu Mountain forest was earlier and it was in June while that of Xishuangbanna forest and Changbai Mountains forest was in August. In that year, the monthly water supply of Changbai forest was consistently smaller than that of Xishuangbanna forest and Dinghu Mountains forest. The curves of monthly water supply of Xishuangbanna forest and Dinghu Mountains forest collaborated. The water supply of Xishuangbanna forest was larger than Dinghu Mountains forest from January to March, and Dinghu Mountains forest exceeded Xishuangbana forest from April to July, however, Xishuangbanna forest equaled or exceeded Dinghu Mountains forest again from August to December (see Figure 4).
Figure 4. Dynamic changes of water supply to human of the three forests within a year.
Sustainability 07 15827 g004
The variation of monthly water supply of the three forests was rather large. The variation coefficient of monthly water supply of Xishuangbanna forest and Dinghu Mountains forest within a year was both more than 80%, and that of Changbai forest from May to September was 59%. All the three forests supplied the most water in summer, more than 50% in the annual water supply (Table 2). Xishuangbanna forest supplied the least water in spring, Dinghu Mountains forest supplied the least in autumn, and Changbai Mountains forest somewhat equally supplied water in spring, autumn, and winter.
Table 2. Seasonal water supply of the three forests.
Seasons XishuangbannaDinghu MoutainsChangbai Mountains
Runoff (m3·hm−2)Percent (%)Runoff (m3·hm−2)Percent (%)Runoff (m3·hm−2)Percent (%)
Spring (March-May)70611.30213122.3639618.08
Summer (June–August)289446.31487251.12101646.38
Autumn (September–November)170827.33213022.3538917.77
Winter (December–February)94115.063974.1738917.77

3.3. Water Conservation and Its Value

3.3.1. Water Conservation

The period from November to March in the following year in Haibei alpine meadow is the frozen soil period, and the water soil changed little in this period [38]. Here, the monthly soil water in the frozen period was assigned the average of the value before frozen and the value before melting. The soil water of Mongolia temperate grassland in soil frozen period also changed little until the next melting period came [39]. Here, the monthly soil water of Mongolia grassland from November to April to the next year was assigned the value of October. The soil water in winter and autumn (October to March in the next year) remained rather stable [40]. Here, the monthly soil water of the Changbai Mountains forest from October to April in the next year was assigned the value of September. Accordingly, we estimated the annual soil water of the above three ecosystems. The water conserved by forests included water retained in forest and water supplied to humankind whilst the water conserved by grasslands and farmlands mainly referred to water retained in grasslands and farmlands. The research results showed that the annual water conserved by the Xishuangbanna tropical monsoon forest was the largest (12,108 m3·hm−2), followed by the Dinghu Mountains subtropical monsoon evergreen broad-leaved forest (11,484 m3·hm−2), the Changbai Moutain temperate broad-leaved Korean pine forest (7318 m3·hm−2), Qianyanzhou early rice and later rice farmland (7214 m3·hm−2), Yucheng winter wheat and summer maize farmland (5075 m3·hm−2), Changshu wheat and rice farmland (5052 m3·hm−2), Haibei alpine meadow (1980 m3·hm−2), and Mongolia temperate grassland (803 m3·hm−2). In the three forests, the retained water and water supply of Xishuangbanna forest was somewhat consistent, both accounting for about 50%. The water supply of Dinghu Mountains forest was the primary part in water conservation, accounting for 82.98%. However, the retained water of Changbai Mountains forest was the primary part, accounting for 70.05%.

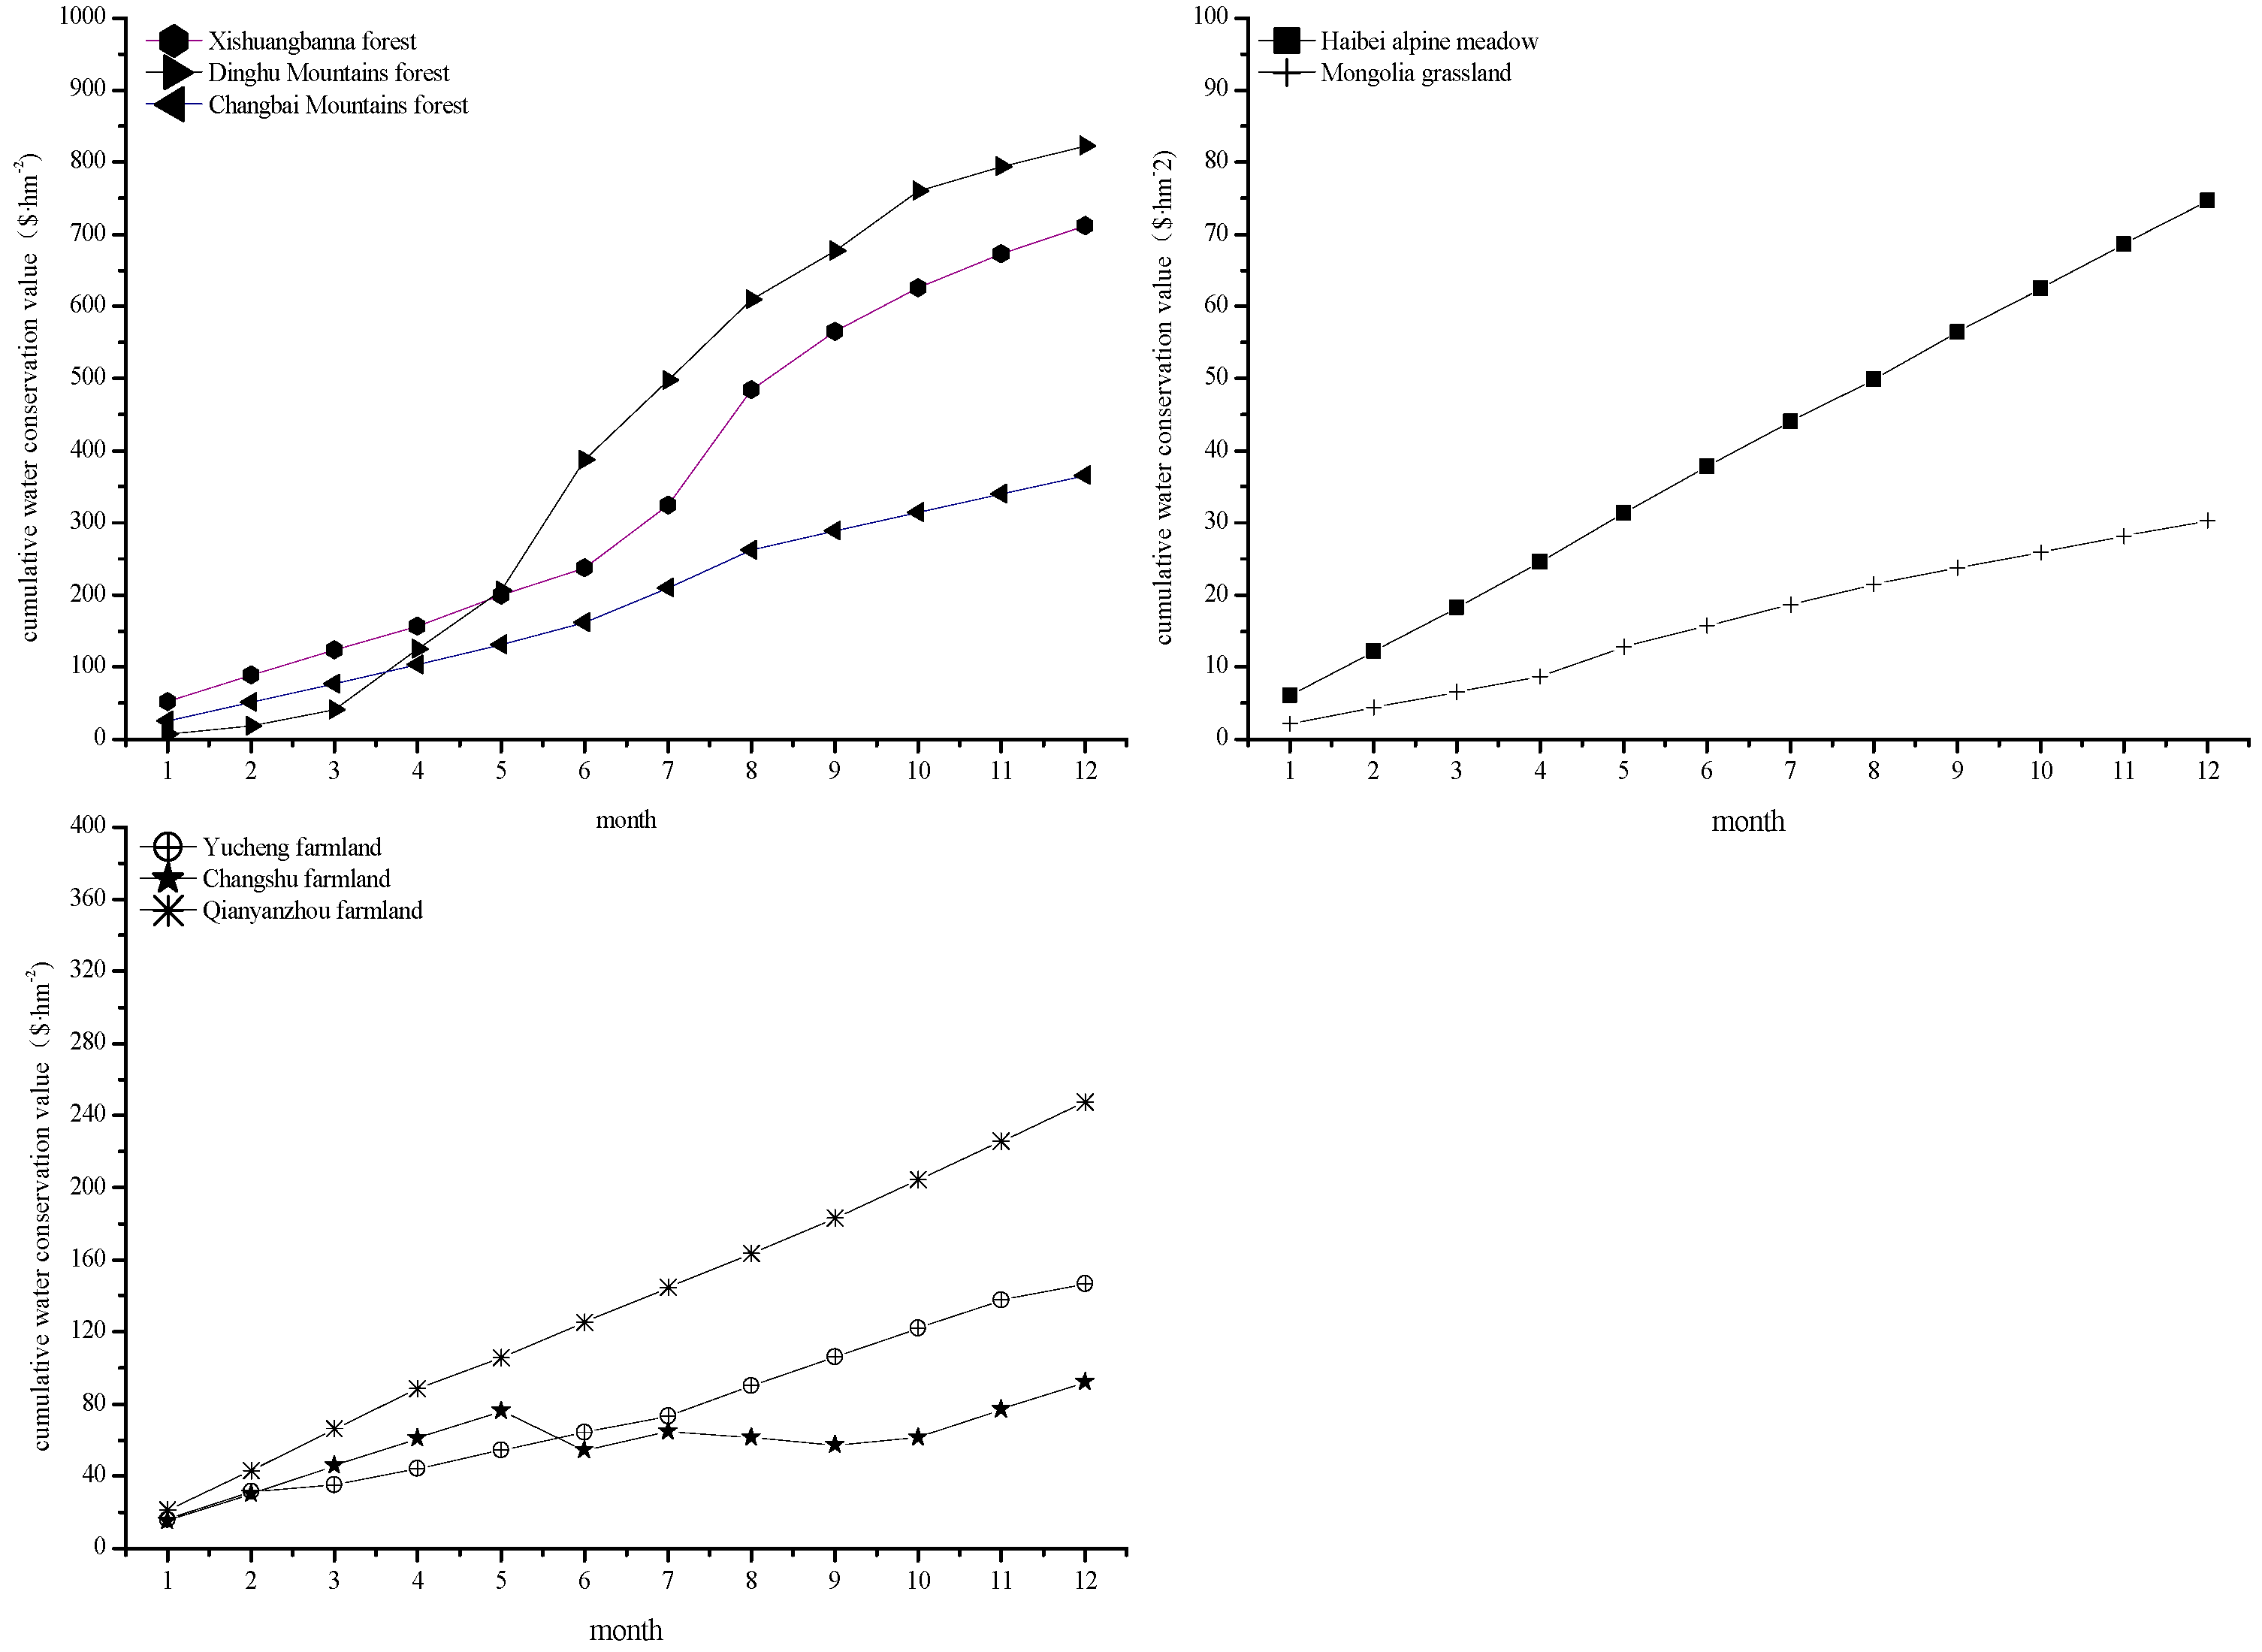
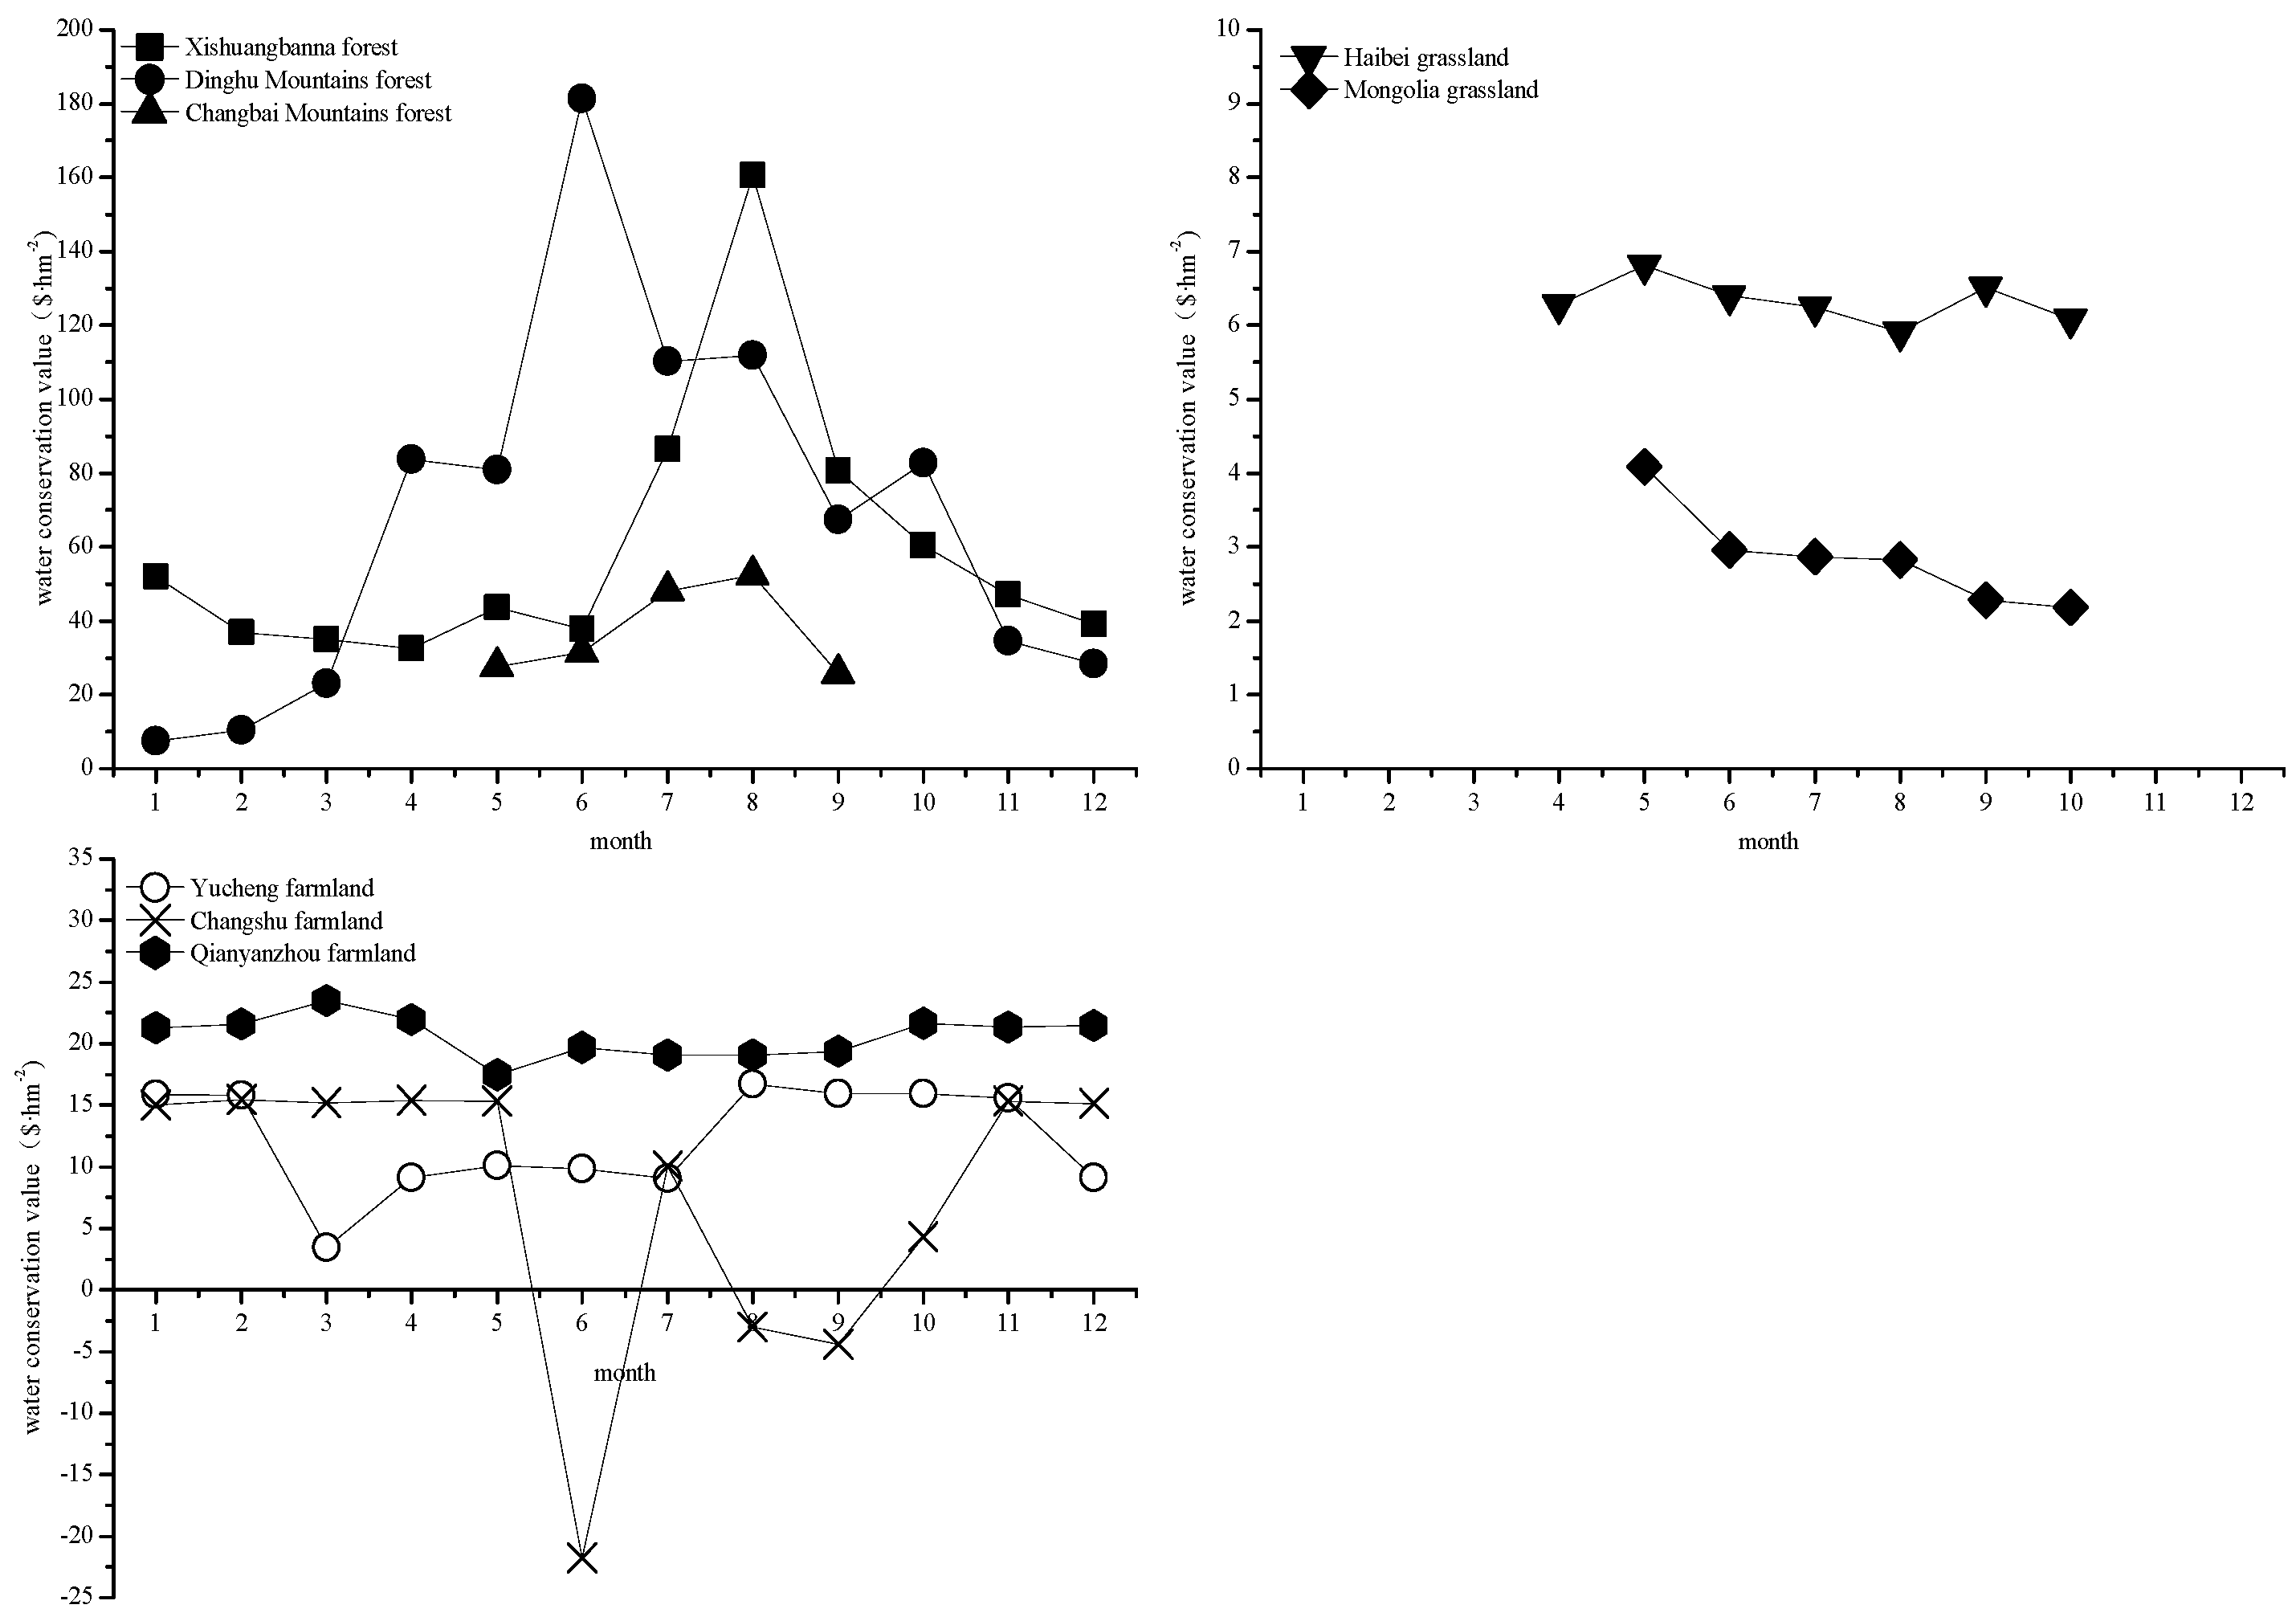
3.3.2. Water Conservation Value

Water conservation value of forests consists of water retaining value and water supply value, while water conservation value of grasslands and farmlands was mainly the water retaining value. The sequence of the ecosystems ranked according to annual water conservation value which had slight differences from that according to physical water amount conserved by ecosystems. It was Dinghu Moutains subtropical monsoon evergreen broad-leaved forest ($823·m−3) > Xishuangbanan tropical monsoon forest ($712·m−3) > Changbai Moutains temperate broad-leaved Korean pine forest ($366·m−3) > Qianyanzhou early rice and late rice farmland ($247·m−3) > Yucheng winter wheat and summer maize farmland ($147·m−3) > Changshu wheat and rice farmland ($92·m−3) > Haibei alpine meadow ($75·m−3) > Mongolia temperate grassland ($30·m−3). In the three forests, water supply value was the primary part in Xishuangbanna forest and Dinghu Mountains forest, accounting for 69.97% and 91.04%, respectively. However, water retaining value and water supply value of Changbai Mountains forest were almost the same. Compared to the physical conserved water with economic water conservation value, it was found that although water conserved by Xishuangbanna forest was larger than that of Dinghu Mountains forest, the water conservation value of Xishuangbanna forest was smaller. The water supply value was the primary part in Xishuangbanna forest and Dinghu Mountains forest, although the percents of physical retained water and water supply differed considerably in the two forests.
Water conservation value curves of the three forests presented the same shapes with the curves of water supply because of small changes in retained water throughout the year. Water conservation value curves of the two grasslands presented the same shapes with the curves of retained water curves because the water conserved by the grasslands mainly contained soil. However, water conservation value curves of the three farmlands presented different shapes with the curves of retained water curves although the water conserved by the farmlands also primarily contained in soil, because of the deduction of irrigation cost of farmlands. As showed in Figure 5, each curve of water conservation value of the three forests had one peak and the peak of Dinghu Mountains forest was displayed in June and that of Xishuangbanna forest and Changbaishan forest in August. The peak value of Dinghu Mountains forest was largest (being $181·hm−2·month−1). Water conservation value of Haibei alpine medow changed slowly while that of Mongolia decreased continually from May to October (from $4·hm−2·month−1 to $2·hm−2·month−1). The curve of water conservation value of Qianyanzhou farmland was rather gentle, and the curve of water conservation value of Changshu farmland had two peaks. The monthly water conservation value of Yucheng farmland reached a valley in March, and then it increased gradually until August, and it was gentle from August to November, and then it decreased in December. The changes of water conservation value of farmlands were related to irrigation times and amounts. The irrigation of Yucheng farmland distributed from March to July, while Changshu distributed from June to Ocotober, and Qianyanzhou distributed from April to September. The total irrigation of Changshu farmland was the largest, as high as 10,450 m3·hm−2, which was 2.2 times as that of Yucheng farmland and three times as much as that of Qianyanzhou farmland.
Figure 5. Dynamic changes of water conservation value of typical forests, grasslands and farmlands within a year.
Sustainability 07 15827 g005
The variation of water conservation value of different ecosystems differed. The variation coefficient of Haibei alpine meadow was the smallest, being 3.98%, followed in order by Qianyanzhou farmland, Mongolia grassland, Changbai Mountains forest, Yucheng farmland, Xishuangbanna forest, Dinghu Mountains forest, and Changshu farmland, respectively being 8.12%, 23.02%, 31.01%, 34.95%, 61.33%, 74.68%, and 154.51%. The water conservation value of the three forests in Spring was the most within the year. The seasonal water conservation value of the two grasslands was somewhat the same. In the farmlands, the seasonal water conservation value of Qianyanzhou farmland was somewhat consistent. Water conservation value of Yucheng farmland in winter and spring was larger than that of summer and autumn. Water conservation value of Changshu in spring and summer was rather bigger, while that of autumn was negative which influenced by the big irrigation amount and cost in autumn (Table 3).
Table 3. Seasonal water conservation value of typical forests, grasslands, and farmlands.
XishuangbannaDinghushanChangbai MoutainsHaibei
SeasonsValue ($·hm−2)Percent (%)Value ($·hm−2)Percent (%)Value ($·hm−2)Percent (%)Value ($·hm−2)Percent (%)
Spring12817.98475.667721.121824.46
Summer11115.6018822.837921.641925.18
Autumn28540.0040449.0413236.121925.18
Winter18826.4318522.477721.121925.18
MongoliaYuchengChangshuQianyanzhou
SeasonsValue ($·hm−2)Percent (%)Value ($·hm−2)Percent (%)Value ($·hm−2)Percent (%)Value ($·hm−2)Percent (%)
Spring721.774127.844650.0040926.01
Summer827.892315.524650.0040025.43
Autumn928.563624.29−15−16.3036823.37
Winter721.774732.341516.3039625.19
Annotation: spring (from March to May), summer (from June to August), autumn (from September to November), and winter (from December to February).
Except Changshu farmland, the cumulative curves of water conservation value of other ecosystems increased within the year (Figure 6). The cumulative curves of Xishuangbanna forest, Dinghu Mountains forest and Changbai Mountains forest nearly presented an “S” shape, while that of Haibei grassland, Mongolia grassland, Yucheng farmland, and Qianzhanzhou farmland were nearly linear. The cumulative water conservation value of Changshu farmland in June, August, and September decreased because of the large irrigation cost in those months (see Figure 6).
Figure 6. Cumulative water conservation value processes of typical forests, grasslands and farmlands within a year.
Sustainability 07 15827 g006

3.3.3. Relationship between Water Conservation Value and Precipitation

There existed a linear relationship between monthly water conservation value and monthly precipitation of the three forests. In the grasslands, there was no linear relationship in Haibei alpine meadow. However, there was a somewhat linear relationship in Mongolia temperate grassland. All the three farmlands had no linear relationship between the monthly water conservation value and precipitation. This phenomenon could be explained by the following reasons. The water conservation value of forests included certain water supply value which was determined by the runoff that generally had linear relationship with precipitation. Thus, the linear relationship between monthly water conservation value of forests and precipitation is readily apparent. The water conservation value of grasslands mainly referred to water retaining value which was determined by soil water that remained rather stable and had some lag effect with precipitation. Thus, the linear relationship between monthly water conservation and precipitation was not obvious. The water conservation value of farmlands referred to water retaining value and the water source included irrigation besides precipitation; thus, there was no linear relationship between monthly water conservation and precipitation. The linear regression model of SPSS 13.0 was used to obtain the linear equations between monthly water conservation value and precipitation. The results showed that the equations of Xishuangbanna forest, Dinghu Mountains forest, Changbai Mountains forest, and Mongolia grassland were expressed in Table 4.
Table 4. Linear relationship between monthly water conservation value and precipitation of some ecosystems.
EcosystemsLinear Relationship Equations
Xishuangbanna foresty = 25.30548 + 0.2702x, R2 = 0.57, p < 0.01
Dinghu Mountains forest y = 1.98645 + 0.41839x, R2 = 0.79, p < 0.01
Changbai Mountains forest y = 23.71079 + 0.1102x, R2 = 0.64, p < 0.01
Mongolia grasslandy = 2.21885 + 0.01468x, R2 = 0.50, p < 0.01
Connotations: y—monthly water conservation value ($·hm−2), x—monthly precipitation (mm).

4. Discussion

Ecosystems provide an important water conservation service which refers water regulation and water supply to human through ecosystem hydrological processes including the redistribution of rainfall by plants, litter, and soil, however there still remain controversies about the valuation of water conservation service value and the results are different from each other. This dictates a uniform criteria to compare and to manage ecosystem services.
Firstly, it attributes to the differentiation in physical water calculating methods. Currently, there are four methods to assess water conserved by ecosystems: the water balance equation method, water storing ability method, precipitation storage method, and the runoff method. The water balance equation method refers to the calculation method of water regulation and water supply based on the water balance equation and it is generally used in the region [41,42]. The water storing ability equation method refers to the calculation method of regulated water based on the ecosystem water storage, including vegetation interception, soil water, and surface litter water, and it is used regionally and locally [43]. The precipitation storage method refers to the calculation method of regulated water based on the water storage efficient of precipitation and it is mainly used in a region [44,45]. The runoff method refers to the calculation method of water supply based on runoff of an ecosystem [46], and it is utilized in a region. Actually, the accounting contents vary in different methods. Water storage and water supply are accounted in the water balance equation method. In water storing ability equation method and precipitation storage method, only the water storage was accounted. In the runoff method, only the water supply was accounted. In all the methods, the evaporation of plants is excluded in the amount of water conservation.
In the paper, we aimed to compare and analyze water conservation service based on ecosystem formation and function. CERN could provide the monitoring data we need to depict water conservation service of ecosystems locally in more depth. Therefore, we chose the comprehensive retaining water method to calculate the water regulation service and used the runoff of ecosystems to calculate the water supply service. Up to now, most of the researchers analyzed change of ecosystem service and water conservation service based on land use change and ecosystem service value per unit area [47,48,49]. There are rare researchers using the water conservation model, as in our paper, when they study the change of water conservation service by ecosystems. The water conservation model based on hydrological processes of ecosystems can be used to assess water conservation value more accurately, and we can obtain the construction of water conservation value. However, this method needs more local parameters and more complex. It is also the basis of the method of water conservation value per unit area on large spatial scale. To get the water conservation value of the whole area, we need to monitor more typical ecosystems in longer time. The results based on data from CERN reflect the real status of water conservation service of ecosystems. Although the construction of field station of ecosystem in China started in 1950s, it developed steadily in 1990s. Only the data from 2000 could be used in the comparison of several ecosystem fields, hence the data years that were chosen in our study.
The second factor is the price per unit of water. It has been accepted to use the construction cost of reservoir to calculate water regulation service value [41,42,43,44] and use water resource fee to calculate water supply service value [43]. However, it ignored the results of water conservation service value calculated by per unit reservoir construction cost which was actually capital value rather than flow. Here, we revised this inaccuracy through discounting the reservoir construction cost by the present bank deposit interest of China. In the study by Grygoruk et al., the cost of reservoir construction and maintenance was also used to assess the unit monetary value of water storage [31]. The depreciation rate per annum was used to obtain the annual price of water storage service, which was similar to our study.
In our study, we found that there existed a linear relationship between monthly water conservation value and monthly precipitation of the three forests. The results were similar with the founding by Li et al., who analyzed the linear relationship between monthly water regulation value and monthly precipitation and the linear relationship between monthly water supply value and monthly precipitation of four other kinds of forests in China [50]. This indicates that precipitation is a major influencing factor of water conservation value of forests. The kind of forest type is also another influencing factor of water conservation value of forests in the same area. In our study [51], we found that the water conservation value of tropical seasonal rain forest was 66% higher than that of tropical secondary forest in Xishuangbanna in China where the precipitation of the field sample of two kinds of forests was the name.
We think there are at least two purposes of our study. One is to obtain the water conservation value of ecosystems more accurately. The accounting method of water conservation value in the paper is more scientific, which reflects the flow concept of ecosystem service. Moreover, the data and parameters we used in the study were locally monitored. We can monitor more places and more times to get the spatial and temporal feature of water conservation of typical ecosystems. Based on this, we should build the database of water conservation service ecosystems to get the value of water conservation per unit area of typical ecosystems with all ages. The second one is to make better integrated water resources management. Many countries have begun to mainstreaming the ecosystem services concept in policy-making. The use of economic valuation method of ecosystem services is necessary to avoid frustration of involved stakeholders. The regional hydrological ecosystem services for integrated water resources management have caught researchers’ attention in China [8]. The water conservation service change induced by land-use change has serious impact on the amount and quality of water in lake and river. Thus, we should make protecting policies integrating both land and water area. To get this goal, we need to master the relationship between land-use change and water conservation service change. It requires us to know the water conserved and its value of per area of ecosystem service with all ages, and some results of typical ecosystems in China can be obtained in our study. The flow and dynamics of ecosystem services is being and will being a hot topic in research.
The world’s governments are calling for biodiversity and ecosystem-service monitoring to guide and evaluate international conservation policy as well as to incorporate natural capital into their national account [52]. Our study results help the monitoring water conservation and its value change of typical ecosystems in China and the assessment of ecosystem capital. Until now, there are scarce studies concerning this except the studies by Li et al., and Pei et al. [23,24]. We should make more effects on building ecosystem field stations and on monitoring the change of biodiversity and ecosystem services. Except for water conservation by ecosystems, we should monitor and analyze the change of ecosystem services based on CERN. Moreover, we also should pay more attention on the public people’s attitude, request and behaviors on ecology protection to make better assessment of ecosystem services and to make more efficient protective legislation and measures.

5. Conclusions

The study analyzed the dynamic changes of water conservation and its value of some typical forests, grasslands, and farmlands in China within a year based on the data set of CERN. Results showed that all forests, grasslands and farmlands supply important water conservation service to human. In general, the water conservation service and value of forests is the largest (Xishuangbanna forest being $712·hm−2·year−1, Dinghu Mountains forest being $823·hm−2·year−1, and Changbai Mountains forest being $366·hm−2·year−1), and then is the farmlands (Yucheng farmland being $147·hm−2·year−1, Changshu farmland being $92·hm−2·year−1, Qianyanzhou farmland being $247 hm−2·year−1), and that of the grasslands is the least (Haibei alpine meadow being $75·hm−2·year−1, Mongolia grassland being $30·hm−2·year−1). Although the water conservation value of grassland is smaller by comparison, the grassland usually locates in arid area where water is scarcer and more precious. Thus, we should put more efforts to protect grasslands in arid areas to store water locally.
Results showed that forest, grassland, and farmland provide different kinds of water conservation service which vary in strength and dynamic processes. Different kinds of forests/grasslands/farmlands showed different water conservation service patterns. Forests undertake water storage and water supply function for human, while grasslands and farmlands mainly undertake water storage function. In the three forests, the retained water and water supply of Xishuangbanna forest was somewhat consistent, both accounting for about 50%. The water supply of Dinghu Mountains forest was the primary part in water conservation, accounting for 82.98%. However, the retained water of Changbai Mountains forest was primary part, accounting for 70.05%.
Water conservation and its value curves of forests presented the same shapes with the curves of water supply, while water conservation curves of grasslands and farmlands presented the same shapes with the curves of water retain. Water conservation value curves of grasslands presented the same shapes with the curves of retained water. However, water conservation value curves of farmlands presented different shapes with the curves of retained water curves although the water conserved by the farmlands also primarily contained in soil, because of the deduction of irrigation cost of farmlands. As far as the water conserved, the variation coefficients of monthly water retained by grasslands and farmlands throught the year were less than 25%, while the variation of monthly water conserved by forests was rather large. As far as water conservation value concerned, the variation of forests, grasslands and farmlands crossed. The coefficient of Changshu farmland was the biggest, being 154.51%; while the coefficient of Haibei alpine meadow was the smallest, and being 3.98%. The coefficient of Qianyanzhou farmland, Mongolia grassland, Changbai Mountains forest, Yucheng farmland, Xishuangbanna forest and Dinghu Mountains forest respectively being 8.12%, 23.02%, 31.01%, 34.95%, 61.33%, and 74.68%.
Ecosystems are assets which supply ecosystem service flows to humans. In the assessment of ecosystem service economic value through the substitutional engineering cost method, we should choose the cost flow as the unit monetary value of ecosystem service. Combining our study and one other study [31], we suggest the utilization of annual cost of reservoir construction and maintenance rather than the total cost in the assessment of water storage service by forests.

Acknowledgments

This work was funded under National Natural Science Foundation of China (No. 31070384) and National Program on Key Basic Research Project (973 Program) (No. 2009CB421106). We are also very thankful for the Chinese Ecosystem Research Net (CERN) for providing the data used in this paper.

Author Contributions

Conceived and designed the paper: Gaodi Xie, Chunlan Liu. Collected, analyzed data, wrote the paper: Sha Pei. Improved language: Changshun Zhang. Partial data collection and processing: Shimei Li. Partial data collection and language check: Long Chen.

Conflicts of Interest

The authors declare no conflict of interest.

References

  1. Brauman, K.A.; Daily, G.C.; Duarte, T.K.; Mooney, H.A. The nature and value of ecosystem service: An overview highlighting hydrologic services. Ann. Rev. Environ. Resour. 2007, 32, 67–98. [Google Scholar] [CrossRef]
  2. De Groot, R.S.; Wilson, M.A.; Boumans, R.M.J. A typology for the classification, description and valuation of ecosystem functions, goods and services. Ecol. Econ. 2002, 41, 393–408. [Google Scholar] [CrossRef]
  3. Cheng, G.W.; Shi, P.L. Benefits of forest water conservation and its economic value evaluation in upper reaches of yangtse river. Sci. Soil Water Conser. 2004, 2, 17–20. [Google Scholar]
  4. Costanza, R.; d’Arge, R.; de Groot, R.; Farber, S.; Grasso, M.; Hannon, B.; Limburg, K.; Naeem, S.; O’Nell, R.O.; Paruelo, J.; et al. The value of the world’s ecosystem services and natural capital. Nature 1997, 387, 253–260. [Google Scholar] [CrossRef]
  5. Ingraham, M.W.; Foster, S.G. The value of ecosystem services provided by the u.S. National wildlife refuge system in the contiguous U.S. Ecol. Econ. 2008, 67, 608–618. [Google Scholar] [CrossRef]
  6. Guo, Z.W.; Li, Y.M.; Xiao, X.M.; Zhang, L.; Gan, Y.L. Hydroelectricity production and forest conservation in watersheds. Ecol. Appl. 2007, 17, 1557–1562. [Google Scholar] [CrossRef] [PubMed]
  7. Schleyer, C.; Christoph, G.; Hauck, J.; Winkler, K.J. Opportunities and challenges for mainstreaming the ecosystem services concept in the multi-level policy-making within the eu. Ecosyst. Serv. 2015, 10, 1–8. [Google Scholar] [CrossRef]
  8. Jin, G.; Wang, P.; Zhao, T.; Bai, Y.P.; Zhao, C.H.; Chen, D.D. Reviews on land use change induced effects on regional hydrological ecosystem services for integrated water resources management. Phys. Chem. Earth 2015, 89–90, 33–39. [Google Scholar] [CrossRef]
  9. Hohenthal, J.; Owidi, E.; Minoia, P.; Pellikka, P. Local assessment of changes in water-related ecosystem services and their management: Dpaser conceptual model and its application in Taita hills, Kenya. Int. J. Biodivers. Sci. Ecosyst. Serv. Manag. 2015, 11, 225–238. [Google Scholar] [CrossRef]
  10. Xie, G.D.; Zhen, L.; Lu, C.X.; Xiao, Y.; Li, W.H. Applying value transfer method for eco-service valuation in China. J. Resour. Ecol. 2010, 1, 51–59. [Google Scholar]
  11. Xie, G.D.; Lu, C.X.; Leng, Y.F.; Zheng, D.; Li, S.C. Ecological assets valuation of the Tibetan plateau. J. Nat. Resour. 2003, 18, 189–196. [Google Scholar]
  12. Xie, G.D.; Zhen, L.; Lu, C.X.; Xiao, Y.; Chen, C. Expert knowledge based valutaion method of ecosystem services in China. J. Nat. Resour. 2008, 23, 911–919. [Google Scholar]
  13. Xie, G.D.; Zhang, C.X.; Zhang, L.M.; Chen, W.H.; Li, S.M. Improvement of the evaluation method for ecosystem services value based on per unit area. J. Nat. Resour. 2015, 30, 1243–1254. [Google Scholar]
  14. Chan, K.M.; Shaw, M.R.; Cameron, D.R.; Underwood, E.C.; Daily, G.C. Conservation planning for ecosystem services. PLoS Biol. 2006, 2138–2152. [Google Scholar] [CrossRef] [PubMed]
  15. Palomo, I.; Martín-López, B.; Zorrilla-Miras, P.; Del Amo, D.G.; Montes, C. Deliberative mapping of ecosystem services within and around doñana national park (SW Spain) in relation to land use change. Environ. Chang. 2014, 14, 237–251. [Google Scholar] [CrossRef]
  16. Estoque, R.C.; Murayama, Y. Landscape pattern and ecosystem service value changes: Implications for environmental sustainability planning for the rapidly urbanizing summer capital of the Philippines. Urban Plan. 2013, 116, 60–72. [Google Scholar] [CrossRef]
  17. Zhang, P.; He, L.; Fan, X.; Huo, P.S.; Liu, Y.H.; Zhang, T.; Pan, Y.; Yu, Z.R. Ecosystem service value assessment and contribution factoranalysis of land use change in Miyun county, China. Sustainability 2015, 7, 7333–7356. [Google Scholar] [CrossRef]
  18. Creedy, J.; Wurzbacher, A.D. The economic value of a forested catchment with timber, water and carbon sequestration benefits. Ecol. Econ. 2001, 38, 71–83. [Google Scholar] [CrossRef]
  19. Brainard, J.; Bateman, J.J.; Lovett, A.A. The social value of carbon sequestered in Great Britain’s woodlands. Ecol. Econ. 2009, 68, 1257–1267. [Google Scholar] [CrossRef]
  20. Maraseni, T.K.; Cockfield, G. Crops, cows or timber? Including carbon values in land use choices. Agric. Ecosyst. Environ. 2011, 140, 280–288. [Google Scholar] [CrossRef]
  21. Ramlal, E.Y.; Yemshanov, D.; Fox, C.; McKenney, D. A bioeconomic model of afforestation in Southern Ontario: Integration of fiber, carbon and municipal biosolids values. J. Environ. Manag. 2009, 90, 1833–1843. [Google Scholar] [CrossRef] [PubMed]
  22. Bunker, D.E.; DeClerck, F.; Bradford, J.C.; Colwell, R.K.; Perfecto, I.; Phillips, O.L. Species loss and aboveground carbon storage in a tropical forest. Science 2005, 310, 1029–1031. [Google Scholar] [CrossRef] [PubMed]
  23. Li, S.M.; Xie, G.D.; Zhang, C.X.; Ge, L.Q. Flow processes of forest ecosystem services: A case study on Qianyanzhou plantation, Jiangxi province. Resour. Sci. 2010, 32, 831–837. [Google Scholar]
  24. Pei, S.; Xie, G.D.; Chen, L. The process of carbon fixation value of typical ecosystems. J. Resour. Ecol. 2011, 2, 307–314. [Google Scholar]
  25. Li, W.H.; Zhang, B.; Xie, G.D. Research on ecosystem services in China: Progress and perspectives. J. Nat. Resour. 2009, 24, 1–10. [Google Scholar]
  26. Chen, Y.Y. Location Research of Ecosystems; Science Press: Beijing, China, 2009. [Google Scholar]
  27. Sun, H.L.; Yu, G.R.; Ouyang, Z. Data Set of Ecosystem Station Monitoring and Research in China; China Agriculture Press: Beijing, China, 2011. [Google Scholar]
  28. Zhang, P.; Wang, X.; Wang, Y.J.; Liu, W.J.; Liu, Y.H. Comparison research on hydrological effect of the canopy of the tropical seasonal rainforest and rubber forest in Xishuangbanna, Yunnan. Acta Ecol. Sin. 2003, 23, 2653–2665. [Google Scholar]
  29. Bai, J.H.; Hu, Z.H.; Guo, J.P. Study on the hydrological effect of typical forest litters and soil of natural second forest in north China mountainous region. J. Soil Water Conserv. 2009, 23, 84–89. [Google Scholar]
  30. Huang, Z.L.; Kong, G.H.; Yu, Q.F.; Zhang, Z.H. Hydrological function and nutrient dynamics in lower subtropical monsoon evergreen broad-leaved forest. Acta Phytoecol. Sin. 2000, 24, 157–161. [Google Scholar]
  31. Grygoruk, M.; Mirosław-Świątek, D.; Chrzanowska, W.; Ignar, S. How much for water? Economic assessment and mapping of floodplain water storage as a catchment-scale ecosystem service of wetlands. Water 2013, 5, 1760–1779. [Google Scholar] [CrossRef]
  32. State Forestry Administration, P.R.C. Specifications for Assessment of Forest Ecosystem Services in China; Standard Publisher of China: Beijing, China, 2008; p. 12.
  33. The Ministry of Water Resources of the People’s Republic of China. Available online: http://www.mwr.gov.cn/zwzc/tzgg/qtxx/200211/t20021125_156538.html (accessed on 7 December 2015).
  34. Zhou, W.J. Report on water resource and water fee in China. China Price 2010, 3, 18–23. [Google Scholar]
  35. Yan, J.H.; Zhou, G.Y.; Zhang, D.Q. Spatial and temporal variations of some hydrological factors in a climax forest ecosystems in the Dinghushan region. Acta Ecol. Sin. 2003, 23, 2359–2366. [Google Scholar]
  36. Yin, G.C.; Zhou, G.Y.; Tang, X.L.; X., W. Soil water storage of three forest types in different succession stage in Dinghushan. J. Jishou Univ. (Nat. Sci. Ed.) 2003, 24, 62–68. [Google Scholar]
  37. Gao, R. Water balance of major forest types in east Liaoning mountainous region. Bull. Soil Water Conserv. 2002, 22, 5–8. [Google Scholar]
  38. Song, L.M.; Lou, H.P. Studies on soil moisture dynamics of natural grassland in Qinghai Lake region. Chin. J. Agrometeorol. 2006, 27, 151–155. [Google Scholar]
  39. Li, N.; Gu, W.; Du, Z.X. Soil water content observations under different soil classification in central and east Inner Mogolia of China. Adv. Earth Sci. 2006, 21, 151–156. [Google Scholar]
  40. Yang, H.; Pei, T.; Guan, D.X.; Jin, C.J.; Wang, A.Z. Soil moisture dynamics under broad-leaved Korean pine forest in Changbai mountains. Chin. J. Appl. Ecol. 2006, 17, 587–591. [Google Scholar]
  41. Zheng, S.H.; Wang, K.; Zhao, M.L.; Han, G.D.; Feng, Y.F. Primary evaluation of the indirect value on rangeland ecosystem service in northern agro-pastoral ecotone: A case study in Taipusi banner and Guyuan league. Pratacultural Sci. 2009, 26, 18–23. [Google Scholar]
  42. Wang, B.; Lu, S.W. Evaluation of economic forest ecosystem services in China. Chin. J. Appl. Ecol. 2009, 20, 417–425. [Google Scholar]
  43. Zhang, B.; Li, W.H.; Xie, G.D.; Xiao, Y. Water conservation of forest ecosystem in Beijing and its value. Ecol. Econ. 2010, 69, 1416–1426. [Google Scholar]
  44. Jiang, L.P.; Qin, Z.H.; Xie, W.; Wang, R.J.; Xu, B.; Lu, G. Estimation of grassland ecosystem services value of china remote sensing data. J. Nat. Resour. 2007, 22, 161–170. [Google Scholar]
  45. Zhao, T.Q.; Ouyang, Z.Y.; Jia, L.Q.; Zheng, H. Ecosystem services and their valuation of china grassland. Acta Ecol. Sin. 2004, 24, 1101–1110. [Google Scholar]
  46. Chisholm, R.A. Trade-offs between ecosystem services: Water and carbon in a biodiversity hotspot. Econ. Econ. 2010, 69, 1973–1987. [Google Scholar] [CrossRef]
  47. Song, W.; Deng, X.Z.; Yuan, Y.W.; Wang, Z.; Li, Z.H. Impacts of land-use change on valued ecosystem service in rapidly urbanized north China plain. Ecol. Model. 2015, 318, 245–253. [Google Scholar] [CrossRef]
  48. Zorrilla-Miras, P.; Palomo, I.; Gómez-Baggethun, E.; Martín-López, B.; Lomas, P.L.; Montes, C. Effects of land-use change on wetland ecosystem services: A case study in the Doñana Marshes (SW Spain). Landsc. Urban Plan. 2014, 122, 160–174. [Google Scholar] [CrossRef]
  49. Zeng, J.; Li, J.F.; Yao, X.W. Spatio-temporal dynamics of ecosystem service value in Wuhan urban agglomeration. Chin. J. Appl. Ecol. 2014, 25, 883–891. [Google Scholar]
  50. Li, S.M.; Xie, G.D.; Zhang, C.X.; Ge, L.Q. Flow process of water conservation service of forest ecosystem. J. Nat. Resour. 2010, 25, 585–593. [Google Scholar]
  51. Pei, S.; Xie, G.D.; Zhang, C.S.; Liu, C.L.; Chen, L. Intra-annual change of water conservation value of tropical seasonal rain forest and secondary forest. Geogr. Geo-Inf. Sci. 2015, 31, 96–100. [Google Scholar]
  52. Karp, D.S.; Tallis, H.; Sachse, R.; Halpern, B.; Thonicke, K.; Cramer, W.; Mooney, H.; Polasky, S.; Tietjen, B.; Waha, K.; et al. National indicators for observing ecosystem service change. Glob. Environ. Chang. 2015, 35, 12–21. [Google Scholar] [CrossRef]

