1. Introduction
It has become important to promote open innovation, since growing uncertainties in the world economy have seen a contraction of the technology market [
1,
2]. The R&D environment has changed accordingly; it thus requires new methods of technology analysis and related analytical tools. It is important to understand that the new R&D environment is concerned not only with marketing strategies based entirely on product development and sales, but also with the marketing of intangible R&D-based assets such as intellectual property. As patents have become important tools in creating economic profits, it is necessary to invest resources in establishing patent strategies [
1]. Many countries, such as the United States, the European Union, Japan, China, and Korea, have programs to protect intellectual property and to promote technology transfer and commercialization. Although the number of patents applied for and registered is rapidly increasing every year [
3], there is still a disproportionately low number of technology transfers. Many countries are attempting to activate technology transfers by supporting patent offices and providing credit guarantee funds, but these efforts rarely contribute towards increasing the number of technology transfers. This is because there are several problems in selecting core patents to commercialize. There are few objective indicators or systematic approaches for identifying high-quality patents. Expert opinions are usually relied upon to select patents for technology transfer. This can only be effective in expanding technology transfers if the relevant expert has deep knowledge of the related technological areas. However, it is impossible to match appropriate experts with the huge number of patents filed every year. Because of the vast amount of patent applications, it is possible that a patent representing core technology can be poorly evaluated by experts with no background knowledge of the specific domain. Conversely, a patent with no technological potential could be estimated as a high-quality candidate for technology transfer and commercialization. These faulty evaluations result in a waste of R&D resources such as time, effort, and cost. In the process of extracting high-quality patents, experts generally get information from patents including basic technical information such as applicant, inventor, application date, abstract, statement, claim, figures, and so on. This research proposes a patent-based predictive model of technology transfer, obtaining quantitative relationships between major influential factors and successful technology transfers. This proposed predictive model is useful not only for predicting technology transfers, but also for preventing mismatch errors from expert opinions and the waste of R&D resources. The predictive model is constructed by preprocessing patent data and performing social network analysis, linear regression analysis, and decision tree modeling.
2. Related Work
Patent information analysis enables the extraction of a high-quality patent by analyzing its novelty, marketability, life cycle, citation information, and so on. As previous studies show, technology transfer has normally been researched through survey-based statistical analyses of subjective decision-making processes so as to propose qualitative strategies of technology transfer. Studies on patent indicators have mainly been concerned with forecasting promising technologies and patent registrations. Our approach, which applies quantitative analysis for technology transfer prediction, has not previously been investigated in the literature.
2.1. Predictive Model
With intensified global competition and the increased pace of technological development, it is vital to maintain competitiveness through effective innovation. Companies develop technologies through in-house R&D, but new technologies may also be acquired via open innovation technology transfers. Our aim is to support efficient R&D management through the use of predictive models based on statistical analysis and machine learning. This predictive approach should promote business sustainability through active technology transfers. Sohn and Moon [
4] suggested a predictive structural equation model that creates a technology commercialization success index (TCSI). Although many companies invest in R&D, they suffer asset losses when these efforts cannot be commercialized. To reduce these risks, this research applied a structural equation model for predicting TCSI values, given the technology receiver, technology transfer center, and environmental factors. As a follow-up study, Sohn and Moon [
5] proposed a decision tree model based on data envelopment analysis (DEA) to evaluate effective technology commercialization. In the case of IT companies attempting technology transfer or commercialization, DEA findings suggested the decision tree model as an appropriate tool in developing effective project roadmaps. Hwang and Lim [
6] conducted research on selecting the best R&D scenario by combining Monte-Carlo simulation and decision tree modeling. Walker
et al. [
7] undertook a comparative analysis of various types of future planning approaches to deal with technological uncertainty and suggested several methodologies to implement these approaches. Many previous studies have applied technology indicators or technology transfer algorithms to enable stable technology commercialization and transfer. There has been little research on predictive models of technology transfer using patent analysis. That is, traditionally the domain experts have decided to the possibility of whether the transfer of technology. But this is subjective and not stable. To solve this problem, we use objective method using quantitative approach based on patent analysis and statistical methods.
2.2. Patents and Patent Analysis
Patent systems function to grant inventors the exclusive right to own their inventions [
8]. Inventors specify the technical details and experimental results of their inventions in order to protect their exclusive rights. Patent documents are thus a valuable source of information on a wide range of developing technologies. Choi
et al. [
9] conducted a co-classification analysis of all patent data submitted to the Korea Intellectual Property Office from 1988 to 2010. By analyzing trends of technological convergence, it was found that the number of patents diminishes as convergence grows rapidly. Yoon and Park [
10] suggested a hybrid approach to patent analysis by combining conjoint analysis and patent citation information. This approach was applied to the thin film transistor liquid crystal display patent database as an empirical study. Jun and Park [
11] conducted quantitative patent analysis using statistical methods, machine learning, and social network analysis to analyze patent data from Apple. The study proposed a methodology for extracting Apple’s technology trends and relationships among various technologies; it resulted in extracting vacant technology areas of Apple. Mogee [
12] used patent families to analyze R&D planning, international patent activity, and patent indicators. The resulting growth model revealed distinct differences between mature and promising technologies. Wu
et al. [
13] constructed a predictive model based on international patent classification (IPC) codes to assess possibilities of patent registration. A genetic-based support vector machine was used to construct a model to screen patent data as an alternative to relying on expert opinions. Park
et al. [
14] constructed an expert system to predict patent registration, using a model based on quantitative methods such as patent indicators and text-mining techniques. Jun
et al. [
15,
16] studied data mining techniques for technology forecasting using patent information such as title, abstract, IPC codes, and bibliographic data.
2.3. Technology Transfer
Anderson
et al. [
17] evaluated technology transfer production from U.S. universities using the DEA approach. DEA was specifically applied to evaluate technology transfer offices (TTOs), using the number of technology transfers and their effectiveness. The study also employed linear regression to find out whether medical school is an essential factor for a TTO’s efficiency. Weckowska [
18] conducted an empirical study of TTOs at six universities in the United Kingdom to analyze two different types of technology transfer. Chang and Chen [
19] discussed potential applications from fuzzy set theory to select biotechnology management strategies and technology transfers. Their algorithm was based on the concepts of fuzzy set theory and hierarchical structure analysis. Linguistic variables and fuzzy number were used as weighted evaluation values along with the subjective evaluations of decision makers. Heslop
et al. [
20] designed a preparatory stage for technology transfer, known as the “Cloverleaf Model,” to achieve successful transfers. Cummings and Teng [
21] demonstrated that successful technology transfer is related to various factors such as a company’s understanding of R&D, its expertise in technology transfer, and the range of shared basic knowledge. Mowery
et al. [
22] examined technology transfer within an organization for strategic linkages. The study extracted a new indicator that reflects changes in technological ability based on the citation pattern of a patent portfolio. In addition, there are many existing studies such as technology transfer monitoring for government-funded R&D projects [
23], technology transfer as a learning and developmental process for Norwegian programs [
24], and analytic hierarchy process modeling to evaluate the indicators of technology transfer strategies in the petrochemical industry [
25]. Kim [
26] proposed a hierarchical analysis model of the decision making process in order to predict technology transfer policy directions. Sohn
et al. [
27] analyzed the technology market’s environmental factors to narrow the gap between demand and supply and to activate technology commercialization.
3. Predictive Model of Technology Transfer
In general, the transferred technologies are important to a company and nation for improving their technological competitiveness. In addition, it is needed that the technologies are researched and developed sustainedly. There is close correlation between technology transfer and sustainable technology. Thus, we can forecast the sustainability of a technology by predicting the possibility of technology transfer. This research proposes a predictive model of technology transfer by collecting patent data and applying text mining techniques for preprocessing. The model then performs social network analysis, regression analysis, and decision tree modeling.
3.1. Derive Survey-Based Growth Curve
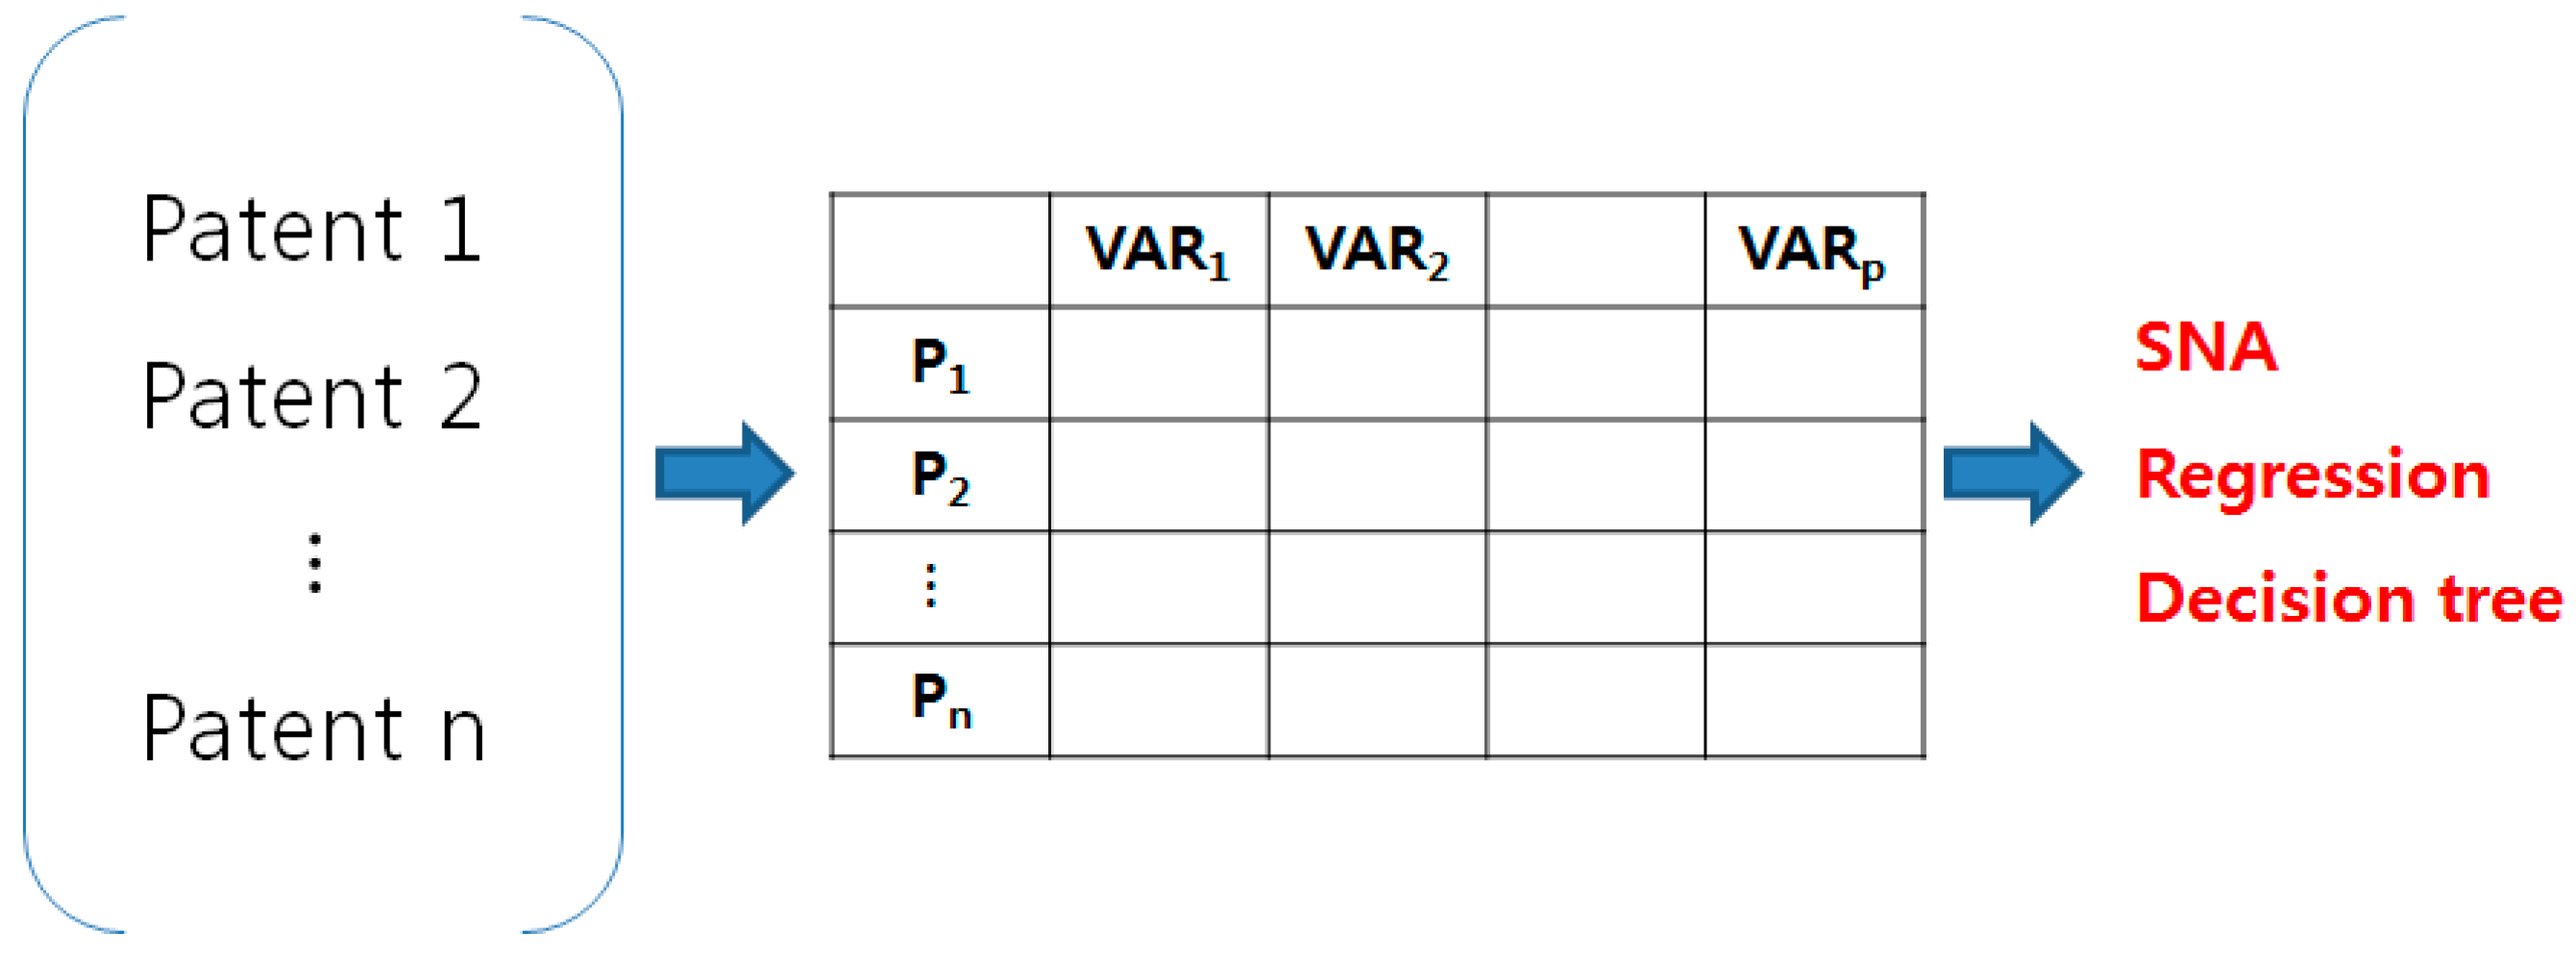
Patent documents represent unstructured data containing text and numbers. Transformation into structured data is necessary to perform patent analysis using statistical methods and machine learning algorithms, such as social network analysis, regression analysis, and decision trees. Therefore, the collected patent documents are preprocessed as shown in
Figure 1.
Figure 1.
Preprocessing of patent documents.
Figure 1.
Preprocessing of patent documents.
By using text mining techniques, patent documents are preprocessed and transformed into structured data as shown in
Figure 1. The structured data are formulated as a matrix with rows and columns. Each row represents a patent document and each column represents variables that influence technology transfer. This process is performed using the R data language. R provides various functions for data preprocessing and statistical and data analysis [
28]. In particular, the “tm” package contains excellent preprocessing functions that can be implemented in R [
29]. Text mining techniques are used to extract meaningful information from text data. In the text mining process, it is possible to perform a variety of text mining tasks using R to structure the text data. The patent-term matrix is a structured dataset that is constructed from text data preprocessed by the “tm” package; this package performs text mining techniques such as stemming, whitespace elimination, stop-words removal, and so on. In general, the process of text mining for patent analysis is as follows [
29]:
- (Step1)
Collecting patent documents from patent databases and installing “tm” package R functions: install.packages, library(tm)
- (Step2)
Making corpus using patent data repository R function: Corpus
- (Step3)
Constructing term-document matrix R functions: DocumentTermMatrix, stemDocument, stripWhitespace, removeWords
- (Step4)
Analyzing term-document matrix R functions: lm, tree, sna
3.2. Technology Relation Analysis Using Social Network Analysis
Social network analysis (SNA) is based on a graph that depicts the data structure and the relational status among the objects. A graph G is composed of vertexes and edges as follows [
30].
V(G) is a set of graph G’s vertexes, which can be objects of various kinds. In SNA, a vertex represents a node or point. Edge E(G) means a set of graph G’s edges and the relations among the vertexes. Edge represents a link or line in the SNA context. SNA is a typical visualization method based on graph theory [
31,
32]. In this research, SNA is applied to visualize various forms of patent data.
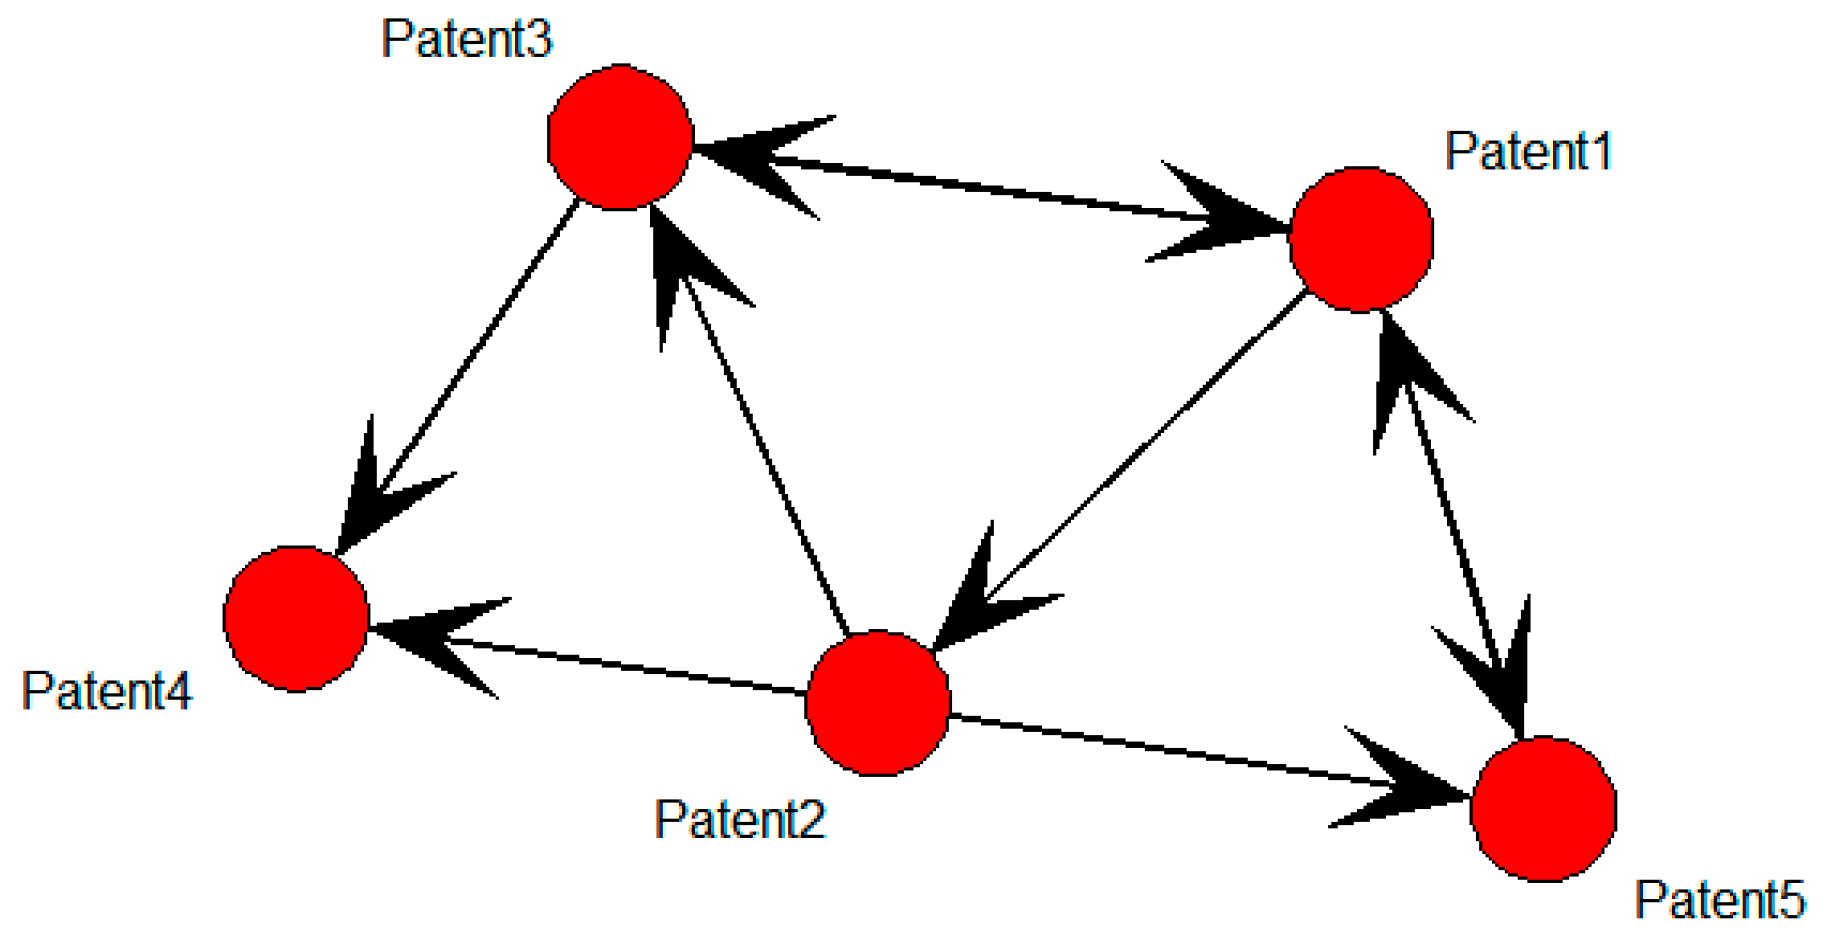
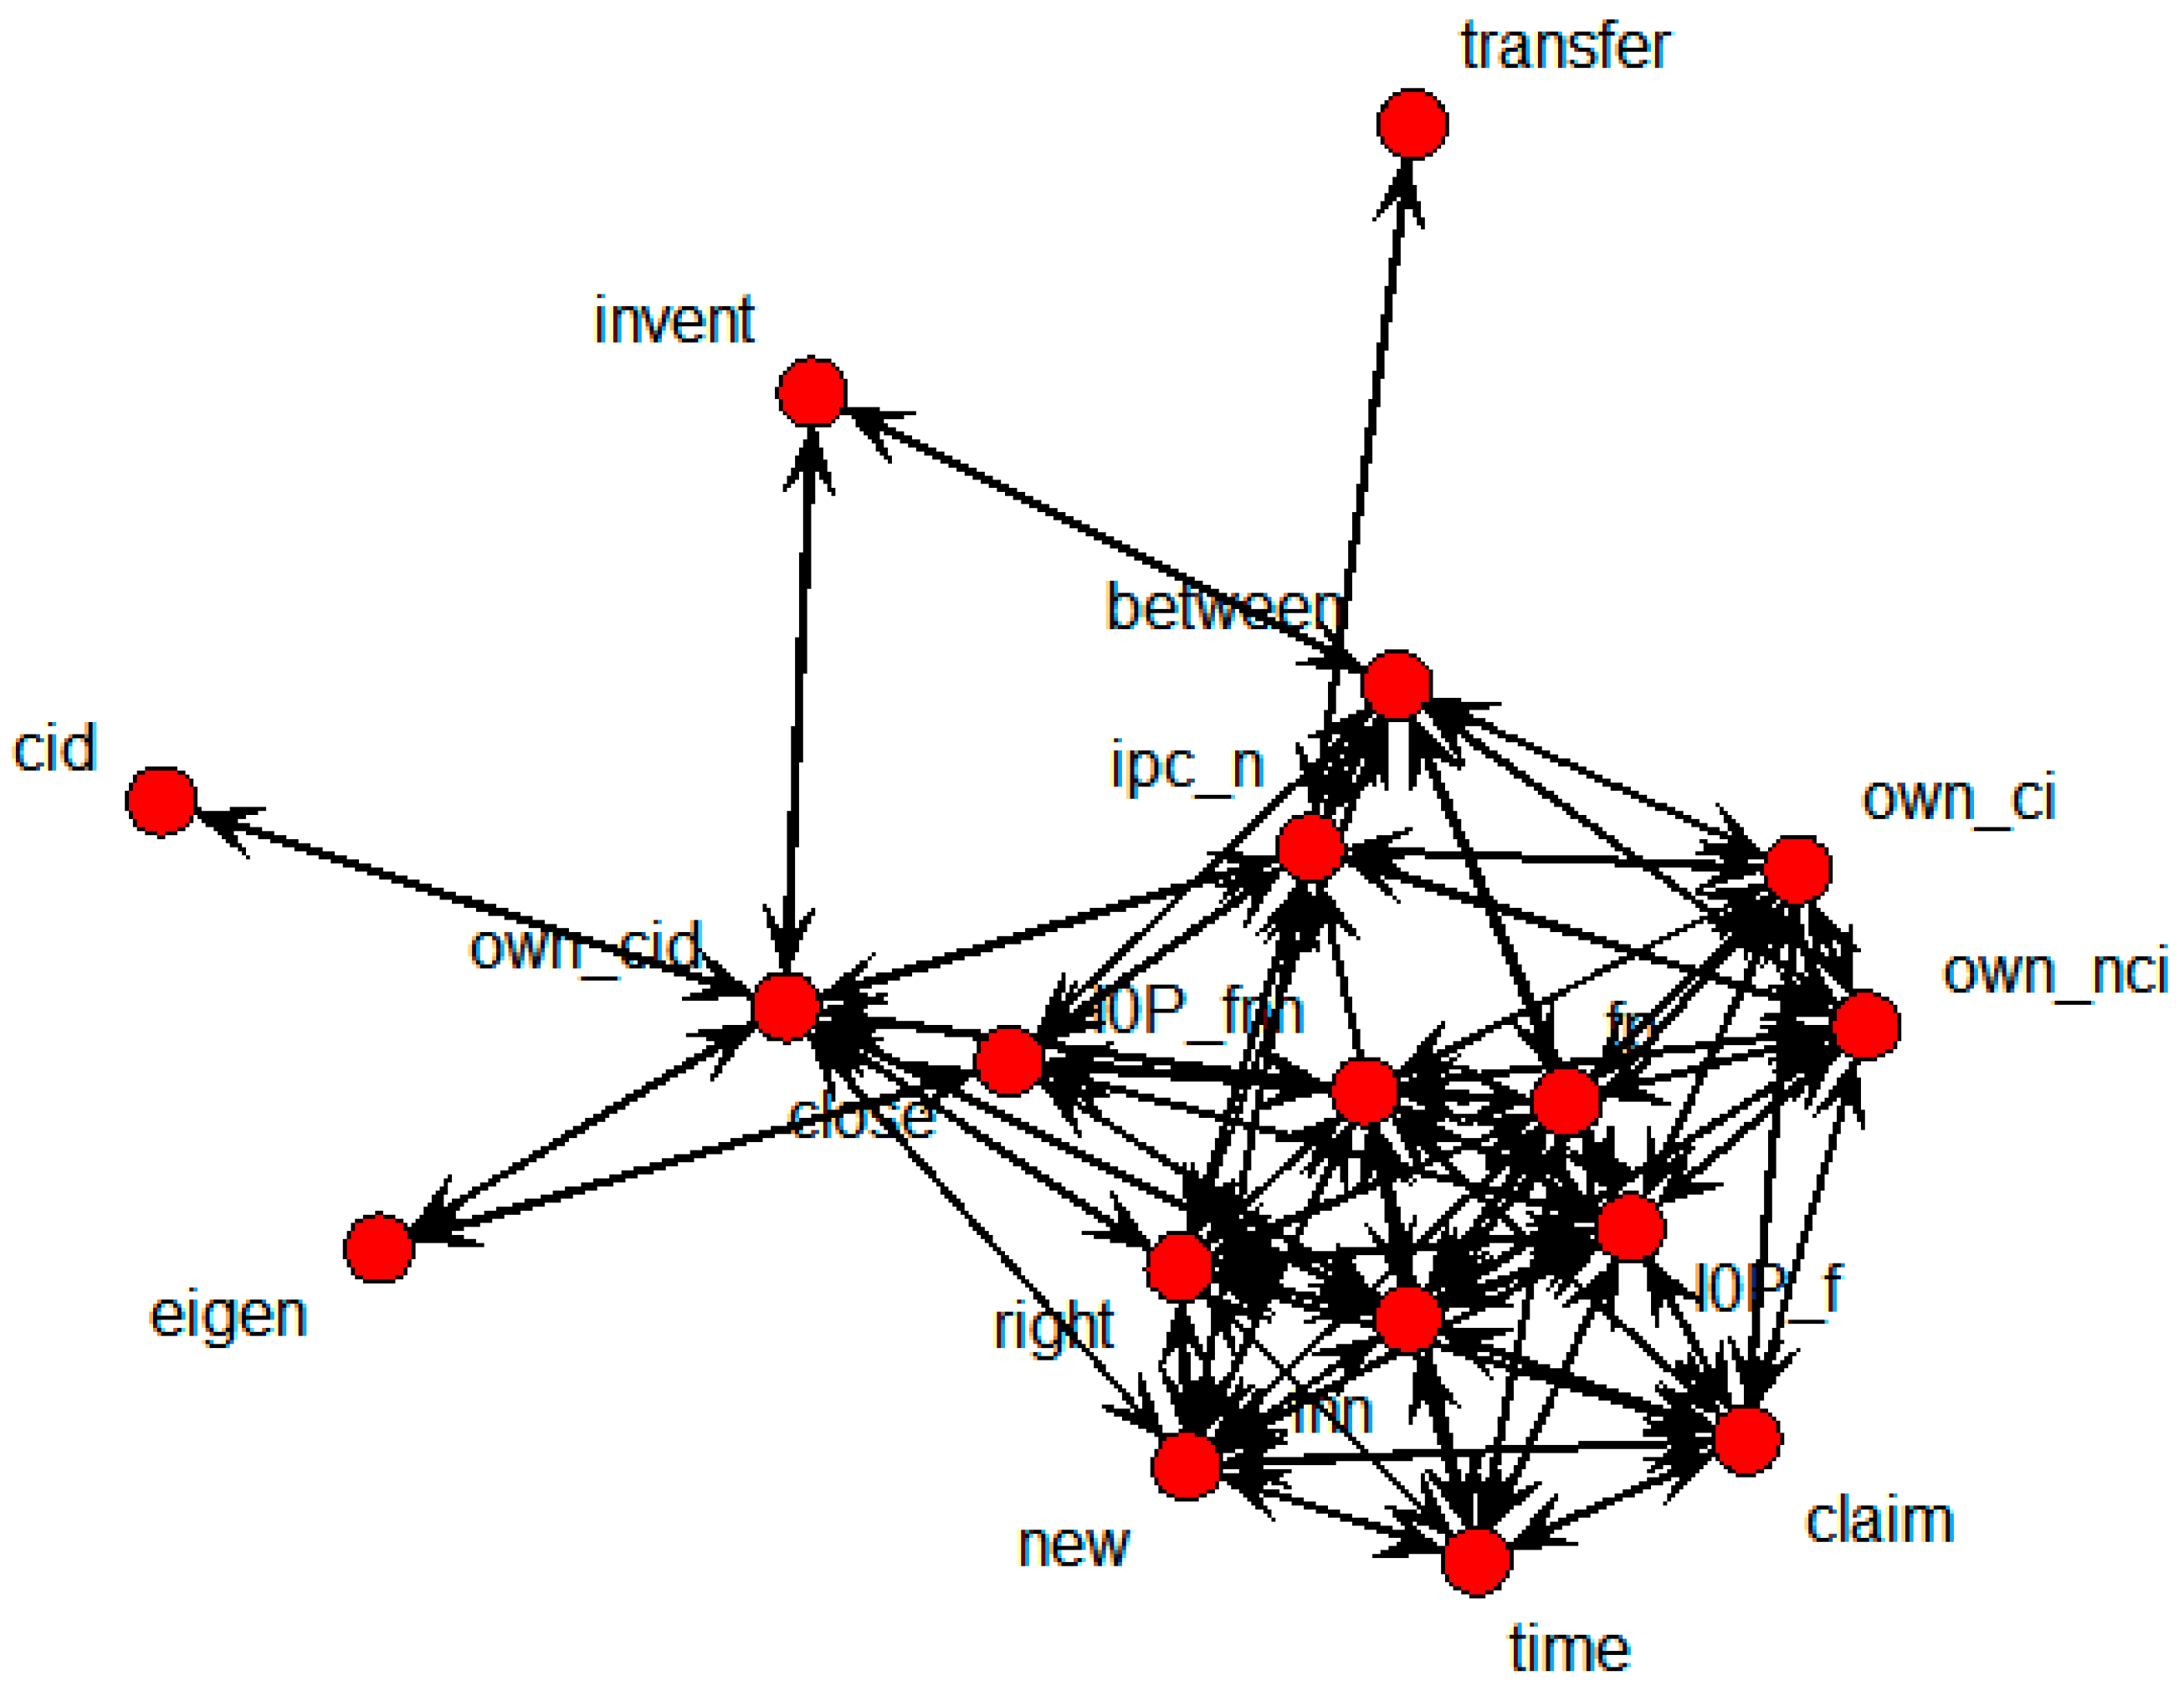
Figure 2 shows an SNA graph in which each node represents a patent.
Figure 2.
Patent-based SNA graph.
Figure 2.
Patent-based SNA graph.
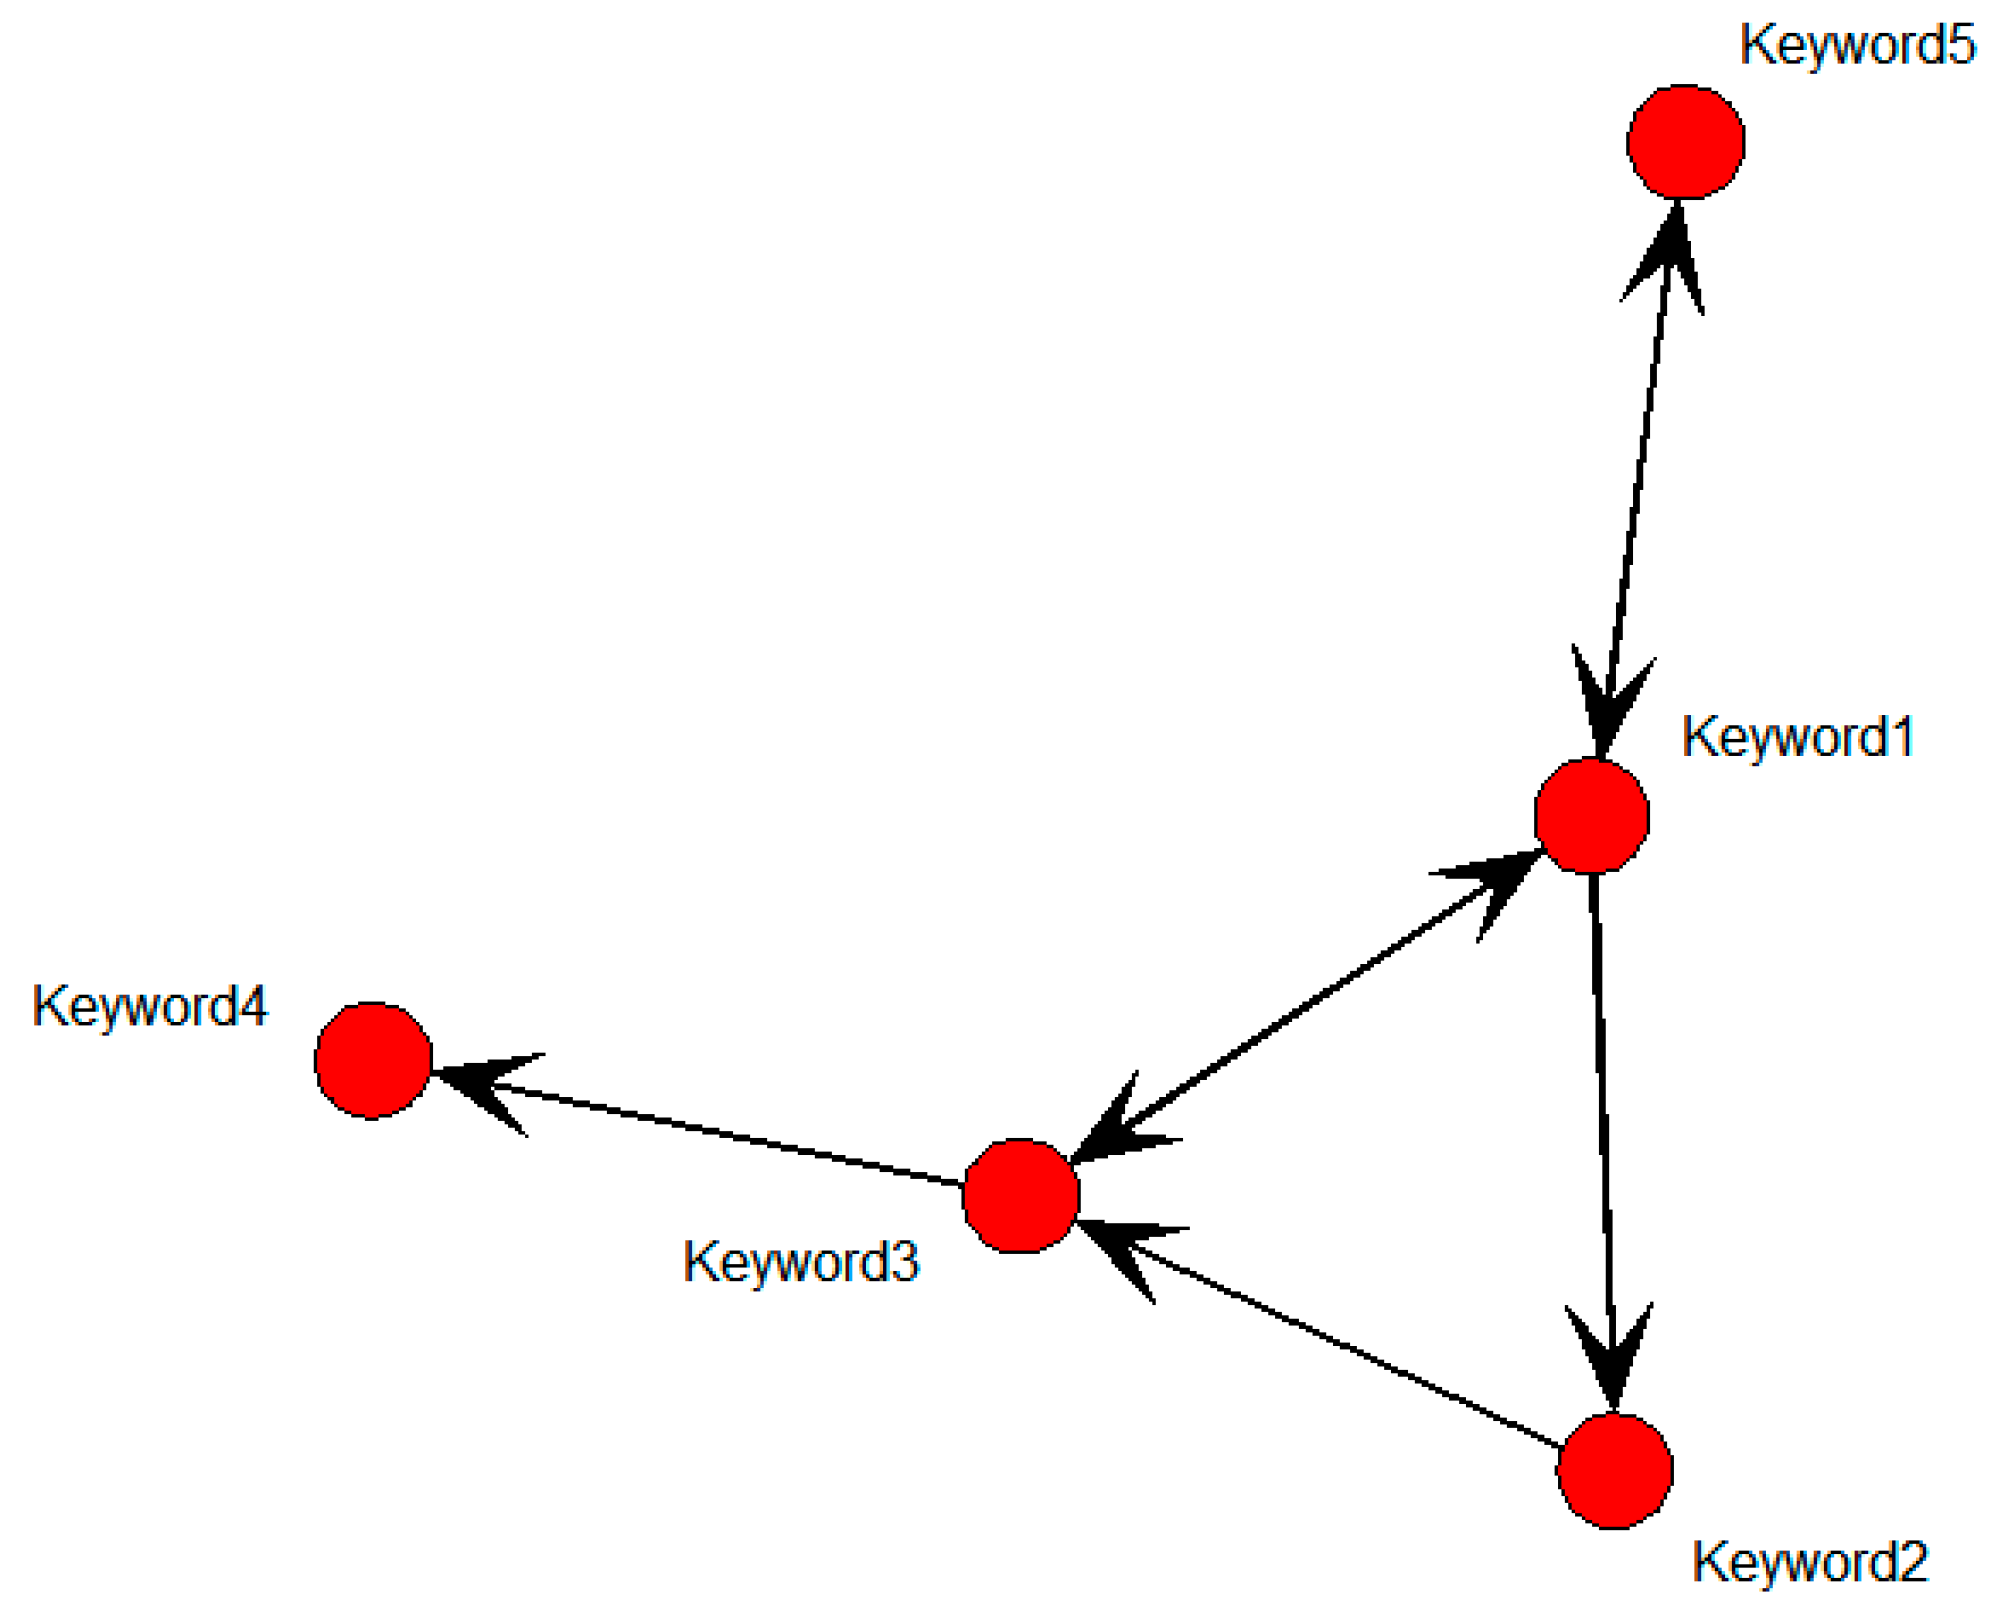
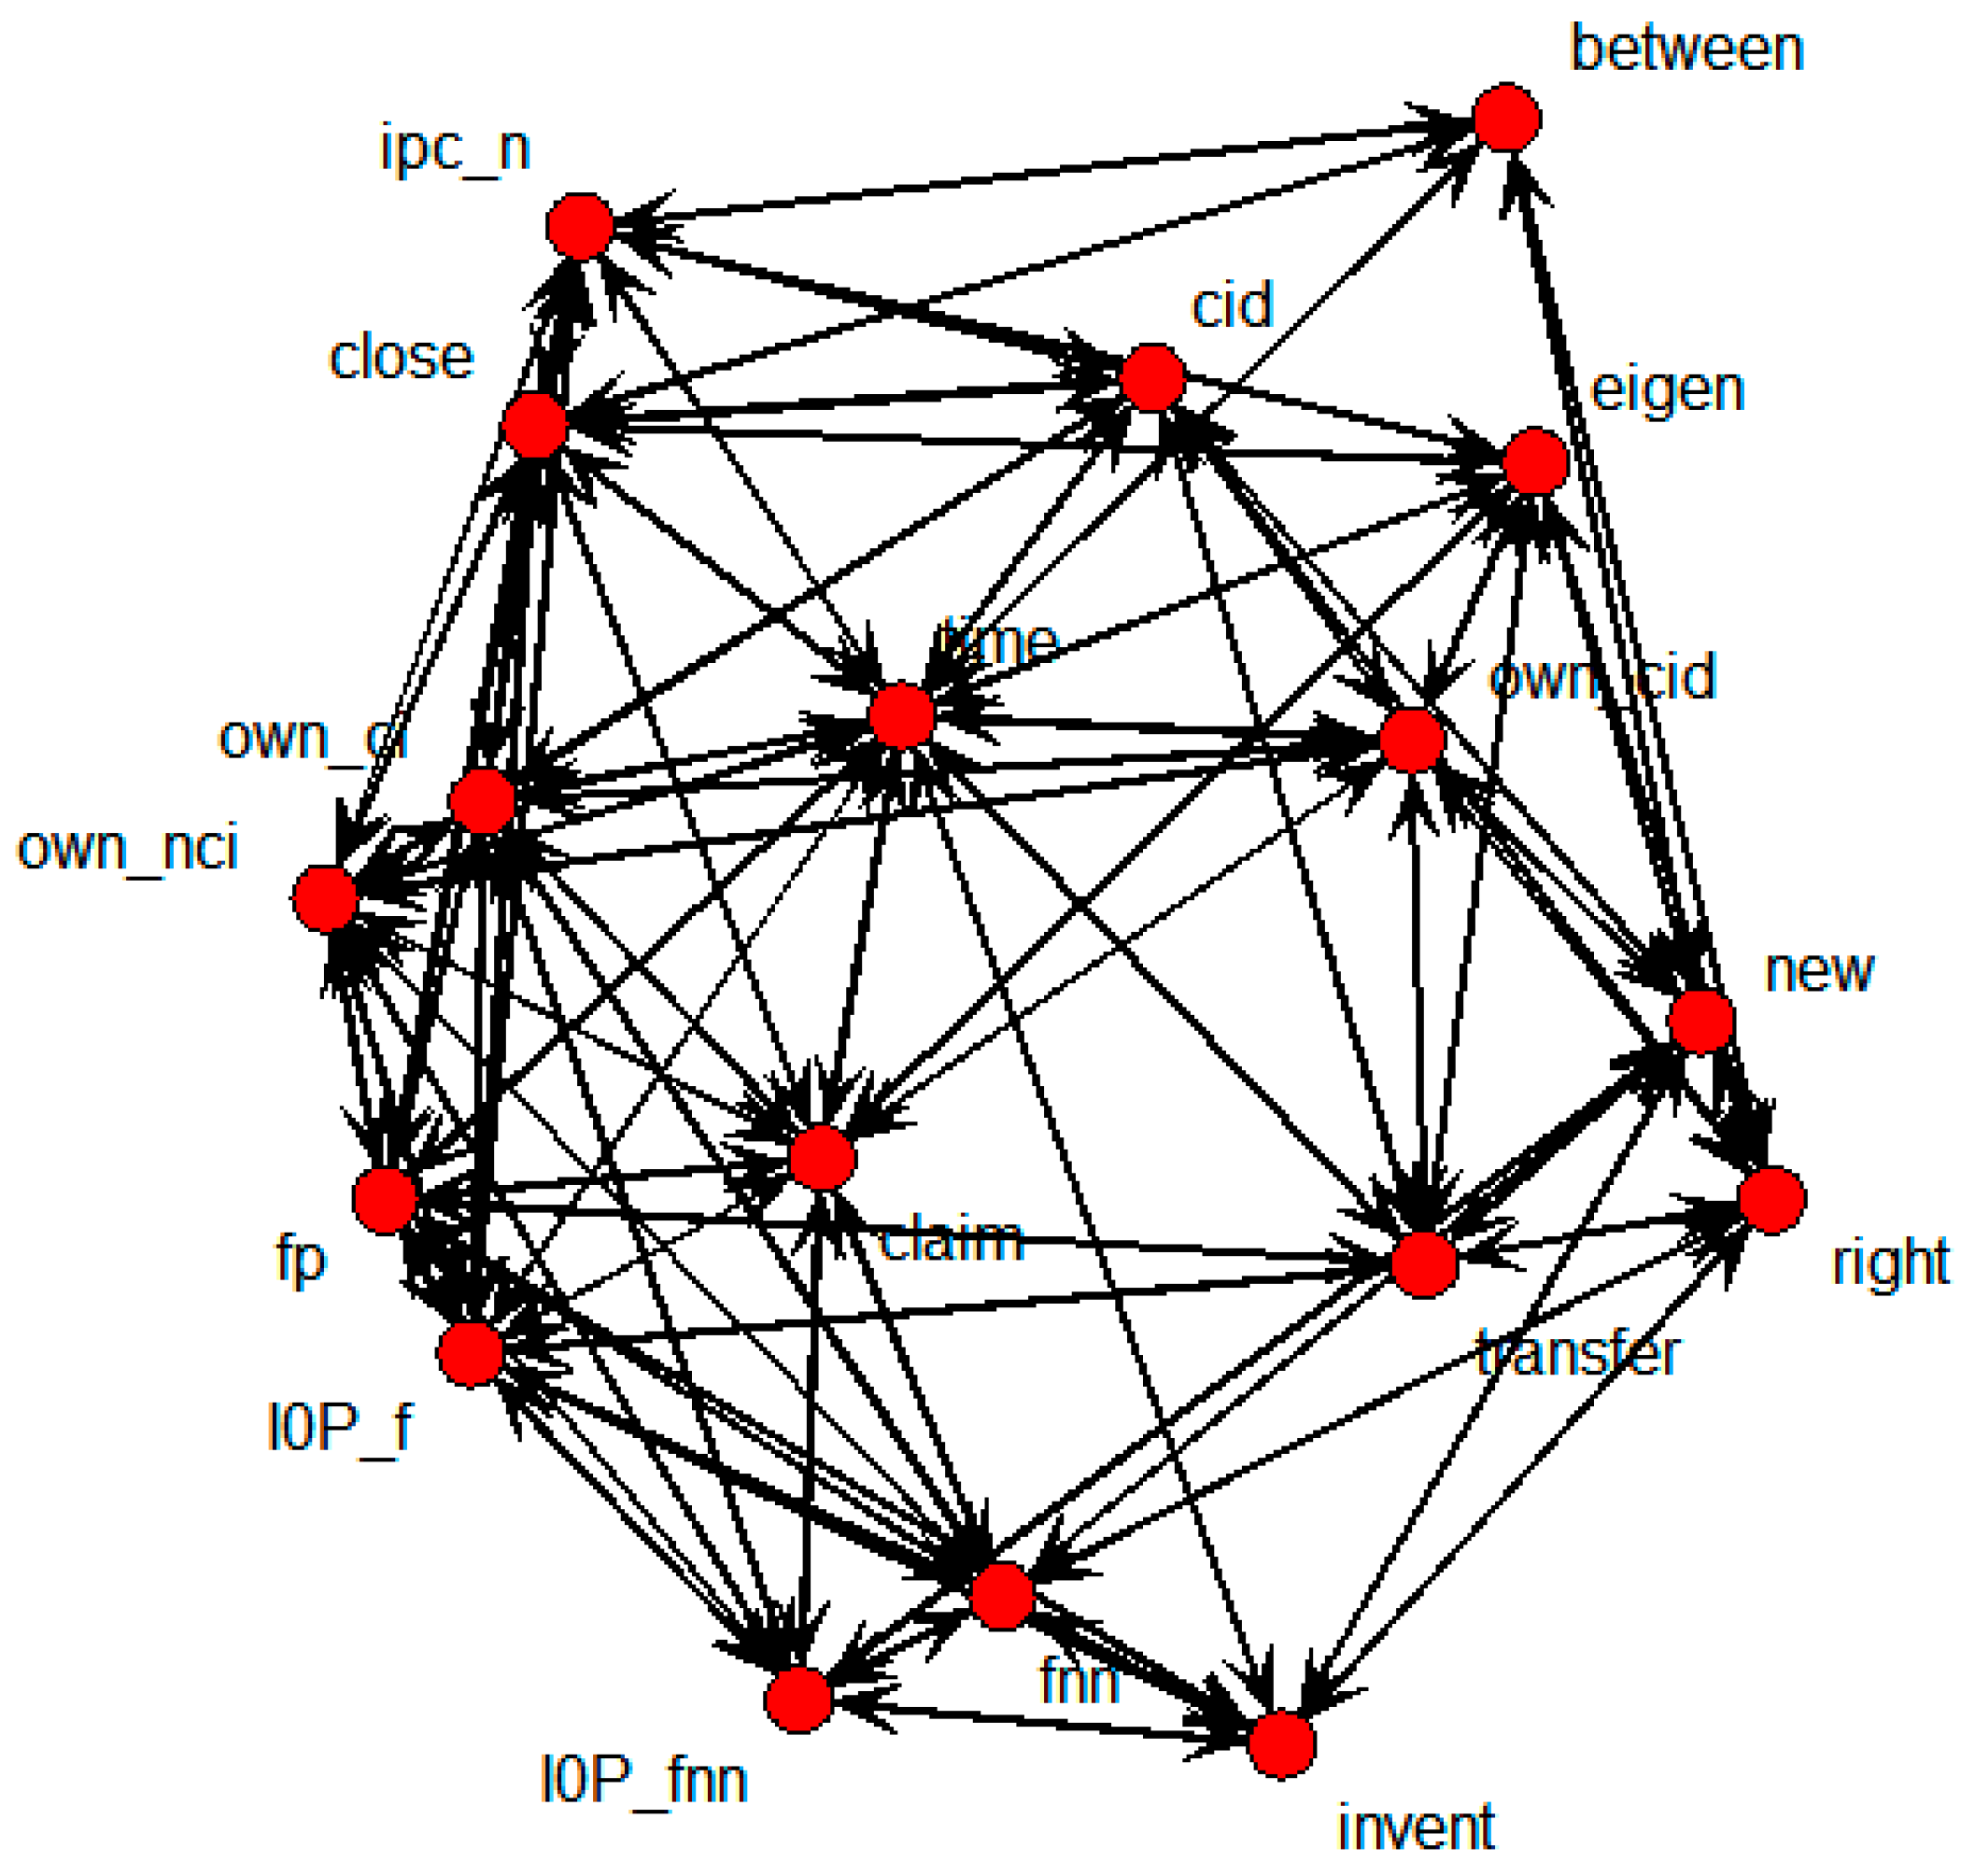
Figure 3 shows an SNA graph with each node being a keyword from a patent document.
Figure 3.
Keyword-based SNA graph.
Figure 3.
Keyword-based SNA graph.
There are other types of SNA graphs based on IPC codes, citation information, and so on. Social network structures contain a number of nodes that are either connected or not. Generally, there are two types of SNA graphs: undirected and directed networks. In an undirected network, the existence of a connection line from node i to j requires there to be a connection line from node j to i. On the other hand, directed networks are all kinds of networks other than undirected types. Degree is employed as a measurement of SNA performance; the degree of a node is derived from the sum of in-degree and out-degree connection lines.
3.3. Technology Weighted Value Calculation Using Regression Analysis
This research performs multiple regression analysis on the visualization results from SNA graphs. Regression analysis is performed with a dependent variable Y and independent variables
x1,…,
xr. The regression model shown below is used to construct a predictive model of technology transfer.
Dependent variable represents a transfer variable indicating whether technology has been transferred or not. The independent variables represent factors that influence technology transfer; in the above model, r independent variables are included. Regression parameter β0 is the intercept of the model, and β1,…, βr are the slopes of each independent variable.
3.4. Technology Transfer Prediction Using Decision Tree Model
This research uses a decision tree model for the final technology transfer prediction. For developing prediction model, there are two methods that are widely used: logistic regression and decision tree modeling. While logistic regression analysis is usually used in creating scoring models, decision tree modeling is used for segmentation. The decision tree is a machine learning model in which a leaf node representing a class label branches off from the root node as homogeneous nodes are segmented [
33]; it is a method for constructing classification and regression trees with high performance. This model consists of two types of trees: discrete target variable, which is a classification tree, and continuous target variable, which is a regression tree. Impurity or homogeneity measures used to assess the model include chi-square test statistics, Gini index, entropy,
F-test, variance reduction, and so on. The general construction process of the decision tree is as follows:
- (Step1)
Decision Tree Construction
- (Step2)
Pruning
- (Step3)
Validation
- (Step4)
Interpretation and Prediction
- (Step5)
New Rule Generation
The Gini index and entropy are used as model selection criteria. The following formula is used for the calculation of the Gini index [
33].
Here,
k is the number of class labels included in the specific node,
n is the total number of entities in the specific node, and # of
Oi is the number of entities corresponding to the
ith label. The lower the Gini index gets, the higher will be the homogeneity of the specific node. The other measurement is entropy. It is possible to calculate the entropy I(
t) of the specific node
t using the following formula:
p(i|t) represents the proportion of label i including node t. The lower the entropy value gets, the higher the homogeneity is.
3.5. Predictive Model of Technology Transfer Using Patent Analysis
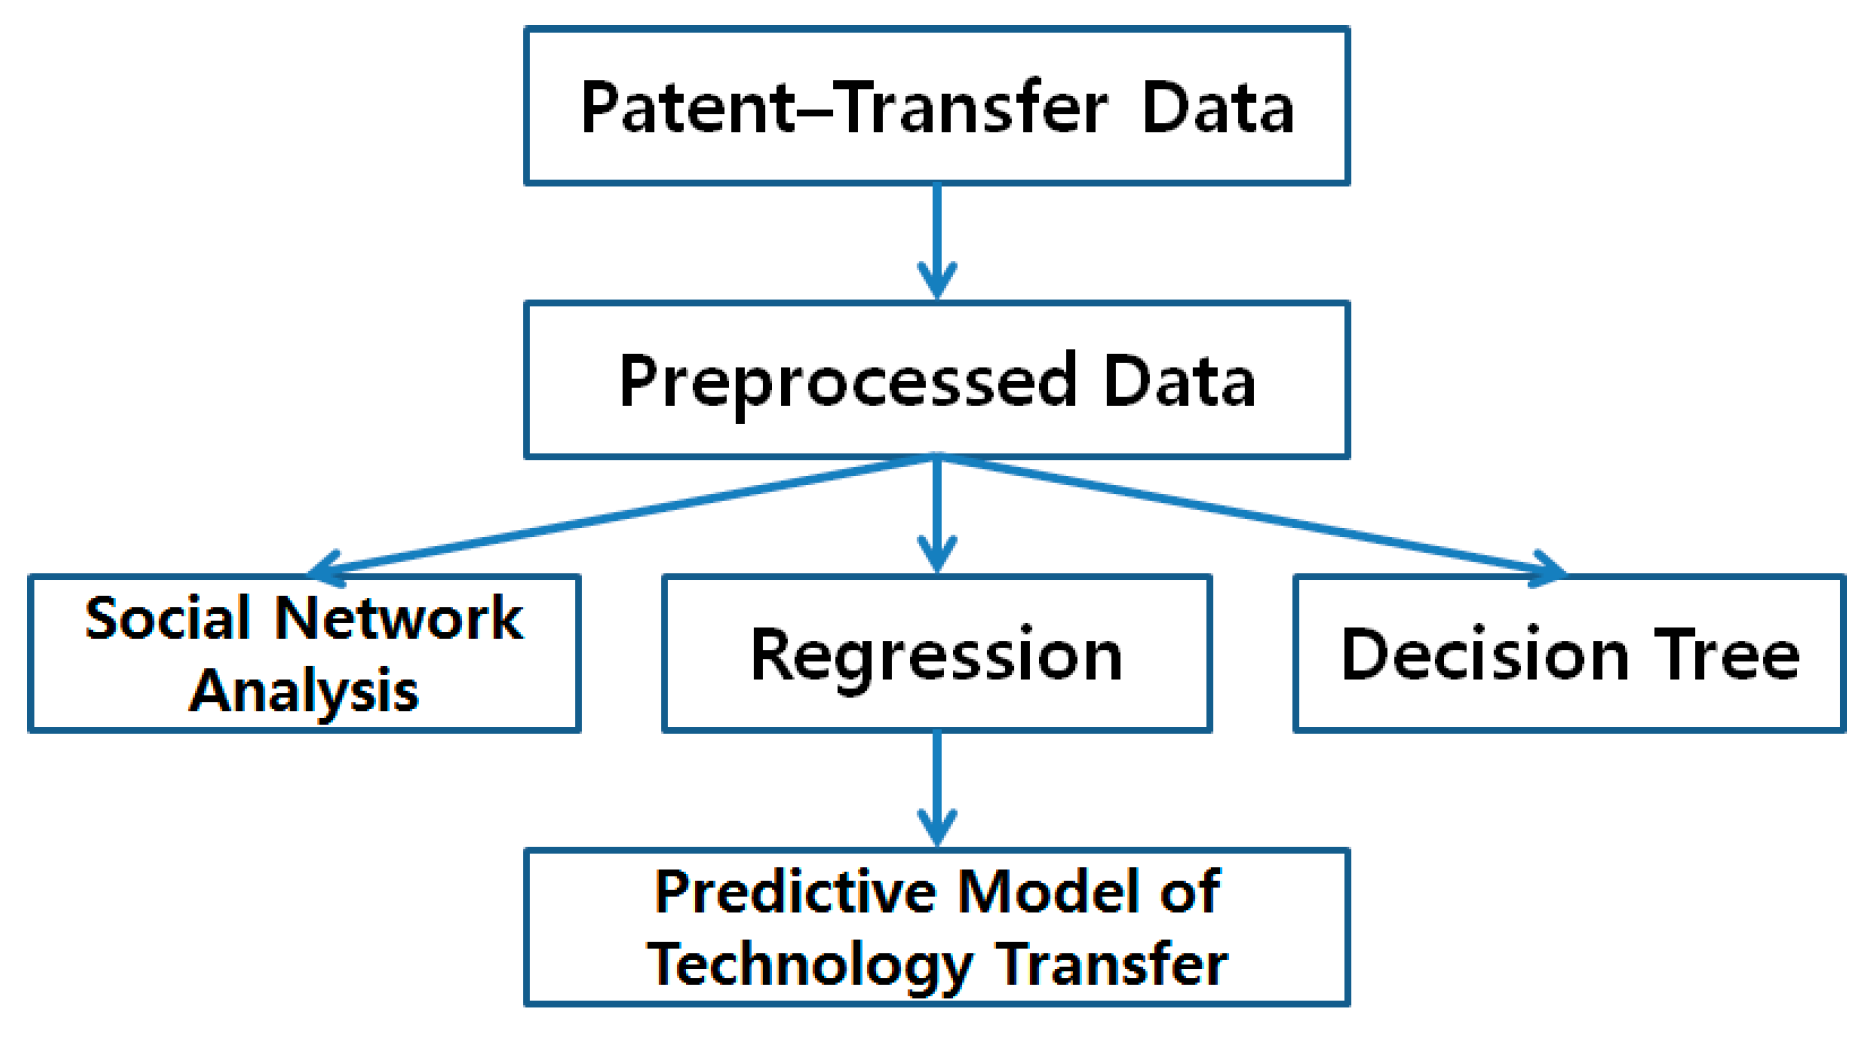
The construction of the predictive model of technology transfer proposed in this research proceeds as shown in
Figure 4.
Figure 4.
Construction of predictive model of technology transfer.
Figure 4.
Construction of predictive model of technology transfer.
First, patent data are collected, including technology transfer details. The patent data are then preprocessed and transformed into structured data to make them available for statistical and machine learning analysis. Finally, the predictive model is constructed by using SNA, regression analysis, and decision trees. There are various techniques to analyze patent data. Among them we use SNA, regression, and decision trees, because SNA is an efficient approach to analyze the patent data [
11]. Using the SNA, we can get the association between variables to construct the predictive model for technology transfer. In addition, using the p-values of regression parameters, we can select the statistically significant variables to predict possibility of technology transfer. The decision tree model showed good performance in technology management [
4]. In this paper, we also consider the decision tree as a method to select key variables for predicting technology transfer.
4. Experimental Results
In order to test the validity of the proposed method, this research constructed a predictive model of technology transfer based on 1000 patents and their technology transfer results. The variables for this research contained a dependent variable, “transfer,” and 21 independent variables ranging from “group” (applicant’s institutional affiliation) to “fp” (number of family patents), as shown in
Table 1 below.
Table 1.
Variables in predictive model of technology transfer.
Table 1.
Variables in predictive model of technology transfer.
| Dependent and independent variables |
|---|
| transfer—Whether technology has been transferred or not |
| group—Applicant’s affiliation (0: National research institute, 1: Public University, 2: Private University, 3: Collaborative research, 4: Country, 5: Community college) |
| time—Expiration date—Registered date |
| own_ci—Number of backward citations within domestic patents |
| own_cid—Number of forward citations within domestic patents |
| I0P_f—Number of INPADOC Family patents |
| I0P_fnn—Number of INPADOC Family countries |
| invent—Number of inventors |
| own_tr—Whether ownership has been transferred or not (0, 1) |
| claim—Number of claims |
| cid—Number of forward citations |
| fnn—Number of family countries |
| tri—Whether it is a triadic patent or not (0, 1) |
| ipc_n—Number of IPC codes extracted |
| close—Closeness |
| between—Betweenness |
| eigen—Eigenvector |
| new—Novelty |
| right—Degree of the rights |
| own_nci—Citation within domestic patents |
| prior—Whether patent has been filed for priority or not (0, 1) |
| fp—Number of family patents |
This experiment constructed predictive models of technology transfers based on patent data from the categories of whole dataset, national research institute, public university, private university, collaborative research, and country, respectively.
4.1. Technology Transfer Prediction for the Whole Patent Data
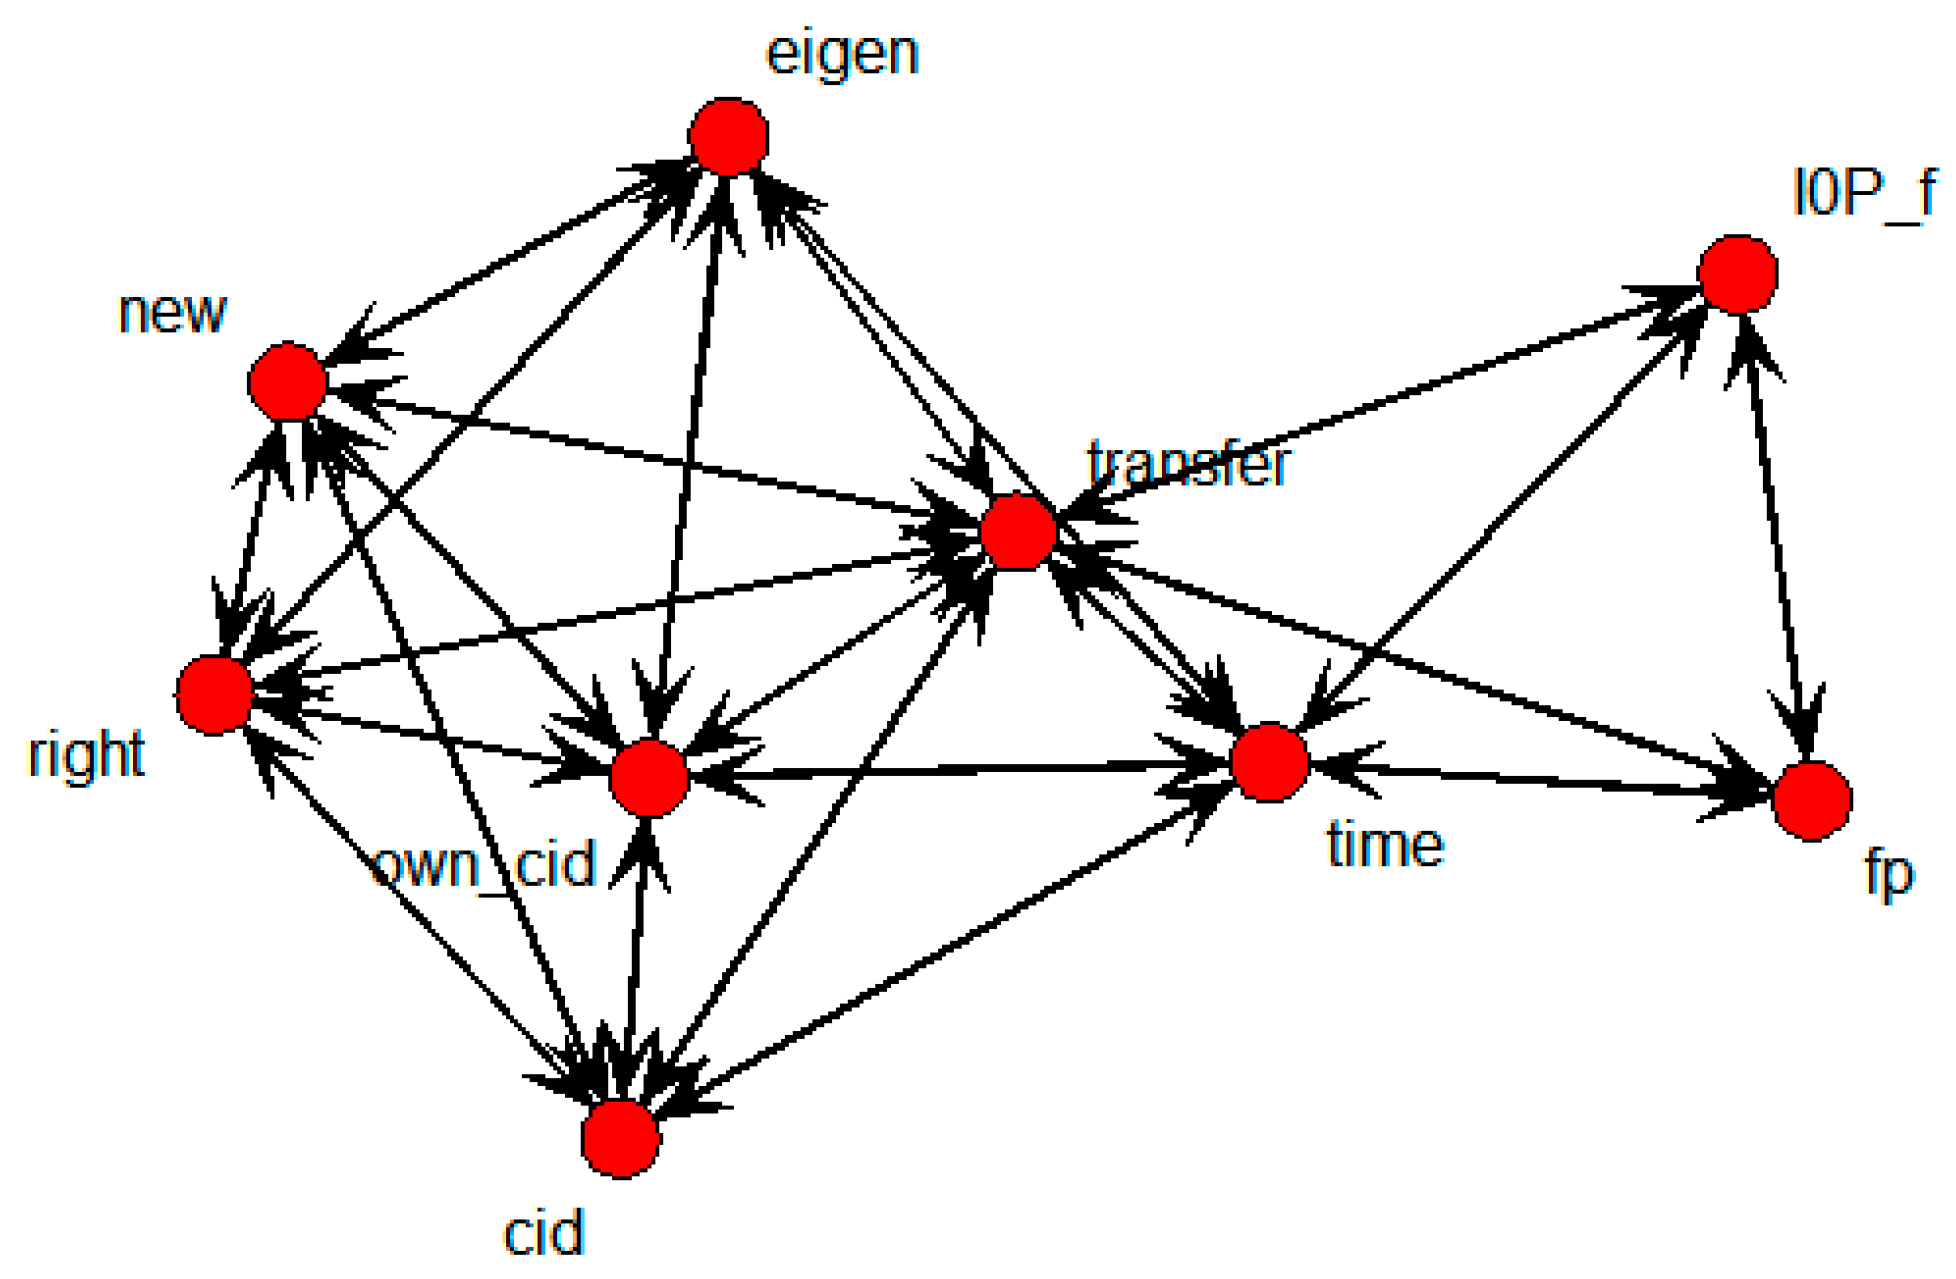
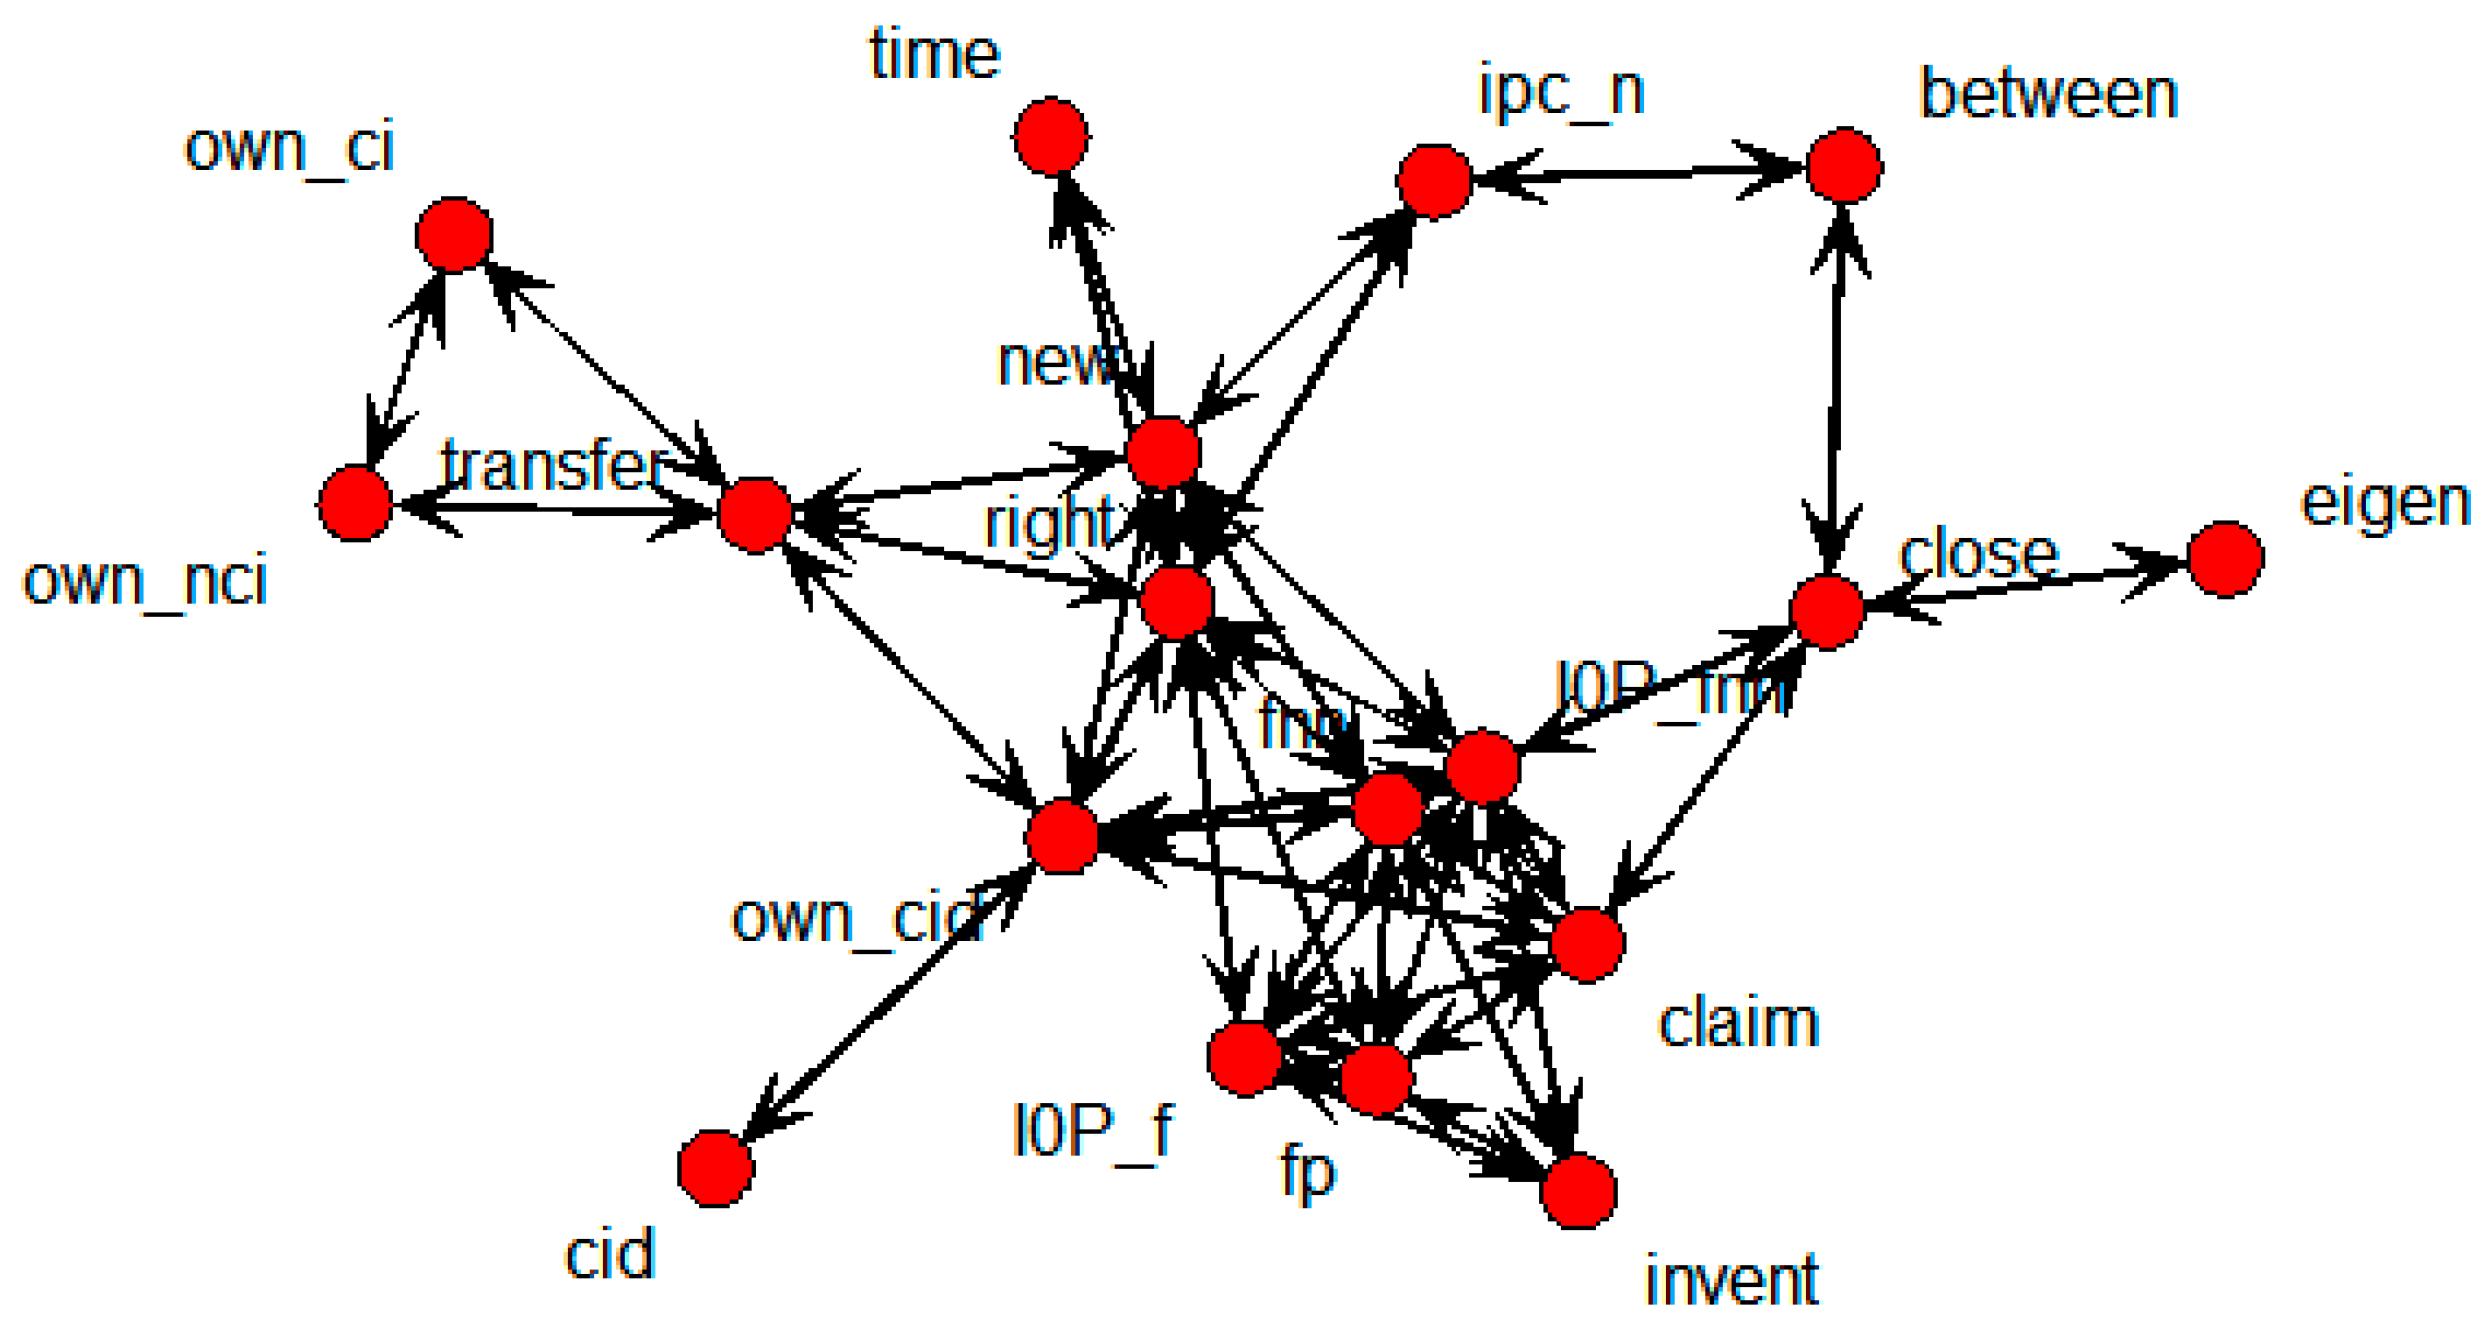
SNA was performed on the whole patent dataset in order to obtain the connections among the variables.
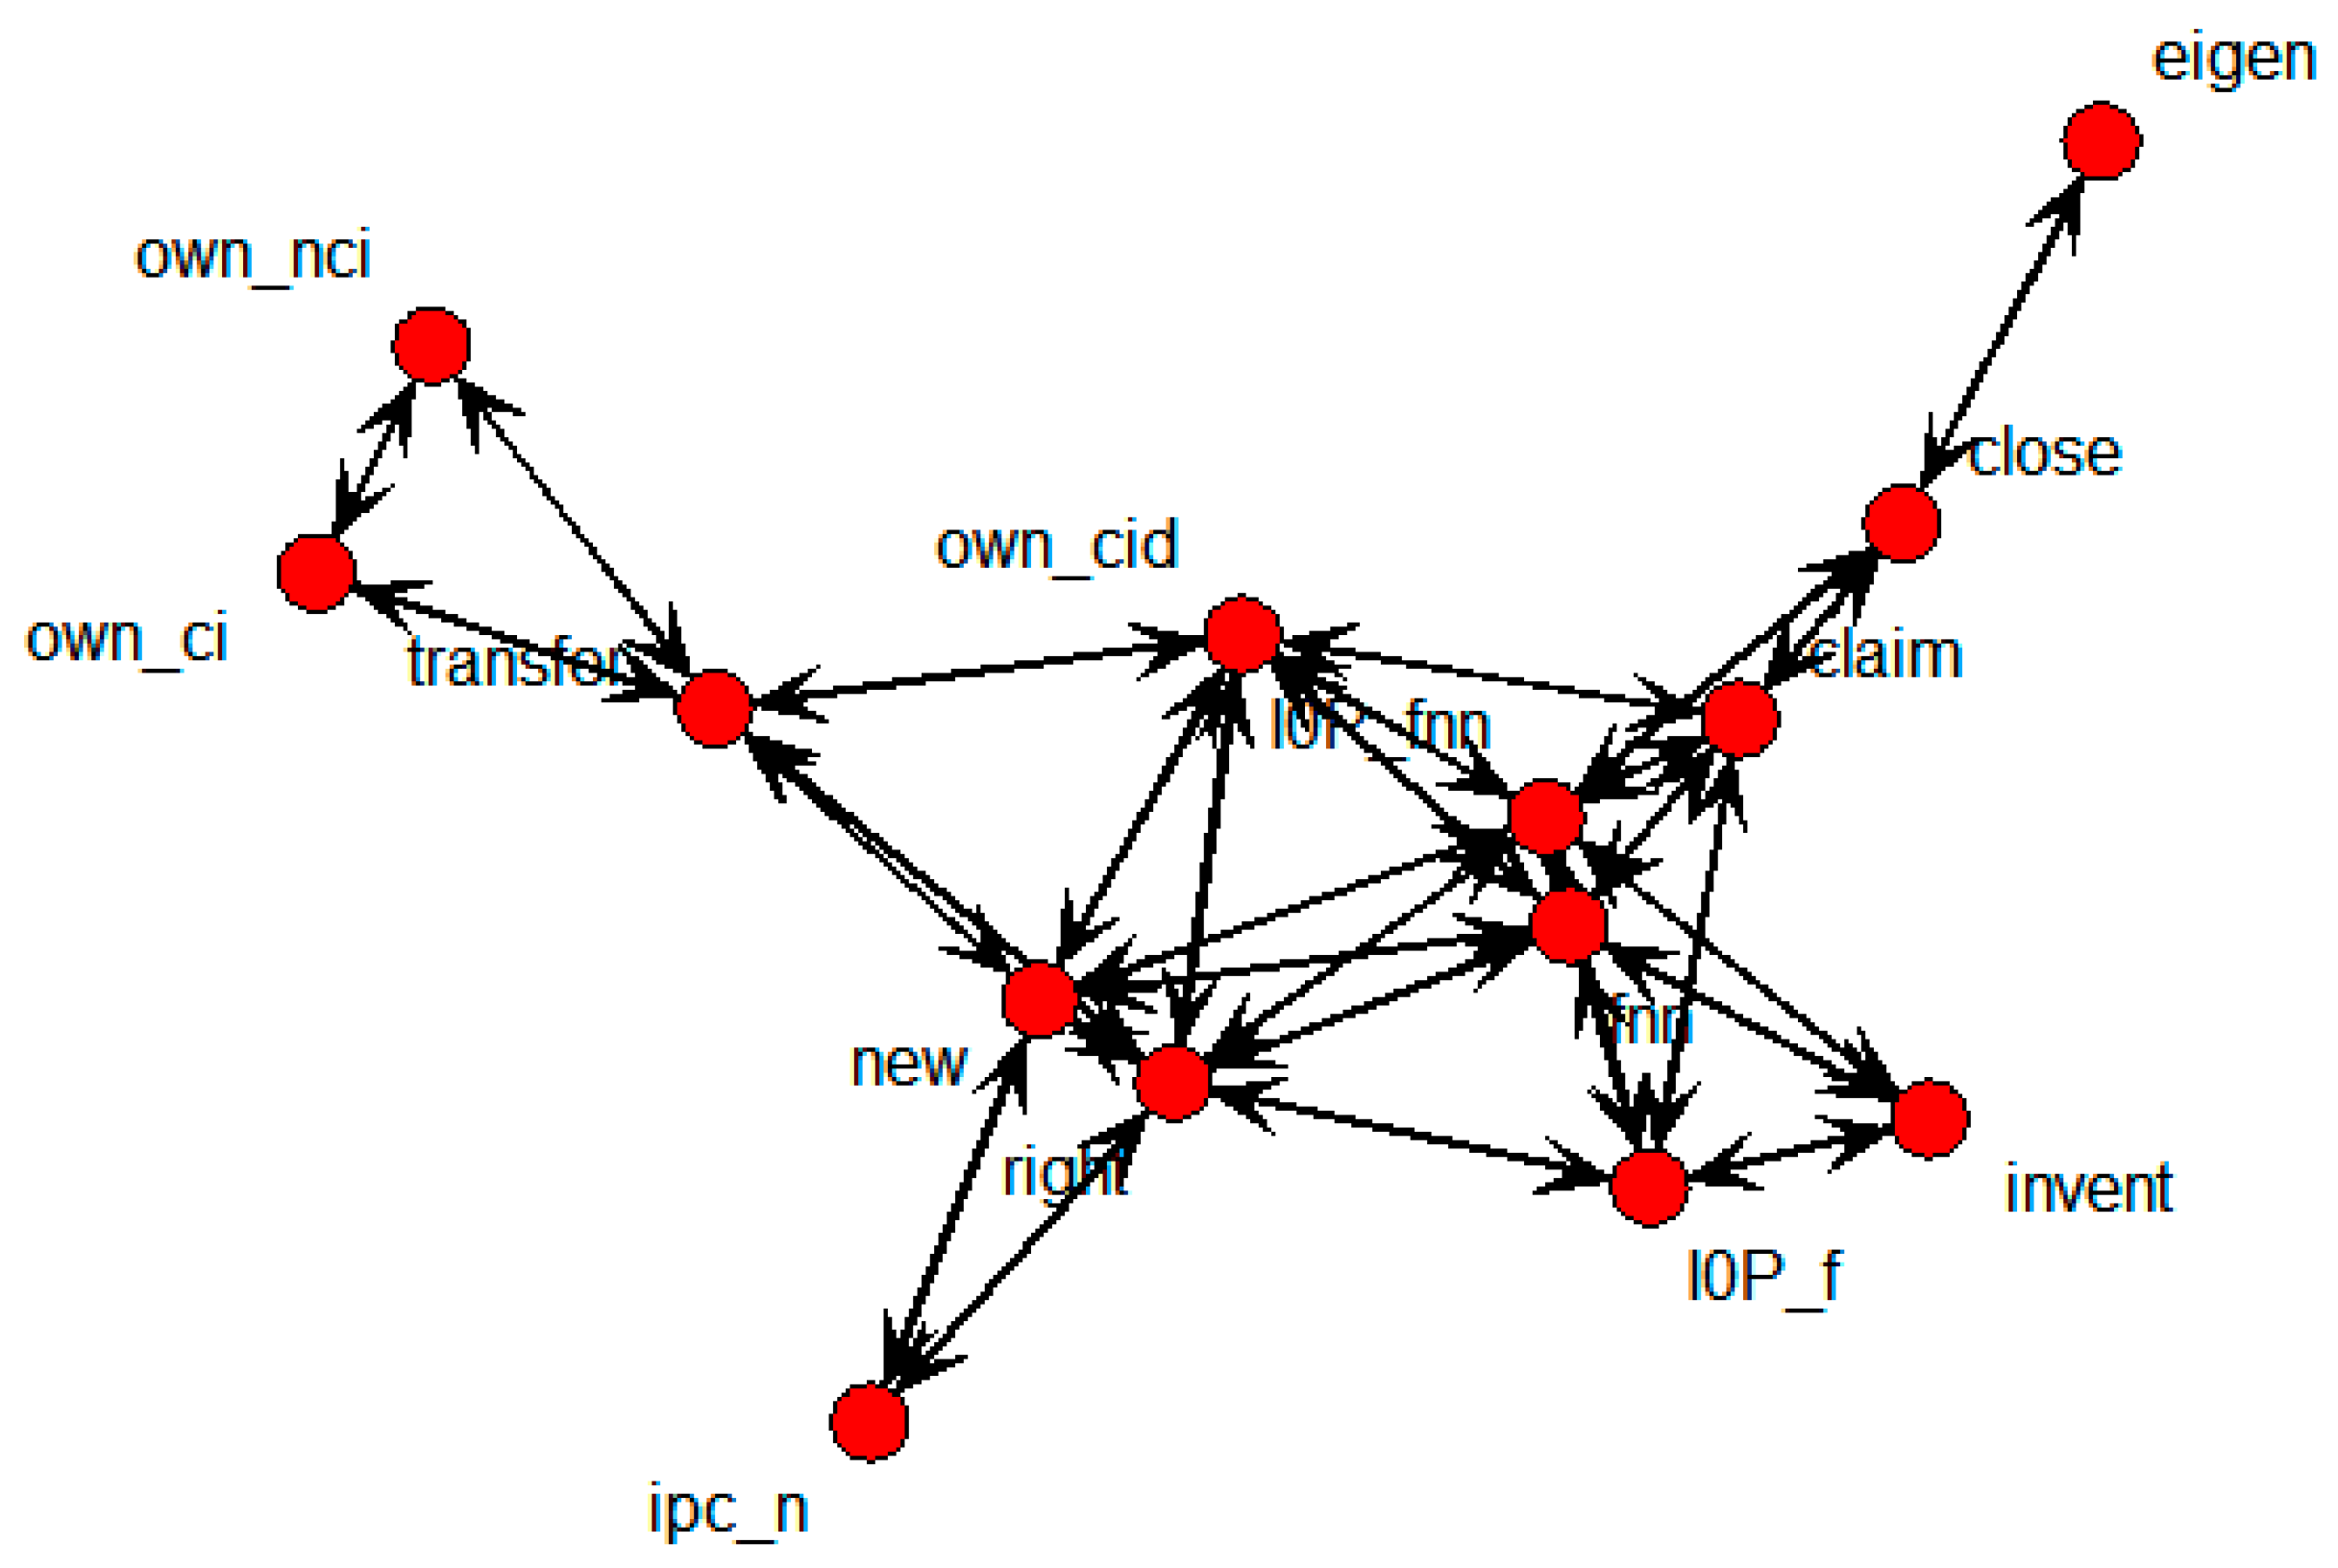
Figure 5 shows the relations indicated by the technology transfer results for the whole data.
Figure 5.
SNA graph of technology transfer results for whole data.
Figure 5.
SNA graph of technology transfer results for whole data.
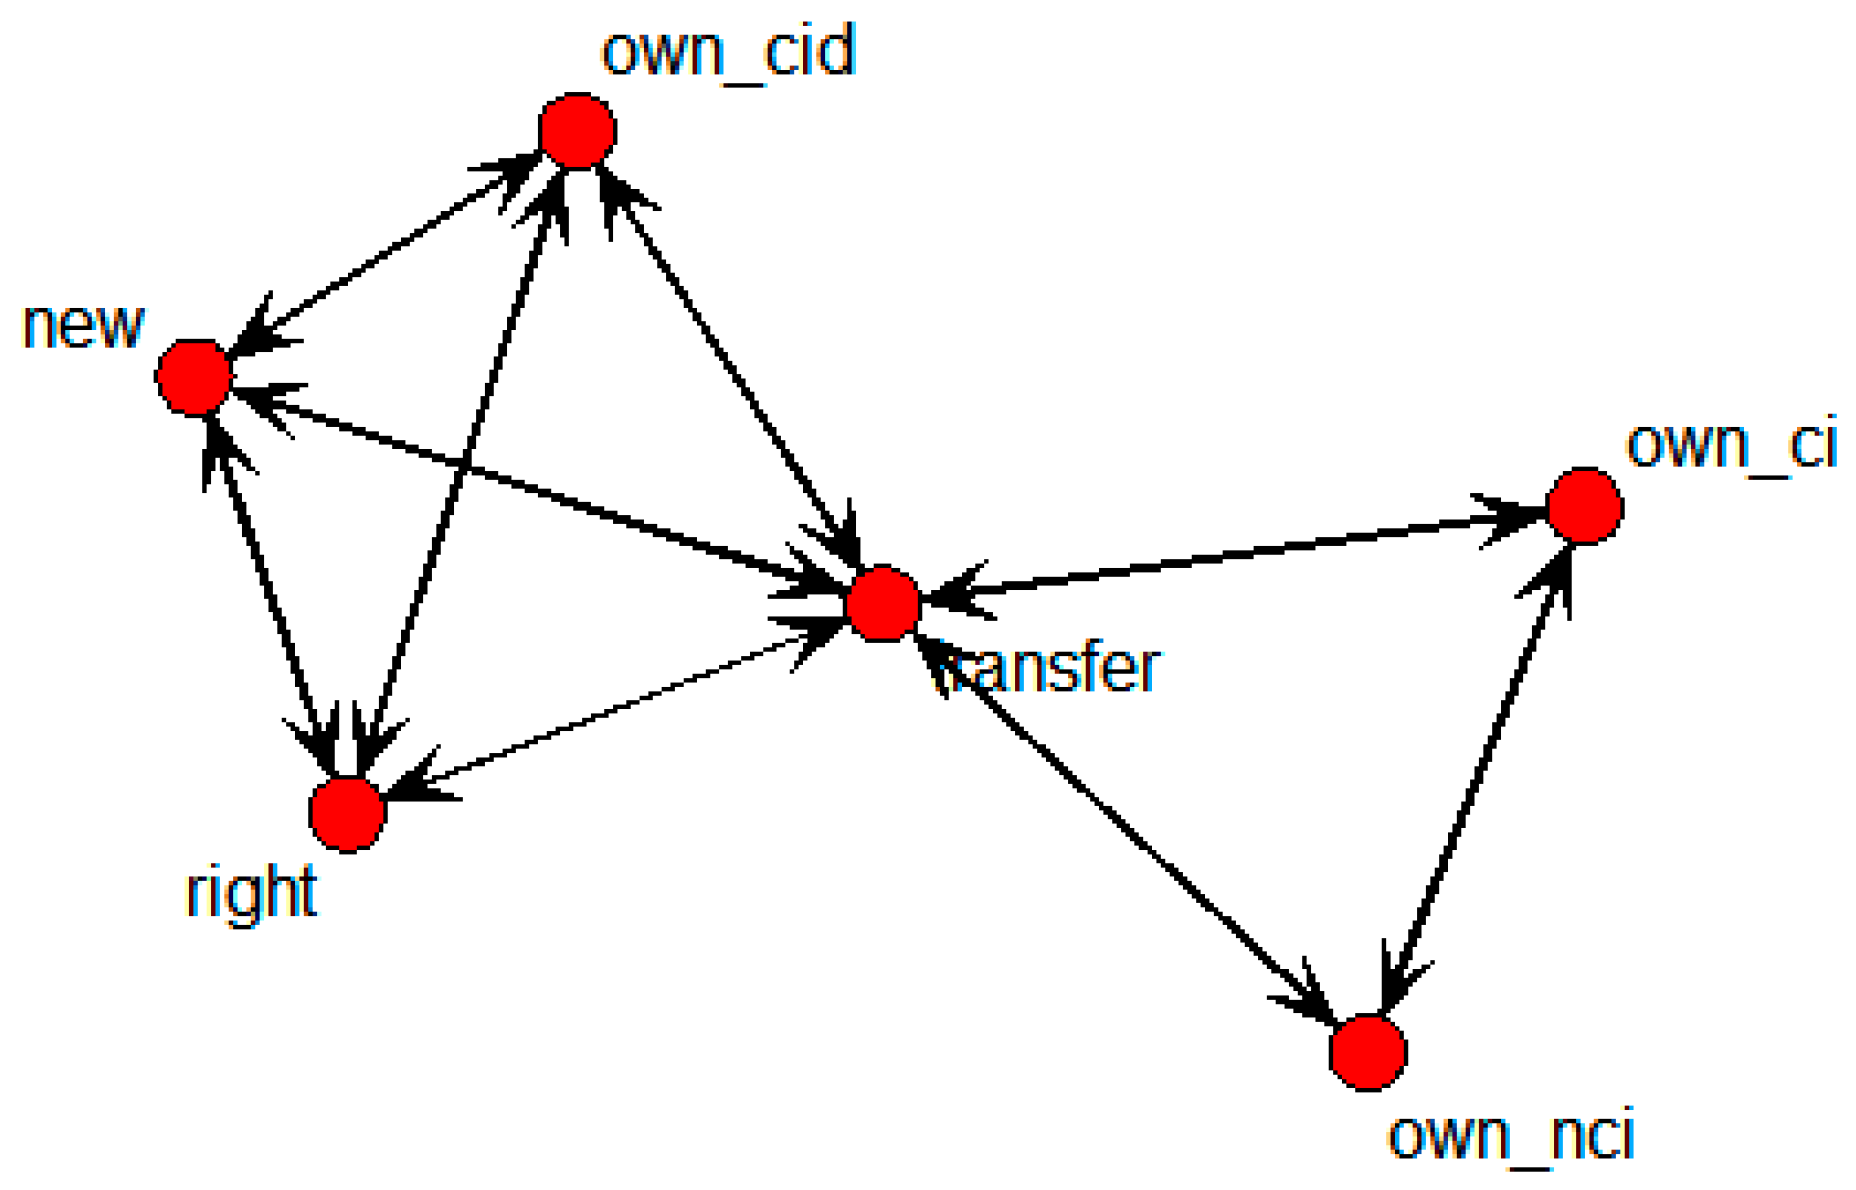
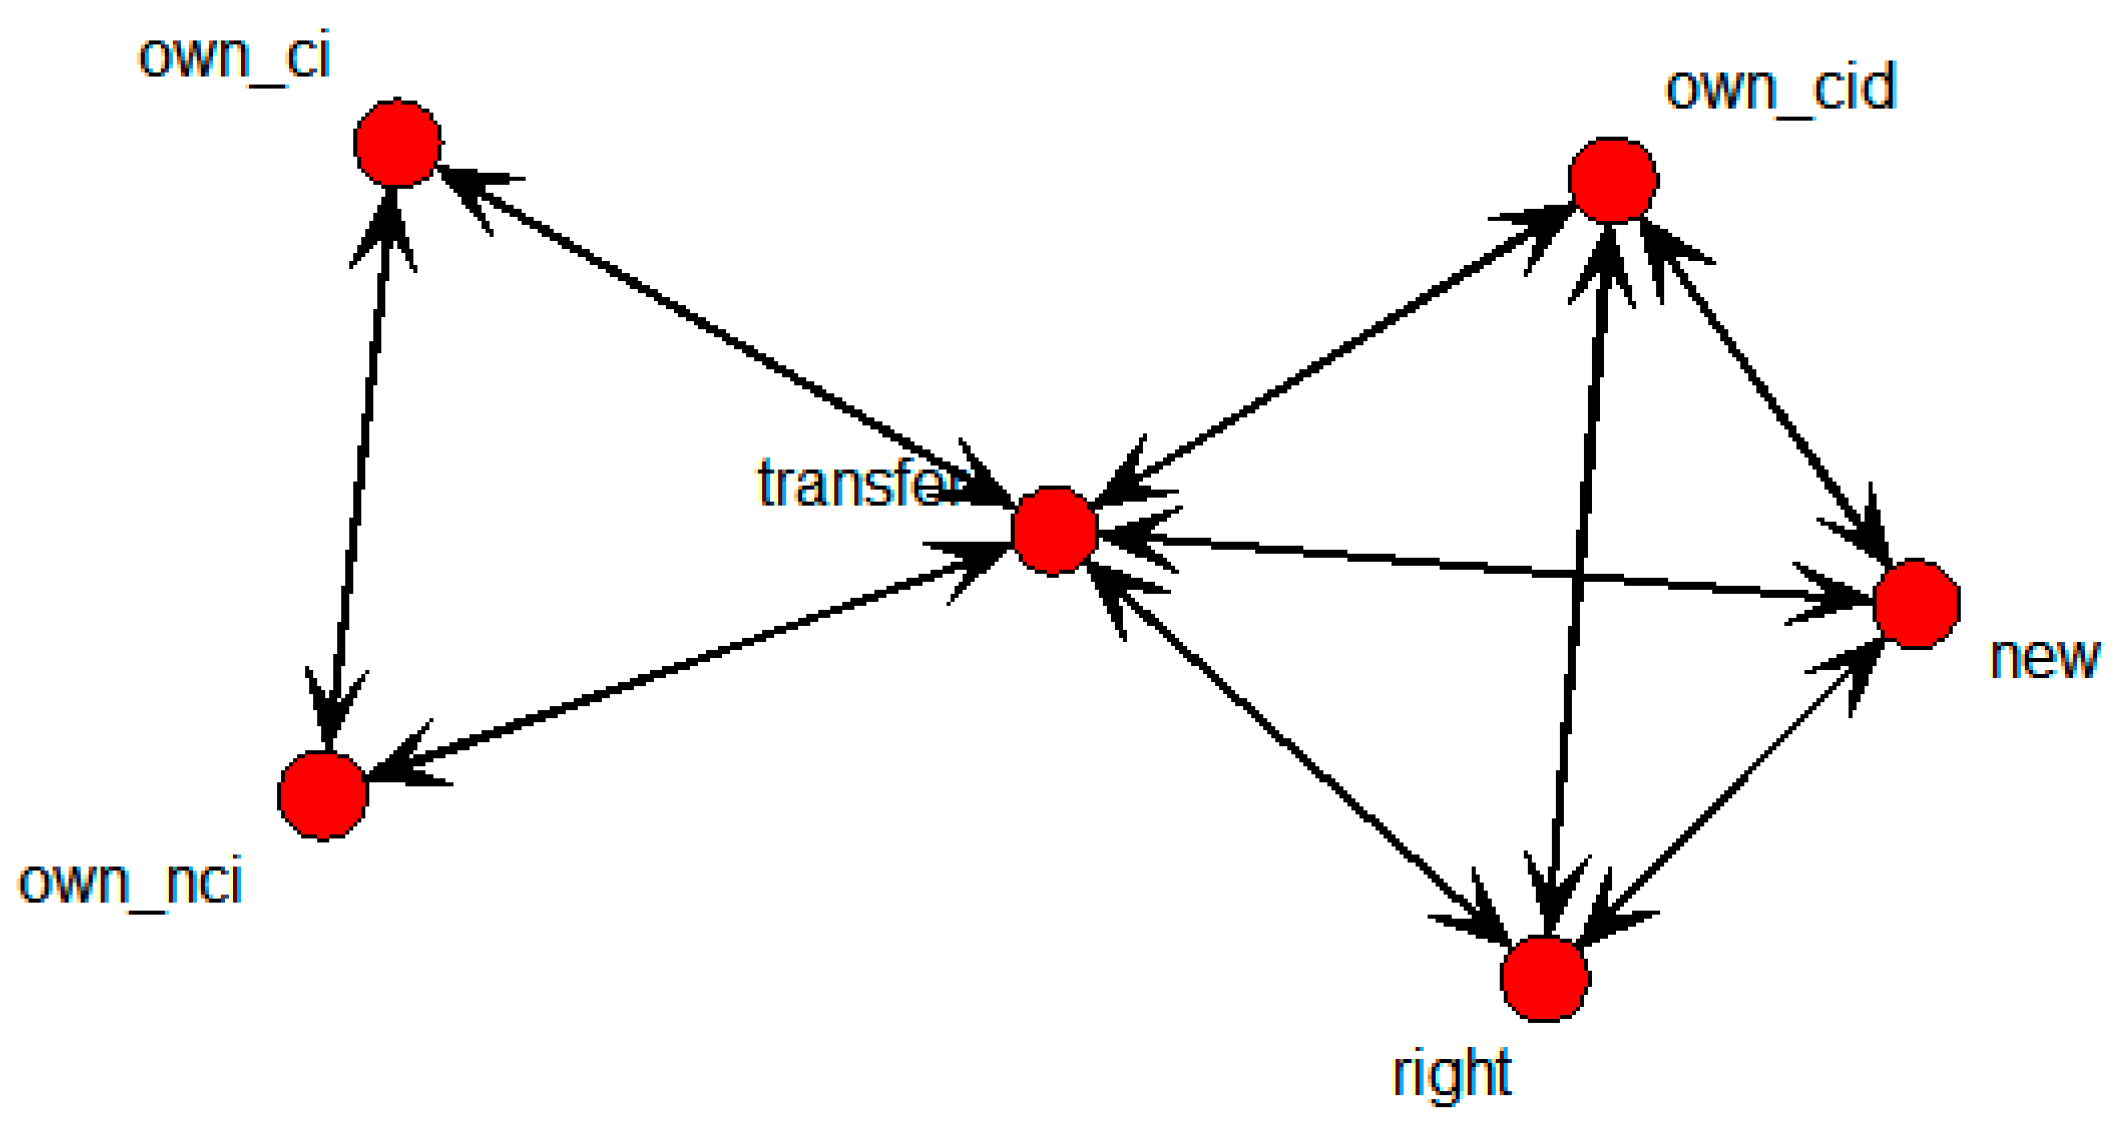
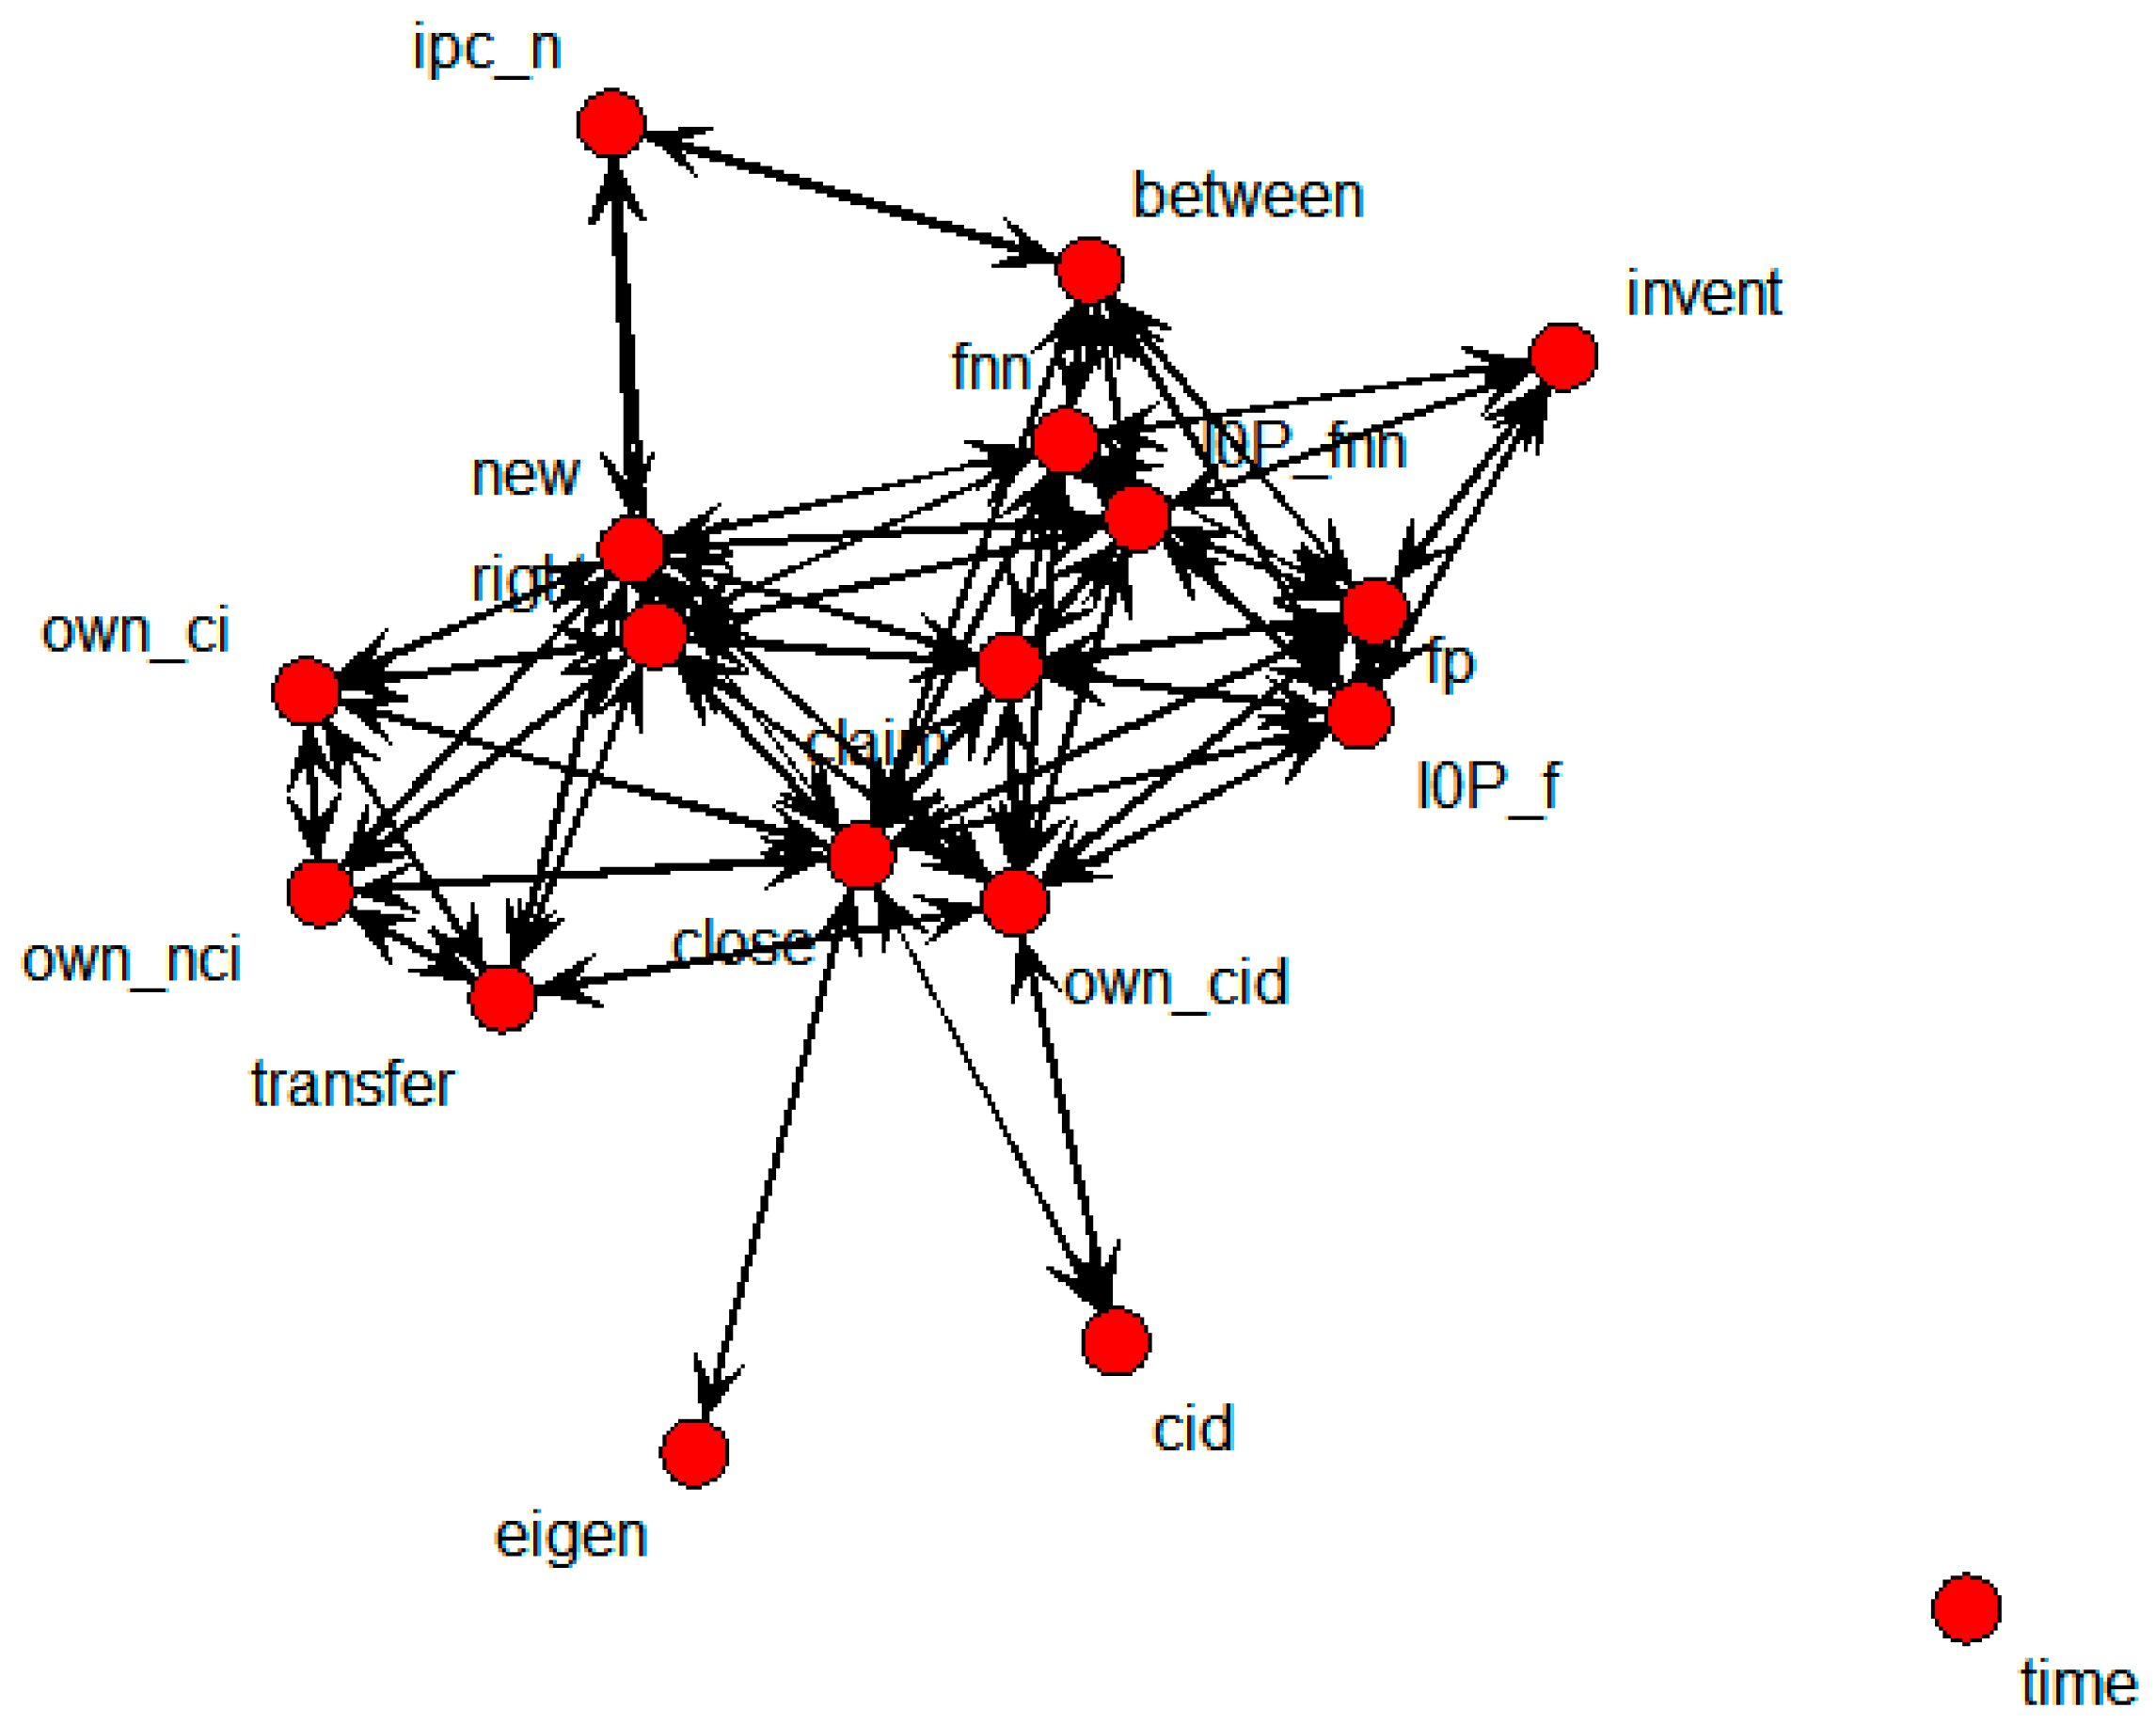
This shows that own_ci, own_cid, own_nci, new, and right were directly connected with the transfer node. It means that technology transfers were influenced by the number of backward and forward citations within domestic patents, citations within domestic patents, novelty, and the degree of rights. The SNA graph showing only the above variables is shown in
Figure 6 below.
Figure 6.
Specific SNA graph of technology transfer for whole data.
Figure 6.
Specific SNA graph of technology transfer for whole data.
Nodes in the above graph influenced not only transfer, but also own_cid and right. That is, new directly influenced transfer as well as own_cid; own_cid then influenced transfer. Moreover, new influenced right, and then right influenced transfer. In other words, new both directly and indirectly influenced transfer. The calculated weighted values in the above figure are shown in
Table 2.
Table 2.
Connection weight values in the social network analysis (SNA) graph of technology transfer for whole data.
Table 2.
Connection weight values in the social network analysis (SNA) graph of technology transfer for whole data.
| Relation | Beta | p-Value |
|---|
| transfer | own_cid | 0.119 | 0.0002 |
| new | −0.220 | 0.0001 |
| right | 0.212 | 0.0001 |
| own_ci | 0.128 | 0.0001 |
| own_nci | 0.128 | 0.0001 |
| own_ci | own_nci | 1.000 | 0.0001 |
| own_cid | new | −0.294 | 0.0001 |
| right | −0.278 | 0.0001 |
| new | right | 0.976 | 0.0001 |
The normalized regression coefficient (beta) was used to calculate each node’s weighted connection values in the SNA graph. As the beta value gets higher, relations between the nodes are strengthened; new (0.220) and right (0.212) showed the highest weighted values with transfer, followed by own_ci (0.128), own_nci (0.128), and own_cid (0.119). That is, the most influential factors of technology transfer were a patent’s novelty and its degree of right; new influenced transfer directly with a weight of 0.220 as well as indirectly via right with a weight of 0.220 × 0.976 = 0.215.
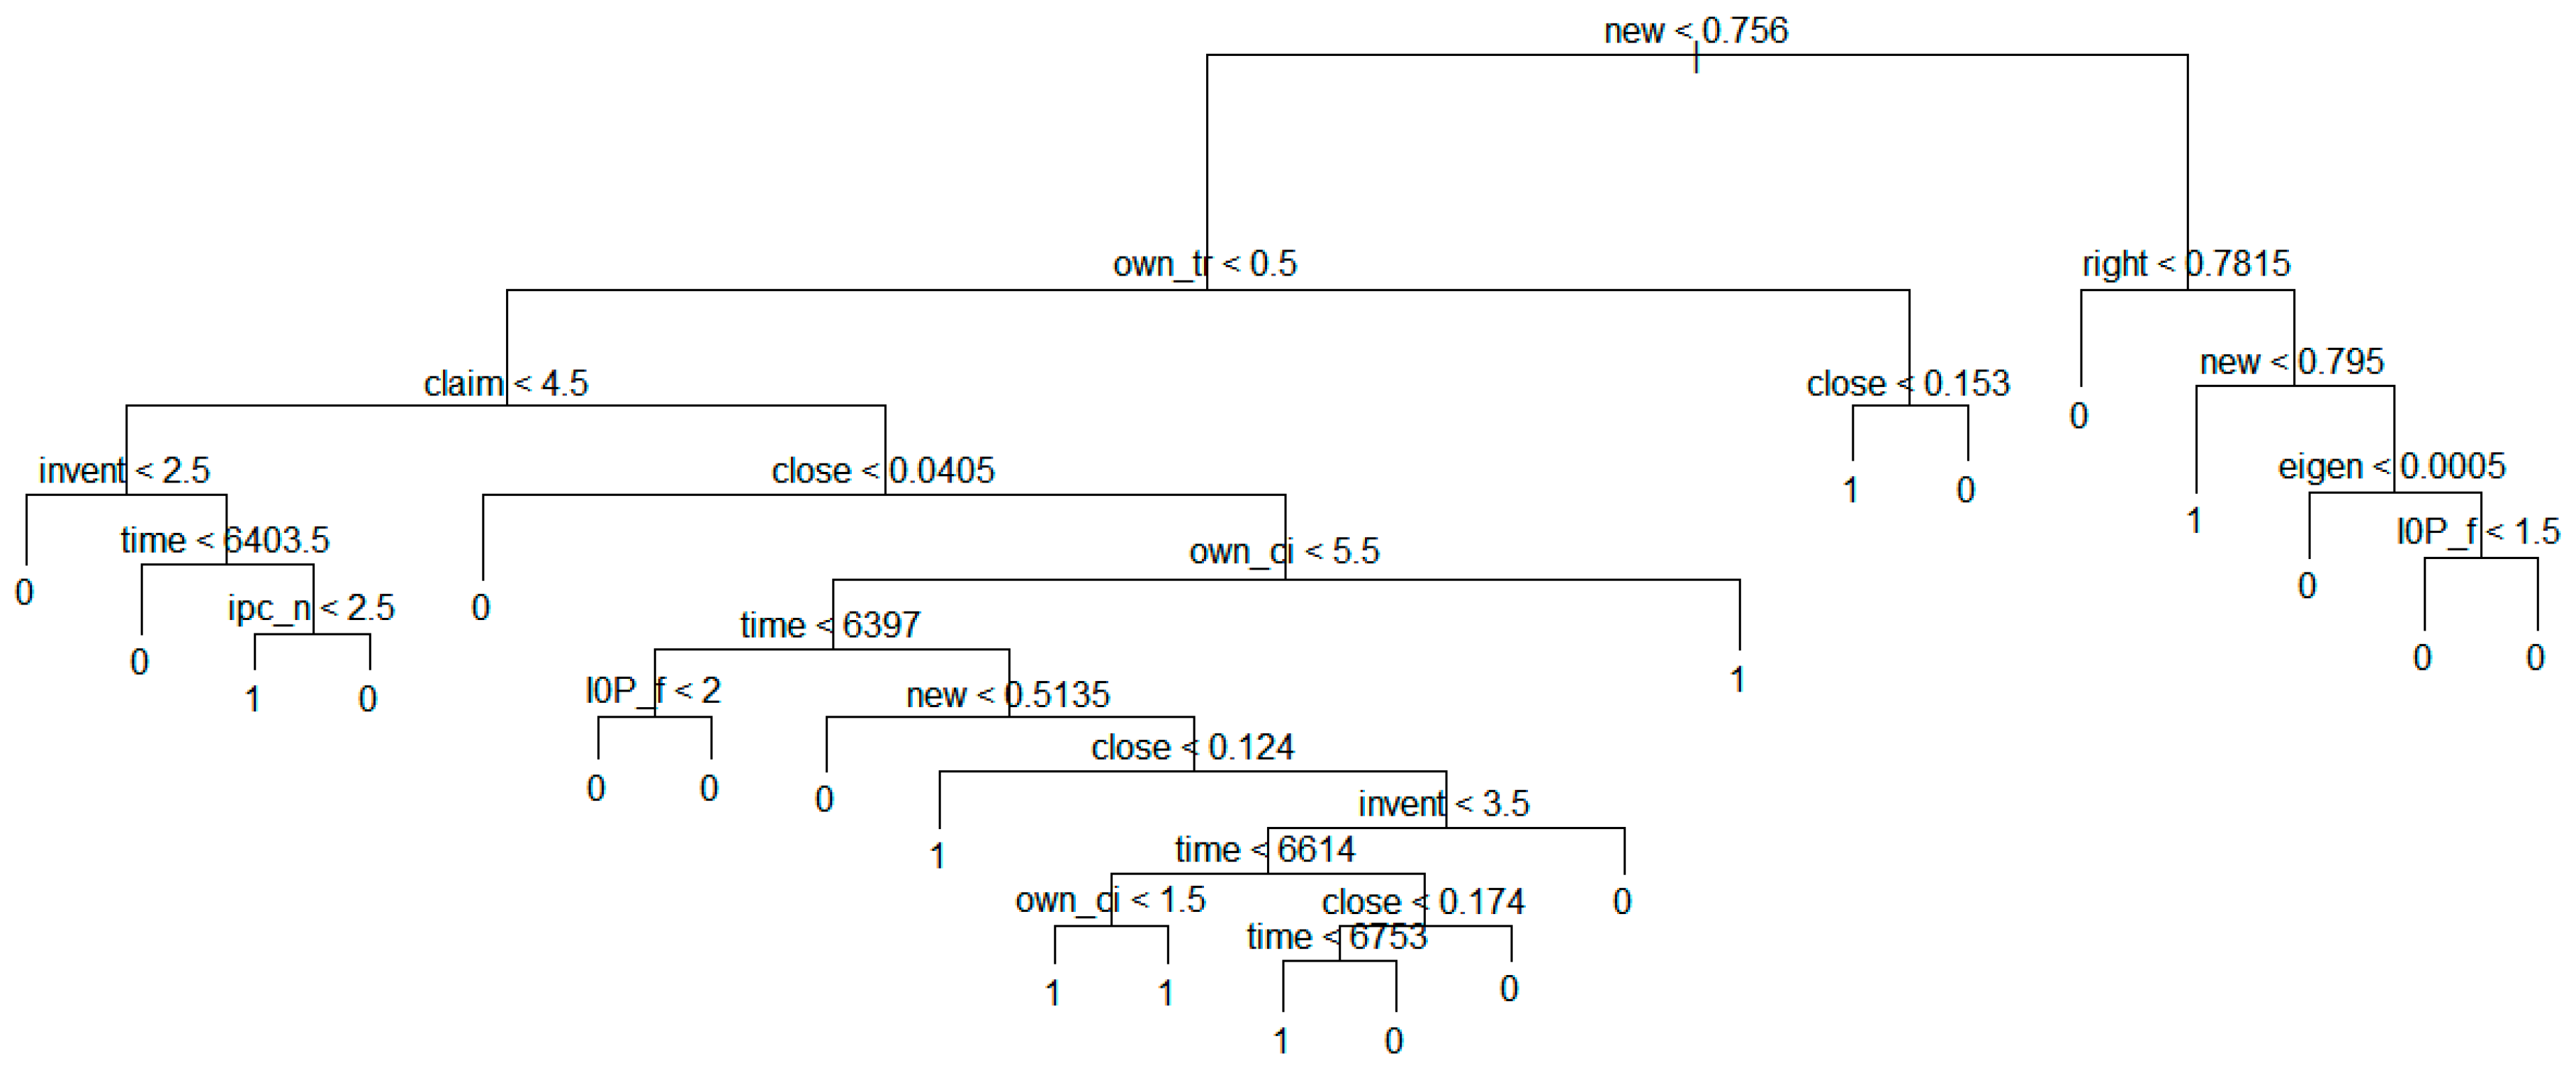
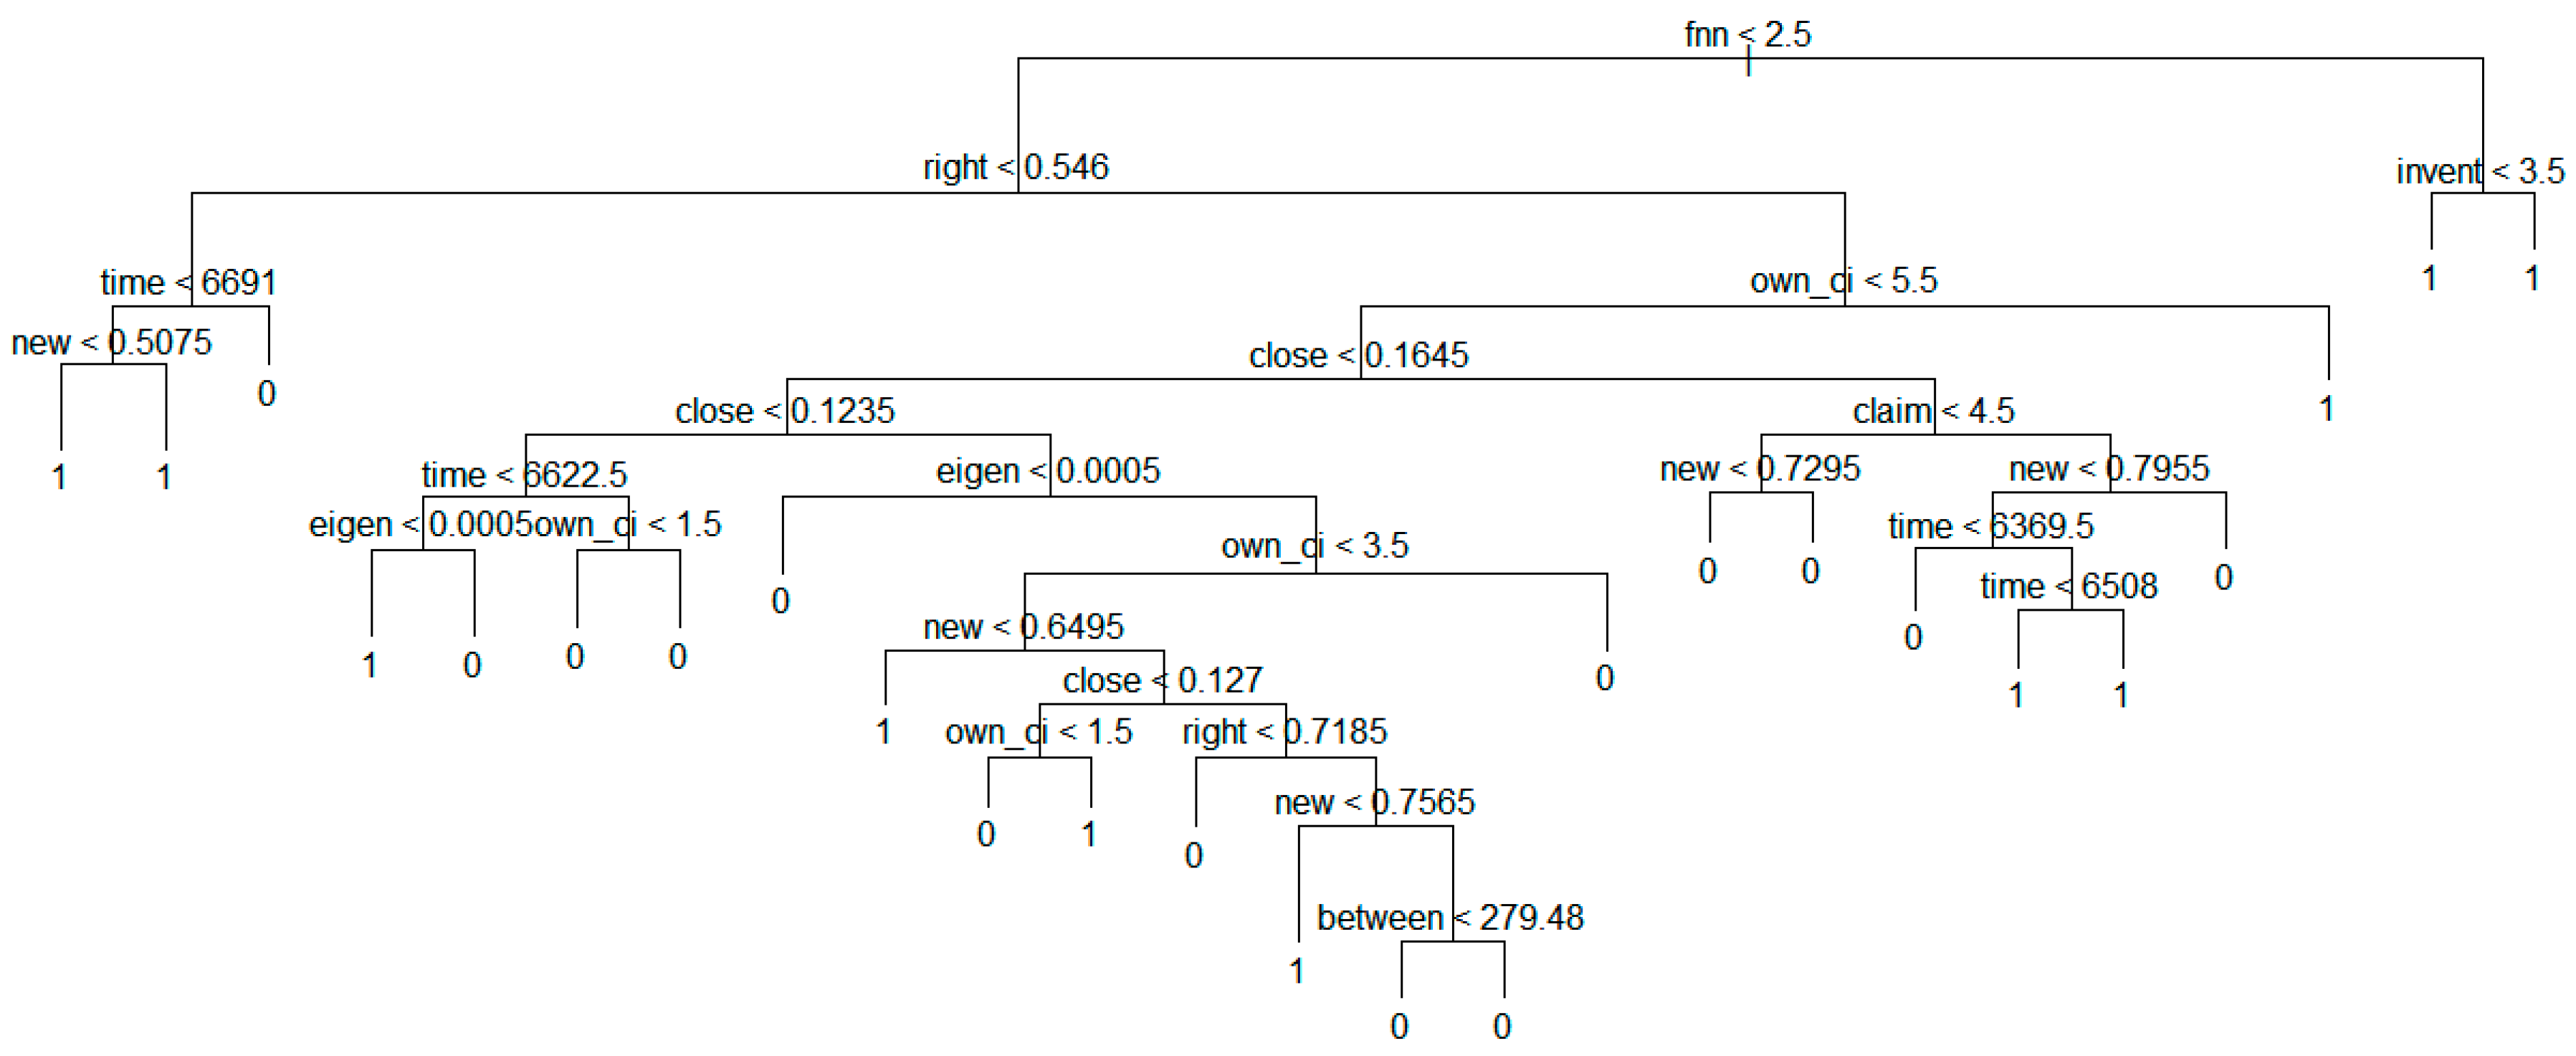
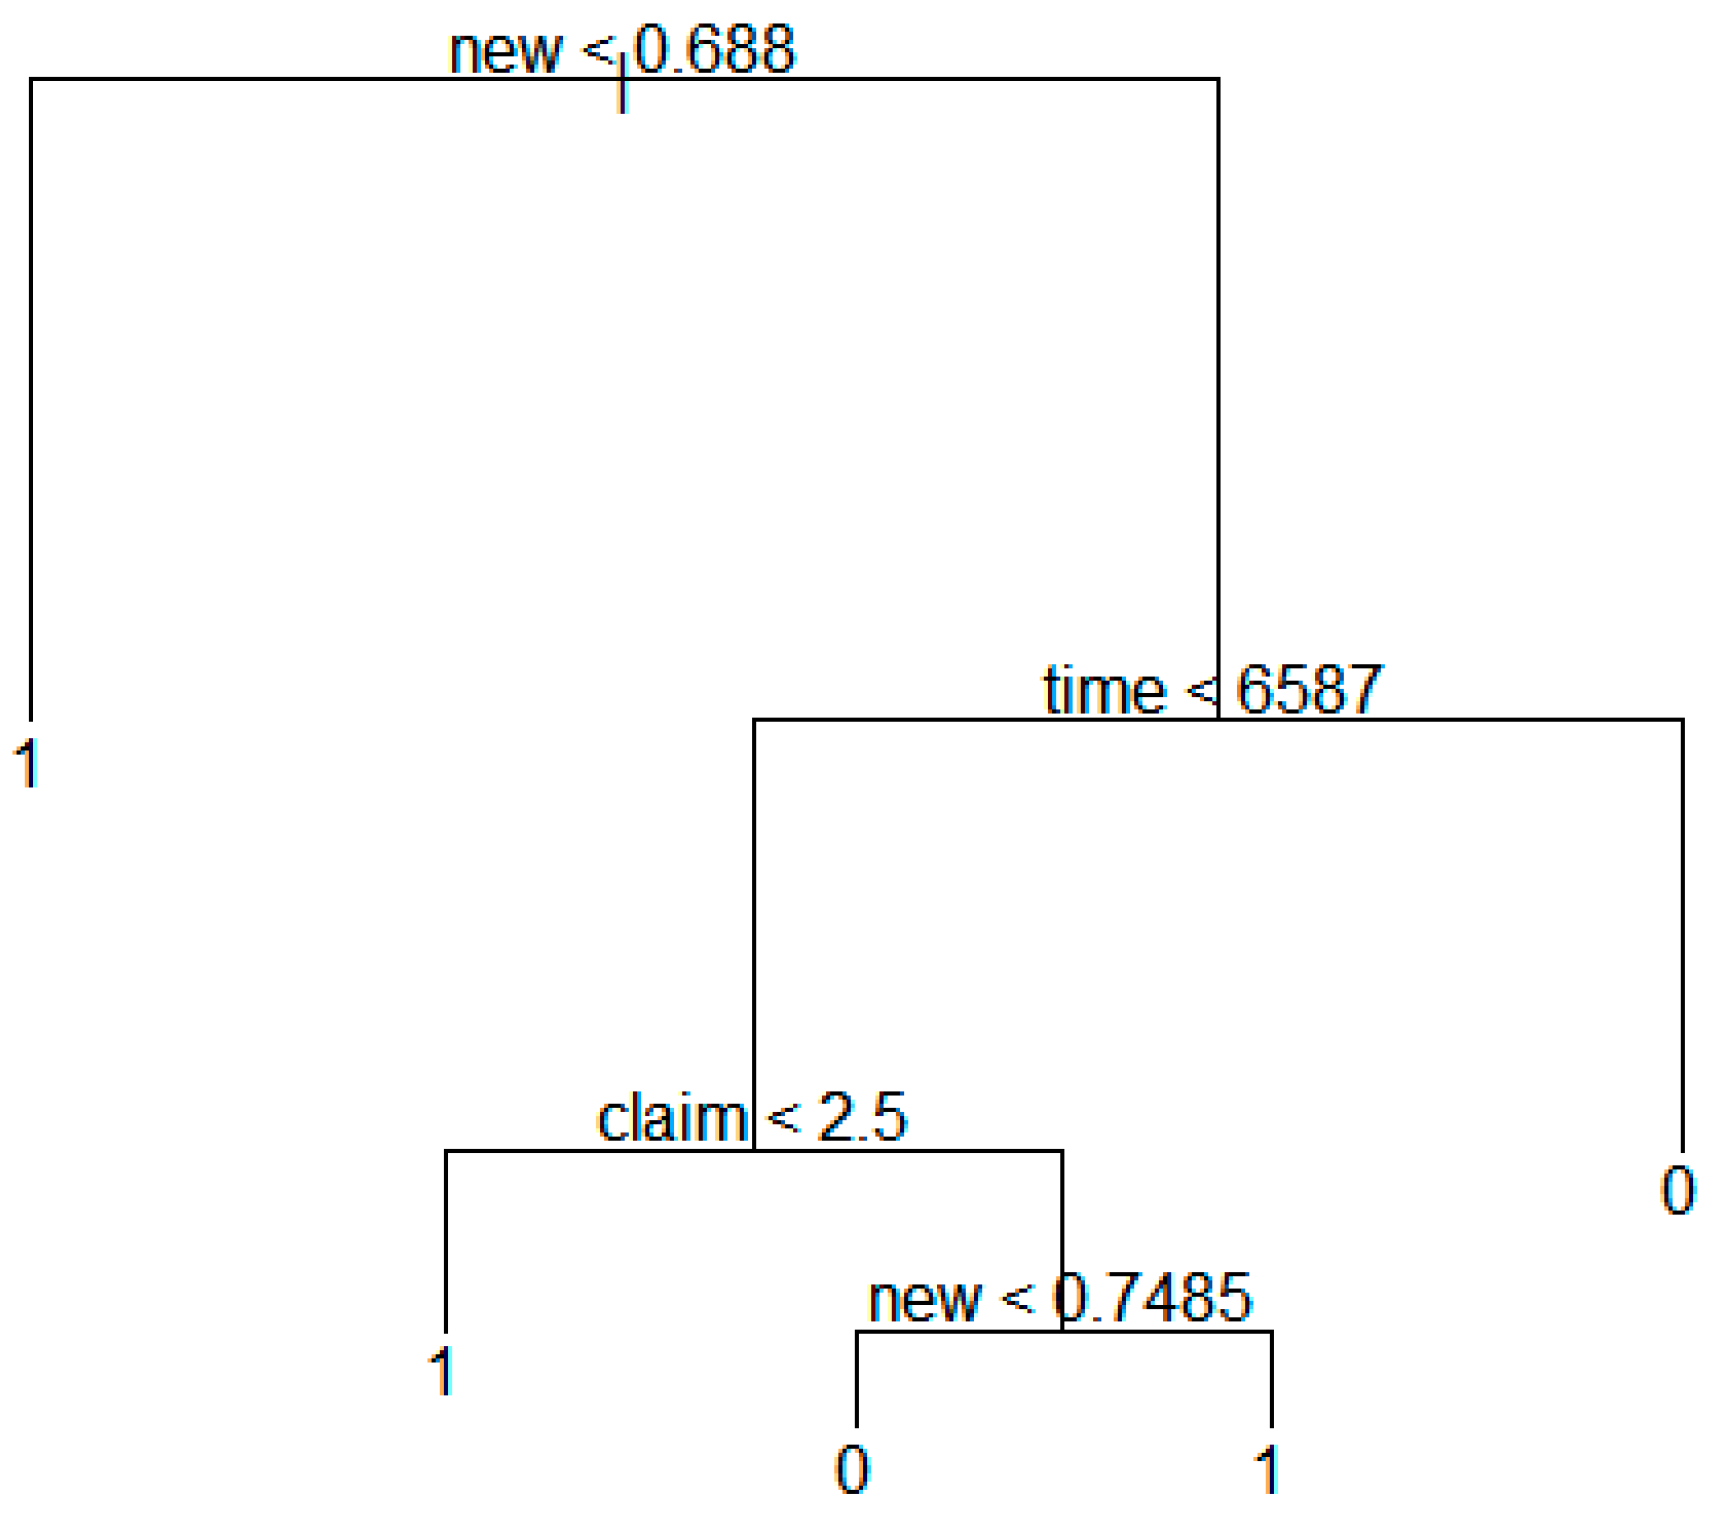
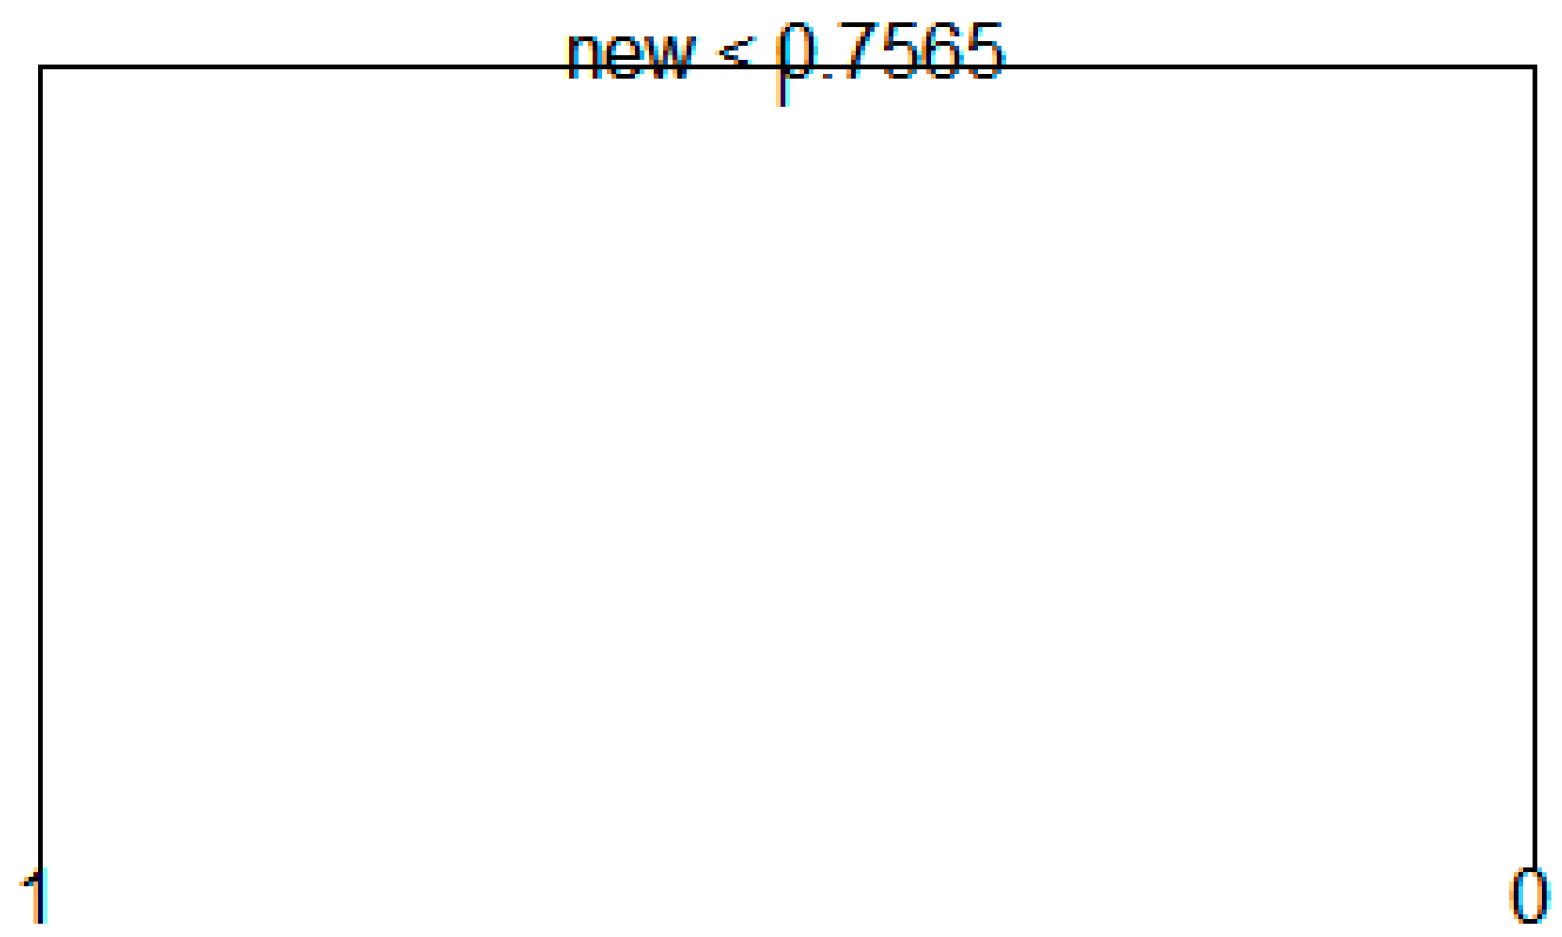
Figure 7 shows the result of the decision tree model based on the technology transfer results for the whole dataset.
Figure 7.
Decision tree model based on technology transfer results for whole data.
Figure 7.
Decision tree model based on technology transfer results for whole data.
The above figure shows that the transfer value becomes 1 if new is smaller than 0.7565. In addition, we found entire tree structure for predicting technology transfer. In next sections, we show the more detailed tree structures according to the groups.
4.2. Technology Transfer Prediction for Patent Data of National Research Institutes
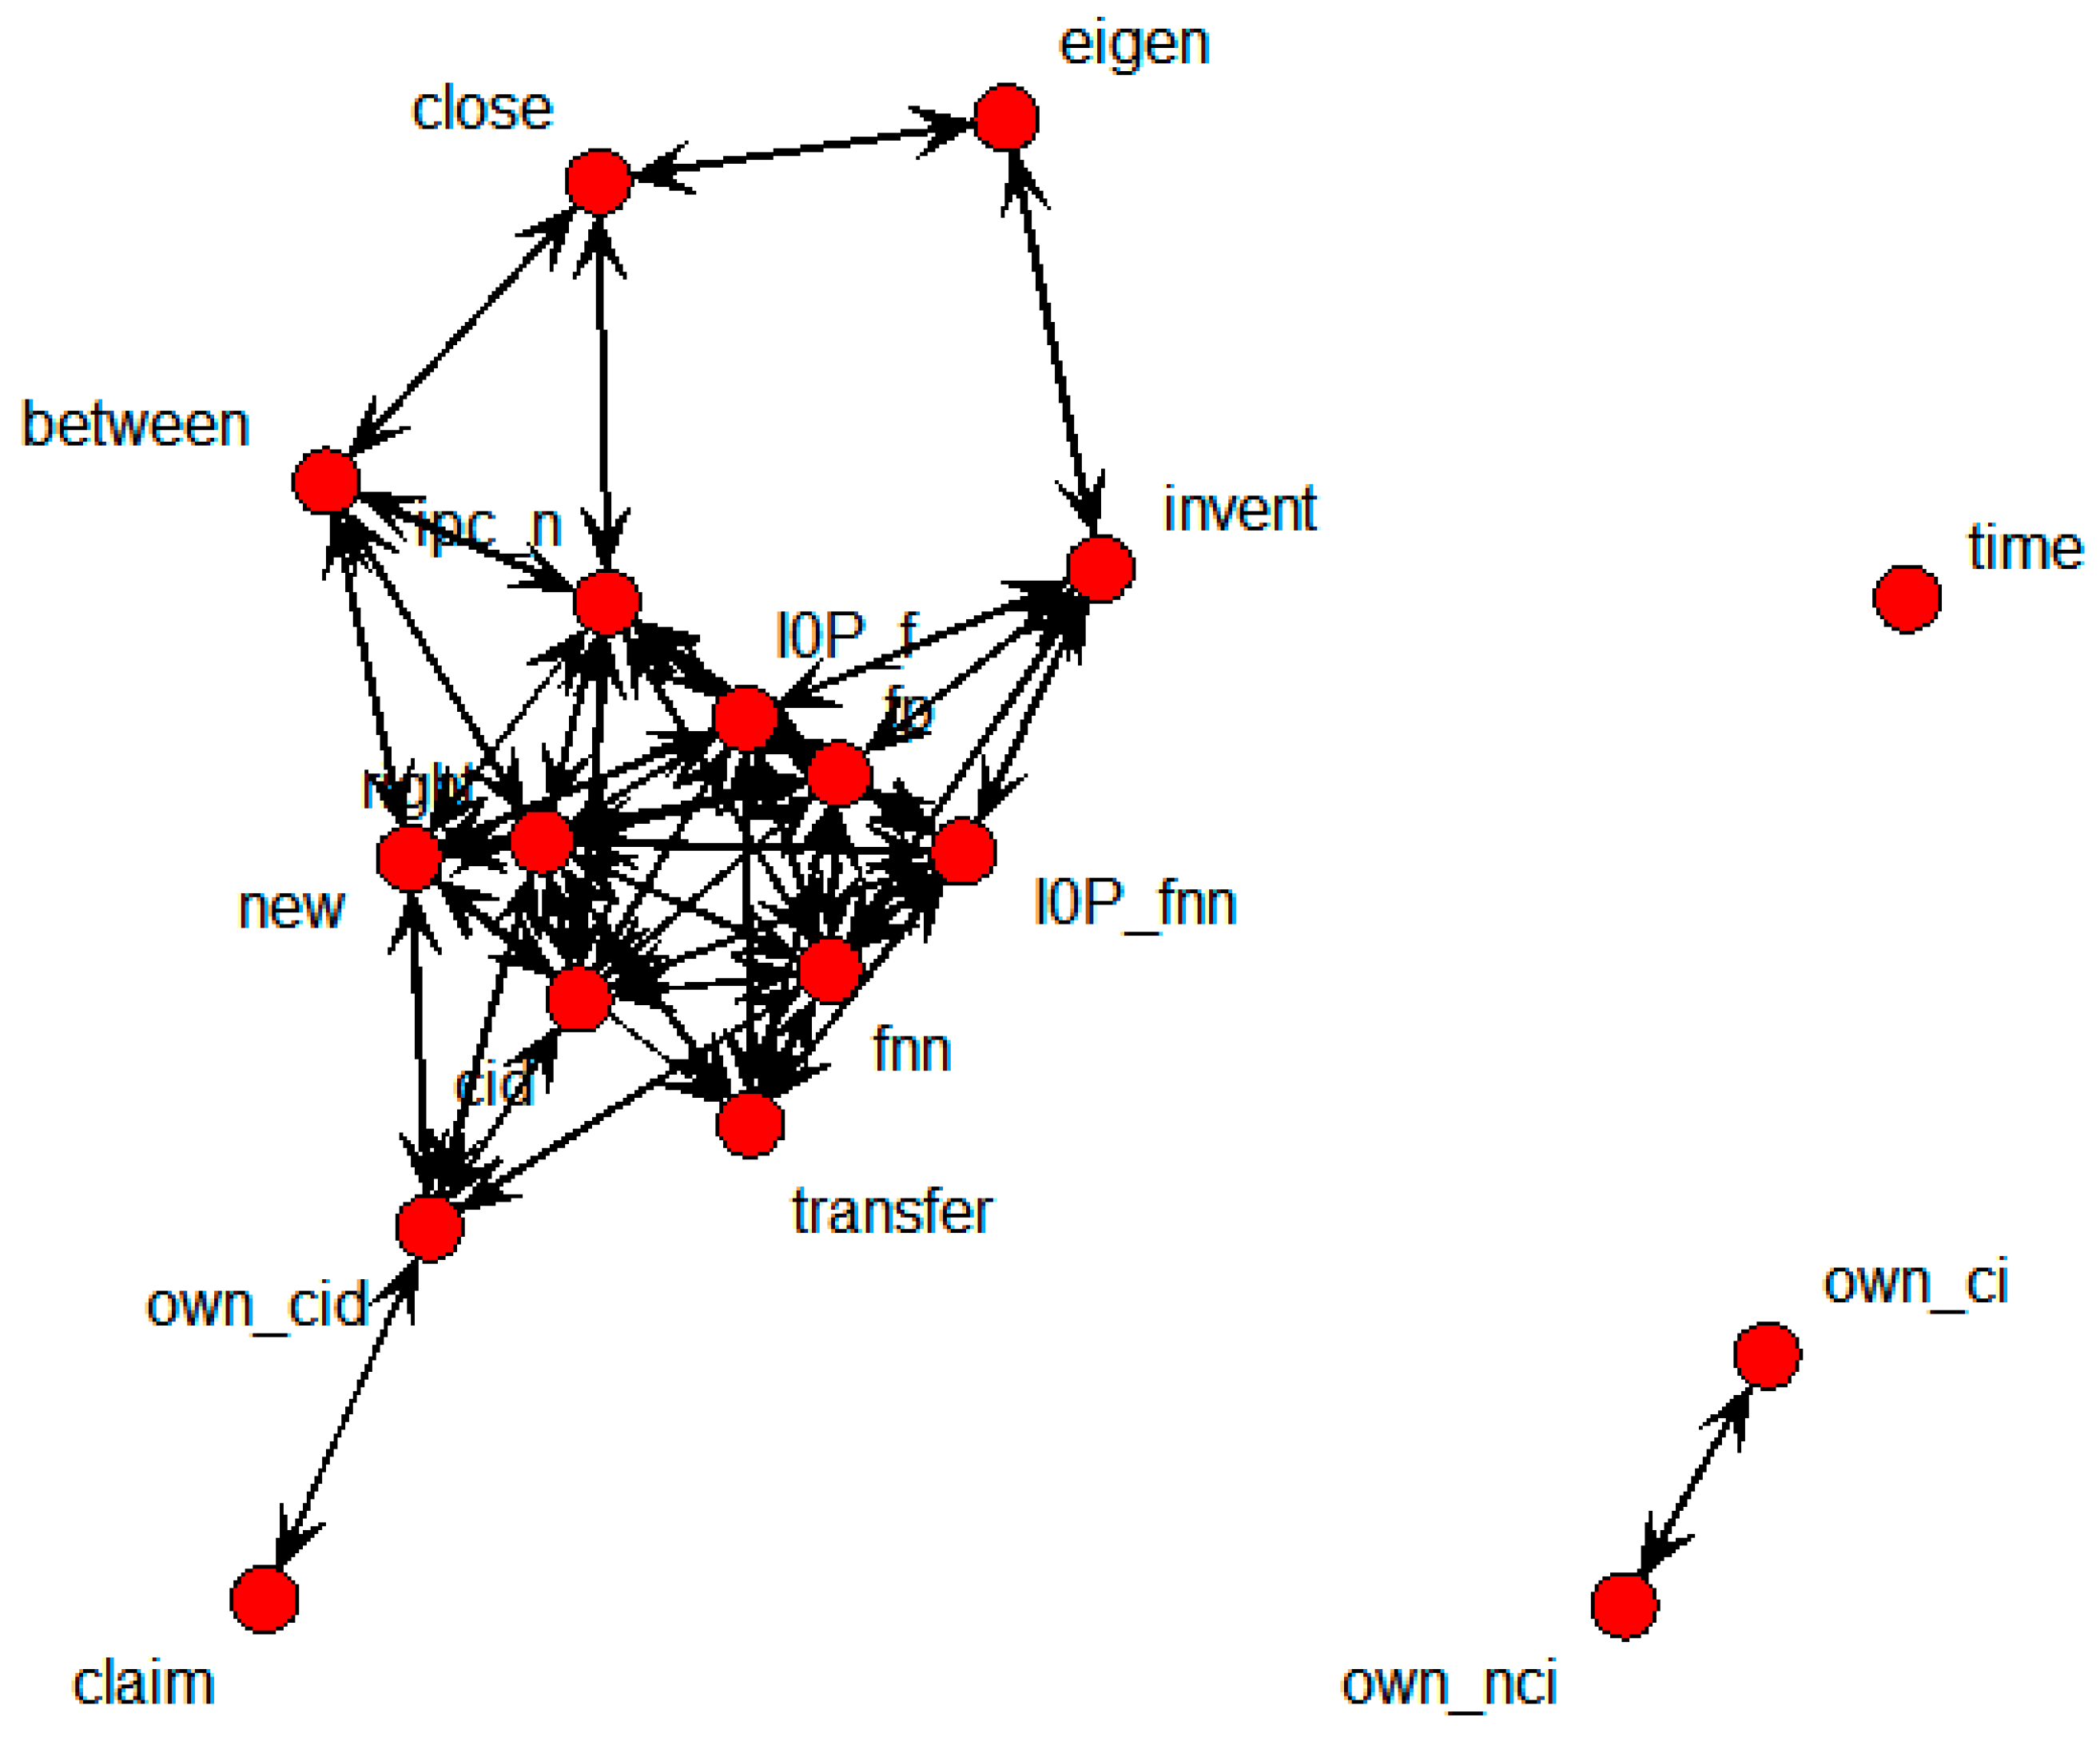
Figure 8 shows the SNA graph depicting the structure of variables that influence technology transfer in national research institutes.
Figure 8.
SNA Graph of technology transfer results in national research institutes.
Figure 8.
SNA Graph of technology transfer results in national research institutes.
The transfer node, representing whether technology was transferred or not, was directly connected with own_ci, own_cid, own_nci, new, and right nodes. These were considered to be nodes that influenced technology transfer.
Figure 9 shows the specific SNA graph of the independent variables directly connected to the transfer node.
Figure 9.
Specific SNA graph of technology transfer results in national research institutes.
Figure 9.
Specific SNA graph of technology transfer results in national research institutes.
It can be seen that new, own_nci, own_ci, and own_cid were in close relationship with right; new was also connected with own_cid, own_nci, and own_ci; while own_nci was connected with own_ci. Regression analysis was then conducted to test the statistical validity of the relationships.
Table 3 shows the results of the regression analysis.
Table 3.
Connection weighted values of the specific SNA graph in national research institutes.
Table 3.
Connection weighted values of the specific SNA graph in national research institutes.
| Relation | Beta | p-Value |
|---|
| transfer | own_cid | 0.118 | 0.0197 |
| right | −0.267 | 0.0001 |
| new | −0.280 | 0.0001 |
| own_nci | 0.190 | 0.0001 |
| own_ci | 0.190 | 0.0001 |
| right | new | 0.972 | 0.0001 |
| own_nci | −0.138 | 0.0065 |
| own_ci | −0.138 | 0.0065 |
| own_cid | −0.271 | 0.0001 |
| new | own_cid | −0.286 | 0.0001 |
| own_nci | −0.164 | 0.0012 |
| own_ci | −0.164 | 0.0012 |
| own_nci | own_ci | 1.000 | 0.0001 |
The regression analysis shows that there is statistical significance in all correlations between variables. Finally, a decision tree model was constructed to extract the structure of variables influencing technology transfer.
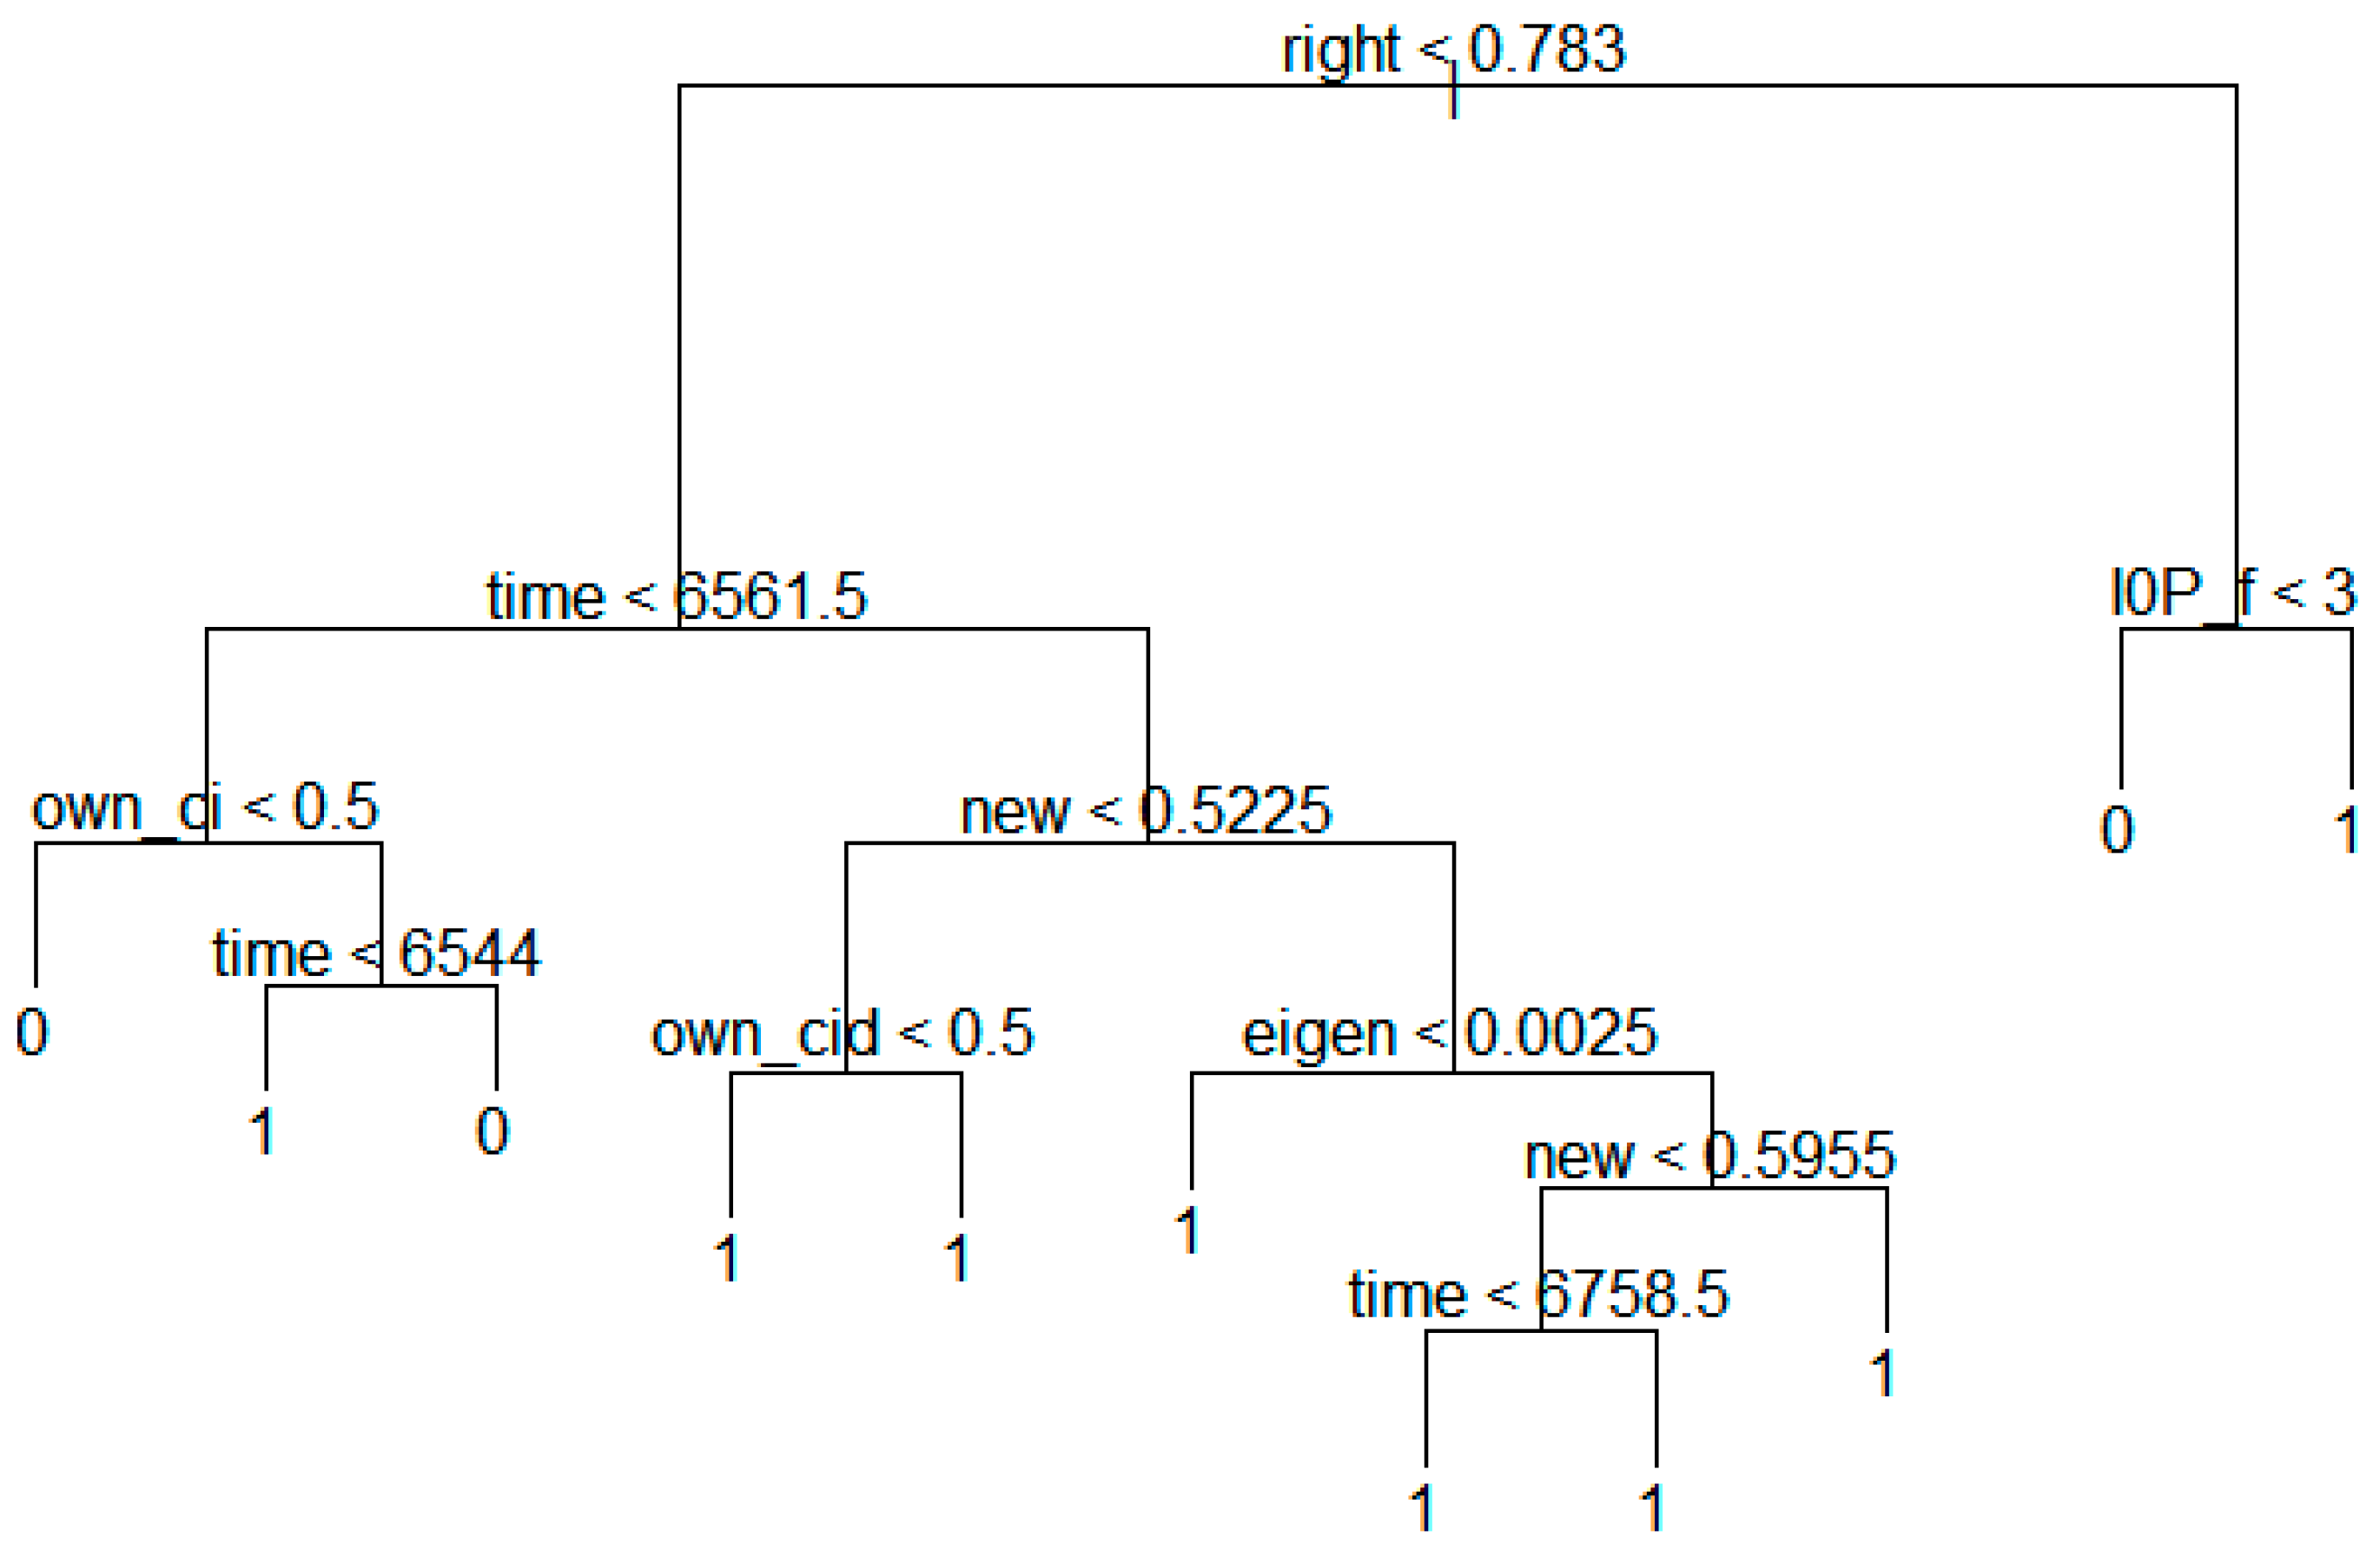
Figure 10 shows the decision tree model constructed by the technology transfer results of national research institutes.
The above figure shows that the variables influence the transfer node in the following order:
Many national research institutes can validate their technology transfer strategies against this analytical result. That is, in the case of national research institutes, the variable of “right” (Degree of the rights) is the most important. If the value of right is less than 0.783, we go to left stem, and compare the value of “time” (Expiration date − Registered date). Otherwise we go to right stem, and consider “I0P_f” (Number of INPADOC Family patents). In this same way, we can predict the possibility of technology transfer.
Figure 10.
Decision tree model based on technology transfer results of national research institutes.
Figure 10.
Decision tree model based on technology transfer results of national research institutes.
4.3. Technology Transfer Prediction for Patent Data of Public Universities
Figure 11 presents the SNA graph constructed from patents obtained by public universities, to display the relations between technology transfer and influential variables.
Figure 11.
SNA graph of technology transfer results in public universities.
Figure 11.
SNA graph of technology transfer results in public universities.
The nodes that were directly connected with the transfer node were own_ci, own_cid, own_nci, new, and right. These nodes thus represent variables that influenced technology transfer.
Figure 12 shows the specific SNA graph of the independent variables directly connected to the transfer node.
While the own_ci, own_nci, own_cid, and new nodes directly influence the transfer node, it can be seen that own_ci is influenced by own_nci and own_nci is influenced by right and new. Lastly, new and right are in relation. These relations were analyzed by regression analysis for statistical significance with the results shown in
Table 4.
Figure 12.
Specific SNA graph of technology transfer results in public universities.
Figure 12.
Specific SNA graph of technology transfer results in public universities.
Table 4.
Connection weighted values of the specific SNA graph in public universities.
Table 4.
Connection weighted values of the specific SNA graph in public universities.
| Relation | Beta | p-Value |
|---|
| transfer | own_ci | 0.119 | 0.0938 |
| own_nci | 0.120 | 0.0935 |
| own_cid | 0.211 | 0.0029 |
| new | −0.243 | 0.0006 |
| right | −0.241 | 0.0006 |
| own_ci | own_nci | 1.000 | 0.0001 |
| own_cid | right | −0.372 | 0.0001 |
| new | −0.371 | 0.0001 |
| new | right | 0.987 | 0.0001 |
The regression analysis showed that all relations among variables were statistically significant. Finally, a decision tree model was constructed to extract the structure of variables influential to technology transfers.
Figure 13 shows the structure.
Figure 13.
Decision tree model based on technology transfer results in public universities.
Figure 13.
Decision tree model based on technology transfer results in public universities.
The above figure shows that the variable with the most influence on technology transfer is new. It is possible to establish technology transfer strategies in public universities based on this result.
4.4. Technology Transfer Prediction for Patent Data from Private Universities
Figure 14 shows the SNA graph based on patents from private universities used to extract the relations between technology transfer and influential variables.
Figure 14.
SNA graph of technology transfer results in private universities.
Figure 14.
SNA graph of technology transfer results in private universities.
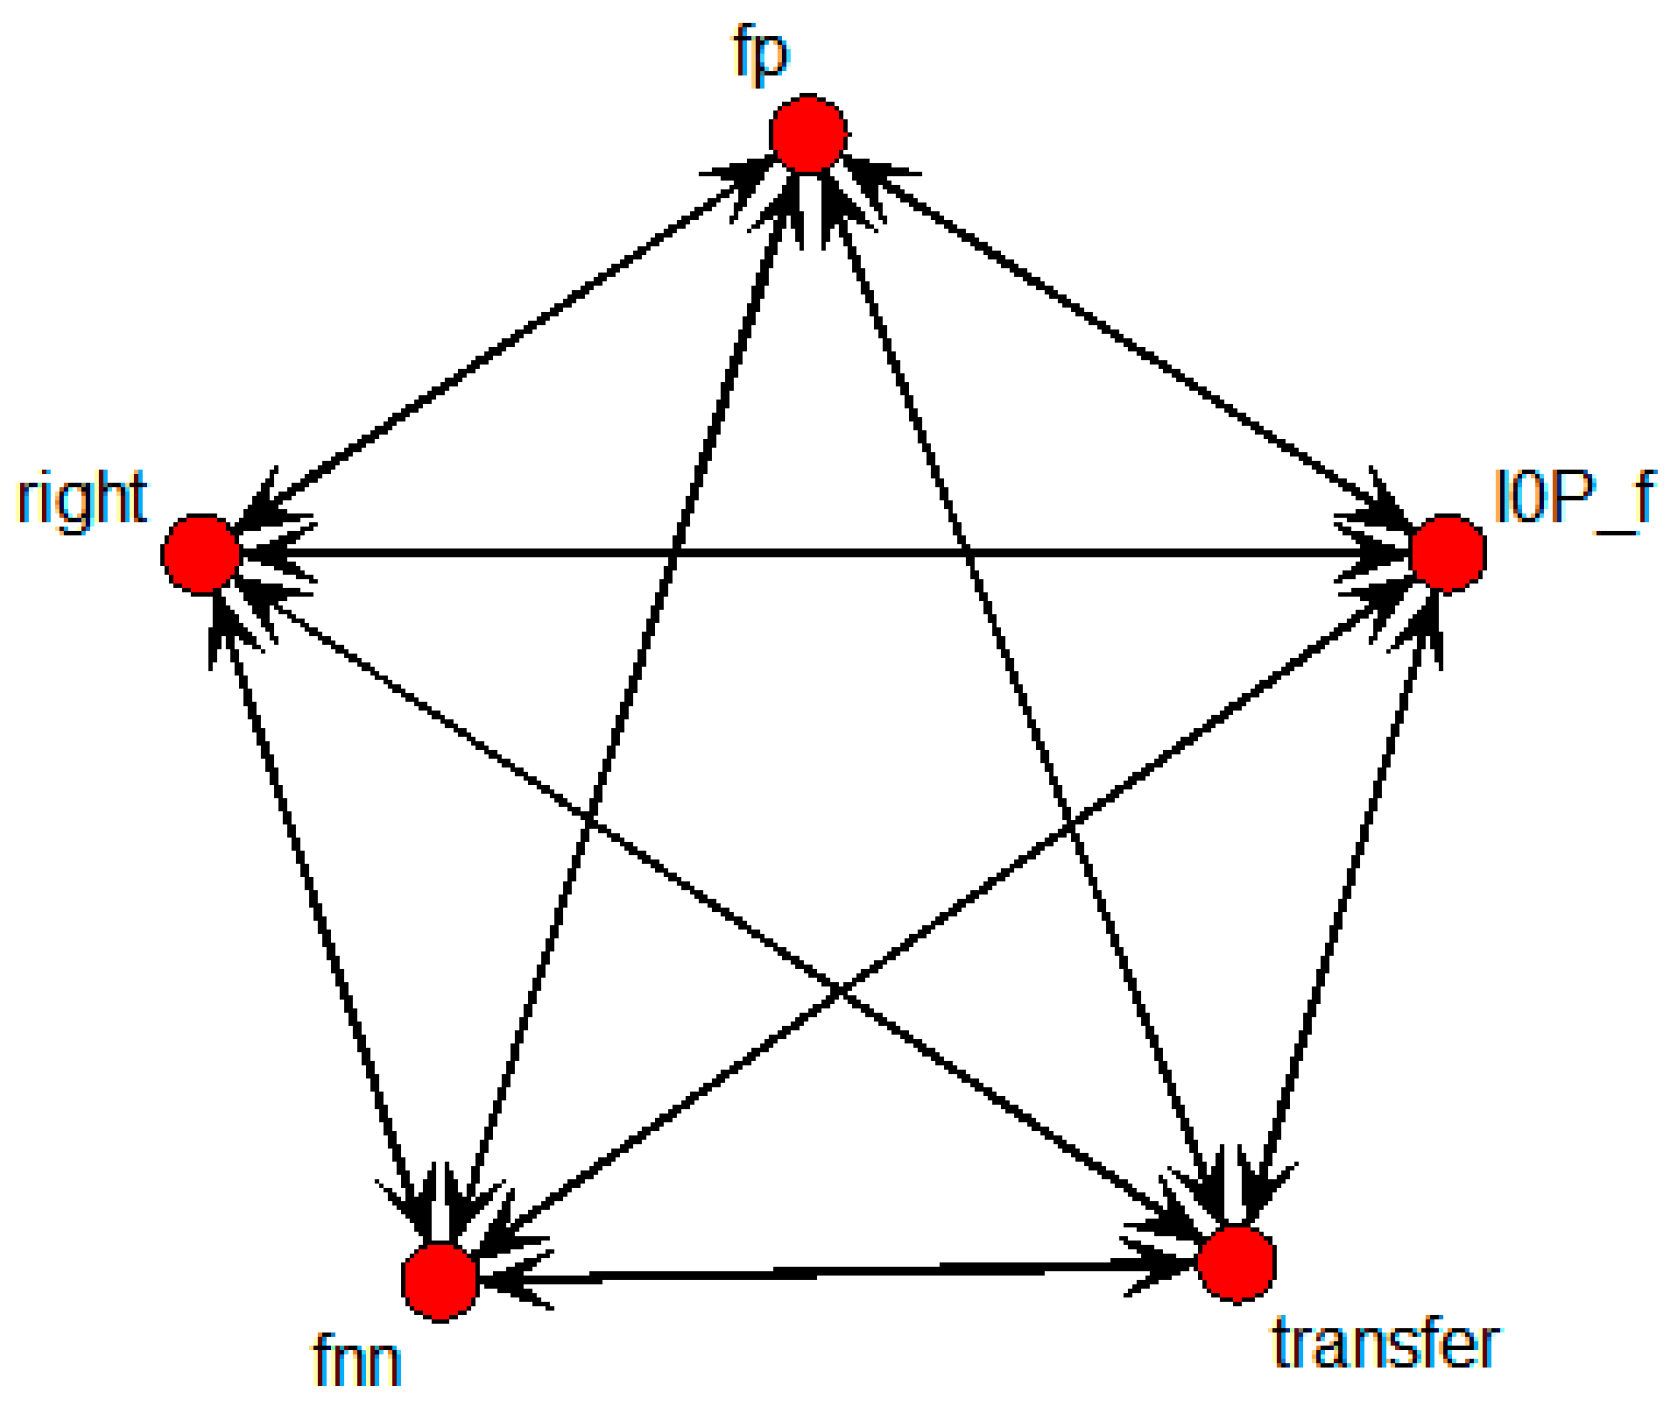
There were four nodes, fnn, fp, I0P_f, and right, that were directly connected with the transfer node. These four nodes were considered to be influential variables for technology transfer.
Figure 15 shows the specific SNA graph comprised only of those independent variables directly related to transfer.
Figure 15.
Specific SNA graph of technology transfer results in private universities.
Figure 15.
Specific SNA graph of technology transfer results in private universities.
In this case, fp, I0P_f, fnn, and right were extracted as variables with influence on the transfer node; fp was influenced by I0P_f, fnn, and right, while I0P_f was influenced by fnn and right. Lastly, there was a relation between fnn and right.
Table 5 shows the regression analysis results for statistical significance.
The regression analysis results showed that all variables were statistically significant. Next, the structure of variables with influence on technology transfer was shown by constructing the decision tree, as shown in
Figure 16.
The above figure shows that the variables influence the transfer node in the following order:
These results should enable private universities to develop technology transfer strategies.
Table 5.
Connection weighted values of the specific SNA graph in private universities.
Table 5.
Connection weighted values of the specific SNA graph in private universities.
| Relation | Beta | p-Value |
|---|
| transfer | fp | 0.205 | 0.0015 |
| I0P_f | 0.205 | 0.0015 |
| fnn | 0.190 | 0.0033 |
| right | −0.204 | 0.0015 |
| fp | I0P_f | 1.000 | 0.0001 |
| fnn | 0.855 | 0.0001 |
| right | −0.195 | 0.0026 |
| I0P_f | fnn | 0.855 | 0.0001 |
| right | −0.195 | 0.0026 |
| fnn | right | −0.141 | 0.0293 |
Figure 16.
Decision tree model based on technology transfer results in private universities.
Figure 16.
Decision tree model based on technology transfer results in private universities.
4.5. Technology Transfer Prediction for Patent Data of Collaborative Research
The SNA graph showing relations between technology transfer and influential variables for collaborative research patents is presented in
Figure 17.
Figure 17.
SNA graph of technology transfer results for collaborative research.
Figure 17.
SNA graph of technology transfer results for collaborative research.
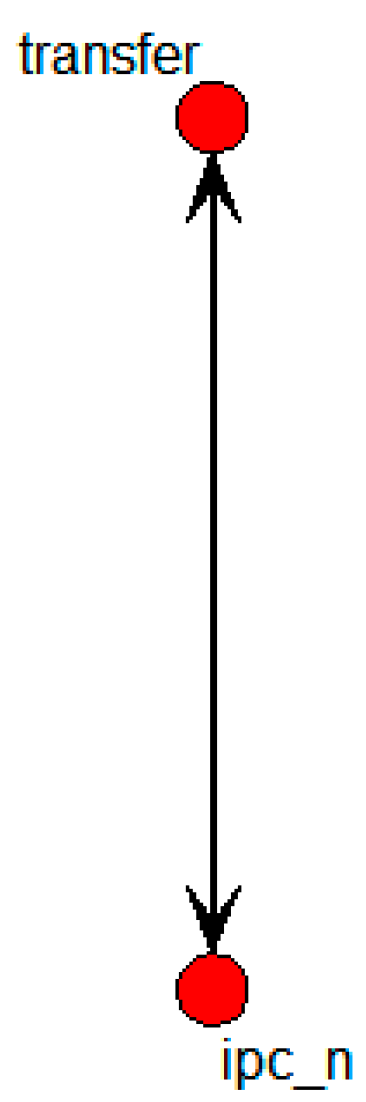
The graph shows that the ipc_n node alone was directly connected with the transfer node. This means that ipc_n was the only node that influenced technology transfer.
Figure 18 shows the specific SNA graph with the nodes of transfer and the sole independent variable of influence.
Figure 18.
Specific SNA graph of technology transfer results for collaborative research.
Figure 18.
Specific SNA graph of technology transfer results for collaborative research.
With ipc_n being the only variable that influenced the transfer node,
Table 6 shows the regression analysis result indicating the statistical significance of the relation.
Table 6.
Connection weighted value of specific SNA graph in collaborative research patents.
Table 6.
Connection weighted value of specific SNA graph in collaborative research patents.
| Relation | Beta | p-Value |
|---|
| transfer | ipc_n | 0.172 | 0.0481 |
The regression analysis results showed that the relation was statistically significant. Finally, the decision tree model was constructed to extract the structure of variables with influence on technology transfer.
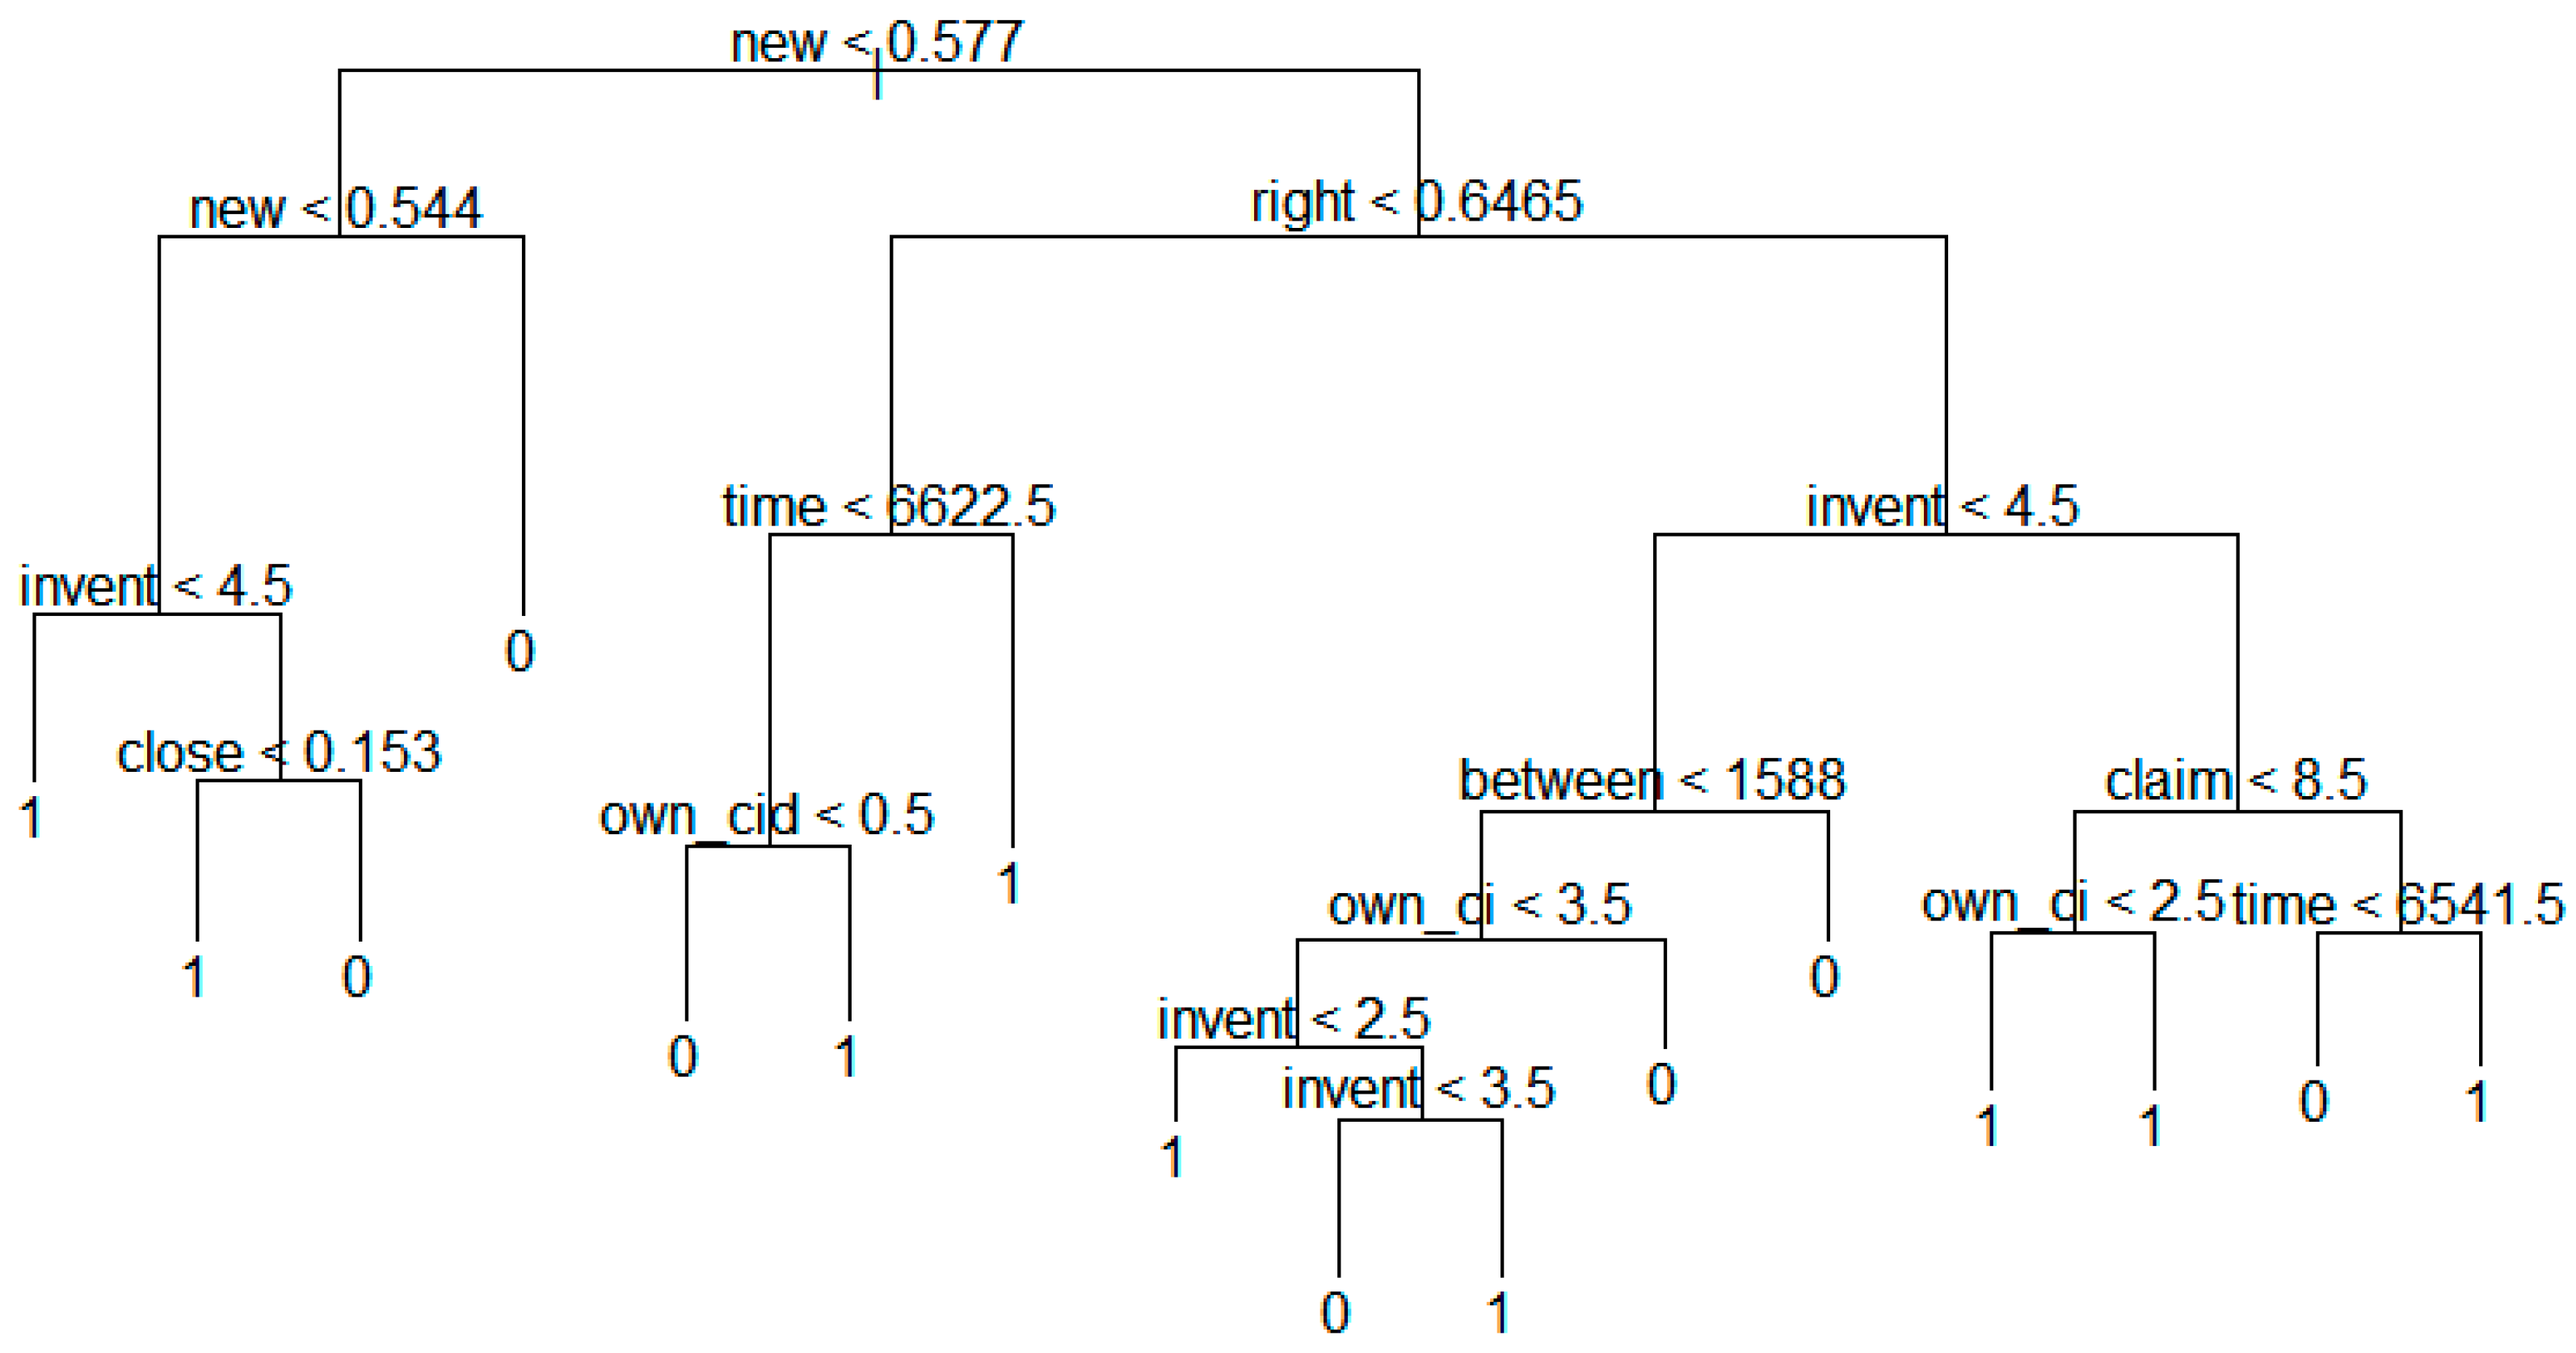
Figure 19 shows the result.
Figure 19.
Decision tree model based on technology transfer results in collaborative research.
Figure 19.
Decision tree model based on technology transfer results in collaborative research.
The above figure shows that the variables influence the transfer node in the following order:
This analytical result is expected to be helpful for collaborative research in establishing technology transfer strategies.
4.6. Technology Transfer Prediction for Patent Data of Countries
Figure 20 shows the SNA graph depicting relations between technology transfer and influential variables, based on patent data belonging to specific countries only.
Figure 20.
SNA graph of technology transfer results in countries.
Figure 20.
SNA graph of technology transfer results in countries.
The nodes that were directly connected with the transfer node were cid, eigen, fp, I0P_f, new, own_cid, right, and time. In other words, these nodes represent variables with influence on technology transfer.
Figure 21 shows the specific SNA graph with only the independent variables that were directly connected to the transfer node.
Figure 21.
Specific SNA graph of technology transfer results in countries.
Figure 21.
Specific SNA graph of technology transfer results in countries.
In this case, eigen, new, right, own_cid, cid, time, I0P_f, and fp emerged as variables influential to transfer, while eigen was influenced by new, right, own_cid, and time; new was influenced by right, own_cid, and cid; right was influenced by own_cid and cid; own_cid was influenced by cid and time; I0P_f was influenced by time and fp; and fp was influenced by time. Regression analysis was conducted to extract the statistical significance of these relations, with the results shown in
Table 7.
Table 7.
Connection weighted values of specific SNA graph in countries.
Table 7.
Connection weighted values of specific SNA graph in countries.
| Relation | Beta | p-Value |
|---|
| transfer | eigen | 0.114 | 0.4670 |
| new | −0.505 | 0.0006 |
| right | −0.505 | 0.0006 |
| own_cid | 0.152 | 0.3320 |
| cid | 0.130 | 0.4060 |
| time | −0.229 | 0.1390 |
| I0P_f | 0.160 | 0.3500 |
| fp | 0.160 | 0.3060 |
| eigen | new | −0.237 | 0.1260 |
| right | −0.237 | 0.1260 |
| own_cid | 0.574 | 0.0001 |
| time | 0.307 | 0.0456 |
| new | right | 1.000 | 0.0001 |
| own_cid | −0.204 | 0.1890 |
| cid | −0.488 | 0.0009 |
| right | own_cid | −0.204 | 0.1890 |
| cid | −0.488 | 0.0009 |
| Own_cid | cid | −0.126 | 0.4190 |
| time | 0.172 | 0.2700 |
| I0P_f | time | −0.164 | 0.2930 |
| fp | 1.000 | 0.0001 |
| fp | time | −0.164 | 0.2930 |
Contrary to the regression analysis results obtained so far, technology transfer in countries had statistical significance only in the following relational structure.
Finally, the decision tree model was constructed to extract the structure of influential variables for technology forecasting.
Figure 22 shows the result of the analysis.
Figure 22.
Decision tree model based on technology transfer results in countries.
Figure 22.
Decision tree model based on technology transfer results in countries.
The above figure indicates that the variables influence the transfer node in the following order:
Many countries can use this analytical result to establish their technology transfer strategies.
4.7. Predictive Result of Technology Transfer
We combined the predictive results from National Research Institute, Public University, Private University, Collaborative Research, and Country cases.
Table 8 shows the result of significant variables for technology transfer.
Table 8.
Result of significant variables for technology transfer.
Table 8.
Result of significant variables for technology transfer.
| Variable | National Research Institute | Public University | Private University | Collaborative Research | Country | Sum |
|---|
| group | X | X | X | X | X | 0 |
| time | X | X | X | X | O | 1 |
| own_ci | O | O | X | X | X | 2 |
| own_cid | O | O | X | X | O | 3 |
| I0P_f | X | X | O | X | O | 2 |
| I0P_fnn | X | X | X | X | X | 0 |
| invent | X | X | X | X | X | 0 |
| own_tr | X | X | X | X | X | 0 |
| claim | X | X | X | X | X | 0 |
| cid | X | X | X | X | O | 1 |
| fnn | X | X | O | X | X | 1 |
| tri | X | X | X | X | X | 0 |
| ipc_n | X | X | X | O | X | 1 |
| close | X | X | X | X | X | 0 |
| between | X | X | X | X | X | 0 |
| eigen | X | X | X | X | O | 1 |
| new | O | O | X | X | O | 3 |
| right | O | O | O | X | O | 4 |
| own_nci | O | O | X | X | X | 2 |
| prior | X | X | X | X | X | 0 |
| fp | X | X | O | X | O | 2 |
In this table, the “O” means that each variable is used for each case, and the “X” is not used. We found the variable of “right” (degree of the right) was used the most. This was selected in four cases (National Research Institute, Public University, Private University, and Country). So we knew the variable of “right” is the most important variable. Next, the variables of “own_cid” (Number of forward citations within domestic patents) and “new” (Novelty) were used in three cases. Thus, these are the second major factors for predicting technology transfer. In addition, the variables of “own_ci” (Number of backward citations within domestic patents), “I0P_f” (Number of INPADOC Family patents), “own_nci” (Citation within domestic patents), and “fp” (Number of family patents) were selected for two cases. The variables of “time” (Expiration date – Registered date), “cid” (Number of forward citations), “fnn” (Number of family countries), “ipc_n” (Number of IPC codes extracted), and “eigen” (Eigenvector) are also meaningful factors for predictive models because they were used all together. Therefore, we should the values of the variables of “right”, “own_cid”, “new”, “own_ci”, “I0P_f”, “own_nci”, “fp”, “time”, “cid”, “fnn”, “ipc_n”, and “eigen”. We can manage the technology transfer of target technology using the result by the proposed methodology.
In this paper, we constructed decision tree graphs for showing the key variables to predict technology transfer. Some of them contained diverse leaves and some did not. Using the result of
Figure 7,
Figure 10,
Figure 13,
Figure 16,
Figure 19 and
Figure 22, we can compare the predictive structure for technology transfer according to the cases (National Research Institute, Public University, Private University, Collaborative Research, and Country).
This paper contributes to the prediction of technology transfer practically. From the result of our research, we can propose four models as follows:
Model1:
transfer = b0 + b1right
Model2:
transfer = b0 + b1right + b2own_cid + b3new
Model3:
transfer = b0 + b1right + b2own_cid + b3new + b4own_ci + b5I0P_f + b6own_nci + b7fp
Model4:
transfer = b0 + b1right + b2own_cid + b3new + b4own_ci + b5I0P_f + b6own_nci + b7fp + b8time + b9cid + b10fnn + b11ipc_n + b12eigen
To predict the transfer possibility of a technology, we can select a predictive model among four models. Model1 consists of the most frequently used variable. Model2 is composed of model1 plus the variables used second most. Model3 and model4 are made by the same way as model1 and model2. In addition, we can use the proper model from model1 to 4 according to given variables.
5. Conclusions
The goal of this paper is to construct a predictive model of technology transfer. We need to determine the significant variables for predictive model. In this paper, we selected statistically significant variables for predictive models of technology transfer. This research proposes a predictive model of technology transfer using patent analysis. The proposed model is constructed by SNA, regression analysis, and decision tree modeling, based on statistical analysis and machine learning. The overall relational structure is developed to extract the variables with influence on technology transfer via the SNA graph. In order to find more specific relations, the SNA graph with only those variables that directly influence technology transfer is constructed. Then regression analysis is conducted based on the SNA results to extract the statistical significance of the influence of these variables on technology transfer. Finally, a decision tree model is used to find prior variables that influence technology transfer. Using this analytical result, it is possible to establish strategies of both technological development and relevant patent identification for efficient technology transfer.
Predictive models of technology transfers were constructed based on not only the whole patent data but also on patent data from national research institutes, public universities, private universities, collaborative research, and countries, respectively. The proposed methodology for constructing the models is expected to be useful in the management of technological innovation and R&D strategy. For further research, it is necessary to develop more precise predictive models of technology transfer based on various techniques of statistics and machine learning algorithms.
Acknowledgments
This research was supported by Basic Science Research Program through the National Research Foundation of Korea(NRF) funded by the Ministry of Education(NRF-2015R1D1A1A01059742). This research was supported by the BK 21 Plus (Big Data in Manufacturing and Logistics Systems, Korea University).
Author Contributions
Jaehyun Choi designed this research and collected the dataset for the experiment. Dongsik Jang and Sunghae Jun analyzed the data to show the validity of this paper. Sangsung Park wrote the paper and performed the entire research process. In addition, all authors have cooperated in revising the paper.
Conflicts of Interest
The authors declare no conflicts of interest.
References
- Hack, S.; Berg, C. The Potential of IT for Corporate Sustainability. Sustainability 2014, 6, 4163–4180. [Google Scholar] [CrossRef]
- Kobayashi, H.; Kato, M.; Maezawa, Y.; Sano, K. An R&D Management Framework for Eco-Technology. Sustainability 2011, 3, 1282–1301. [Google Scholar]
- WIPO Statistics Database. December 2014. Available online: http://ipstats.wipo.int/ipstatv2/ (accessed on 13 September 2015).
- Sohn, S.; Moon, T. Structural equation model for predicting technology commercialization success index (TCSI). Technol. Forecast. Soc. Chang. 2003, 70, 885–899. [Google Scholar] [CrossRef]
- Sohn, S.; Moon, T. Decision Tree based on data envelopment analysis for effective technology commercialization. Expert Syst. Appl. 2004, 26, 279–284. [Google Scholar] [CrossRef]
- Hwang, S.; Lim, Y. An Economic Valuation Model with Decision Trees and Strategic Flexibility of R&D programs; Science and Technology Policy Institute: Washington, DC, USA.
- Walker, W.; Haasnoot, M.; Kwakkel, J. Adapt or Perish: A Review of Planning Approaches for Adaptation under Deep Uncertainty. Sustainability 2013, 5, 955–979. [Google Scholar] [CrossRef]
- Korean Intellectual Property Office. Inventions and Patents; KIPO: Seoul, Korea, 2002. [Google Scholar]
- Choi, J.; Jeong, S.; Kim, K. A Study on Diffusion Pattern of Technology Convergence: Patent Analysis for Korea. Sustainability 2015, 7, 11546–11569. [Google Scholar] [CrossRef]
- Yoon, B.; Park, Y. Development of new technology forecasting algorithm: Hybrid approach for morphology analysis and conjoint analysis of patent information. Eng. Manag. IEEE Trans. 2007, 54, 588–599. [Google Scholar] [CrossRef]
- Jun, S.; Park, S. Examining technological innovation of Apple using patent analysis. Ind. Manag. Data Syst. 2013, 113, 890–907. [Google Scholar] [CrossRef]
- Mogee, M.E. Using patent data for technology analysis and planning. Res. Technol. Manag. 1991, 34, 43–49. [Google Scholar]
- Wu, C.-H.; Ken, Y.; Huang, T. Patent classification system using a new hybrid genetic algorithm support vector machine. Appl. Soft Comput. 2010, 10, 1164–1177. [Google Scholar] [CrossRef]
- Park, S.; Jung, W.; Shin, Y.; Jang, D. A patent examining expert system using pattern recognition. Expert Syst. Appl. 2011, 38, 4302–4311. [Google Scholar] [CrossRef]
- Jun, S. Technology Forecasting of Intelligent Systems using Patent Analysis. J. Korean Inst. Intell. Syst. 2011, 21, 100–105. [Google Scholar] [CrossRef]
- Park, S.; Lee, S.; Jun, S. A Network Analysis Model for Selecting Sustainable Technology. Sustainability 2015, 7, 13126–13141. [Google Scholar] [CrossRef]
- Anderson, T.; Daim, T.; Lavoie, F. Measuring the efficiency of university technology transfer. Technovation 2007, 27, 306–318. [Google Scholar] [CrossRef]
- Weckowska, D. Learning in university technology transfer offices: Transactions-focused and relations-focused approaches to commercialization of academic research. Technovation 2015, 41–42, 62–74. [Google Scholar] [CrossRef]
- Chang, P.; Chen, Y. A fuzzy multi-criteria decision making method for technology transfer strategy selection in biotechnology. Fuzzy Sets Syst. 1994, 63, 131–139. [Google Scholar] [CrossRef]
- Heslop, L.; McGregor, E.; Griffith, M. Development of a Technology Readiness Assessment Measure: The Cloverleaf Model of Technology Transfer. J. Technol. Transf. 2001, 26, 369–384. [Google Scholar] [CrossRef]
- Cummings, J.; Teng, B. Transferring R&D knowledge: The key factors affecting knowledge transfer success. J. Eng. Technol. Manag. 2003, 20, 39–68. [Google Scholar]
- Mowery, D.; Oxley, J.; Silverman, B. Strategic alliances and interfirm knowledge transfer. Strateg. Manag. J. 1996, 17, 77–91. [Google Scholar] [CrossRef]
- Kingsley, G.; Bozeman, B.; Coker, K. Technology transfer and absorption: An “R&D value-mapping” approach to evaluation. Res. Policy 1996, 25, 967–995. [Google Scholar]
- Levin, M. Technology transfer as a learning and developmental process: An analysis of Norwegian programmes on technology transfer. Technovation 1993, 13, 497–518. [Google Scholar] [CrossRef]
- Mohaghar, A.; Monawarian, A.; Raassed, H. Evaluation of technology transfer strategy of petrochemical process. J. Technol. Transf. 2010, 37, 563–576. [Google Scholar] [CrossRef]
- Kim, H. Study on Future Foresight of the Technology Commercialization Policy: Applying AHP Analysis. Master’s Thesis, Seoul National University, Seoul, Korea, 2012. [Google Scholar]
- Sohn, S.; Lee, Y.; Jeong, S.; Kim, C. Recommendation for Promoting Technology Commercialization; Science and Technology Policy Institute: Washington, DC, USA.
- R Core Team. R: A Language and Environment for Statistical Computing. R Foundation for Statistical Computing. Available online: http://www.R-project.org/ (accessed on 20 September 2015).
- Feinerer, I.; Hornik, K.; Meyer, D. Text mining infrastructure in R. J. Stat. Softw. 2008, 25, 1–54. [Google Scholar] [CrossRef]
- Main, M.; Savitch, W. Data Structures and Other Objects Using C++; Pearson: London, UK, 2010. [Google Scholar]
- Butts, C. Social Network Analysis with sna. J. Stat. Softw. 2008, 24, 1–51. [Google Scholar] [CrossRef]
- Butts, C. Tools for Social Network Analysis-Package SNA; CRAN: Vienna, Austria, 2015. [Google Scholar]
- Han, J.; Kamber, M.; Pei, J. Data Mining: Concepts and Techniques; Morgan Kaufmann: Burlington, CA, USA, 2012. [Google Scholar]
© 2015 by the authors; licensee MDPI, Basel, Switzerland. This article is an open access article distributed under the terms and conditions of the Creative Commons by Attribution (CC-BY) license (http://creativecommons.org/licenses/by/4.0/).


