Case Report

Carbon Footprint Analysis for Mechanization of Maize Production Based on Life Cycle Assessment: A Case Study in Jilin Province, China

1
College of Biological and Agricultural Engineering, Jilin University, Changchun 130022, China
2
Department of Apply of Mathematic, Jilin University of Finance and Economics, Changchun 130117, China
3
Colleges of Traffic, Northeast Forestry University, Harbin 150040, China
*
Author to whom correspondence should be addressed.
Sustainability 2015, 7(11), 15772-15784; https://doi.org/10.3390/su71115772
Submission received: 1 August 2015 / Revised: 18 November 2015 / Accepted: 19 November 2015 / Published: 24 November 2015
(This article belongs to the Special Issue Critical Issues on Soil Management and Conservation)

Abstract

:
The theory on the carbon footprint of agriculture can systematically evaluate the carbon emissions caused by artificial factors from the agricultural production process, which is the theoretical basis for constructing low-carbon agriculture and has important guiding significance for realizing low-carbon agriculture. Based on farm production survey data from Jilin Province in 2014, this paper aims to obtain a clear understanding of the carbon footprint of maize production through the following method: (1) one ton of maize production was evaluated systematically by using the Life Cycle Assessment (LCA); (2) the carbon emissions of the whole system were estimated based on field measurement data, (3) using the emission factors we estimated Jilin’s carbon footprint for the period 2006–2013, and forecasted it for the period from 2014 to 2020 using the grey system model GM (1, 1).

1. Introduction

Maize is one of the most important agricultural crops since it is the highest-yielding grain crop in the world, ranking 11th in the global production of all foods. Mainland China is the second largest maize producer and consumer after the United States [1]. As maize cultivation increases year by year, maize acreage is becoming the first choice for the most farmers. According to the Ministry of Agriculture of the People’s Republic of China, the largest maize cultivation occurs in Northeast China, wherein total maize productions account for 40.6% of China’s total production [2].
Thus, the maize cultivation of the Northeast has a large influence on the stability of food production in China. In recent years, developments in Chinese society, including accelerated urbanization and profound changes to the political system, have encouraged farmers to move to cities for work. As a result, the ownership of farmland has become more concentrated under the control of a few individuals and companies, resulting in many large-scale farms that have emerged in the Northeast. To address this issue, large-scale farms have been encouraged to simultaneously adopt higher-yielding varieties and greater mechanization. Compared with household farms, there are several advantages for large-scale farms. For example, they have an increased total yield, an increased level of agricultural mechanization, and help to promote new agricultural technologies [3,4]. However, agricultural mechanization may create new or greater environmental impacts because the steps in the process of agricultural production consume the most energy and cause severe environmental damage, though this remains unclear. Therefore, handling these issues is important to reduce energy consumption and improve the sustainability of agricultural mechanization production systems. According to the above considerations, we introduce an energy evaluation of mechanization of maize production systems, based on the Life Cycle Assessment (LCA) in this study.
LCA is one of several commonly used environmental management tools that assess a product or service from “cradle to grave”, meaning that every stage of the life cycle is examined, from raw-material acquisition through manufacturing, distribution, use, possible recycling, and until final disposal[5]. LCA methodology is a useful tool for the environmental performance assessment of agricultural production systems, and also for comparing different agricultural production systems from an environmental perspective. Recently, some researchers have quantified the environmental impacts of a multitude of agricultural products [6,7]. Brentrup et al. [8] adopted LCA methodology to appraise sugar beet production using different forms of nitrogen fertilizer. Nie et al. [9] analyzed the effects of different cropping systems using the LCA method. They found that intercropping maize with suitable plants could reduce the adverse effects of the over-application of nitrogen fertilizer on the environment. Wang [4] used LCA methodology to explore the ecological and economic effects of winter grain cultivation in the North Plain and concluded that modernization of grain production will be important in the future. Sahte et al. [10] used the LCA methodology to investigate Ethiopian rose cultivation and refine its nutrient and pesticide management to improve environmental performance. Xu et al. [11] comprehensively analyzed LCA energy consumption and greenhouse gas emissions of China’s six current biofuel pathways. However, to our knowledge, no studies have estimated the carbon footprint of the mechanization of maize production systems based on an LCA methodology. We divided the agricultural process into production steps and analyzed the energy inputs and utilization of each step. The result can be used to improve the mechanization of the maize production system in Northeast China.

2. Materials and Methods

Various different versions of the carbon footprint concept have been represented in the literature [12,13,14]. The definition of a carbon footprint is the measure of the exclusive total amount of carbon dioxide emissions that are directly and indirectly caused by an activity or are accumulated over the life stages of a product [15]. Dubey and Lal [14] highlight the impact of agricultural activities on the environment in terms of the amount of Greenhouse Gas (GHGs) produced, and take into account the total GHGs emissions in carbon equivalents through material added, and from mechanical operations performed in a single whole cycle of crop production [16].
In our study, the carbon emissions include emissions from the manufacturing of agrochemicals applied, and those from the mechanical operations for spraying and stubbing, tillage, and harvesting, as well as for transportation. In addition, direct N2O emissions from croplands induced by the application of chemical N fertilizer are also taken into account.

2.1. Goal and Scope Definition

The purpose of this paper is to (i) adjust the boundary system of the LCA and improve suitability of emission factors for China’s conditions, in order to quantify the size and proportion of carbon inputs involved in the maize production in Jilin Province; (ii) assess the overall carbon footprint and trace its dynamics toward present day; and (iii) assist scientists in reducing carbon emissions in agronomic practices that they may be studying at the field level. This study makes an important contribution to the maize LCA literature by relying on a range of studies of field emission estimates for carbon emissions, rather than estimating them based on some other region or system. In the analysis, suggestions are offered for mitigation opportunities and technological development demands to reduce carbon emissions. To make these suggestions, the mechanization of maize production in Jilin Province of China is taken into account, and its carbon dioxide emissions are evaluated using the LCA approach.
Jilin Province is located in the hinterland of Northeast China (40°–42° N, 125°–128° E). It is known as one of the three gold maize belts in the world. This study applied a random sampling investigation method and selected 476 household farms within Jilin’s maize belt. Questionnaire content included quantification of the amounts of fertilizer and topdressing, fertilizer varieties, and fertilization habits. Additionally, the data for fertilizer addition per hectare each year are available in China’s rural statistical yearbook series for the period 1985–2013 [17,18].

2.2. Function Unit

The functional unit describes the primary functions fulfilled by a product system, and indicates how much of this function is to be considered in the LCA study [8]. Thus, the functional unit is used as a reference when quantifying input and output data in the inventory analysis of an LCA study. To conduct an LCA for agricultural systems, three functional units have been suggested [19]. These are: (i) the land management function, measured by cultivated hectares per year; (ii) the financial function expressed as a currency unit; and (iii) the productive function described by physical units (e.g., kg dry matter yield; MJ net energy for lactation). In this study one ton of produced maize was selected as the single functional unit.

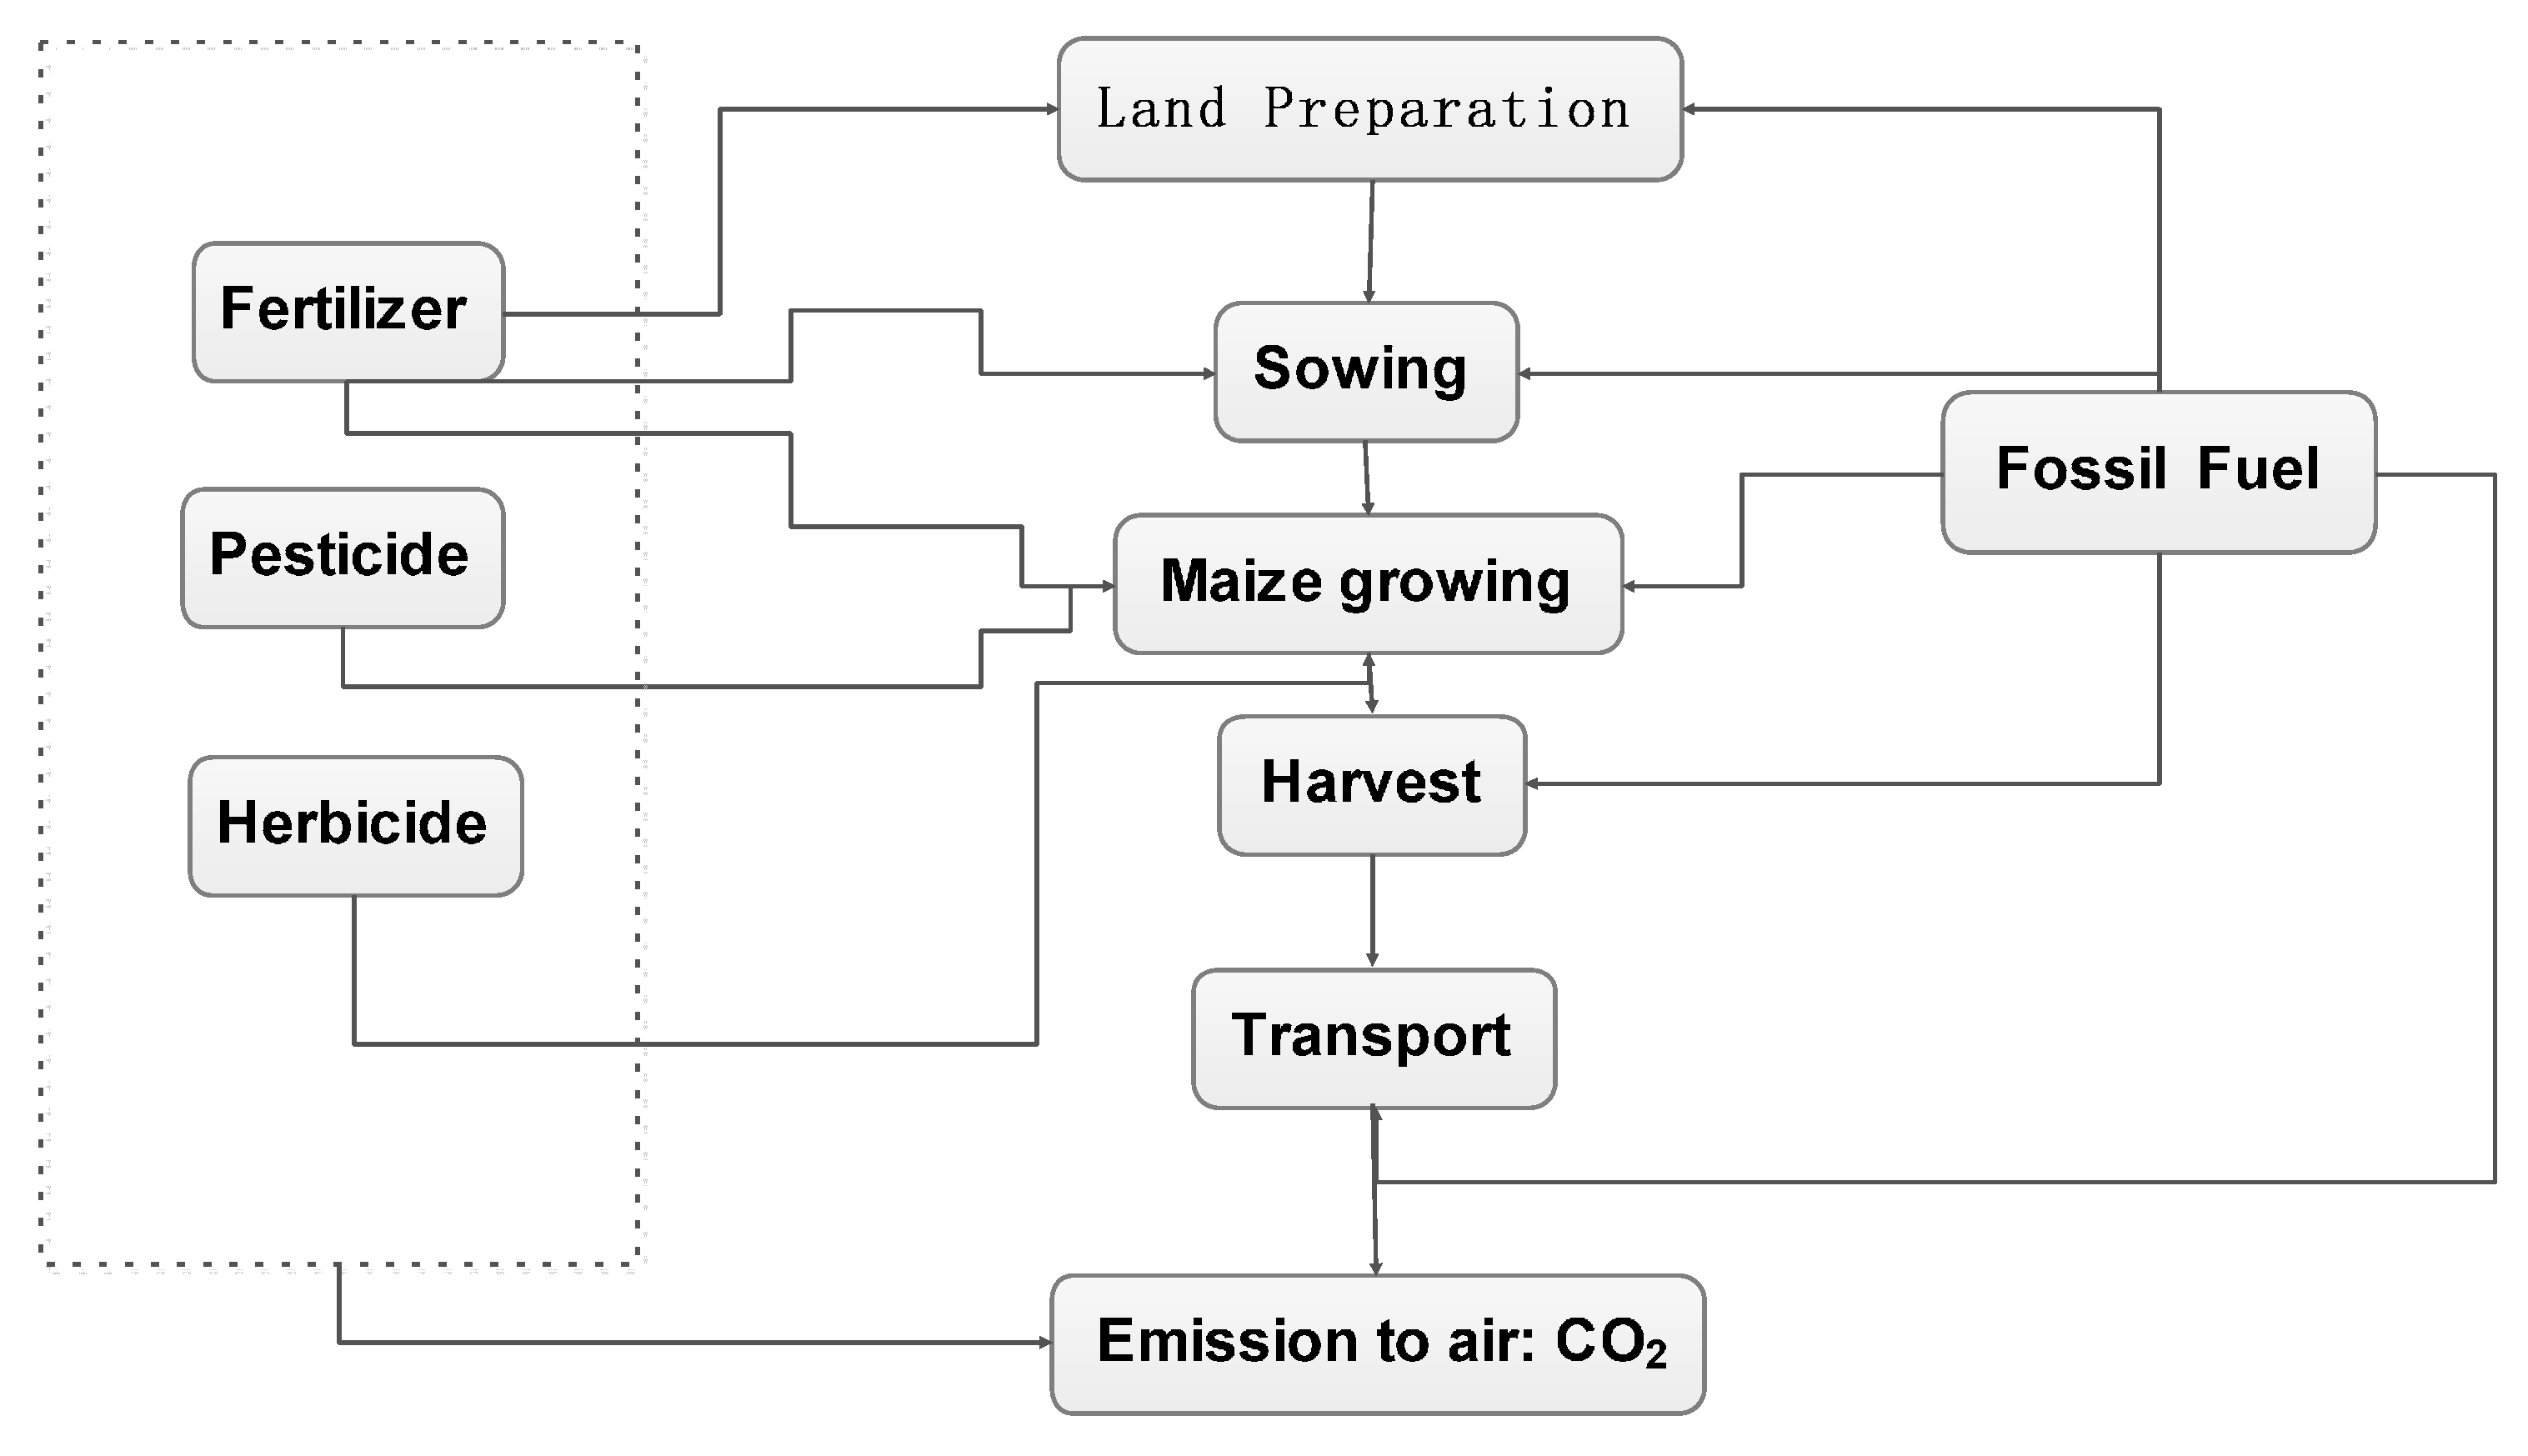
2.3. System Boundary

Using the system boundary ensures that all emissions associated with inputs, within field activities and after the product leaves the farm, are included [20]. In our study, the carbon emissions were assessed by a single life cycle of mechanization of the maize production system, so the farm gate was chosen as the system boundary from agricultural inputs (i.e., fertilizer, pesticide, and herbicide) to the farm gate (transport of maize product). Note that we did not consider maize drying and waste disposal of the production system in this study. Thus, this analysis included agricultural practices, agricultural machinery, and energy carriers applied during maize cultivation from farm gate to farm gate (Figure 1).
Figure 1. The scope of carbon emissions from maize production systems.
Sustainability 07 15772 g001

2.4. Methodology

In this study, carbon emissions in maize production were analyzed based on direct and indirect energy sources including fuel, fertilizers, pesticides, and machinery, and other sources. In addition, direct N2O emissions from croplands induced by the application of chemical N fertilizer were also taken into account. Total GHGs emissions were determined as the sum of the input factors (AIi) multiplied by the appropriate carbon emissions conversion coefficient (Ei) for each factor plus N2O emissions G H G N 2 O from croplands. Hence, the equations for total GHG emissions for the overall assessment of the carbon footprint of maize production were expressed as follows:
GHGs emission  =   i = 1 n A I i × E i + G H G N 2 O
G H G N 2 O = F N × δ N × 44 28 × 298
where GHG emissions are the total carbon emissions; AIi is the agricultural input factors applied, e.g., fertilizer, pesticide, and diesel oil; and E i is the appropriate carbon emission conversion coefficient for each factor of AIi. Emission conversion coefficients were investigated carefully and are represented in Table 1, through which the maize production inputs were converted to energy coefficients (tCe per unit). G H G N 2 O represents direct N2O emissions from the application of N fertilizer (tCe per unit); FN is the quantity of N fertilizer (t) applied for crop production; δ N is the emission factor of N2O emissions induced by N fertilizer application; 44/28 presents the molecular weight of N2 in relation to N2O; and 298 is the figure for the net global warming potential (GWP) in a 100-year horizon [21].
Table 1. Emission factors of agriculture inputs used in the estimation.
Emission SourceEmission FactorReference
N fertilizer4.96 kg Ce/kg[22]
P fertilizer1.35 kg Ce/kg[22]
K fertilizer0.58 kg Ce/kg[22]
Pesticides5.10 kg Ce/kg[15]
Herbicide6.30 kg Ce/kg[15]
Diesel oil for machine3.32 kg Ce/L[22]
Farm Labor0.86 kg Ce/person[22]
Seeds1.22 kg Ce/kg[11]
Farmland N2O0.01 kg N/kg[23]
Hence, the formulations of the carbon footprint are follows:
C F Y = G H G s  emissions / Y
C F V = G H G s  emissions / V
CFY is the carbon footprint per unit yield; Y is the total mass of production; CFV is the carbon footprint per unit production value of the maize production; and V is the total value of maize.

3. Results and Discussion

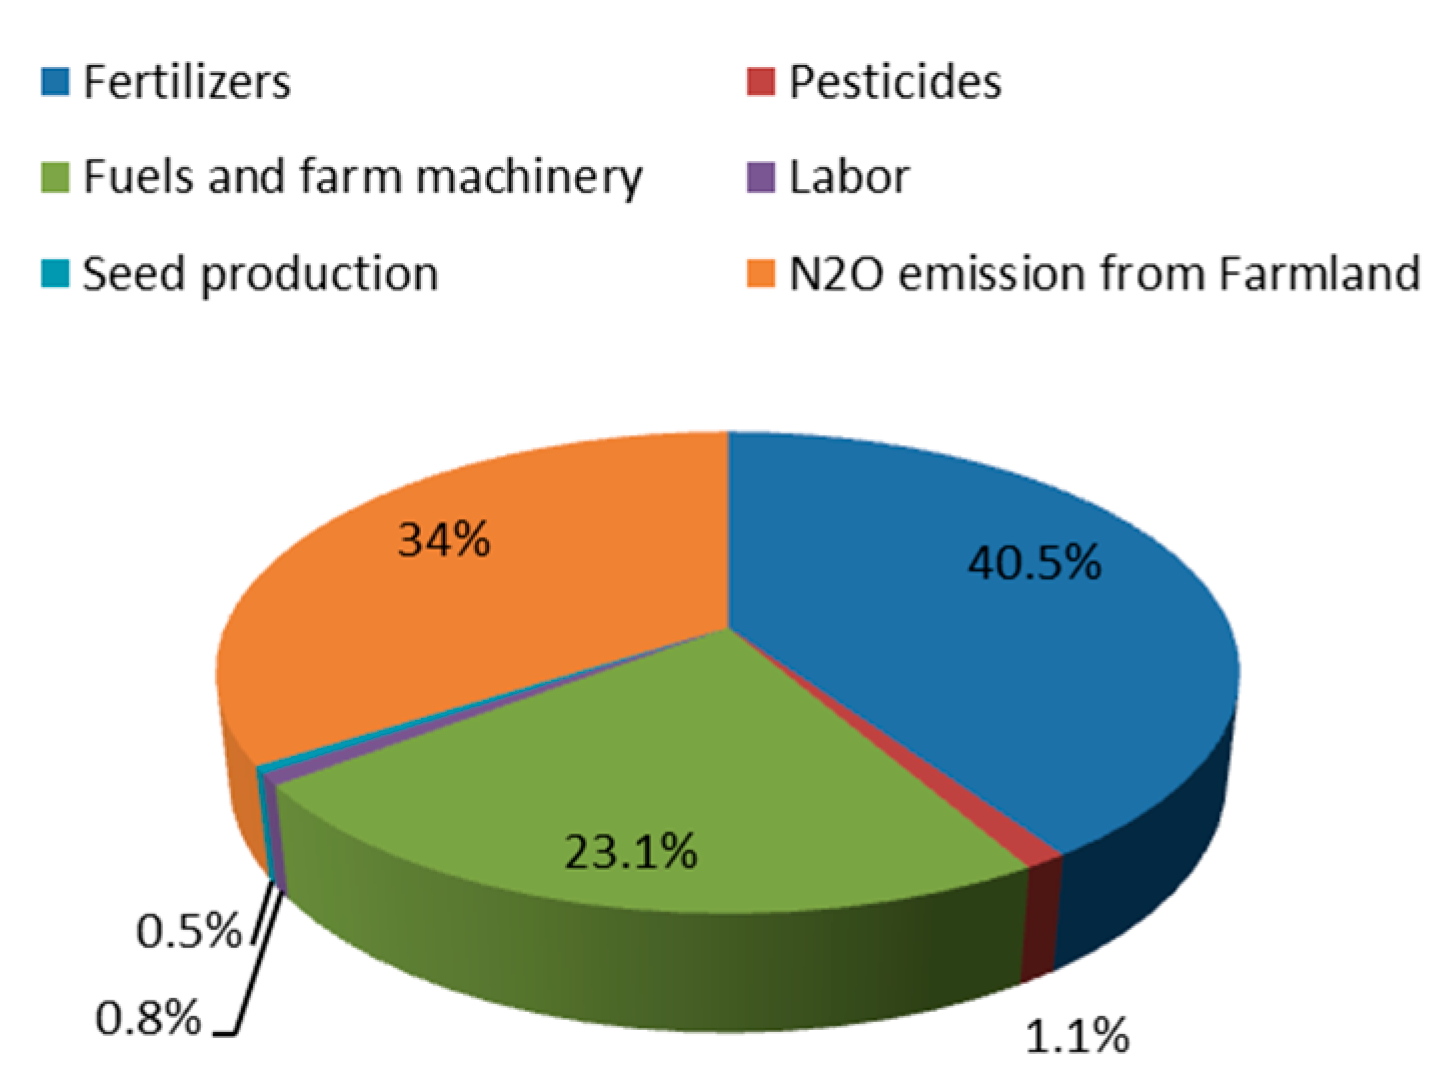
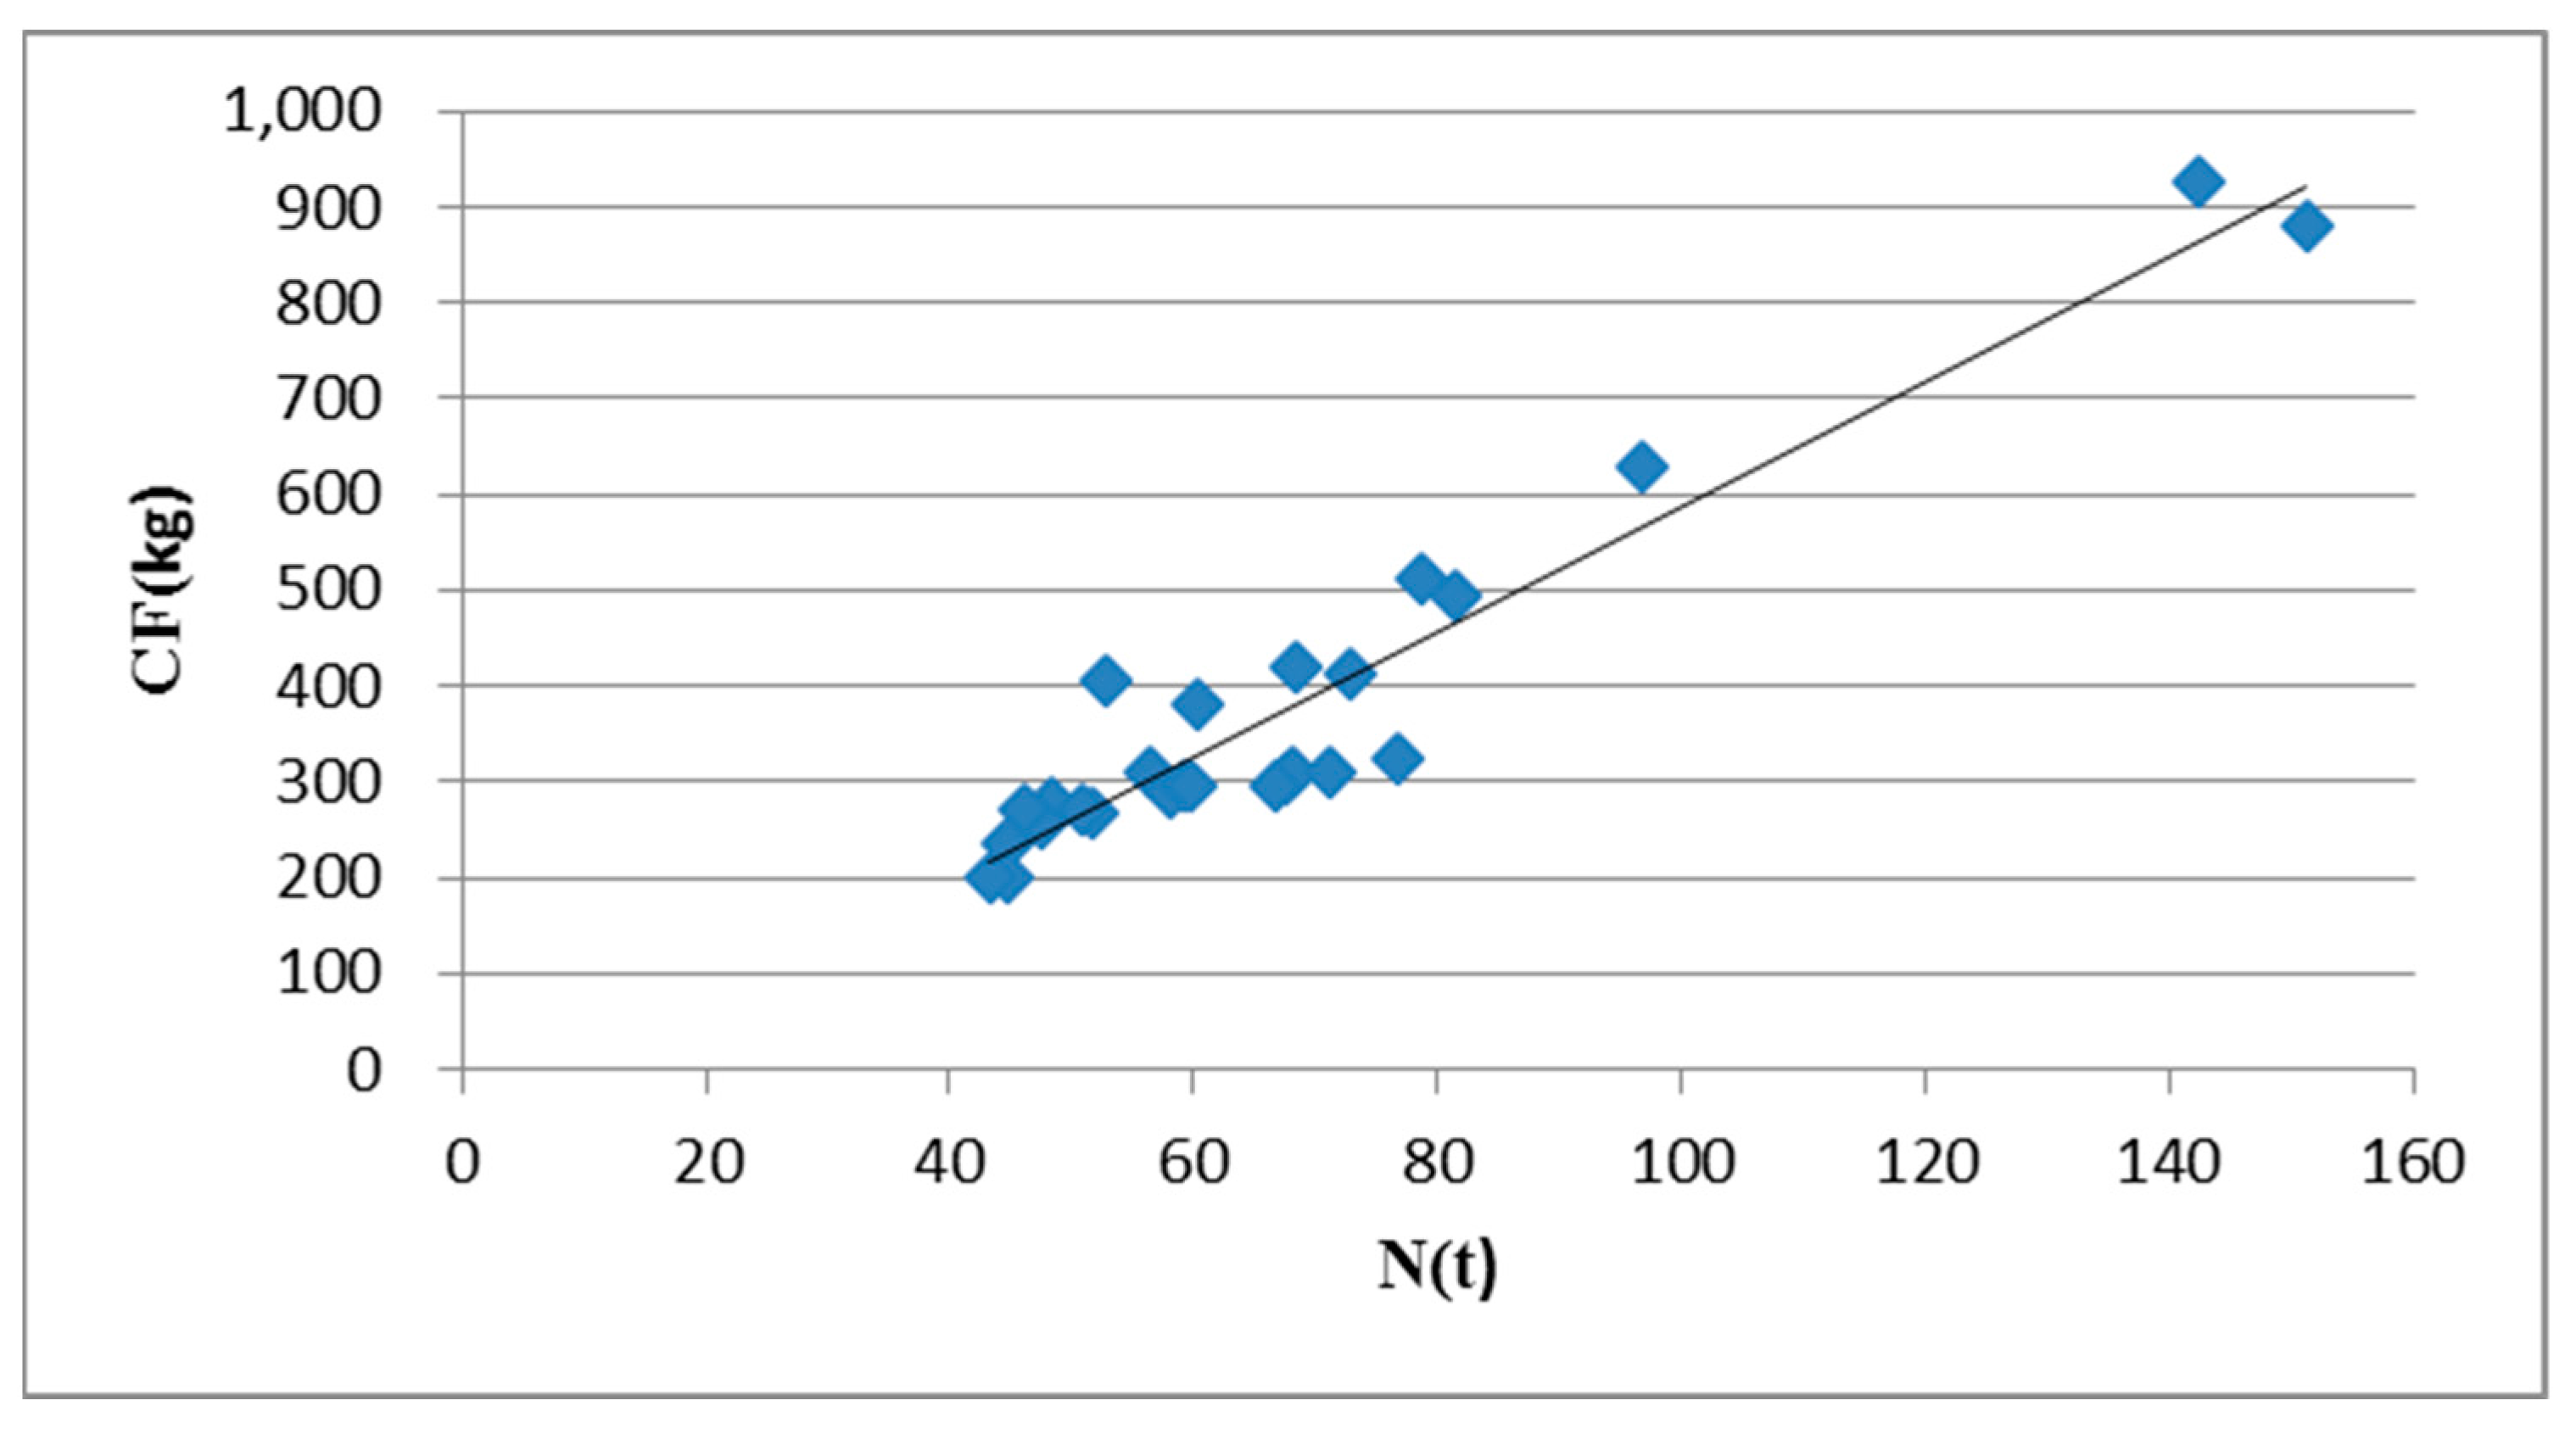
3.1. Total Size of Carbon Footprint Emissions and Carbon Cost of Different Inputs

The estimation of the carbon emissions from the mechanization of maize production in Jilin Province was 6.2 tCe/ha, which corresponds to 0.62 tCe for one ton of maize. The average maize yield was estimated to be around 10 tons per hectare in 2014 (Table 2). The average yield in 2014 was 1.9 tons per hectare more than the average natural yield in 2013 [18]. The proportions of different inputs to the carbon footprint are described in Figure 2. Overall, fertilizers represent the largest proportion of emissions (41%) during maize production, and nitrogen fertilizers were responsible for 2.2 t/ha of the total carbon emissions in maize production. N2O from farmlands were the next major source after fertilizer, and contributed 2.1 t/ha and accounted for 34% of total carbon emissions. Moreover, fuels and farm machinery emitted 0.14 tCe for each ton of maize production. Others emission sources in maize cultivation were pesticides, farm labors, and seed production with values of 1.2%, 0.8%, and 0.5%, respectively.
Nitrogen fertilizers released around 36% of the carbon emissions from maize production in 2014. As shown in Figure 3, there is a significant correlation between carbon emissions and nitrogen consumption in Jilin’s maize production between 1985 and 2013, with r = 0.95. It widely understood that increased fertilizer use can increase maize yields. However, as increased amounts of fertilizer were applied, the rate of yield increase reduces until a plateau is reached. In the current circumstances, reducing carbon emissions through reducing fertilizer use would decrease maize production and net financial benefits to farmers; therefore, it is a considerable challenge to reduce carbon emissions in agriculture.
The fuel consumption and carbon emissions from different agricultural operations are shown in Table 3. Fuel is the third source of carbon emissions during maize production. More fuel was consumed from harvesting and stubbing than from other agricultural operations. It was possible to reduce fuel consumption and carbon emissions from stubbing and harvesting by using new methods, and new and more efficient tractors and equipment [24]. The following highest carbon source was tillage during maize production. However, some studies show that there was no clear positive or negative response for the mitigation of carbon emissions by using conservation tillage and no tillage instead of conventional tillage [23].
Table 2. Carbon emissions from maize cultivation (Jilin Province).
Emission SourceData SourceActivity ValueCarbon Emission in AreaCarbon Intensity in Production
L/hatCe/hatCe/t
Maize cultivationStubbing400.39840.0398
(Diesel fuel)Plow tillage300.29880.0299
Seedling70.11950.0120
Weeding by Machinery1.50.01490.0015
Fertilizer by Machinery100.04980.0050
Harvest400.39840.0398
Transport150.14940.0149
Farm labor 2000.04900.0049
kg/hatCe/hatCe/t
Farm inputsNitrogen N4502.23200.2232
Phosphorus P1510.20390.0204
Potassium K1250.07250.0073
Herbicide90.05670.0057
Insecticide20.01020.0010
Fungicide1.050.00410.0004
Seeds250.03050.0031
N2O emission from farmland2.10730.2107
Total 6.19540.62
Figure 2. Relative proportions of carbon emissions from maize cultivation.
Sustainability 07 15772 g002
Figure 3. Correlation between carbon footprint emissions and nitrogen consumption.
Sustainability 07 15772 g003
Table 3. Fuel consumption during maize production.
StubblingTillageSeedlingWeeding by WCFertilizer by MCHarvestTransportTotal
L/ha4030121.554015143.5
t Ce/ha0.400.300.120.010.050.400.151.43

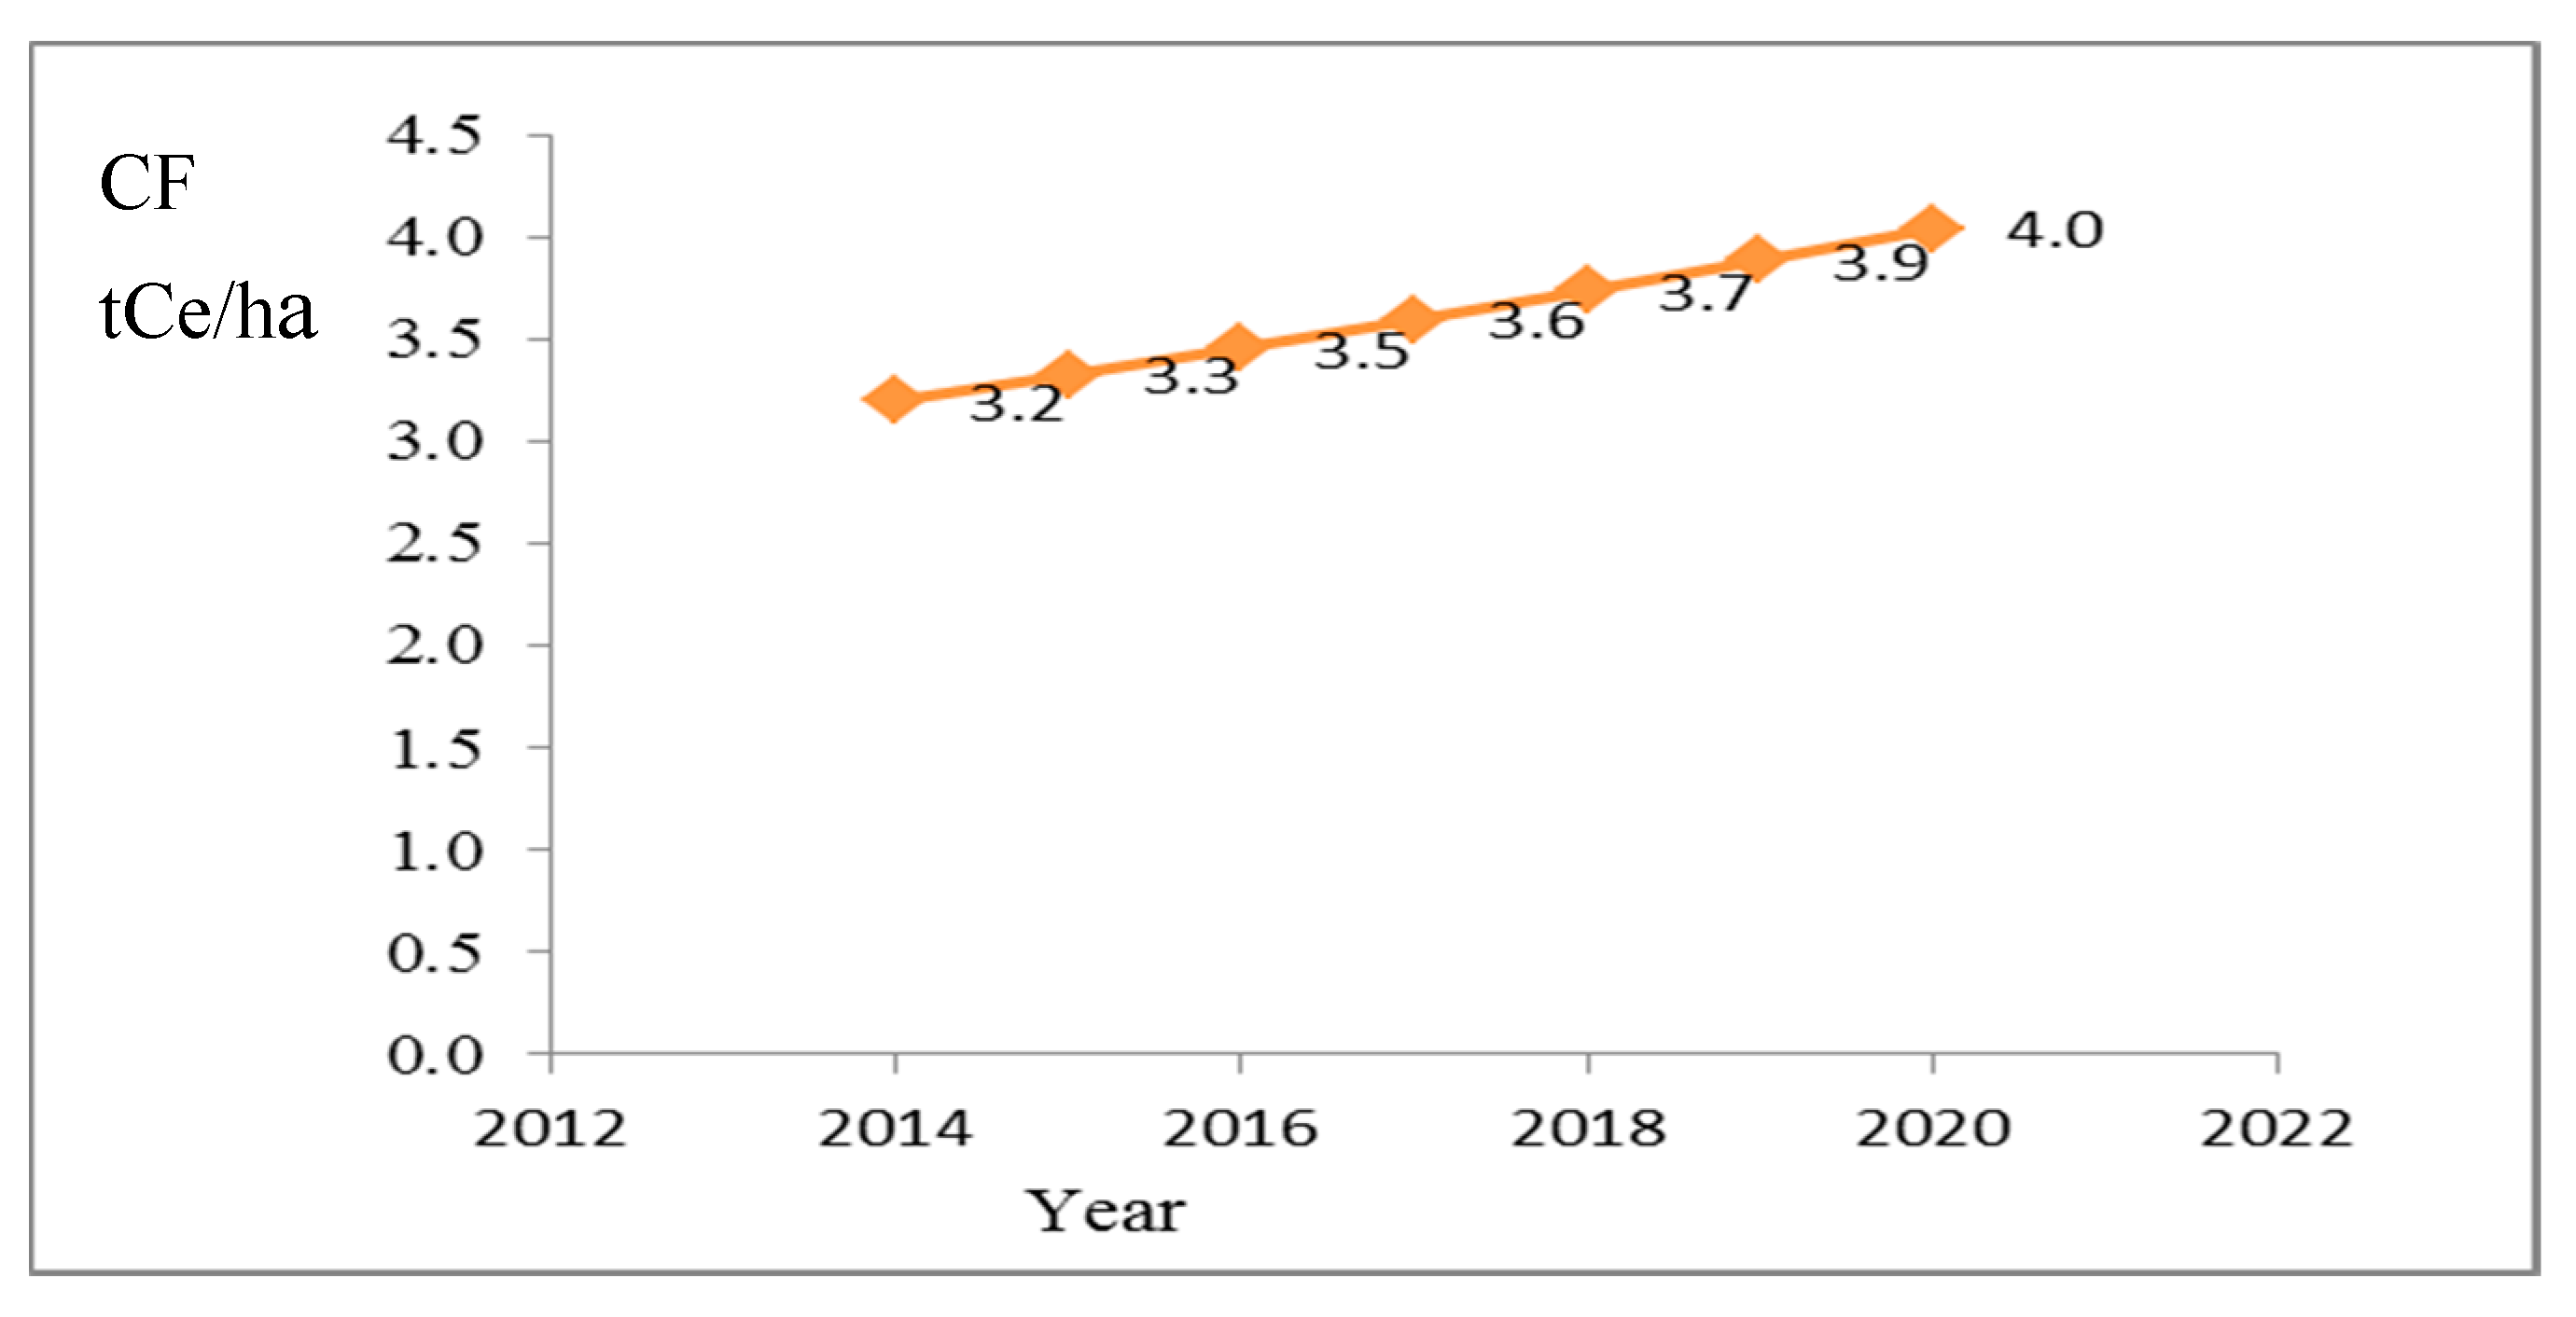
3.2. Forecast of Carbon Footprint

In order to deeply analyze and assess the carbon emissions associated with Jilin’s maize production, we traced the carbon footprint value by combining the results of the study with carbon emissions data from 2006 to 2013 obtained via LCA. A grey system predicted model GM (1, 1) was adopted in order to make a prediction of emissions from the Jilin maize production system.
Since the grey system theory was pioneered by professor Deng in 1982 [22], the theory stated that a grey model for prediction and decision-making can be used for a system model with unclear or incomplete information. For instance, if the internal features of a system are known, the system is denoted as “white”. In contrast, “black” means that the internal features of a system are unknown. Between white and black, there is a grey system indicating partially known internal features. The grey system theory has been widely used in industrial, engineering, economy and many other fields. Compared with other prognostic models, it may be superior in the context of small samples and poor information [25,26]. The grey system theory can work with a limited amount of data and still provide accurate results [27].

3.3. The Basis of the GM (1, 1) Model

Suppose that the sequence X ( 0 ) = { x ( 0 ) ( 1 ) , x ( 0 ) ( 2 ) , , x ( 0 ) ( n ) } is an original data sequence, and the sequence X ( 1 ) = { x ( 1 ) ( 1 ) , x ( 1 ) ( 2 ) , , x ( 1 ) ( n ) } is the accumulated generation sequence of X(0), where x ( 1 ) ( k ) = i = 1 k x ( 0 ) ( i ) . The sequence Z ( 1 ) = { z ( 1 ) ( 1 ) , z ( 1 ) ( 2 ) , , z ( 1 ) ( n ) } is the mean sequence of X, where z ( 1 ) ( k ) = 1 2 [ x ( 0 ) ( k ) + x ( 0 ) ( k + 1 ) ] . Then, the equation x ( 0 ) ( k ) + a z ( 1 ) ( k ) = b is called the basic form of the GM (1, 1) model. The parameters −a and b are called the develop coefficient and grey input, respectively.
Hence, the time response function of GM (1, 1) is
x ^ ( 1 ) ( k + 1 ) = ( x ( 0 ) ( 1 ) b / a ) e a k + b / a , k = 1 , 2 , , n
The accuracy is an important index to measure the ability of a forecasting method. We use the mean absolute percentage error to check the effectiveness of the GM (1, 1) model. The errors can be estimated by Equation (6).
ε k ) = | x ( 0 ) ( k ) x ^ ( 0 ) ( k ) | x ( 0 ) ( k ) , k = 1 , 2 , , n
In this paper, the data was collected from the Jilin Province statistical yearbook 2006 to 2013. The GM (1, 1) model was performed by using Grey System software, we can get the parameters a = −0.038881 and b = 2.299626, and time response function x ( k + 1 ) = 61.535542 e 0.038881 × k 59.144942 . The simulative values and the relative simulative errors are shown in Table 4.
Table 4. The simulative and error values of grey system model GM (1, 1) (tCe/ha).
TimeActual ValueSimulative ValueAbsolute Error
20062.39062.39060
20072.51582.43970.0302
20082.45872.53640.0316
20092.59642.63700.0156
20102.73932.74150.0008
20112.87222.85020.0077
20123.03582.96320.0239
20133.03373.08070.0155
ε (avg) 1.6%
The GM (1, 1) model has strong performance in the simulation of carbon emissions in the context of short-term or small samples, since the mean absolute percentage error (1.6%) is less than 5%. We obtained the 2014–2020 predictive values of the sequence x ^ ( 0 ) ( k + 1 ) k = 2014 , , 2020 ) (Figure 4).
Figure 4. Grey prediction of the carbon footprint during 2014–2020 (tCe/ha).
Sustainability 07 15772 g004
From Figure 4, it is clear that there is an increasing trend in the carbon emissions of maize production into the future. This implies that farms will increase production and will correspondingly increase inputs in the fields. This suggests that farm inputs will be an important target in carbon emission reduction programs. However, the predictive values are less than what we estimated by LCA in Table 2. The survey data is more than the data supported by provincial statistics. Recently, the credibility of national statistics has been questioned. For instance, national and provincial statistics may be adjusted by the government [28,29,30].

3.4. Comparisons with Other Regions’ Carbon Estimates from Crop Production

Recent studies have characterized the carbon emissions of crop production in different regions. The studies in [31,32,33] reported results of life cycle emissions of rice production from Californian, Japan, and Italy at 1.551 kgCe/kg, 46 kgCe/kg, and 252–266 kgCe/ha, respectively. Mondelaers et al. [34] estimated the carbon emissions of wheat from Europe and found a value of 0.08 kgCe/kg. Cheng and Han [35] calculated the carbon emissions to 263 kgCe/ha for conventional-till maize in China. However, in our study of maize production, the carbon footprint is generally higher than in other research results. The main reasons for this are as follows: (1) fertilizer was a major contributor, considering that the N fertilizer rate was almost four times higher than in California (107 kg/ha); and (2) soil N2O emissions represent the major carbon emissions associated with fertilizer application, and some study results do not include this component [36].
Around 60% of the world’s fertilizer demand comes from developing countries where it is used mainly in cereal production [1]. China is now the world’s largest consumer of chemical fertilizers. Without fertilizers the country cannot keep up with the food requirements of the increasing population [37,38]. Fertilizers, particularly nitrogen, are the most important contributor to yield increase. However, excess nitrogen fertilizer application does not always lead to higher yields, especially at the higher yield levels [39,40]. The overuse of chemical fertilizers has had a negative impact on groundwater quality and soil degradation. The questionnaires show that the farmers believed that the more fertilizers they used, the higher the yields would be. For instance, the average amount nitrogen actually used was 450 kg/ha with a range of 400–480 kg/ha. About 61% of the farmers fell into that category. However, we found that most of the farmers were not aware of the nutrient status of their soils and did not know the crop-specific recommended application rates. Therefore, a free training course should be arranged for the farmers by the government, providing them with information about the basic components of soil fertility, the best management practices for nutrient enrichment, and the returns obtained from fertilizer application relative to the cost, so that they can make appropriate decisions on fertilizer application by taking into consideration the cost and returns, as well as potential environmental and health hazards that might be induced by intensive fertilizer use.
In addition, the low cost of fertilizers is likely to contribute to fertilizer overuse. In China, the government agricultural subsidy program links grain subsidy payments and price supports to increases in farmers’ production costs. In 2011, the total amount of the fertilizer industry subsidy was up to 157 billion RMB, equivalent to 2480 RMB/t of fertilizers, which reduced fertilizer prices by 22.4% on average, saving 30.8% of the fertilizer costs in crop production. Meanwhile, the relatively low price of chemical fertilizer reduces the economic incentive for farmers to use organic nutrients, which not only wastes the organic nutrients, but also causes fertilizer overuse [41,42]. Recently there has been increasing interest in phytoremediation as a viable measure to reduce the overuse of nitrogen fertilizers on farmlands, for instance intercropping maize with soybeans [43,44]. Nie et al. [9] also showed that intercropping maize with legume crops could reduce the adverse effects of high consumption of external inputs such as chemical fertilizers on the environment.

3.5. Uncertainty of Carbon Emissions Assessment

Uncertainty in normalization results is caused by a combination of uncertainty in emission data and uncertainty in characterization factors. In this paper, the assessment would be still an issue of uncertainty. Firstly, uncertainty could arise from using emission factors since the data available from Chinese literature is absent. The result of carbon emissions could be significant by using the different emission factors. Apart from emission factors, for an LCA study, there would be a strong dependency of the LCA result on the system boundary, functional unit, and data quality. Hence, there is still an ongoing issue surrounding the methodologies of LCA. Nevertheless, the basic estimation in this work may offer very fundamental information for assessing the carbon emissions of Jilin’s maize production.

4. Conclusions

In this study, the energy consumption and environmental impact of maize cultivation were investigated in China’s Jilin Province using a LCA method. Maize cultivation was not only the most important agricultural activity throughout Jilin Province but also a major contributor to the total maize production in China. The results indicate that the highest carbon emissions were from fertilizers during maize production. Therefore, new chemical components, accurate methods of application, and better agricultural management techniques, e.g., rotations, timely sowing, soil testing, and fertilizer recommendation, need to be developed to enhance the efficiency of fertilizer use on farms and minimize the potential environmental degradation.
Reducing carbon emissions in agriculture is a complex process. There are numerous ways to enhance the sustainability of agricultural systems. Several inputs from different scientific subjects, e.g., economics, ecology, engineering, genetics, chemistry, and soil science, are necessary to reduce carbon releases into the atmosphere. A reduction in farm inputs would decrease carbon emissions on farms, and it would also force farmers to change their production practices. However, in many regions, a significant increase in agricultural production is essential to provide enough food for people. In societies with a high rate of poverty and starvation, the reduction of agricultural production and changes in the pattern of farm productions could create economic, social, and political instability. Farm management and adequate education should be considered as a key factor in carbon emission reduction programs in agriculture. Inefficient management and a lack of experience can waste considerable amounts of fertilizer, fuel, and other inputs.
The results of this study describe the sensitive change of energy per unit production, and also reveal the GHGs related energy usage for maize production. These results can be used by policy-makers and relevant agencies for an improvement in energy efficiency, strategic mitigation of global warming-related issues, managing agricultural systems and modern technologies, and improving the livelihood of farmers.

Acknowledgments

This research was sponsored in part by specialized Research Fund for The Doctoral Program of Higher Education (Grant No. 20130061110043), Science & Technology Developing Planning Program of Jilin Province(Grant No. 20130102048JC), and the Fundamental Research Funds for the Central Universities (2014ZZ023).

Author Contributions

Yinsheng Yang designed the research; Haina Wang, Xiaoyi Zang and Guangdong Tian analyzed the data; Haina Wang wrote the manuscript.

Conflicts of Interest

The authors declare no conflict of interest.

References

  1. Food and Agriculture Organization (FAO). Final 2012 Data and Preliminary 2013 Data for 5 Major Commodity Aggregates Now Available. 2012. Available online: http://faostat.fao.org/site/339/default.aspx (accessed on 25 July 2014).
  2. Ministry of Agriculture of the People’s Republic of China. Domestic Maize Output Will Reach 216 Million Tons in 2014. Available online: http://acs.mofcom.gov.cn/sites/aqzn/aqjxnr.jsp?contentId=2837184448905 (accessed on 25 July 2014).
  3. Xie, J.P. Influence of Agricultural Mechanization on land integration. J. Shangxi Agric. Sci. 2015, 43, 486–488. [Google Scholar]
  4. Wang, L.Q. Considerations about the Necessity of the Scale Operation of Rural Farmland. Sci. Technol. Inf. Dev. Econ. 2004, 14, 89–90. [Google Scholar]
  5. McDougall, F.; White, P.; Franke, M.; Hindle, P. “Life Cycle Assessment” in Integrated Solid Waste Management: A Life Cycle Inventory; Blackwell Science: Malden, MA, USA, 2001. [Google Scholar]
  6. Abeliotis, K.; Detsis, V.; Pappia, C. Life cycle assessment of bean production in the Prespa National Park, Greece. J. Clean. Prod. 2013, 41, 89–96. [Google Scholar] [CrossRef]
  7. Beccali, M.; Cellura, M.; Iudicello, M.; Mistretta, M. Resource consumption and Environmental impacts of the agrofood sector: Life cycle assessment of Italian citrus-based products. Environ Manag. 2009, 43, 707–724. [Google Scholar] [CrossRef] [PubMed]
  8. Brentrup, F.; Küsters, J.; Kuhlmann, H.; Lammel, J. Application of the Life Cycle Assessment methodology to agricultural production: An example of sugar beet production with different forms of nitrogen fertilizers. Eur. J. Agron. 2001, 14, 221–233. [Google Scholar] [CrossRef]
  9. Nie, S.-W.; Gao, W.-S.; Chen, Y.-Q.; Sui, P.; Eneji, A.E. Use of life cycle assessment methodology for determining phytoremediation potentials of maize-based cropping systems in fields with nitrogen fertilizer over-dose. J. Clean. Prod. 2010, 18, 1530–1534. [Google Scholar] [CrossRef]
  10. Sahle, A.; Potting, J. Environmental life cycle assessment of Ethiopian rose cultivation. Sci. Total Environ. 2013, 443, 163–172. [Google Scholar] [CrossRef] [PubMed]
  11. Xu, M.O.; Xi, L.Z.; Shi, Y.C.; Qing, F.G. Energy Consumption and GHG emission of six biofuel pathways by LCA in (the) People’s Republic of China. Appl. Energy 2009, 86, S197–S208. [Google Scholar] [CrossRef]
  12. BP China. Calculator of Carbon Emission. 2007. Available online: http://www.bp.com/Sectiongenericarticle.do?categoryId=9011336&contented=7025421 (accessed on 25 July 2014).
  13. Wiedema, B.P.; Thrane, M.; Christensen, P.; Schmidt, J.; Løkke, S. Carbon footprint: A catalyst for life cycle assessment? J. Ind. Ecol. 2008, 12, 3–6. [Google Scholar] [CrossRef]
  14. Dubey, A.; Lal, R. Carbon footprint and sustainability of agricultural production systems in Punjab, India, and Ohio, USA. J. Crop Improv. 2009, 23, 332–350. [Google Scholar] [CrossRef]
  15. Wiedmann, T.; Minx, J. A definition of carbon footprint. In Ecological Economics Research Trends; Pertsova, C.C., Ed.; Nova Science Publishers: Hauppauge, NY, USA, 2008; Chapter 1; pp. 1–11. [Google Scholar]
  16. Hillier, J.; Hawes, C.; Squire, G.; Hilton, A.; Wale, S.; Smith, P. The carbon footprints of food crop production. Int. J. Agric. Sustain. 2009, 7, 107–118. [Google Scholar] [CrossRef]
  17. Department of Rural Social and Economic Survey. Statistical Yearbook of China Rural (1985–2011); China Statistics Press: Beijing, China, 2011.
  18. Statistical Bureau of Jilin Province. Jilin Year Book (1985–2014); China Statistics Press: Beijing, China, 2014.
  19. Nemecek, T.; von Richthofen, J.-S.; Dubois, G.; Casta, P.; Charles, R.; Pahl, H. Environmental Impacts of Introducing Grain Legumes into European Crop Rotations. Eur. J. Agron. 2008, 28, 380–393. [Google Scholar] [CrossRef]
  20. Suh, S.; Lenzen, M.; Treloar, G.J.; Hondo, H.; Horvath, A.; Huppes, G. System boundary selection in life-cycle inventories using hybrid approaches. Environ. Sci. Technol. 2004, 38, 657–664. [Google Scholar] [CrossRef] [PubMed]
  21. IPCC. Summary for Policy Makers of Climate change 2007: The Physical Science Basis. In Contribution of Working Group I to the Fourth Assessment Report of the Intergovernmental Panel on Climate Change; Cambridge University Press: Cambridge, UK, 2007. [Google Scholar]
  22. Deng, J.L. Grey Controlling System. Cent. Inst. Technol. 1982, 10, 9–18. [Google Scholar]
  23. Lal, R. Carbon emission from farm operations. Environ. Int. 2004, 30, 981–990. [Google Scholar] [CrossRef] [PubMed]
  24. Liu, X.H.; Xu, W.X.; Li, Z.J.; Zhu, Q.Q.; Yang, X.L.; Chen, B. The Missteps, Improvement and Application of Carbon Footprint Methodology in Farmland Ecosystems with the Case Study of Analyzing the Carbon Efficiency of China’s Intensive Farming. Chin. J. Agric. Resour. Reg. Plan. 2013, 34, 6–61. [Google Scholar]
  25. Cempel, C. Simple Condition Forecasting Techniques in Vibroacoustical Diagnostics Mech. Syst. Signal Process. 1987, 1, 75–82. [Google Scholar] [CrossRef]
  26. Heng, A.; Zhang, A.; Tan, A.; Mathew, J. Rotating Machinery Prognostics—State of the Art, Challenges and Opportunities Mech. Syst. Signal Process. 2009, 23, 724–739. [Google Scholar] [CrossRef]
  27. Kayacan, E.; Ulutas, B.; Kaynak, O. Grey System Theory-Based Models in Time Series Prediction. Expert Syst. Appl. 2010, 37, 1784–1789. [Google Scholar] [CrossRef]
  28. Liu, J.; Yang, H. China fights against statistical corruption. Science 2009, 325, 675–676. [Google Scholar] [CrossRef] [PubMed]
  29. Holz, C.A. The quality of China’s GDP statistics. China Econ. 2014, 30, 309–338. [Google Scholar] [CrossRef]
  30. Rawski, T.G. What is happening to China’s GDP statistics? China Econ. Rev. 2001, 12, 347–354. [Google Scholar] [CrossRef]
  31. Brodt, S.; Kendall, A.; Mohammadi, Y.; Arslan, A.; Yuan, J.; Lee, I.; Lingqust, B. Life Cycle Greenhouse Gas Emissions in California Rice Production. Field Crop. Res. 2014, 169, 89–98. [Google Scholar] [CrossRef]
  32. Hokazono, S.; Hayashi, K. Varibability in Environmental Impacts during Conversion from Conventional to Organic Farming: A Comparison among Three Rice Production Systems in Japan. J. Clean. Prod. 2012, 28, 101–112. [Google Scholar] [CrossRef]
  33. Blengini, D.A.; Busto, M. the Lifecycle of Rice: LCA of Alternative Agri-food Chain Management Systems in Vercelli (Italy). J. Environ. Manag. 2009, 90, 1512–1522. [Google Scholar] [CrossRef] [PubMed]
  34. Mondelaers, K.; Aertsens, J.; van Huylenbroeck, G. A Meta-analysis of the Differences in Environmental Impacts between Organic and Conventional Farming. Br. Food J. 2009, 111, 1098–1119. [Google Scholar] [CrossRef] [Green Version]
  35. Cheng, X.; Han, Ch. Sustainable agricultural development in China. World Dev. 1992, 20, 1127–1144. [Google Scholar] [CrossRef]
  36. Lo, F.; Xing, Y.Q. China’s Sustainable Development Framework—Summary Report; The United Nations University: Tokyo, Japan, 1999. [Google Scholar]
  37. Li, Y.; Zhang, W.; Ma, L.; Huang, G.; Oenema, O.; Zhang, F.; Dou, Z. An Analysis of China’s Fertilizer Policies: Impacts on the Industry, Food Security, and the Environment. J. Environ. Qual. 2014, 42, 972–981. [Google Scholar] [CrossRef] [PubMed]
  38. Huang, Y.; Tang, Y.H. An estimate of greenhouse gas (N2O and CO2) mitigation potential under various scenarios of nitrogen use efficiency in Chinese croplands. Glob. Chang. Biol. 2010, 16, 2958–2970. [Google Scholar] [CrossRef]
  39. Chen, J.; Huang, Y.; Tang, Y. Quantifying Economically and Ecologically Optimum Nitrogen Rates for Rice Production in South-eastern China. Agric. Ecosyst. Environ. 2011, 143, 195–204. [Google Scholar] [CrossRef]
  40. Chen, X.; Zhang, F.; Romheld, V.; Horlacher, D.; Schulz, R.; Boning-Zilkens, M.; Wang, P.; Claupein, W. Synchronizing N Supply from Soil and Fertilizer and N Demand of winter Wheat by an Improved Nmin Method. Nutr. Cycl. Agroecosyst. 2006, 74, 91–98. [Google Scholar] [CrossRef]
  41. Growth and Evolution in China’s Agricultural Support Policies. Available online: http://www.ers.usda.gov/media/1156829/err153.pdf (accessed on 5 August 2013).
  42. The National Development and Reform Commission Price Department. Compilation of Cost and Income Data of Agricultural Products in China; China Statistics Press: Beijing, China, 2014.
  43. Long, L.; Yang, S.; Li, X.; Zhang, F.; Christie, P. Interspecific Complementary and competitive Interactions between Intercropped Maize and Faba Bean. Plant Soil 1999, 212, 105–114. [Google Scholar] [CrossRef]
  44. Zhang, F.; Li, L. Using competitive and Facilitative Interactions in Intercropping Systems Enhances Crop Productivity and Nutrient-Use Efficiency. Plant Soil 2003, 248, 305–312. [Google Scholar] [CrossRef]

