Article

Evaluation of Biomass Yield and Water Treatment in Two Aquaponic Systems Using the Dynamic Root Floating Technique (DRF)

by
Laura Silva
1,
Eucario Gasca-Leyva
1,*,
Edgardo Escalante
2,
Kevin M. Fitzsimmons
3 and
David Valdés Lozano
1
1
Centro de Investigación y de Estudios Avanzados del IPN-CINVESTAV, Km 6 Antigua Carretera a Progreso, C.P. 97310 Mérida, Mexico
2
Centro Regional Universitario de la Península de Yucatán, Universidad Autónoma Chapingo. Ex Hacienda Temozón Norte, C.P. 97310 Mérida, Mexico
3
Department of Soil Water and Environmental Science, College of Agriculture and Life Sciences, The University of Arizona, P.O. Box 210038, Tucson, AZ 85721-0038, USA
*
Author to whom correspondence should be addressed.
Sustainability 2015, 7(11), 15384-15399; https://doi.org/10.3390/su71115384
Submission received: 4 August 2015 / Revised: 23 October 2015 / Accepted: 13 November 2015 / Published: 19 November 2015
(This article belongs to the Section Sustainable Agriculture)

Abstract

:
The experiment evaluates the food production and water treatment of TAN, NO2–N, NO3–N, and PO43− in two aquaponics systems using the dynamic root floating technique (DRF). A separate recirculation aquaculture system (RAS) was used as a control. The fish cultured was Nile tilapia (Oreochromis niloticus). The hydroponic culture in one treatment (PAK) was pak choy (Brassica chinensis,) and in the other (COR) coriander (Coriandrum sativum). Initial and final weights were determined for the fish culture. Final edible fresh weight was determined for the hydroponic plant culture. TAN, NO2–N, NO3–N, and PO43− were measured in fish culture and hydroponic culture once a week at two times, morning (9:00 a.m.) and afternoon (3:00 p.m.). The fish biomass production was not different in any treatment (p > 0.05) and the total plant yield was greater (p < 0.05) in PAK than in COR. For the hydroponic culture in the a.m., the PO43− was lower (p < 0.05) in the PAK treatment than in COR, and in the p.m. NO3–N and PO43− were lower (p < 0.05) in PAK than in COR. The PAK treatment demonstrated higher food production and water treatment efficiency than the other two treatments.

1. Introduction

Many aquaculture systems generate high amounts of wastewater containing compounds, such as suspended solids, total nitrogen, and total phosphorus [1]. Thus, it is important to establish sustainable aquaculture systems that maximize benefits and minimize the accumulation of detrimental compounds and other types of negative impacts on both natural and social environments [2,3]. The concept of sustainability has prompted the need to propose major adjustments in conventional food production systems to make them more viable and compatible with environmental, social and economic needs [4].
One option for sustainable aquaculture is the use of an integrated system. In integrated systems a secondary crop is grown utilizing by-products from the production of a primary crop [5]. If this definition is taken, aquaponics is an example of an integrated system, since in these systems the plants utilize fish wastewater as a source of nutrients, minimizing the negative environmental impact caused by discharge of fish culture water. Thus, aquaponics may be considered as a sustainable aquaculture system.
In aquaponics, two cultures, the fish and the plants, share resources. The choice of a hydroponic growing system within an aquaponics context is based on the independent advantages, the hydroponic component confers on the system [6]. One such hydroponic system is the floating raft system [6,7,8,9]. In this system the plants are placed in a floating sheet (generally of styrofoam). The sheet is then placed over a nutrient solution and the roots of the plants are totally submerged in the nutrient solution. In aquaponics the nutrient solution is composed of fish effluent.
In raft floating systems root aeration can be active. This can be achieved by bubbling air into the nutrient solution through an air stone or by circulating the solution [10]. Oxygenation may also be passive. In this case an air space is left between the sheet that supports the plants and the nutrient solution. The main function of the roots occupying the air space above the solution is aeration and has been described as oxygen roots or hair roots [11,12], this hydroponic system has been called Dynamic Root Floating (DRF).
The DRF technique was developed to stabilize the leafy vegetable productivity during the monsoon summer in Taiwan [12]. This technique is successful in [13] the production of leafy vegetables, such as lettuce, celery, and Brassica spp. throughout the year. The use of the DRF in aquaponics has also been briefly described [14] for lettuce culture in Hawaii. The use of DRF may minimize the investment cost of an aquaponic system as it allows elimination of active aeration in the hydroponic beds.
The use of the DRF technique for pak choy (Brassica chinensis) culture has been reported [12,15]. To our knowledge, the culture of coriander (Coriandrum sativum) has not been reported using the DRF technique, in hydroponics or in aquaponics. However, there are reports of coriander culture in hydroponic systems using direct aeration [16] and in a Nutrient Film Technique system [17]. The aim of this study is the comparison of two aquaponic systems using the DRF technique on pak choy and coriander, with tilapia production and effluent water treatment as a sustainable food production option.

2. Experimental Section

The experiment was carried at the Aquaculture Research Station CINVESTAV-Mérida, during 34 days, from 3 July 2014 to 6 August 2014. Two aquaponic treatments were tested; one using pak choy as the hydroponic culture plant (PAK) and another using coriander (COR). A recirculation aquaculture system (RAS) in which plants were not used, only fish, was used as a control. In the aquaponic hydroponic culture we used the DRF technique as a substitute for active aeration with diffusers.

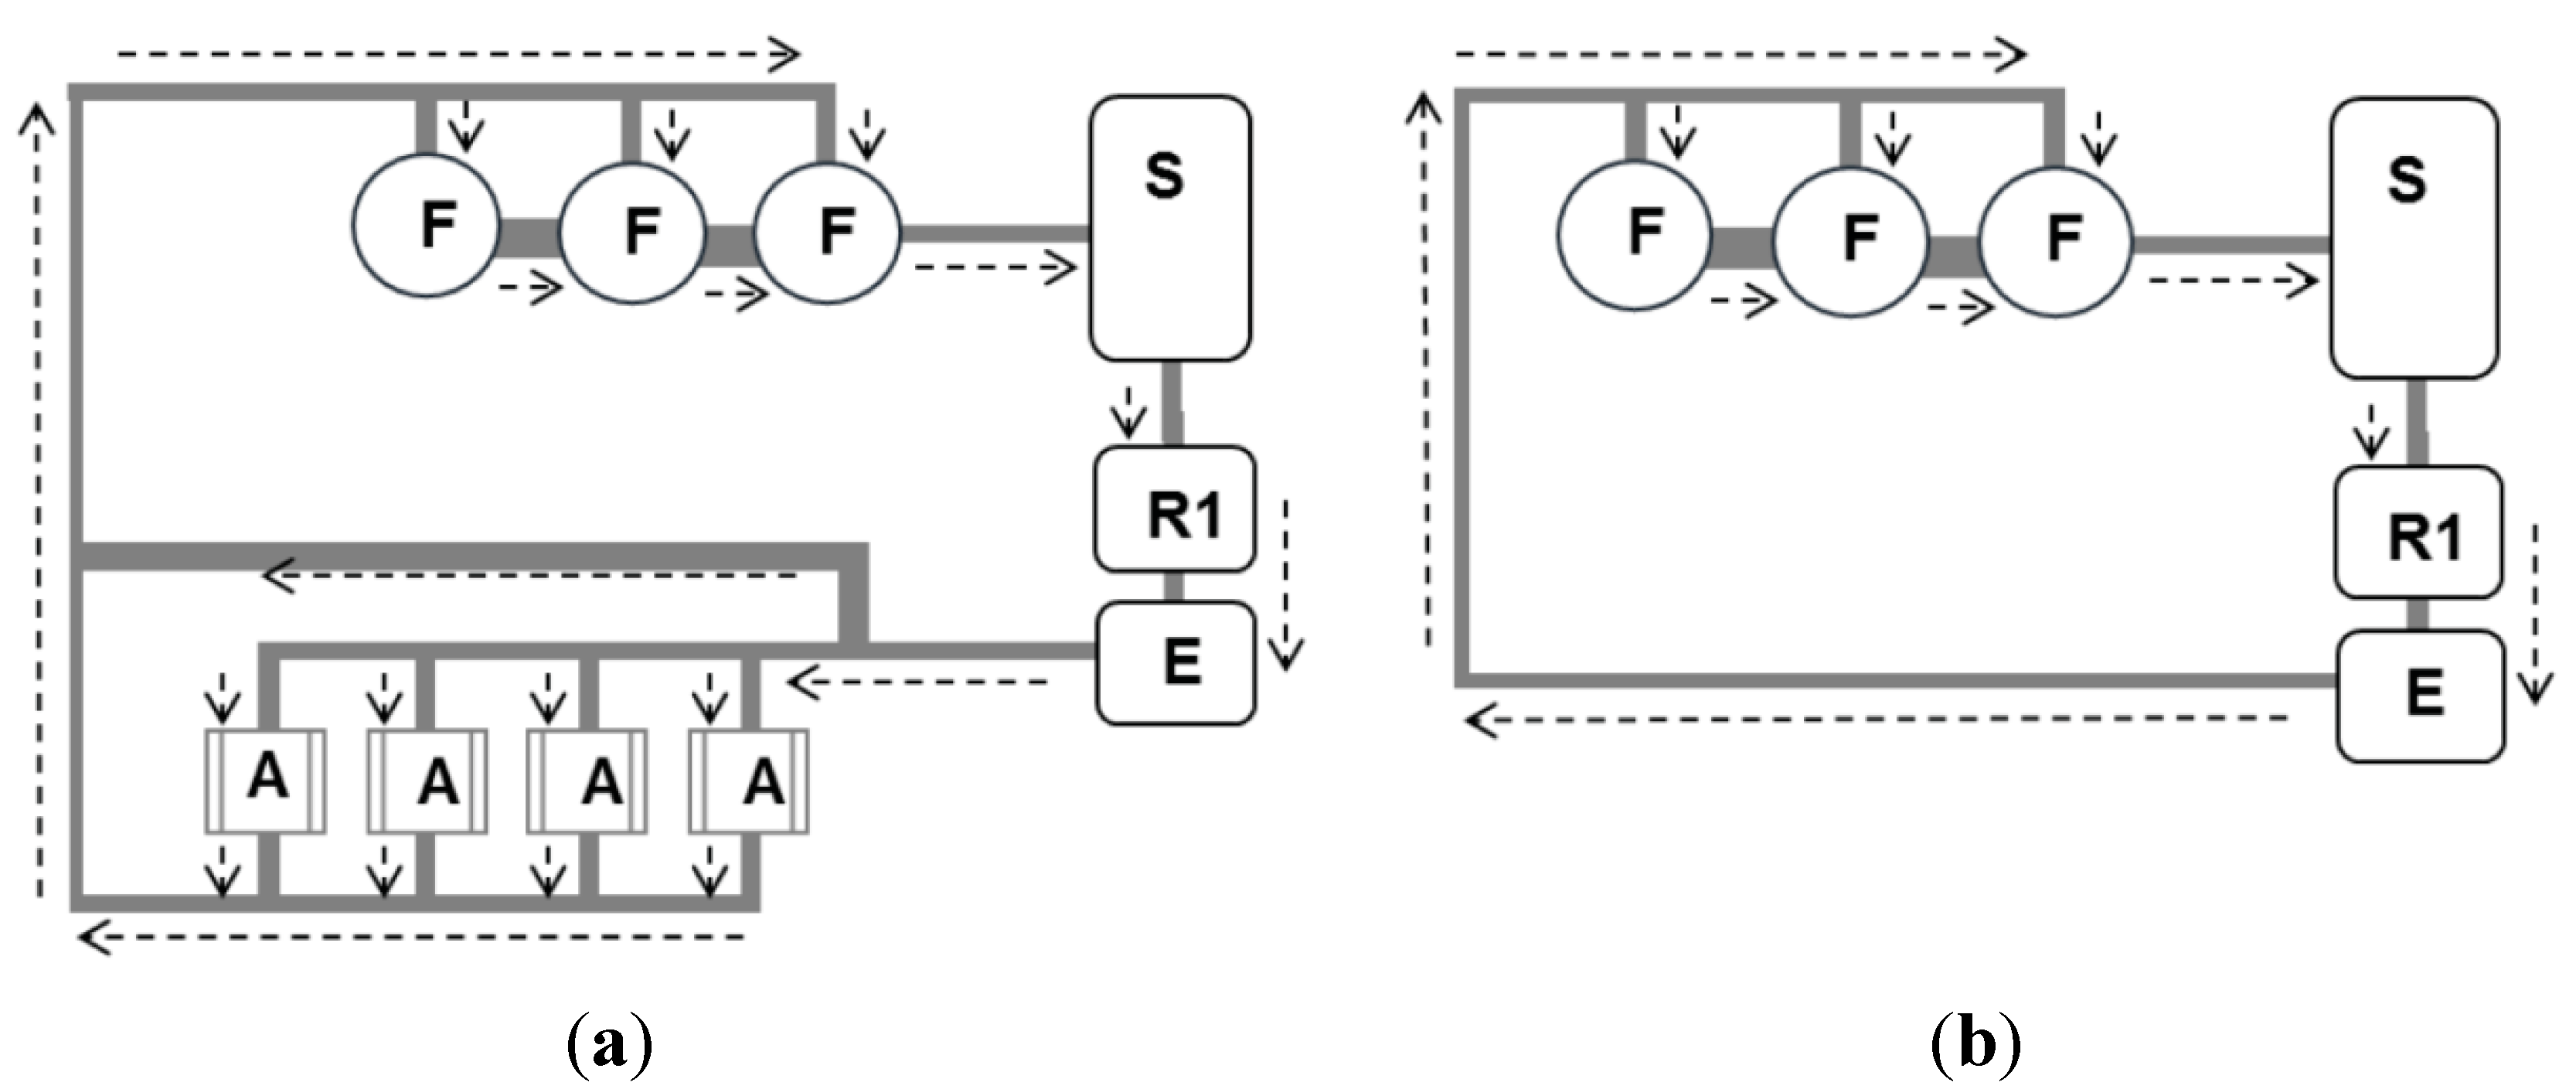
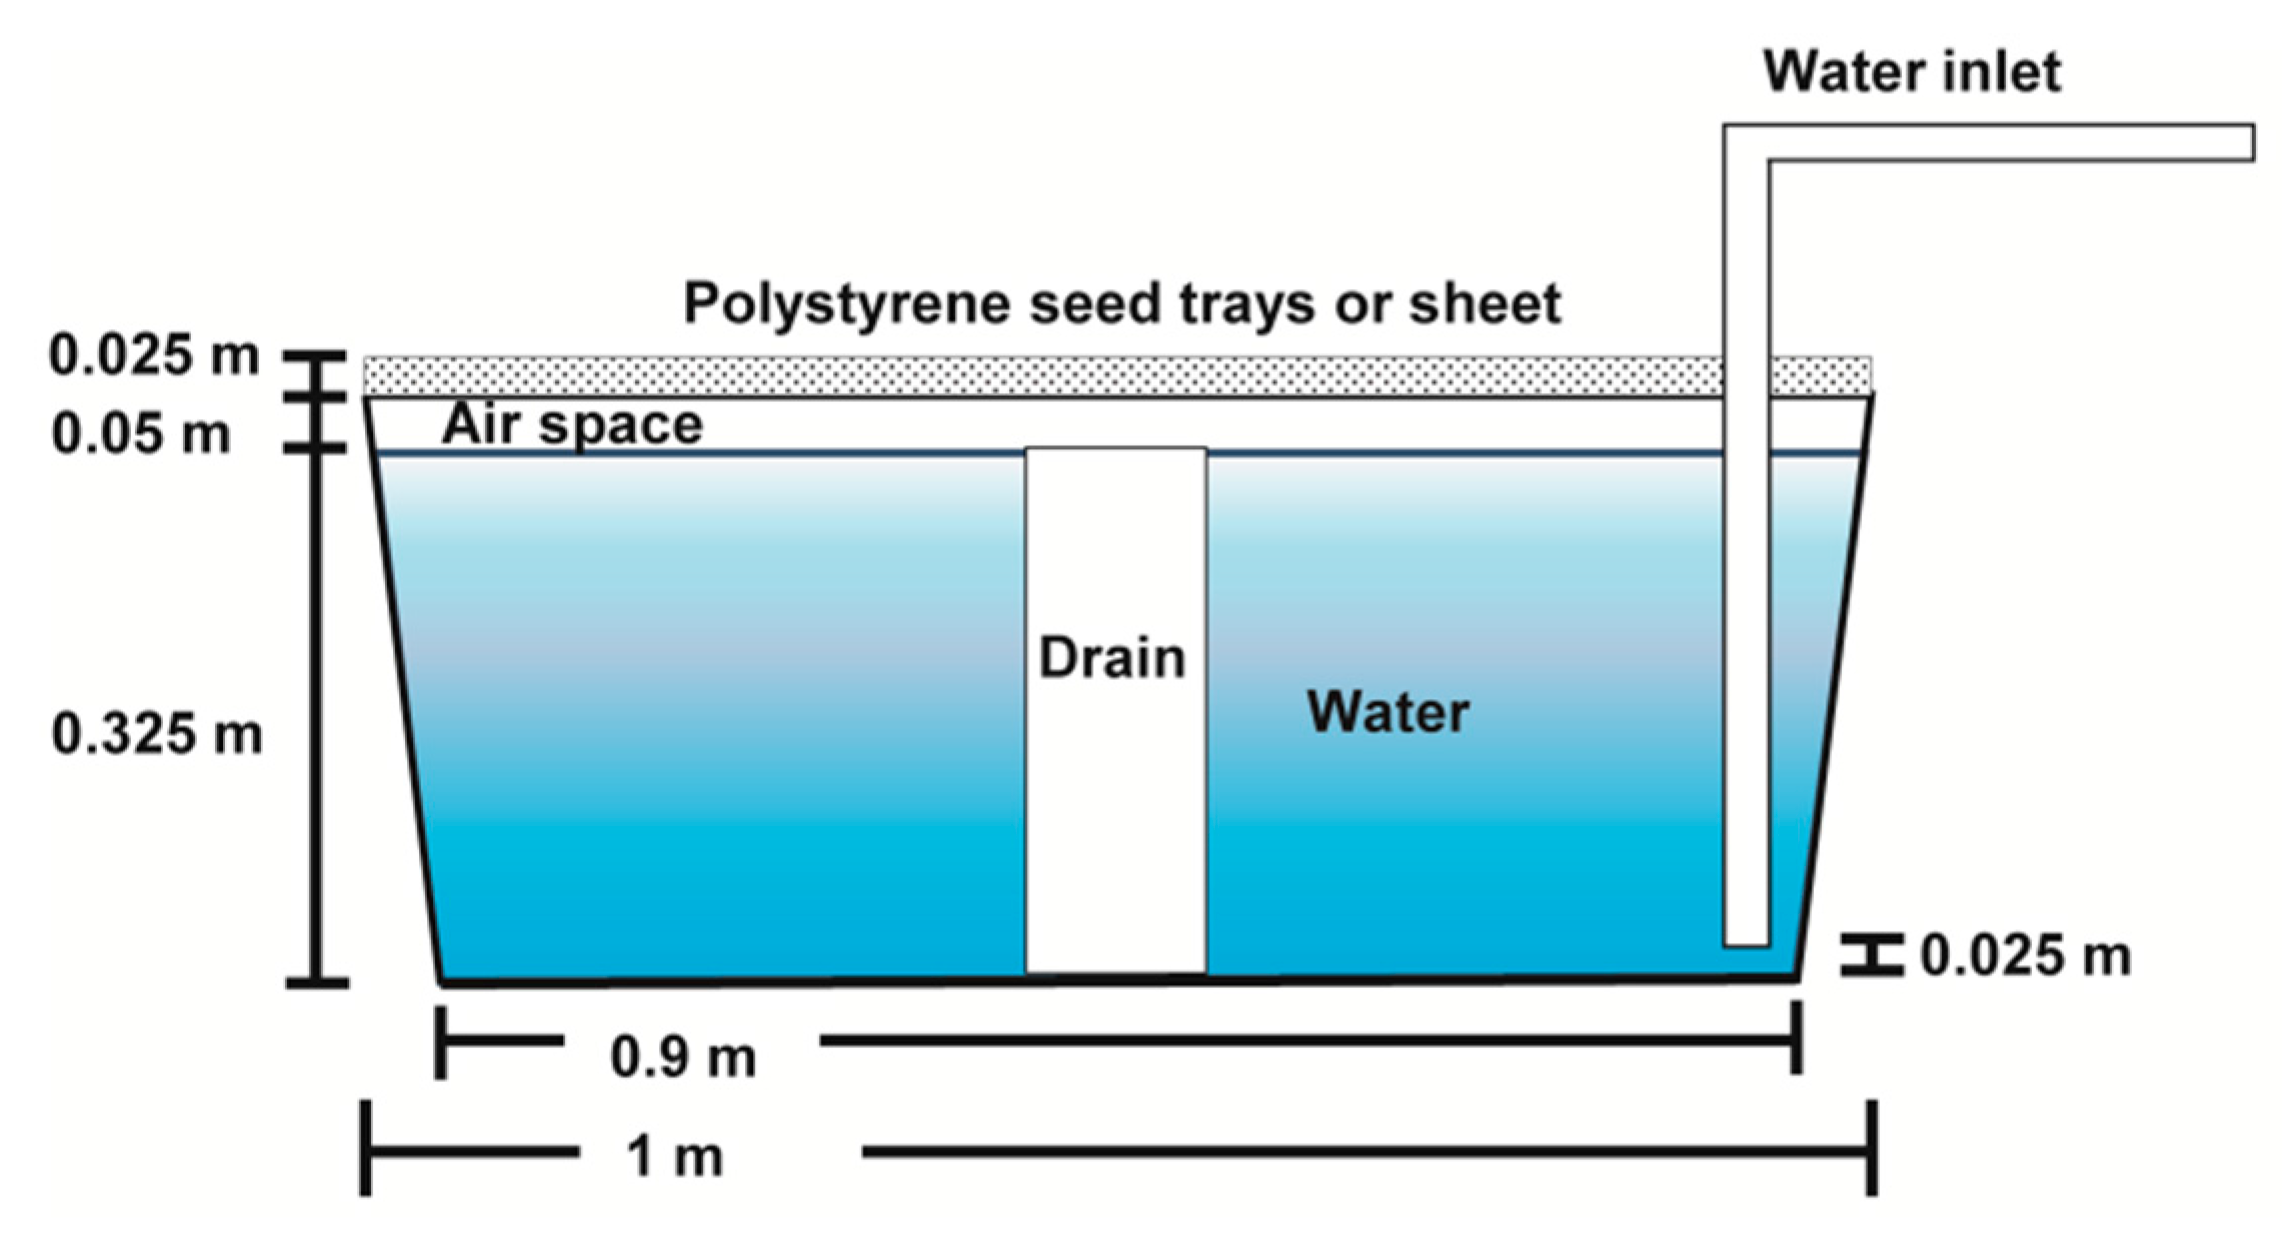
2.1. Experimental System and Operation

The aquaponic systems used three circular fiberglass tanks for fish culture (F), a sedimentation tank (S), a reserve tank that fed the water pump (R1), an elevated tank (E) for water distribution by gravity, and four trapezoidal fiberglass hydroponic tanks (A). The RAS system had the same components as the aquaponics systems except for the hydroponic tanks (Figure 1). The water flux through the fish tanks for the three treatments was continuous with a 13 L/min flow in the fish culture tanks and 6 L/min flow for the hydroponic tanks of PAK and COR. Each (F) tank had 0.75 m3, water from these aquaculture tanks flowing through a 75 mm tube to the rectangular 1.6 m3 sedimentation tank (S). Water from the S tank flowed to a 1 m3 reserve tank (R1) and was then sent to the 0.4 m3 elevated tank (E) using a 1/2 hp water pump. Water from E then flowed through 38 mm tubes to the trapezoidal hydroponic culture tanks except for the RAS treatment for which the water was recycled directly to the fish tanks. Each hydroponic tank was filled at a capacity of 0.36 m3. The effluent from the hydroponic tanks was passed through 50 mm tubes to the reserve tank (R1). Polystyrene seed trays for COR and sheets for PAK were placed on top of each hydroponic tank and the plants were introduced there.
Figure 1. (a) Aquaponic system used for treatments using coriander (COR) and pak choy (PAK), and (b) Recirculation aquaculture system (RAS). F: Fish tanks, S: Sedimentation tank, R1: Reservoir, E: Elevated tank, A: Hydroponic tanks.
Sustainability 07 15384 g001
The hydroponic tanks were located in a shade net house, with a base of 5 × 12 m and a height of 3.5 m. The lateral walls were protected with an anti-aphid net and the roof was made of shade net with 30% sunlight reduction with a UV light stabilizer and antioxidants as a UV photo protection system.

2.2. Experimental Conditions

The coriander plants were transplanted into the aquaponic system fifteen days after being sown in polystyrene seed trays with vermiculite as substrate. Pak choy plants were transplanted seventeen days after being sown in trays with the same characteristics to those used for coriander. When the plants were transplanted, the trial began.
The plant density for treatment COR was 500 plants/m2 and for PAK was 20 plants/m2. In treatment COR the polystyrene seed trays containing the plants were placed directly into the water. In treatment PAK a 25 mm thick sheet of expanded polystyrene with perforations of 25 mm in diameter was placed on top of each hydroponic tank and the plants were placed in these perforations with a sponge around the stalk to provide support. For the COR treatment fifteen days after transplanting, a 5 cm air space was established (Figure 2) by changing the drain pipe for a shorter one and introducing a PVC support to sustain the polystyrene sheet or seed tray over the water, in the case of PAK the space was established seven days before the transplant.
Figure 2. Hydroponic tank utilized during the experiment, each treatment had four hydroponic tanks or replicates.
Sustainability 07 15384 g002
At the beginning of the plant culture and in both treatments, 1 mL of stock solution of micronutrients was added to each 10 L of water [18]. Iron, in chelated form, was added during the experiment in order to reach a 3 mg/L concentration. Iron content was measured in the morning every three days, before the feeding of the fish, with HACH iron colorimetric test kits, model IR-18A and IR-18B.When the concentration decreased to 0.3 mg/L, iron was added again in the reservoir system component, after the last fish feeding of the day, in order to reach the 3 mg/L concentration. The iron was added every three days at the beginning of the trial and every six the last two weeks of the trial. At the end of the trial, edible portions of 20 individual COR plants in each replicate were measured and fresh and dry weights determined. For PAK replicates, edible portions of four individual plants from the center of the array were measured. Fresh, dry weight and leaf height were measured. To determine dry weight, plants were dried in an oven at 60 °C for eight hours for the COR treatment and for 72 h for the PAK treatment, until a constant weight had been reached. Yield (kg/m2) was calculated using the average fresh weight obtained per square meter in each treatment, taking into account that only the 84% of the area would be utilized [10]. Approximate pak choy N uptake (in edible portion) was calculated using the N content reported by USDA [19] multiplied by the total yield obtained.
For the fish culture in each replicate, we introduced 12 fish with an average weight of 198.5 ± 0.1 g in treatments COR and PAK and 198.1 ± 0.1 g in the RAS. Fish were fed four times daily, with commercial formulated feed (35% crude protein) at 9:30, 12:00, 14:30, and 16:30. The daily feeding rate was 2.5% of total fish biomass. Every two weeks fish total biomass was weighed in order to adjust the amount of feed to their biomass. At the end of the trial nine fish were weighed from each replicate.

2.3. Water Quality and Nutrient Compounds

Daily, alternating between a.m. and p.m., temperature, dissolved oxygen (D.O.), pH, and conductivity were measured in the hydroponic and fish culture tanks with a digital multi-meter YSI 556 MPS (Multiprobe System) from YSI Incorporated, Yellow Springs, Ohio, USA. The a.m. measurement was approximately at 09:00, before the fish were fed, and the p.m. measurement was approximately 15:15, just before the last feeding of the day. In order to analyze the nutrient contents in hydroponic and fish culture tanks, water samples were collected twice a week from each replicate, one day in the morning and one day in the afternoon. A total of ten samplings were performed, five in the a.m. and five in the p.m. In each sampling a total of 17 samples were taken, nine in the aquatic component that correspond to the three replicates of the three treatments and eight in the hydroponic component that correspond to the four replicates in each treatment. The analyzed nutrients in the water were total ammonia nitrogen (TAN), nitrite-nitrogen (NO2–N), nitrate-nitrogen (NO3–N), and phosphate (PO43−). The concentration of NO2–N, NO3–N, and PO43− were analyzed and quantified in the Aquaculture Laboratory at CINVESTAV by colorimetry (APHA, 1992) using a Technicon Analyzer II and processed by the New Analyzer Program (NAP) software. The TAN was analyzed in the Marine Chemistry Laboratory at CINVESTAV using the phenol method. Average concentrations of NH3 from water of the fish culture were calculated using the equation proposed by Emerson et al. [20].

2.4. Statistical Analyses

Fish weight, fish final density and productivity, water quality parameters, and nutrient content in the fish culture tanks were analyzed using one way ANOVA and posteriori Student’s t-test in order to compare between treatments. Except for NO2–N and NO3–N in p.m.; TAN and NH3 in the a.m. where a Kruskall–Wallis test was used due to lack of normality in the data. For the comparison of nutrient and water parameters between a.m. and p.m. the dependent t-test for paired samples was applied for all the variables except for NO2–N in treatment PAK, NO3–N and NH3 in COR, and TAN in RAS due to lack of normality.
For the hydroponic culture, on one side of the greenhouse there were two tree trunks that provided some shade in the p.m., hence a random complete block design was applied, with four blocks (B1, B2, B3, and B4). Water parameters and nutrient concentration in the hydroponic tanks between treatments in the same hour were analyzed with a two way ANOVA, except for PO43− in a.m. and NO3–N in p.m., where the Friedman test was used due to the lack of data normality. For nutrient and water parameters tests between a.m. and afternoon the dependent t-test for paired samples was applied, except for TAN in PAK treatment and NO3–N in COR.

3. Results

3.1. Food Production

Fish survival rate was 100% in treatment PAK and 97.2% ± 4.8% in COR and RAS. The mortality in COR and RAS was a product of aggressive behavior. For the final fish weight, feeding conversion rate (FCR), final fish density, fish biomass productivity, there were no significant differences (p > 0.05) among the treatments (Table 1).
Table 1. Nile tilapia growth and FCR during the 34 experimental days, the fish were fed four times every day at a 2.5% feeding rate with 35% crude protein commercial formulated fish food.
VariableUnitTreatment
CORPAKRAS
Initial weightkg0.198 ± 1 × 10−40.198 ± 1 × 10−40.198 ± 1 × 10⁻⁴
Final weightkg0.311 ± 1× 10−20.301 ± 1.2 × 10−20.306 ± 1.1 × 10⁻²
FCR-1.8 ± 0.21.9 ± 0.11.9 ± 0.1
Initial densitykg/m33.066 ± 0.0023.065 ± 0.0013.068 ± 0.005
Final densitykg/m34.845 ± 0.3574.816 ± 0.1854.756 ± 0.092
Fish biomass productivitykg/m31.778 ± 0.355.1.751 ± 0.1861.688 ± 0.096
Average daily fish food providedkg/tank0.0698 ± 6.6 × 10−30.0715 ± 2.3 × 10−30.0701 ± 2.6 × 10⁻³
Ratio of fish food/growing plant areakg/m20.05240.0537-
Plant survivorship, for COR treatment, was 49.7% and for PAK 97.5%. In the case of COR the plants acquired a basal root disease (Figure 3) and did not achieve the local commercial size of 10–15 cm.
Figure 3. Coriander plants in different stages of basal root disease, probably associated with a fungal infection of the genus Rhizoctonia or Pythium. From left to right: chlorotic leaves and basal root necrosis, plant leaves wilting and, finally, dead plant.
Sustainability 07 15384 g003
The growth of pak choy was poor during the first week before the air space was established. Afterwards the hair roots were developed and the plants began to grow more quickly (Figure 4).
Figure 4. Pak choy roots with hair root development on the root exposed to the air.
Sustainability 07 15384 g004
All the values of final measured individual parameters in the plants were greater for the PAK treatment than for COR (Table 2). Pak choy yield was 2.5 kg/m2.
Table 2. Final parameters per plant for both treatments.
ParameterUnitTreatment
PAKCOR
Edible fresh weightkg/plant0.117 ± 0.0612 × 10⁻⁴ ± 1.6 × 10⁻⁴
Root fresh weightkg/plant0.022 ± 0.0112.3 × 10−4 ± 2.7 × 10⁻⁴
Edible dry weightkg/plant0.007 ± 0.0033 × 10⁻⁵ ± 2 × 10⁻⁵
Root dry weightkg/plant0.002 ± 8 × 10−43 × 10−4 ± 5 × 10⁻⁴
Leaf lengthcm26.9 ± 4.3-
For the aquaponic systems the total edible plant biomass in PAK treatment was 9.16 kg. The fish biomass was 3.70 kg in PAK treatment, 3.83 kg in COR, and 3.56 kg in RAS. The ratio of biomass (kg) produced of plant to fish production was 2.48 in treatment PAK. The calculated pak choy N assimilation, in edible parts, was 5.36 ± 1.34 g/m2.

3.2. Water Parameters

For the fish culture tanks, the D.O. and pH were significantly higher (p < 0.05) in the a.m. than in the p.m. Conductivity was similar in all treatments (p > 0.05); meanwhile, temperature was higher (p < 0.05) in the p.m. than in the a.m. for COR and RAS treatments but not for PAK (Table 3).
Table 3. Average values of physicochemical parameters in fish tanks during the experiment.
TimeTreatmentTemperature (°C)pHD.O. (mg/L)Conductivity (mS)
a.m.COR29.20 ± 0.02 a,18.37 ± 0.03 a,16.16 ± 0.12 a,11.041 ± 4.4 × 10⁻⁴ ab,1
PAK29.14 ± 0.07 a,18.47 ± 0.02 b,16.06 ± 0.20 a,11.036 ± 9.9 × 10⁻⁴ a,1
RAS29.14 ± 0.03 a,18.27 ± 0.02 c,16.03 ± 0.06 a,11.058 ± 1.2 × 10⁻⁴ b,1
p.m.COR30.69 ± 0.09 ab,28.32 ± 0.04 a,25.61 ± 0.14 a,21.060 ± 4.6 × 10⁻⁴ a,1
PAK30.75 ± 0.09 a,18.41 ± 0.03 b,25.43 ± 0.25 a,21.065 ± 3.2 × 10⁻³ ab,1
RAS30.28 ± 0.03 b,28.19 ± 0.02 c,25.38 ± 0.08 a,21.077 ± 1.2 × 10⁻³ b,1
Different superscript letters (a,b,c) denote statistically significant differences between treatments and different superscript numbers (1,2) denote statistically significant differences between hours (p < 0.05).
In the hydroponic component for both treatments almost all the variables were higher in the p.m. than in the a.m. (p < 0.05) except for D.O., which was lower in afternoon than in the a.m. (p < 0.05). There were differences between treatments (p < 0.05) for conductivity and pH. In the a.m. and in the p.m. the pH was higher in PAK treatment than in COR and the conductivity was higher in COR than in PAK (Table 4).
Table 4. Average a.m. and p.m. values of physicochemical water quality parameters in hydroponic tanks during the experiment.
TimeTreatmentTemperature (°C)pHD.O. (mg/L)Conductivity (mS)
a.m.COR29.33 ± 0.10 a,18.32 ± 0.02 a,16.11 ± 0.11 a,11.042 ± 2.2 × 10⁻³ a,1
PAK29.19 ± 0.10 a,18.40 ± 0.02 b,16.14 ± 0.13 a,11.033 ± 1.6 × 10⁻³ b,1
p.m.COR31.04 ± 0.09 a,28.37 ± 0.02 a,26.03 ± 0.05 a,11.057 ± 5.7 × 10⁻⁴ a,2
PAK31.06 ± 0.07 a,28.44 ± 0.01 b,25.91 ± 0.12 a,21.054 ± 5.4 × 10⁻⁴ b,2
Different superscript letters (a,b,c) denote statistically significant differences between treatments and different superscript numbers (1,2) denote statistically significant differences between hours (p < 0.05).

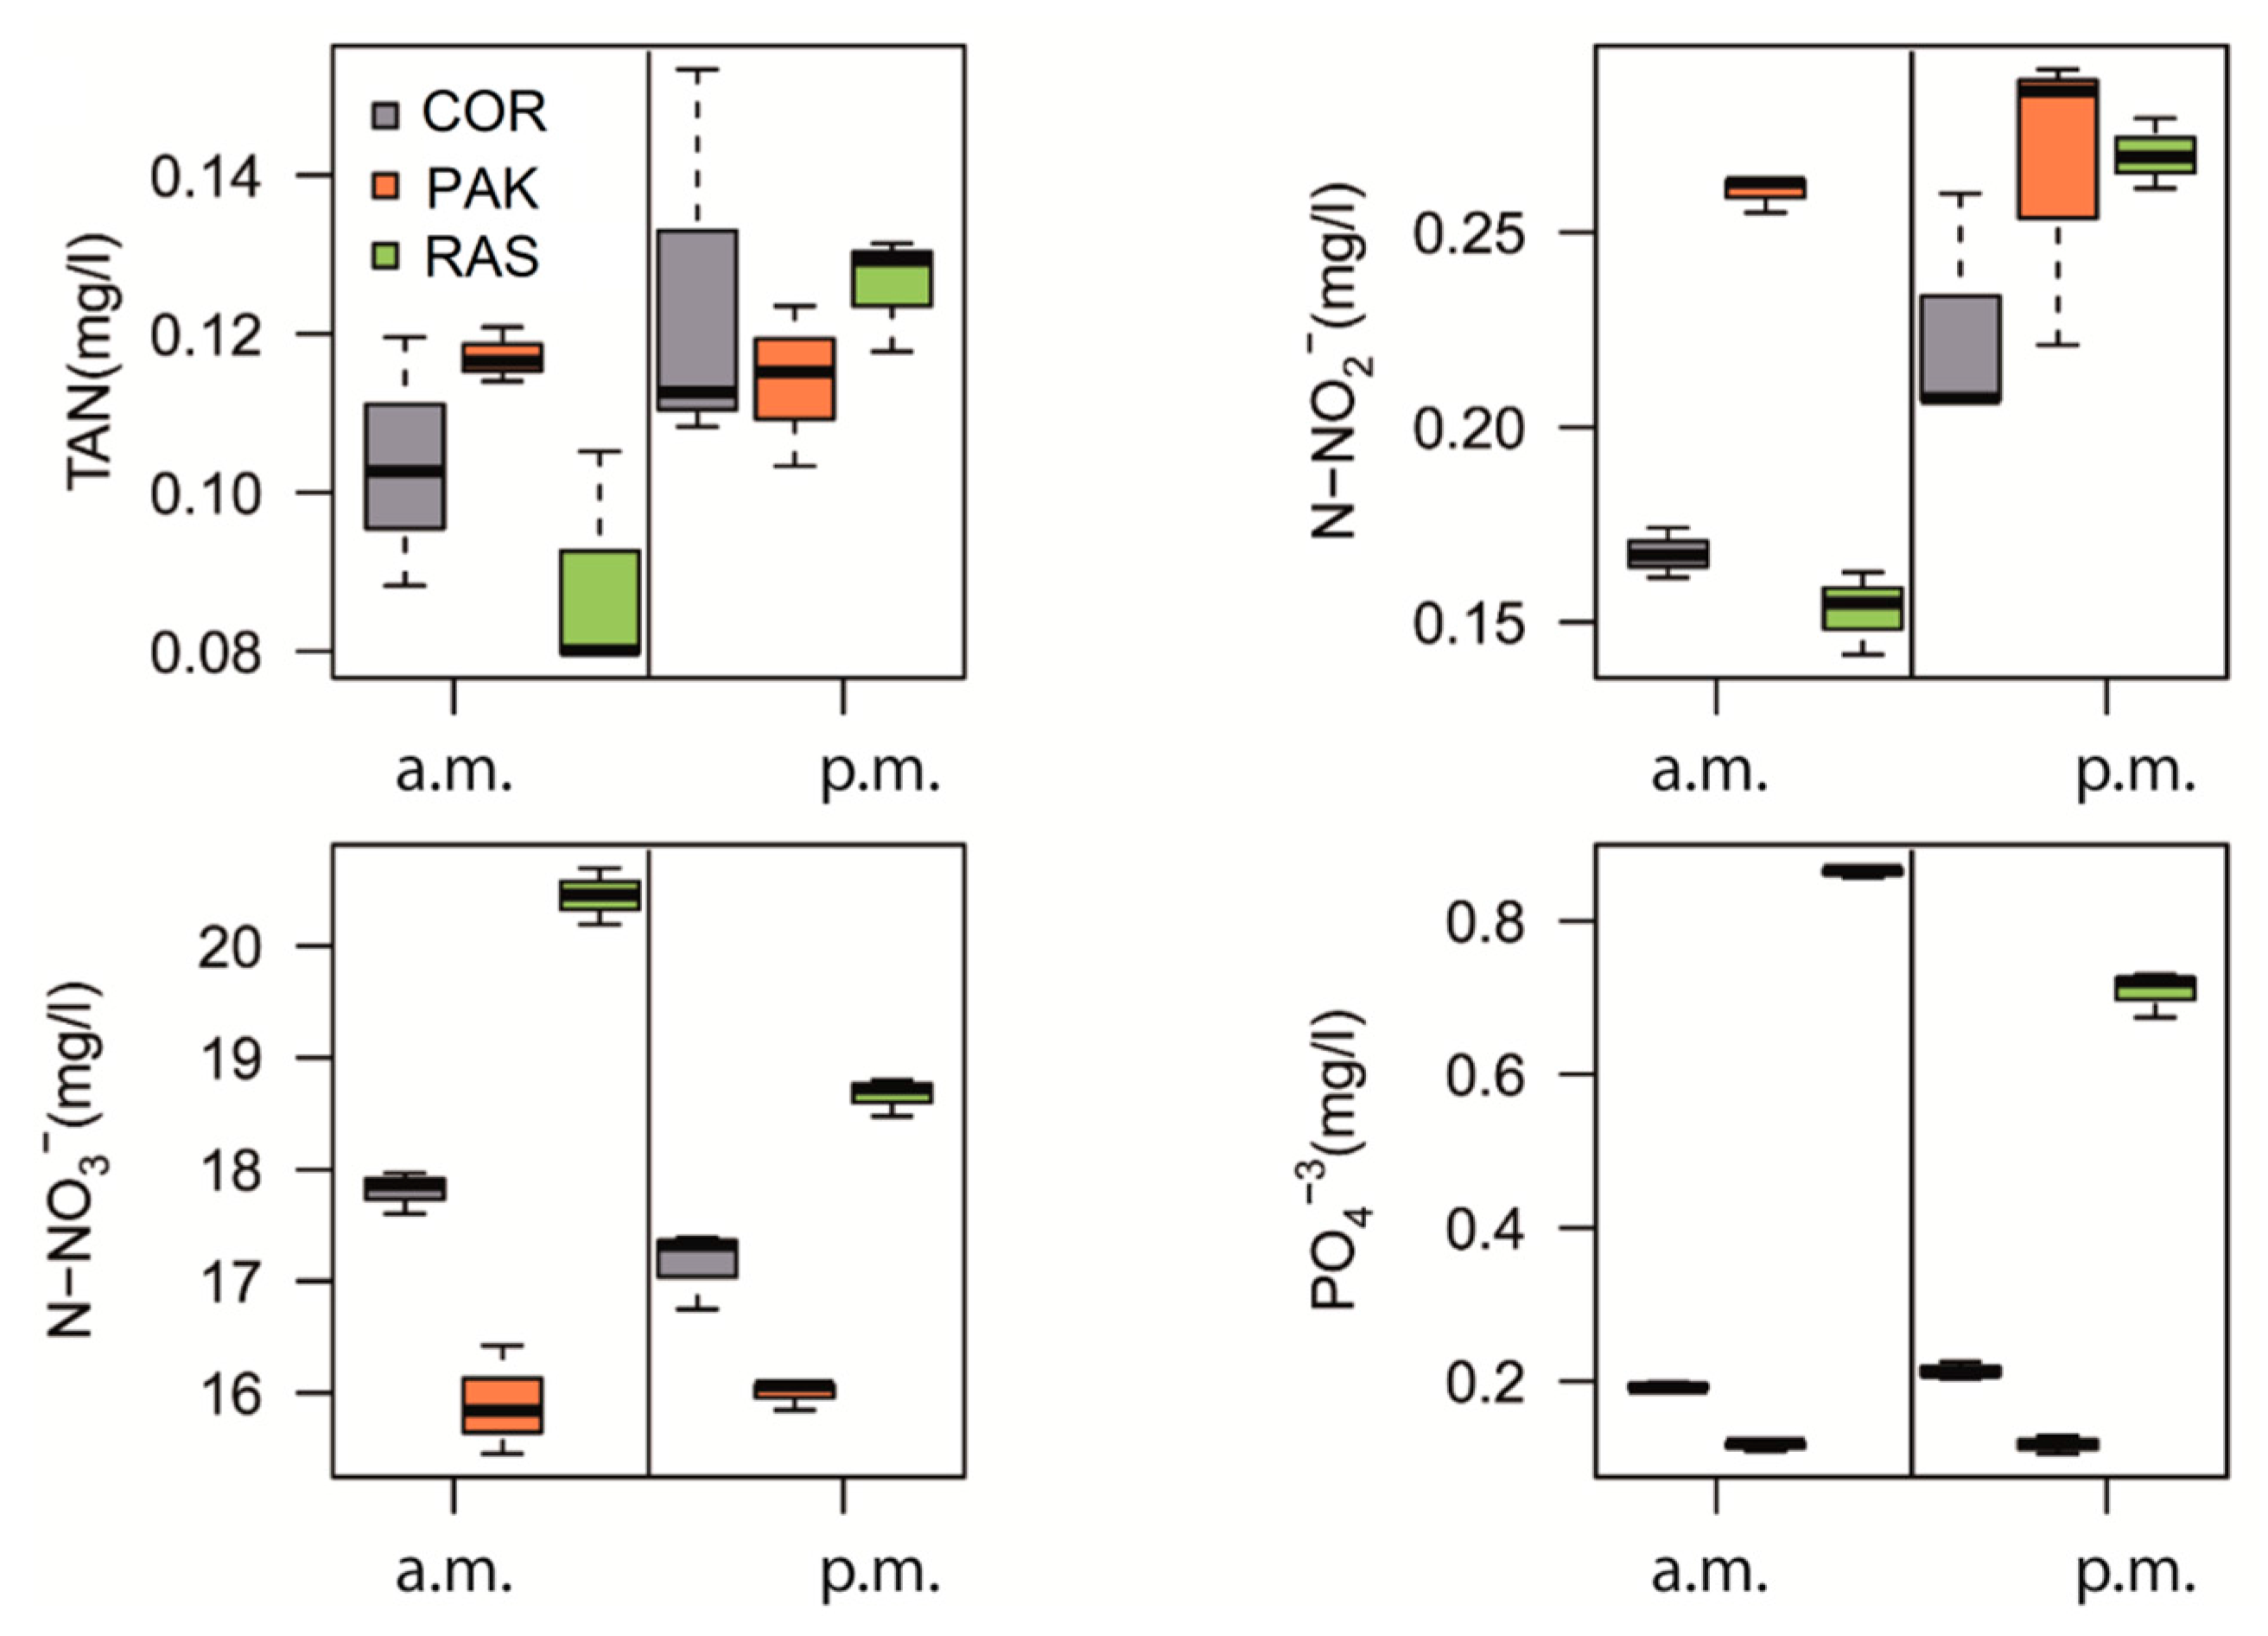
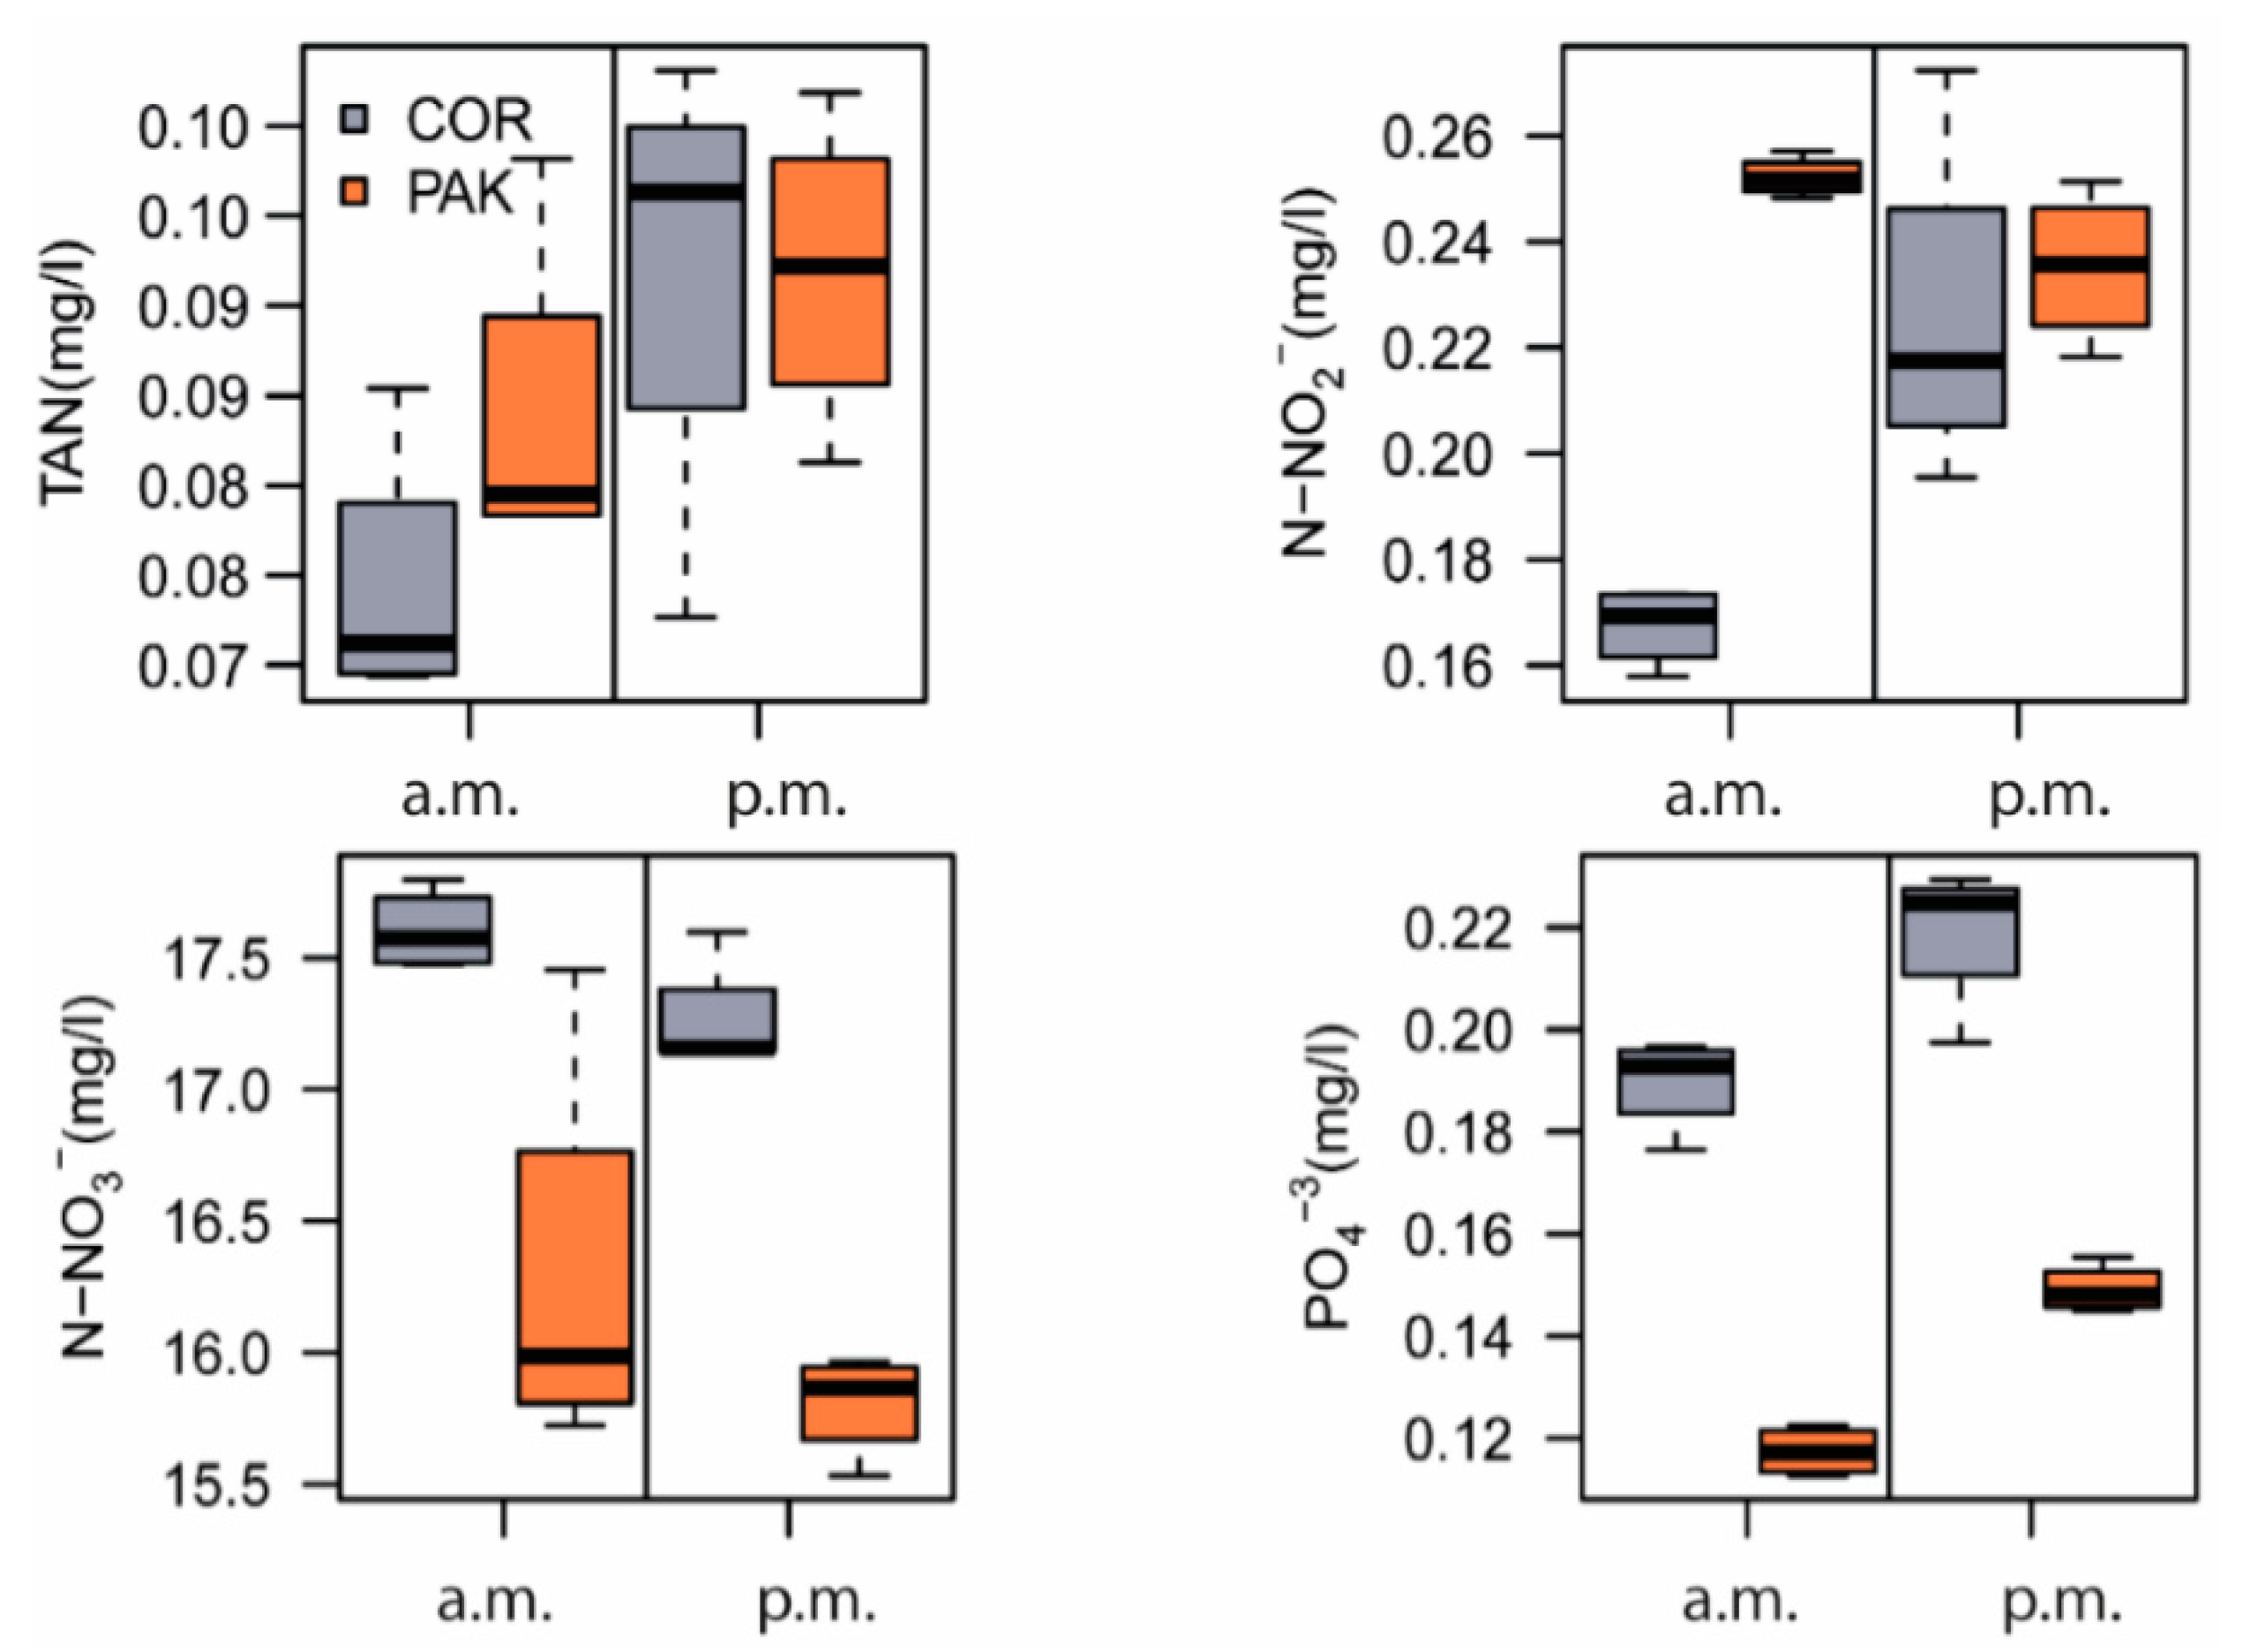
3.3. Water Treatment

In the fish culture in a.m. there were no differences (p > 0.05) in TAN concentrations. The NO2–N concentration levels was similar (p > 0.05) for COR and RAS treatments and different for PAK. The NO3–N and PO43− concentrations were different for all treatments (Figure 5, Table 5). In the p.m. there were no differences (p > 0.05) among treatments in NO2–N and TAN concentrations, there were differences (p < 0.05) among all the treatments in PO43− concentrations, and there were differences between NO3–N concentrations in treatments PAK and RAS, but there were no differences between COR and PAK and COR and RAS (Figure 5, Table 5).
The comparison between hours in the same treatment showed no differences (p > 0.05) for TAN concentrations in all treatments. For NO2–N concentrations, only in the case of treatment RAS there were differences (p < 0.05). For NO3–N, there were differences (p < 0.05) in COR and PAK treatments, but not in RAS. In the case of PO43−, only RAS treatment had differences between hours (p < 0.05).
Table 5. Average values of nutrient concentration in the fish culture during the experiment in the a.m. and the p.m. times.
TimeTreatmentTAN (mg/L)NO2–N (mg/L)NO3–N (mg/L)PO43− (mg/L)
a.m.COR0.104 ± 0.016 a,10.168 ± 0.006 b,117.810 ± 0.187 b,10.193 ± 0.005 b,1
PAK0.117 ± 0.003 a,10.260 ± 0.005 c,115.906 ± 0.487 a,10.116 ± 0.006 a.1
RAS0.088 ± 0.015 a,10.153 ± 0.011 a,220.449 ± 0.252 b,10.864 ± 0.006 c,2
p.m.COR0.125 ± 0.025 a,10.225 ± 0.031 a,117.155± 0.354 ab,20.214 ± 0.011 b,1
PAK0.114± 0.010 a,10.266 ± 0.039 a,115.995 ± 0.128 a,10.118 ± 0.012 a,1
RAS0.126 ± 0.007 a,10.270 ± 0.009 a,118.667 ± 0.170 b,20.708 ± 0.030 c,1
Different superscript letters (a,b,c) denote statistically significant differences between treatments and different superscript numbers (1,2) denote statistically significant differences between hours (p < 0.05).
Figure 5. Average nutrient concentrations in fish culture; in the case of phosphates the treatment order for both a.m. and p.m. is COR, PAK, and RAS.
Sustainability 07 15384 g005
In the fish culture the calculated NH3 only had differences (p < 0.05) between PAK and RAS treatments in the a.m. where the concentration was lower in RAS than in PAK. The comparison between hours only had differences for treatment RAS (Table 6) where the p.m. concentration was higher than the a.m. concentration.
Table 6. Average calculated values of NH3 concentration in (mg/L) in the fish culture during the experiment in a.m. and p.m.
Treatmenta.m.p.m.
COR0.014 ± 0.001 ab,10.018 ± 0.004 a,1
PAK0.018 ± 0.002 b,10.020 ± 0.003 a,1
RAS0.009 ± 0.001 a,10.015 ± 0.001 a,2
Different superscript letters (a,b,c) denote statistically significant differences between treatments and different superscript numbers (1,2) denote statistically significant differences between hours (p < 0.05).
In the hydroponic culture in the a.m. there were differences (p < 0.05) for TAN, NO2–N and PO43− concentrations between the treatments. In the p.m. there were differences for NO3–N and PO43− concentrations between treatments being higher in COR than in PAK. For both treatments there were no differences in TAN, NO2–N, and NO3–N concentrations between hours, and there was for PO43− concentration (Table 7, Figure 6).
Figure 6. Average nutrient concentrations in hydroponic tanks during the experiment.
Sustainability 07 15384 g006
Table 7. Average values of nutrient concentrations from the ten samples taken in the hydroponic cultures, five in a.m. and five in p.m., during the 34 experimental days (n = 4).
TimeTreatmentTAN (mg/L)NO2–N (mg/L)NO3–N (mg/L)PO43− (mg/L)
a.m.COR0.079 ± 0.007 a,10.167 ± 0.008 a,117.606 ± 0.154 a,10.190 ± 0.009 b,2
PAK0.089 ± 0.004 b,10.252 ± 0.010 b,116.287 ± 0.792 a,10.117 ± 0.005 a,2
p.m.COR0.097 ± 0.033 a,10.226 ± 0.013 a,117.264 ± 0.224 b,10.219 ± 0.015 b,1
PAK0.097 ± 0.014 a,10.235 ± 0.009 a,115.806 ± 0.195 a,10.149 ± 0.005 a,1
Different superscript letters (a,b,c) denote statistically significant differences between treatments and different superscript numbers (1,2) denote statistically significant differences between hours (p < 0.05).

4. Discussion

4.1. Fish and Plant Production

El-Shafai et al. [21] and El-Sherif and El-Feky [21] had shown that chronic exposure to concentration levels higher than 0.1 mg/L of NH3 can significantly inhibit growth in tilapia fingerlings, and that growth performance decreases and FCR increases as the concentration of NH3 increases. The concentrations of NH3 found in the experiment are lower than the concentration that cause significant effects in tilapia growth [21,22]. Thus, even when there were differences in NH3 concentrations between RAS treatment and COR and PAK treatments in the a.m., there were no differences in final fish weight among treatments. In the case of RAS treatment, the lower pH than for COR and PAK contributed to a low level of NH3 since the percent of this compound depends of pH and temperature [20].
The NO2–N concentrations that are reported to cause methemoglobin increases in tilapia are in the range of 0.50 and 1.38 mg/L [23]. These are higher values than those reported in the present work. The FCR obtained in all treatments was higher than the 1.4 value reported for Al-Hafed et al. [9] and for the 1.37 value obtained for Espinoza Moya et al. [24] for tilapia of similar weight in an aquaponic system, but similar to the values reported for Rakocy et al. [7] for tilapia in aquaponic systems.
In PAK treatment, the plants reached commercial height size in accord with the 20–50 cm reported for Hu [25] and Ronzio [26]. The plant weight was lower than the commercial size of 0.225–0.260 kg reported by Hu [25], however, the yield is within the range of 0.5–7 kg/m2 reported for FAO [27] for soil culture.
In aquaponics, Kotzen and Appelbaum [28] report poor coriander growth in an aquaponic system using fresh and brackish water in a floating bed technique system. However, in our case, in the COR treatment the cause of the poor plant growth was the disease which can be associated with a fungal infection by fungi of the genus Rhizoctonia or Pythium, as indicated by symptoms of poor growth, yellow leaves, and dark marks in the root [29,30].
The use of the DRF technique has been reported before for pak choy [12,15] in hydroponic systems and for lettuce [14] in aquaponic systems. To our knowledge there are no reports of coriander culture using the DRF technique, neither in aquaponics nor in hydroponics.
The low weight in the pak choy may be related to several factors, including the technique utilized in order to establish the DRF technique, the NO3–N, and iron concentration in the culture water, or the pak choy growth period. In the case of the NO3–N, the concentration of both treatments was within the previously reported range of 5 to 32 mg/L in aquaponic systems [9,24,31,32,33] and the plants did not present visual nitrogen deficiencies symptoms. However the concentration was lower than the minimum reported by several authors [10,18] for hydroponic production and could be the cause of the pak choy low weight. The low concentration in aquaponic systems could be due to the constant production and removal of NO3–N in these systems, as Endut et al. [31] had demonstrated.
In the case of the iron levels, the constant addition in order to reach the 3 mg/L concentration was due to the high alkalinity water in the experimental facilities [34], that produces iron precipitation. Even when the pak choy shows no visual symptoms of iron deficiency this iron precipitation could have influenced the pak choy growth. A solution to this problem has been proposed by Roosta et al. [35,36] who utilized a foliar iron application for pepper and eggplant in aquaponic systems.
In each replicate in the first week there was no direct aeration in the hydroponic cultures due to considerations of simplifying the system and minimizing investment cost of the installation of air diffusers. Even when during this first week the D.O. values were above 5 mg/L the plant growth in both aquaponic treatments was poor. Kao [12] and Remy et al. [15] have reported that they established the air space gradually using a special water level adjuster located outside of the plant culture bed allowing the contact of the root with the air at the beginning of the culture. Since the water leveler was inside the plant culture bed, and establishing the air space gradually would have represented a lot of root plant handling, we established the 5 cm air space at one time (when the roots reached at least that length). Another factor that may have contributed to the low harvest weight obtained was that the pak choy growth period was 34 days, which is seven days shorter than that used in other experiments [27,37,38,39].

4.2. Water Quality Parameters

Water quality parameters were within the ranges for healthy growth of tilapia [40]. In all treatments the pH level of the aquaponic solution was above the range reported as the one that most plants prefer (6.0–7.0) for optimum nutrient uptake. A pH value of 8.5 can limit nutrient availability (N, Bo, Fe, Mn, Cu, and Zn) but does not inhibit it [10]. Pak choy showed no visual deficiency symptoms during the experiment, coriander showed yellowing of leaves, but this was associated with the root disease [28,30] and not with a direct nutrient deficiency.

4.3. Water Treatment and Nutrient Uptake

Fish Culture

For the fish culture, the PAK treatment was the one which had the better nutrient uptake performance, the NO3–N and PO43− concentrations were lower than those for COR and RAS treatments for both a.m. and p.m. The concentration levels of PO43− were higher in RAS than in the other treatments, which show the PO43− uptake realized by the plants in both cases. In the case of NO3–N the similar concentration levels for RAS and COR treatments suggests that the NO3–N uptake by the plants in this treatment was not enough to cause differences between the treatments RAS and COR. Whereas there were differences between RAS and PAK treatments that show the NO3–N uptake realized by pak choy plants. This is coincident with the higher plant biomass obtained in PAK than in COR and with the lack of plant production in RAS treatment.
The NH3 and NO2–N which are the toxic metabolites for the fish showed differences among treatments in the a.m. In the case of NO2–N the concentration was lower (p < 0.05) in RAS followed by COR and PAK, respectively. In the case of NH3 the concentration was lower (p < 0.05) in COR and RAS than in PAK which were similar. In this case this may be interpreted as if the RAS treatment is the best option as a healthier alternative for the fish, however as we pointed previously the levels of NH3 and NO2–N in all treatments are lower than those causing effects in tilapia. Even when there was not a specific bacterial biofilter in the systems, the walls can work as fixed medium for bacteria [41], and that could explain the similar NH3 and NO2–N concentrations among treatments in the p.m.
In the fish culture the comparison between the a.m. and p.m. for the same treatment shows, in the case of RAS, a significant increase of NO2–N concentration. The increase of NO2–N concentration may be a consequence of the combination of the increase in fish metabolism as a consequence of feeding and the temperature increase in the p.m., which is beneficial for the nitrification process [42]. In the case of PAK and COR, the similar NO2–N concentration between the a.m. and p.m., even with the increase of fish metabolism and temperature, may be due to the NH4+ utilization by plants [10,15] which reduce the quantity of nitrification.
In COR and RAS treatments there were higher values of NO3–N in the a.m. than in the p.m., which in the case of COR may be attributed to the plant uptake of this nutrient. In the RAS treatment the higher values of NO3–N, and also of PO43−, in the a.m. than in the p.m. suggests the utilization and/or transformation of these compounds, but with the parameters and nutrients that we measured it is not possible to determine where these compounds were utilized. It has to be noticed that except for R1 (which did not receive the solar radiation directly, because it had the tank E over it) all the components of the three treatment systems were covered from solar radiation in order to prevent algae development and because of that we expected that there was minimal algae in the system.
For the hydroponic culture in PAK and in COR the higher concentration of PO43− in the p.m. than in the a.m. show the possible nutrient accumulation or sub-utilization of this nutrient in both treatments. In this case the phosphates released from the fish as a result of their food consumption during the day were not utilized by the plants. The similar concentrations of NO3–N, NO2–N, and TAN in the p.m. and in the a.m. in the hydroponic tanks of both aquaponic treatments show the nitrogen equilibrium achieved. The higher values of PO43− in COR than in PAK in the a.m. and the p.m. show that in the PAK treatment the retention and reutilization of this compound is better than in COR; this same situation occurs for NO3–N where the p.m. concentration is higher in COR than in PAK.

5. Conclusions

The results show that from the two aquaponic treatments tested, the Nile tilapia-pak choy treatment has better performance in biomass production and in water treatment than the Nile tilapia-coriander. In the fish tanks, the lower levels of NO3–N and PO43− in the PAK and COR treatments, than in RAS, show the higher utilization and, thus, removal, of the nitrogen and phosphorus in the DRF aquaponic system than in the fish recirculation system. According to yield results, the production of pak choy in an aquaponic system using the DRF technique could be seen as viable; however, the individual weight obtained was lower than the commercial weight reported and, thus, further investigation is needed in order to increase the pak choy weight. The use of this technique could allow the reduction of investment costs in an aquaponic system.

Acknowledgments

The experimental work performed in this study was funded by “Departamento de Recursos del Mar”, CINVESTAV, Merida, Yucatan, Mexico. Experimental setup, data collection and analysis were made possible thanks to a student grant received by Laura Patricia Silva Ledezma from the Mexican “Consejo Nacional de Ciencia y Tecnología” (CONACYT) to carry out doctoral studies at CINVESTAV. The authors thank Elizabeth Real de León and Victor Ceja Moreno for their support with water analyses and to Tiburcio Castro Suaste and Pedro Tec Tec and Alan Sanchez for his support during all the stages of the experiment.

Author Contributions

Laura Silva and Edgardo Escalante contributed to the research design. Laura Silva coordinates, carried out the experiment and analyzed the literature. Edgardo Escalante carried out a detailed revision. David Valdes carried out the TAN water analysis. Eucario Gasca-Leyva supervised the research project and carried out a detailed revision. Kevin M. Fitzsimmons contributed to write the body of the paper and carried out a detailed revision. All the authors read and approved the final manuscript.

Conflicts of Interest

The authors declare no conflict of interest.

References

  1. Turcios, A.E.; Papenbrock, J. Sustainable Treatment of Aquaculture Effluents—What Can We Learn from the Past for the Future? Sustainability 2014, 6, 836–856. [Google Scholar] [CrossRef] [Green Version]
  2. Frankic, A.; Hershner, C. Sustainable aquaculture: Developing the promise of aquaculture. Aquac. Int. 2003, 11, 517–530. [Google Scholar] [CrossRef]
  3. Poot-López, G.R.; Hernández, J.M.; Gasca-Leyva, E. Input management in integrated agriculture-aquaculture systems in Yucatan: Tree spinach leaves as a dietary supplement in Tilapia culture. Agric. Syst. 2010, 103, 98–104. [Google Scholar] [CrossRef]
  4. Altieri, M.A. Agroecology: Principles and Strategies for Designing Sustainable Farming Systems; Earthscan: London, UK, 2002; pp. 40–46. [Google Scholar]
  5. Rakocy, J.E.; Masser, M.P.; Losordo, T.M. Recirculating Aquaculture Tank Production Systems: Aquaponics-Integrating Fish and Plant Culture; SRAC Publication: Stoneville, MS, USA, 2006. [Google Scholar]
  6. Lennard, W.; Leonard, B. A Comparison of Three Different Hydroponic Sub-systems (gravel bed, floating and nutrient film technique) in an Aquaponic Test System. Aquac. Int. 2006, 14, 539–550. [Google Scholar] [CrossRef]
  7. Rakocy, J.E.; Bailey, D.S.; Shultz, R.C.; Thoman, E.S. Update on Tilapia and Vegetable Production in the UVI Aquaponic System. In Proceedings of the New Dimensions on Farmed Tilapia: Sixth International Symposium on Tilapia in Aquaculture, Manila, Philippines, 12–16 September 2004; pp. 12–16.
  8. Ghaly, A.E.; Kamal, M.; Mahmoud, N.S. Phytoremediation of aquaculture wastewater for water recycling and production of fish feed. Environ. Int. 2005, 31, 1–13. [Google Scholar] [CrossRef] [PubMed]
  9. Al-Hafedh, Y.S.; Alam, A.; Beltagi, M.S. Food Production and Water Conservation in a Recirculating Aquaponic System in Saudi Arabia at Different Ratios of Fish Feed to Plants. J. World Aquac. Soc. 2008, 39, 510–520. [Google Scholar] [CrossRef]
  10. Resh, H.M. Cultivos Hidropónicos: Nuevas Técnicas de Producción; Mundi-Prensa: Madrid, Spain, 2001. [Google Scholar]
  11. Kratky, B. Three non-circulating hydroponic methods for growing lettuce. In Proceedings of the International Symposium on Soilless Culture and Hydroponics, Lima, Peru, 25–28 August 2008; Volume 843, pp. 65–72.
  12. Kao, T.-C.; Hsiang, T.; Changhua, R. The Dynamic Root Floating Hydroponic Technique: Year-Round Production of Vegetables in Roc on Taiwan; ASPAC Food & Fertilizer Technology Center: Taipei, Taiwan, 1991. [Google Scholar]
  13. Council of Agriculture, Executive Yuan, Republic of China. Dynamic Root Floating System for Leafy Vegetable Production. Available online: http://flora.coa.gov.tw/view_eng.php?id=244 (accessed on 15 July 2015).
  14. Ako, H. How to Build and Operate a Simple Small-to-Large Scale Aquaponics System; College of Tropical Agriculture and Human Resources (CTAHR) University of Hawaii: Honolulu, HI, USA, 2014. [Google Scholar]
  15. Remy, M.; Singh, B.K.; Taylor-Rieger, R. Evaluación de dos Técnicas Hidropónicas Adaptadas Para las Condiciones del Trópico Húmedo. Tierra Trop. 2005, 2, 29–35. [Google Scholar]
  16. Hazeri, N.; Valizadeh, J.; Shakeri, A.; Rajabpour, M. Evaluation of Essential Oil and Mineral Composition of Coriander (Coriandrum sativum L.) among Growth Conditions of Hydroponic, Field and Greenhouse. J. Essent. Oil Bear. Plants 2012, 15, 949–954. [Google Scholar] [CrossRef]
  17. Solano, K.D.G.; Mendoza, M.D.; Trejo-Téllez, L.I.; Cue, J.L.G.; Escudero, J.S. Efluente y té de vermicompost en la producción de hortalizas de hoja en sistema NFT. Interciencia 2013, 38, 863–869. [Google Scholar]
  18. Sánchez del Castillo, F.E.R.; Edgardo, R. Un Sistema de Producción de Plantas, Hidroponia: Principios y Métodos de Cultivo; Universidad Autónoma Chapingo: Chapingo, Mexico, 2006. [Google Scholar]
  19. USDA National Nutrient Database for Standard Reference, Release 27, Full Report (All Nutrients): 11116, Cabbage, Chinese (pak-choi), Raw. Available online: http://ndb.nal.usda.gov/ndb/foods/show/2931?fg=&man=&lfacet=&count=&max=35&sort=&qlookup=pak+choi&offset=&format=Full&new=&measureby= (accessed on 4 September 2015).
  20. Emerson, K.; Russo, R.C.; Lund, R.E.; Thurston, R.V. Aqueous Ammonia Equilibrium Calculations: Effect of pH and Temperature. J. Fish. Res. Board Can. 1975, 32, 2379–2383. [Google Scholar] [CrossRef]
  21. El-Shafai, S.A.; El-Gohary, F.A.; Nasr, F.A.; van der Steen, N.P.; Gijzen, H.J. Chronic ammonia toxicity to duckweed-fed tilapia (Oreochromis niloticus). Aquaculture 2004, 232, 117–127. [Google Scholar] [CrossRef]
  22. El-Sherif, M.; El-Feky, A.M. Effect of ammonia on Nile tilapia (O. niloticus) performance and some hematological and histological measures. In Proceedings of the 8th International Symposium on Tilapia in Aquaculture, Cairo, Egypt, 12–14 October 2008; pp. 513–530.
  23. Yildiz, H.Y.; Köksal, G.; Borazan, G.; Benli, Ç.K. Nitrite-induced methemoglobinemia in Nile tilapia, Oreochromis niloticus. J. Appl. Ichthyol. 2006, 22, 427–426. [Google Scholar] [CrossRef]
  24. Espinosa Moya, E.A.; Angel Sahagún, C.A.; Mendoza Carrillo, J.M.; Albertos Alpuche, P.J.; Álvarez-González, C.A.; Martínez-Yáñez, R. Herbaceous plants as part of biological filter for aquaponics system. Aquac. Res. 2014. [Google Scholar] [CrossRef]
  25. Hu, S.-Y. Food Plants of China; Chinese University Press: Hong Kong, China, 2005. [Google Scholar]
  26. Ronzio, R.A. The Encyclopedia of Nutrition and Good Health; Infobase Publishing: New York, NY, USA, 2003. [Google Scholar]
  27. FAO Ecocrop Database. Available online: http://ecocrop.fao.org/ecocrop/srv/en/cropView?id=547 (accessed on 17 July 2015).
  28. Kotzen, B.; Appelbaum, S. An Investigation of Aquaponics Using Brackish Water Resources in the Negev Desert. J. Appl. Aquac. 2010, 22, 297–320. [Google Scholar] [CrossRef]
  29. Garibaldi, A.; Gilardi, G.; Gullino, M.L. First Report of Collar and Root Rot Caused by Pythium ultimum on Coriander in Italy. Plant Dis. 2010, 94, 1167. [Google Scholar] [CrossRef]
  30. Madia, M.; Gaetan, S. Podredumbre basal y radicular del Coriandro causada por Rhizoctonia solani Khun. Bol. Sanid. Veg. Plagas (España) 1995, 21, 573–576. [Google Scholar]
  31. Endut, A.; Jusoh, A.; Ali, N.; Wan Nik, W.N.S.; Hassan, A. Effect of flow rate on water quality parameters and plant growth of water spinach (Ipomoea aquatica) in an aquaponic recirculating system. Desalination Water Treat. 2009, 5, 19–28. [Google Scholar] [CrossRef]
  32. Endut, A.; Jusoh, A.; Ali, N.; Wan Nik, W.B.; Hassan, A. A study on the optimal hydraulic loading rate and plant ratios in recirculation aquaponic system. Bioresour. Technol. 2010, 101, 1511–1517. [Google Scholar] [CrossRef] [PubMed]
  33. Hu, Z.; Lee, J.W.; Chandran, K.; Kim, S.; Brotto, A.C.; Khanal, S.K. Effect of plant species on nitrogen recovery in aquaponics. Bioresour. Technol. 2015, 188, 92–98. [Google Scholar] [CrossRef] [PubMed]
  34. Hernández, M.; Gasca-Leyva, E.; Milstein, A. Polyculture of mixed-sex and male populations of Nile tilapia (Oreochromis niloticus) with the Mayan cichlid (Cichlasoma urophthalmus). Aquaculture 2014, 418–419, 26–31. [Google Scholar] [CrossRef]
  35. Roosta, H.R.; Mohsenian, Y. Effects of foliar spray of different Fe sources on pepper (Capsicum annum L.) plants in aquaponic system. Sci. Hortic. 2012, 146, 182–191. [Google Scholar] [CrossRef]
  36. Roosta, H.R.; Mohsenian, Y. Alleviation of Alkalinity-Induced Fe Deficiency in Eggplant (Solanum melongena L.) by Foliar Application of Different Fe Sources in Recirculating System. J. Plant Nutr. 2015, 38, 1768–1786. [Google Scholar] [CrossRef]
  37. Wanitprapha, K.; Huggins, C.A.; Nakamoto, S.T.; Won, B.; Pak, C. Economic Fact Sheet #18. Available online: http://www.ctahr.hawaii.edu/sustainag/extn_pub/veggie%20pubs/Oriental%20Vegetables/Won%20Bok%20and%20Pak%20Choi.pdf (accessed on 17 November 2015).
  38. Wong, J.W.C.; Li, G.X.; Wong, M.H. The growth of Brassica chinensis in heavy-metal-contaminated sewage sludge compost from Hong Kong. Bioresour. Technol. 1996, 58, 309–313. [Google Scholar] [CrossRef]
  39. Žutić, I.; Borošić, J.; Toth, N.; Novak, B.; Dobričević, N. Agronomic and Dietary Value of Pak Choy (Brassica rapa SSP. Chinensis) in Different Growing Periods. Acta Hortic. 2007, 729, 239–243. [Google Scholar] [CrossRef]
  40. El-Sayed, A.-F.M. Tilapia Culture; CABI: Wallingford, UK, 2006. [Google Scholar]
  41. Rakocy, J.E. Aquaponics: Vegetable hydroponics in recirculating systems. In Recirculating Aquaculture Systems, 2nd ed.; Timmons, M.B., Ebeling, J.M., Wheaton, F.W., Summerfelt, S.T., Vinci, B.J., Eds.; Northeast Regional Aquaculture Center: College Park, MD, USA, 2002; pp. 631–672. [Google Scholar]
  42. Antoniou, P.; Hamilton, J.; Koopman, B.; Jain, R.; Holloway, B.; Lyberatos, G.; Svoronos, S.A. Effect of temperature and ph on the effective maximum specific growth rate of nitrifying bacteria. Water Res. 1990, 24, 97–101. [Google Scholar] [CrossRef]

